Article

Cost-Effective Planning of Hybrid Energy Systems Using Improved Horse Herd Optimizer and Cloud Theory under Uncertainty

Department of Electrical Engineering, College of Engineering, Majmaah University, Al-Majmaah 11952, Saudi Arabia
Electronics 2024, 13(13), 2471; https://doi.org/10.3390/electronics13132471
Submission received: 12 May 2024 / Revised: 4 June 2024 / Accepted: 14 June 2024 / Published: 24 June 2024

Abstract

In this paper, an intelligent stochastic model is recommended for the optimization of a hybrid system that encompasses wind energy sources, battery storage, combined heat and power generation, and thermal energy storage (Wind/Battery/CHP/TES), with the inclusion of electric and thermal storages through the cloud theory model. The framework aims to minimize the costs of planning, such as construction, maintenance, operation, and environmental pollution costs, to determine the best configuration of the resources and storage units to ensure efficient electricity and heat supply simultaneously. A novel meta-heuristic optimization algorithm named improved horse herd optimizer (IHHO) is applied to find the decision variables. Rosenbrock’s direct rotational technique is applied to the conventional horse herd optimizer (HHO) to improve the algorithm’s performance against premature convergence in the optimization due to the complexity of the problem, and its capability is evaluated with particle swarm optimization (PSO) and manta ray foraging optimization (MRFO) methods. Also, the cloud theory-based stochastic model is recommended for solving problems with uncertainties of system generation and demand. The obtained results are evaluated in three simulation scenarios including (1) Wind/Battery, (2) Wind/Battery/CHP, and (3) Wind/Battery/CHP/TES systems to implement the proposed methodology and evaluate its effectiveness. The results show that scenario 3 is the best configuration to meet electrical and thermal loads, with the lowest planning cost (12.98% less than scenario 1). Also, the superiority of the IHHO is proven with more accurate answers and higher convergence rates in contrast to the conventional HHO, PSO, and MRFO. Moreover, the results show that when considering the cloud theory-based stochastic model, the costs of annual planning are increased for scenarios 1 to 3 by 4.00%, 4.20%, and 3.96%, respectively, compared to the deterministic model.

1. Introduction

In remote regions with limited power grid connectivity, self-sustaining energy systems are crucial for meeting energy demands [1]. These areas often have diverse energy needs, requiring the integration of multiple energy sources and storage solutions [2,3]. Renewable energy sources (RESs) like wind turbines and photovoltaic panels are preferred due to their economic viability and minimal environmental footprint [4]. Combined heat and power (CHP) systems are also suitable for areas with varied energy consumption needs [5,6]. However, the variability in daily power output may not perfectly match the fluctuating energy demand, necessitating the use of storage solutions [7,8]. A well-structured and sustainable hybrid energy system requires meticulous long-term planning to determine the optimal quantity and size of resources and storage devices [9,10]. Acknowledging uncertainties, particularly in load and RES output predictions, is essential for fostering reliable planning and operational resilience [11,12].
The input discusses various studies and approaches that have been undertaken to optimize and plan stand-alone energy systems that integrate different energy sources and storage solutions [13,14,15,16,17,18,19,20,21,22,23,24,25,26,27,28,29,30,31]. These studies utilize different optimization algorithms such as artificial bee colony [13], harmony search [15], elephant herd optimization [18], water wave optimization [21], and particle swarm optimization (PSO) [23], among others. The goal of these studies is to minimize operating costs [14,18,21,26], improve voltage conditions [14], reduce load loss and emissions [18,19], and ensure system reliability [24,28,31]. Some studies focus on specific components of hybrid energy systems, such as photovoltaic (PV) panels, wind turbines, batteries, and electric vehicles, while others consider the overall system design and operation. They also consider uncertain parameters [14,25,26,29] and demand response [21,25] in their optimization models [25,26]. To address uncertainty, different methods are employed, including Monte Carlo Simulation (MCS), analytical approaches, and approximate approaches [32,33]. MCS is widely used due to its accuracy, but it can be computationally demanding. Analytical and approximate approaches offer simplified models with lower computational costs. The point estimate method (PEM) is a prominent technique in this group. The input suggests a new framework that integrates cloud model (CM) theory for more efficient modeling of uncertainties in hybrid energy systems [34,35]. The CM approach combines randomness and fuzziness to represent uncertainty comprehensively. It can handle incomplete or ambiguous information and manage uncertainties arising from imperfect data or vague knowledge. The CM approach provides more accurate and realistic modeling of uncertain phenomena and yields intuitive and interpretable results [34]. It is also computationally efficient, making it suitable for real-time or iterative applications [35]. Overall, these studies and approaches contribute to the optimization and planning of stand-alone energy systems by considering different energy sources, storage solutions, and uncertain parameters. They aim to minimize costs, improve system performance, and ensure reliability while taking into account the complexities and uncertainties inherent in these systems.
The research reveals several defects in the planning and optimization of hybrid systems. Many prior studies neglect thermal load considerations in favor of optimizing energy resources and storage for supplying electrical energy. Although CHP systems have garnered interest for boosting power generation efficiency, they have received scant attention in hybrid energy system planning research. Additionally, there is a deficiency in incorporating uncertainty modeling into hybrid systems optimization and planning. Deterministic planning may prove insufficient in mitigating uncertainty-induced fluctuations. In conclusion, existing studies indicate that addressing optimization problems with a single algorithm is not feasible, underscoring the necessity for innovative algorithms guided by the “no free lunch” theory.
A strategy for optimizing and planning a hybrid energy system (Wind/Battery/CHP/TES) that combines wind energy sources, battery storage, CHP generation, and thermal storage is presented in this paper. Minimizing planning expenses, including investment, operation, maintenance, and emissions, is the objective. In order to fulfill electrical load requirements, wind turbines are employed, whereas combined heat and power systems provide thermal loads. To compensate for differences between electrical and thermal load demands, batteries and thermal energy storage (TES) are utilized. To address uncertainties, a stochastic framework based on cloud model theory is proposed. By utilizing the improved horse herd optimizer (IHHO), premature convergence issues that plague conventional HHO [36] are circumvented when determining decision variables. The direct rotational (RDR) method [37] of Rosenbrock is utilized to reduce the complexity of problems.
The remaining portion of this research is structured as follows: The research methodology is explained in Section 2, which includes a description of the hybrid system, component modeling, problem formulation, and cloud theory. In Section 3, the proposed improved optimizer and its application for problem solving are introduced. Section 4 presents the simulation results. Finally, Section 5 concludes the paper.

2. Research Methodology

2.1. Overview of the Research Approach

This research aims to optimize the sizes and operations of a hybrid energy system comprising wind turbines, CHP units, electric battery storage, and TES. The methodology involves system description, detailed component modeling, problem formulation, and stochastic modeling using cloud theory to address uncertainties.

2.2. System Description

The proposed hybrid energy system, illustrated in Figure 1, includes the following:
  • WT: Provides renewable electricity.
  • CHP: Generates both electricity and thermal energy, prioritizing thermal load due to cost-effectiveness and low emissions.
  • Electric battery storage: Balances electricity supply and demand.
  • TES: Manages surplus and deficit in thermal energy from CHP.
  • Inverter: Utilized with the battery system to facilitate the connection of batteries to the AC bus, enabling efficient energy storage and discharge.
In the AC bus, the wind turbine, CHP, and battery are employed to supply power. For the thermal load, CHP and TES provide the necessary energy. Priority is given to CHP and wind turbines in supplying electric load due to their low costs of emissions and operation. CHP is particularly emphasized in meeting thermal load requirements. Within this system, CHP concurrently generates thermal and active power. The battery serves to bridge the gap between electric demand requirements daily and the power produced by CHP and the wind turbine. The operational framework of the hybrid Wind/Battery/CHP/TES energy system is outlined as follows: CHP takes precedence in supplying the heat load, followed by the utilization of TES to match the heat demand and the CHP heat power. In cases where the CHP thermal power exceeds (falls short of) the thermal demand, TES functions as a charging (discharging) state. CHP and wind units are the original resources for the electrical demand supply, while the batteries serve to bridge any disparities within the daily electrical demand and the combined CHP and WT power. If the overall production of these units exceeds (falls short of) the electrical demand, the batteries function in a charge (discharge) state.

2.3. Component Models

Each component is modeled here to capture its behavior and interaction within the hybrid system.

2.3.1. WT Model

The overall active power generated by wind turbines during time τ for scenario ω varies according to different wind speed categories, as specified by [15,29].
P W T ( τ , ω ) = 0 v ( τ , ω ) v c i   &   v ( τ , ω ) v c o n W T p r v ( τ , ω ) v c i v r v c i v c u t i n   v ( τ , ω ) v r n W T p r v r   v ( τ , ω ) v c o
n W T 1 , 2 , , n ¯ W T
where pr denotes the nominal power of each wind unit, while vci, vco and vr indicate the cut-in, cut-out, and rated wind speeds, respectively. nWT denotes the total number of wind units, while n ¯ W T refers to the upper allowable number of wind turbines within the hybrid system.

2.3.2. CHP Model

In this research, CHP is given precedence in meeting the heat load requirement [38,39]. However, to minimize operational expenses and environmental impact, thermal energy storage (TES) [2,40] is integrated with CHP. Thus, the CHP power (PC) at time τ and scenario ω is determined as a decision variable, guided by the problem target and constraints. The allowable limit of PC change is calculated by
P C ( τ , ω ) 0             P C max
where P C max is the maximum limit of the CHP output power.
The CHP thermal power (HC) is computed as follows [38,39]:
H C ( τ , ω ) = 1 η T η L · η H η T × P C ( τ , ω )
where ηT, ηL, and ηH are the wind unit, loss, and heating part efficiencies, respectively.
The allowable change in the HC is as follows:
H C ( τ , ω ) 0             1 η T η L · η H η T × P C max
The annual cost of CHP is calculated by
F C C = 365 × C F × τ = 1 24 ω = 1 n ω π ( ω ) × f p C × χ C P C max + γ C P C ( τ , ω )
where fpc is the cost of CHP fuel consumption, χC and γC are the CHP fuel consumption coefficients, π is the scenario occurrence probability, and nω is the scenario number. CF indicates the coincidence factor.
The CHP emission annual cost is defined as follows:
E C C = 365 × C F × τ = 1 24 ω = 1 n ω π ( ω ) × e p C × β C P C ( τ , ω )
where epC is the penalty price of the emissions. The coefficient βC is the total of the coefficients of NOx, CO2, and SO2 emissions [39,40].
Finally, the size limit of the CHP is calculated by
P C max 0         P ¯ C
where P ¯ C is the upper installable capacity of the CHP.

2.3.3. TES Model

If the CHP thermal energy generated during time τ and for scenario ω exceeds the thermal demand (HL), then the thermal energy storages (TESs) will function in charge mode. The saved TES (ET) energy at time τ for scenario ω can be determined by [2,40]
E T ( τ , ω ) = 1 × E T ( τ 1 , ω ) + η T c × H C ( τ , ω ) H L ( τ , ω )             H C ( τ , ω ) >   H L ( τ , ω )
where η T c denotes the TES charging efficiency, and is the hourly rate of discharge [18].
When there is no heat output from the CHP to match the heat load, the TESs discharge their stored energy. In such instances, the calculation for the energy saved in ET at time τ is as follows:
E T ( τ , ω ) = 1 × E T ( τ 1 , ω ) 1 η T d × H L ( τ , ω ) H C ( τ , ω )             H C ( τ , ω ) <   H L ( τ , ω )
where η T d refers to the efficiency of TES discharge.
The restriction on the stored energy capacity in TESs is specified as follows:
E T ( τ , ω ) n T E ¯ T         n T E ¯ T
where E ¯ T and E ¯ T are the lower and upper energy storage capacities in TESs, respectively. nT denotes the upper number of TESs allowed for installation and is determined by
n T 1 , 2 , , n ¯ T
where n ¯ T is the upper value of the TES number within the hybrid system.

2.3.4. Battery Model

If the combined CHP and WT power during time τ for scenario ω exceeds the electrical demand (PL), the excess active power output is saved in batteries [29,30]. Thus, the calculation for the energy saved in the battery (EB) at hour τ is as follows:
E B ( τ , ω ) = 1 × E B ( τ 1 , ω ) + η B c × η I P C ( τ , ω ) + P W T ( τ , ω ) P L ( τ , ω )   P C ( τ , ω ) + P W T ( τ , ω ) >   P L ( τ , ω )
In cases where the electrical load surpasses the CHP and wind unit total, batteries provide a deficit in active power requirements. Hence, the computation for EB is as follows:
E B ( τ , ω ) = 1 × E B ( τ 1 , ω ) 1 η B d × η I P L ( τ , ω ) P C ( τ , ω ) P W T ( τ , ω )   P C ( τ , ω ) + P W T ( τ , ω ) <   P L ( τ , ω )
where η B c and η B d denote the charge and discharge battery efficiency and ηI denotes the inverter efficiency.
The boundary for the energy value that can be saved in the battery bank is outlined as follows:
E B ( τ , ω ) n B E ¯ B         n B E ¯ B
where E ¯ B and E ¯ B are the greatest and lowest saved energy values in the battery, respectively.
The battery number within the hybrid system (nB) is subject to the following restriction:
n B 1 , 2 , , n ¯ B
where n ¯ B is the maximum number of batteries placed in the hybrid system.

2.3.5. Inverter Model

In the hybrid system under examination, the inverter facilitates the connection of batteries to the AC bus. Considering that the greatest active load flow through the inverter is P ¯ I [30], the number of inverters placed in the system to accommodate the batteries’ maximum load flow is computed by
n I = [ max ( P B ) P ¯ I ] + 1         P B ( τ , ω ) = E B ( τ , ω ) E B ( τ 1 , ω )
where PB is the batteries’ active power.

2.4. Problem Formulation

The optimization of the hybrid system is performed to optimize the energy units and storage size to facilitate electricity and heat provision simultaneously.

Objective Function

The objective function for optimizing the hybrid system aims to minimize planning expenses, encompassing the annual installation cost (AIC), annual maintenance cost (AMC), annual operating cost (AOC), and annual emission cost (AEC).
min         C o s t = A I C + A M C + A O C + A E C A I C = W T n W T + B n B + I n I + T n T + C P C max A M C = ϖ W T n W T + ϖ B n B + ϖ I n I + ϖ T n T + ϖ C P C max A O C = F C C A E C = E C C
where W T , B , I , T and C are the AIC (USD/year) of wind turbine, battery, TES, and CHP, respectively, and ϖ W T , ϖ B , ϖ I , ϖ T , and ϖ C are AMC (USD/kW/year) of the wind turbine, battery, TES, and CHP, respectively. The nWT, nB, nI, nT, P C max , FCC, and ECC are the number of wind turbines, batteries, inverters, and TESs, the capacity of CHP, AOC (USD/year), and AEC (USD/year) of the hybrid system, respectively. In the hybrid system, only CHP has an AOC and AEC.
The AIC of each component (ϑ) is determined by multiplying its overall size cost by the factor of capacity recovery for resources, storage, and inverter [15], which is presented by
ϑ = κ ( 1 + κ ) n ( 1 + κ ) n 1 × α
where α, κ, and n are the overall capacity cost, interest rate, and life span of the device, respectively.

2.5. Stochastic Modeling with Cloud Theory

In the stochastic problem, the uncertainties surrounding the electrical and thermal demands, as well as wind speed, are taken into account. Consequently, it is recommended to employ a cloud theory-based stochastic model to address the optimization problem under these uncertainties. Cloud theory, rooted in the concept of fuzzy drops, offers a distinctive approach by representing potential values for an uncertain parameter within a specific range. Unlike other methods limited to the uncertainty of the initial event, this fuzzy-based approach adeptly handles uncertainties associated with both the first and second moments in the Probability Density Function (PDF). The cloud model (CM) theory, an innovative fusion of fuzzy logic and statistical probability, revolutionizes conventional expressions and conceptual delineations. By leveraging membership functions, this framework facilitates the assessment of uncertain measures linked with ambiguous concepts, departing from traditional fuzzy logic paradigms. Consequently, cloud theory adeptly captures the inherent vagueness and stochastic nature prevalent in both the tangible universe and individual cognition, along with their intricate interdependencies.
To elucidate the fundamental tenet of this theory, let L symbolize the linguistic domain quantity u. The formulation for CL mapping is outlined as follows [29,34,35]:
C L x : u 0,1 , x u ,   x C L x
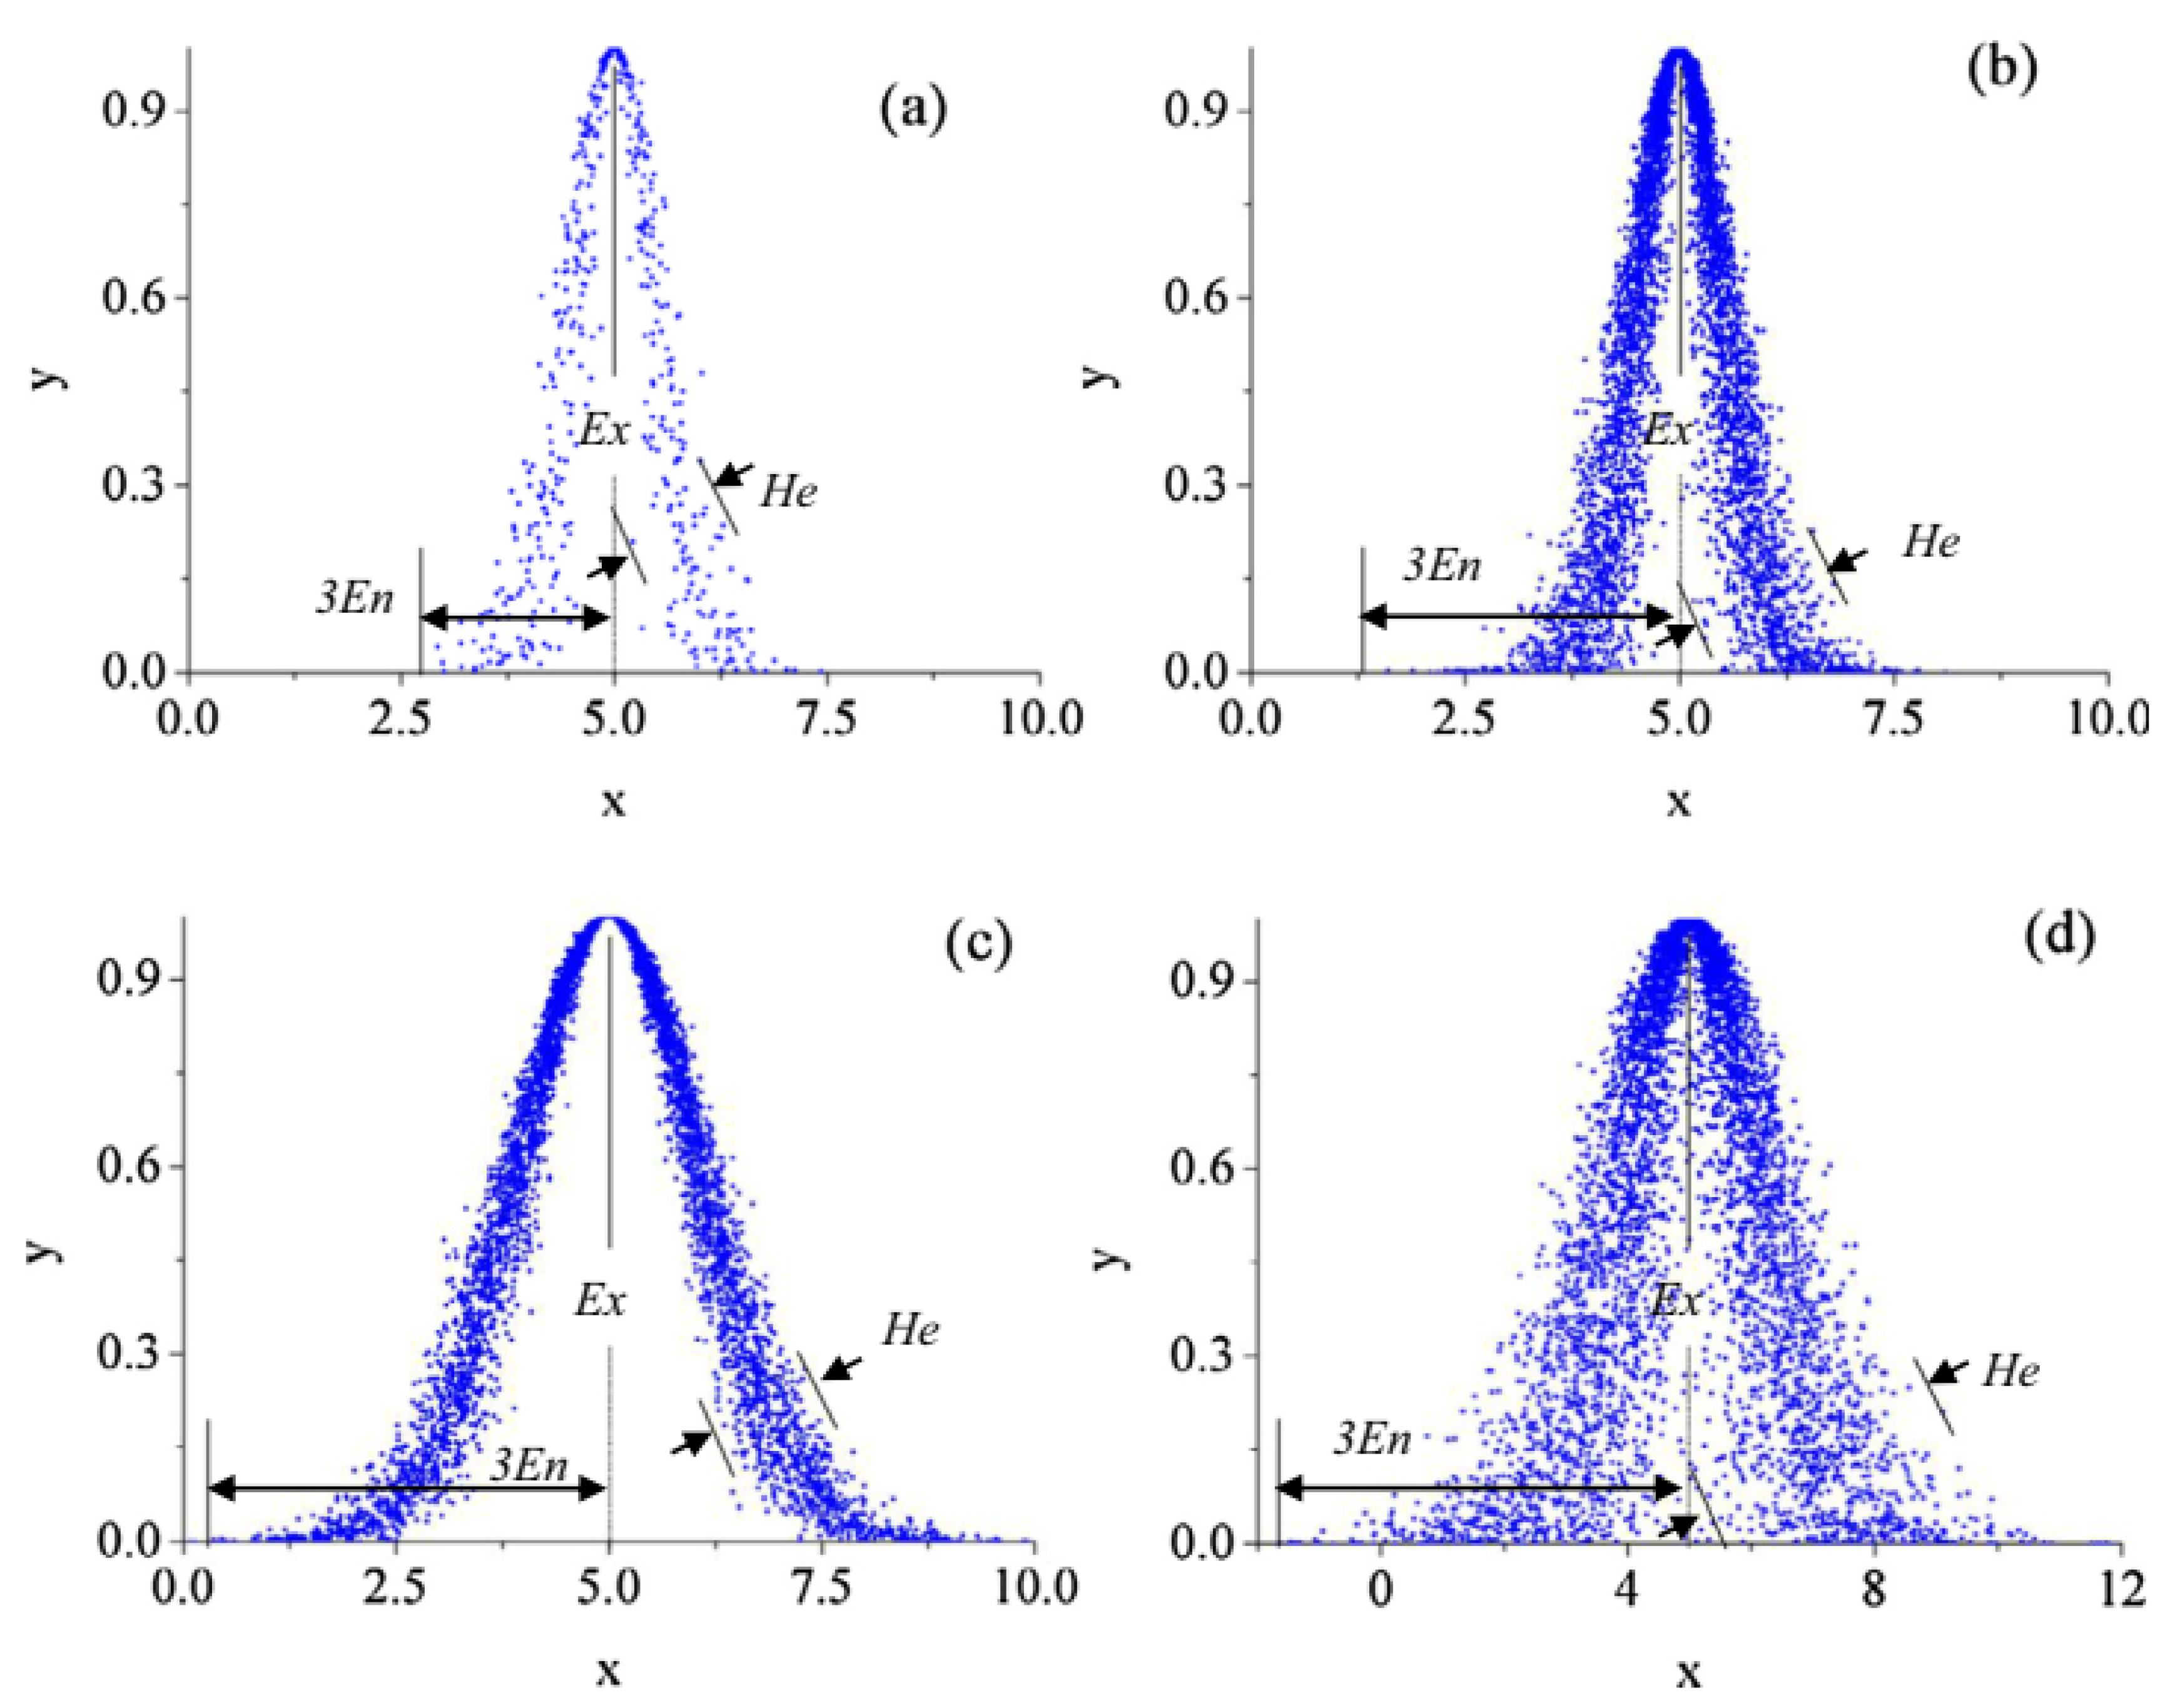
The CL(x) within u denotes the L membership, serving as a standard CM when it conforms to a typical distribution pattern. The definition of each cloud relies on three essential parameters: (a) the anticipatory parameter Ex, (b) the entropy parameter En, and (c) the hyper-parameter. In Figure 2, a standard cloud model is depicted. According to this illustration, Ex signifies the cloud value’s average, while En represents the range of variability and disperses the cloud particles. He emerges as a crucial parameter that extends the utility of cloud theory beyond that of MCS. As previously mentioned, He characterizes the variability in cloud membership degrees, essentially mirroring the entropy En. It is noteworthy that hyper-entropy (He) generally adheres to a normal distribution pattern [29,34,35].

2.5.1. Production of the Normal CM

To utilize cloud theory in modeling uncertain parameters in problems, it is crucial to construct a stochastic CM for variables. This process involves three pivotal parameters essential for capturing the cloud’s characteristics: (a) the parameter of expectation Ex, which denotes the cloud average; (b) the parameter of entropy En, which indicates the dispersion of droplets within the cloud; and (c) the parameter of hyper-entropy He, representing the uncertainty in entropy due to randomness and fuzzy entropy. To effectively develop a cloud model, one must determine these three parameters—Ex, En, and He—for each random variable xi. Cloud droplets (xi, ui) are formed through a series of steps based on the droplet count within the cloud. With N droplets of (xi, ui), one can calculate the three distinct values Ex, En, and He. This paper emphasizes the computation and establishment of the primary cloud model, considering two frameworks: the normal distribution model, which is vital for uncertainty modeling related to the load, and the Weibull distribution model for wind speed. The primary phases involved in cloud production are as follows:
  • Phase (1): Data input: The Ex value is obtained from forecast data and signifies the mean, while En represents the standard deviation value. The He entropy indicates the rate of spread, and N refers to the droplet count.
  • Phase (2): Generate a random En value that follows a normal distribution, utilizing En and He.
  • Phase (3): Produce a random xi within a distribution normally based on Ex and En.
  • Phase (4): Determine the μ i membership degree using the following equation:
    μ i = e x p ( x i E x ) 2 2 ( E n ) 2
  • Phase (5): Calculate xi and ui for all instances in N. To convert a small quantity into a qualitative evaluation, the regression cloud model suitable for normal distribution is utilized in the following stages.
  • Stage (1): Establish the mean and variance of xi as described below:
    X ¯ = 1 N i = 1 N x i ,         S 2 = 1 N 1 i = 1 N x i X ¯ 2
  • Stage (2):
    E x = X ¯
  • Stage (3):
    E n = π 2 × 1 N i = 1 N x i E x
  • Stage (4):
    H e = S 2 E n 2

2.5.2. Weibull Distribution-Based CM

The Weibull distribution is frequently applied to simulate the variability in wind turbine output. Consequently, this research incorporates this distribution into the cloud theory to demonstrate the unpredictability of wind turbine power. The process for constructing a cloud theory using the Weibull distribution is outlined as follows:
  • Input data
The Weibull function requires input data, including the parameter of shape β, the secondary shape parameter γ, the parameter of scale η, and the droplet number N.
  • Produce Weibull-distributed values
Generate random values distributed according to the Weibull distribution using the shape parameters β and γ. Then, generate random numbers distributed according to the Weibull distribution with xi, utilizing the parameters β and γ.
  • Certainty level calculation
Calculate the level of certainty in the following manner [29,34,35]:
μ x = β β 1 × β 1 β 1 β × x η β + 1 e x p β 1 β x η β
Finally, produce Weibull-distributed values and calculate the level of certainty for every N droplets.

3. Proposed Meta-Heuristic Optimizer

In this research, an enhanced version of the horse herd optimizer (IHHO) is employed to tackle the intelligent stochastic optimization of the hybrid Wind/Battery/CHP/TES energy system. This section outlines the formulation of IHHO and its application in addressing the problem.

3.1. Overview of the HHO

The framework of horse herd optimization (HHO) is inspired by the daily activities of horses. It incorporates a range of behaviors observed in horses at different stages of life, such as grazing (G), hierarchy (H), sociability (S), imitation (I), defense structure (D), and roaming (R) [36].
The description of how horses move in each cycle is outlined in [36].
X m I t e r , A G E = V m I t e r , A G E + X m ( I t e r 1 ) , A G E , A G E = α , β , γ , δ
In this equation, X m I t e r , A G E represents the horse’s location m at iteration Iter, X m ( I t e r 1 ) , A G E denotes the horse’s location m at iteration Iter − 1, AGE signifies the age range of the horse, and Iter represents the present iteration. Additionally, V m I t e r , A G E represents the horse speed vector. The age ranges are categorized as follows: δ for horses aged between 0 and 5 years, γ for those aged between 5 and 10 years, β for horses aged between 10 and 15 years, and α for horses older than 15 years. Within the response matrix used in HHO, the first 10% corresponds to horses categorized as α , the next 20% corresponds to β , and the remaining 70% is divided between γ and δ [36].
The vector representing the horses’ movement across several age groups during every algorithm iteration is described in detail by [36]
V m I t e r , α = G m I t e r , α + D m I t e r , α
V m I t e r , β = G m I t e r , β + H m I t e r , β + S m I t e r , β + D m I t e r , β
V m I t e r , γ = G m I t e r , γ + H m I t e r , γ + S m I t e r , γ + I m I t e r , γ + D m I t e r , γ + R m I t e r , γ
V m I t e r , δ = G m I t e r , δ + I m I t e r , δ + R m I t e r , δ
Below, detailed descriptions of lifelong behavioral patterns demonstrated by horses are provided.
Grazing (G): By employing a factor denoted as g, the grazing area surrounding each horse is simulated. Horses are allowed to graze continuously throughout their life spans. The definition of equine grazing behavior is presented below [36]:
G m I t e r , A G E = g I t e r u ˘ + p l ˘ X m ( I t e r 1 ) , A G E = α , β , γ , δ
g m I t e r , A G E = g m ( I t e r 1 ) , A G E × w g
where the moving parameter of horse i is represented by G m I t e r , A G E , which decreases with each iteration corresponding to ωg in a linear manner. l ˘ and u   ˘ denote the lowest and greatest limits of the grazing area, respectively, ranging between 0.95 and 1.05. p represents a number between 0 and 1, and g is set to 1.5 for all horses, irrespective of their age [36].
Hierarchy (H): The horses are predominantly overseen by a leader who directs human activities. Furthermore, both male and female horses can lead a herd of wild horses. The horses’ herd inclination for following the strongest and most knowledgeable leader is represented by the coefficient h. The depiction of this sequential behavior is outlined as follows [36]:
H m I t e r , A G E = h m I t e r , A G E X ( I t e r 1 ) X m ( I t e r 1 ) , A G E = α ,   β ,   γ
h m I t e r , A G E = h m ( I t e r 1 ) , A G E × w h
where H m I t e r , A G E represents the influence of the best horse position in terms of speed, and X ( I t e r 1 ) indicates the optimal horse position.
Sociability (S): Horses maintain a social environment to secure their survival and welfare. Their social behavior is indicated by the parameter s, which is evident in their inclination to approach the positions of other horses. Most horses, categorized as β and γ , prioritize herd life, as explained below [36].
S m I t e r , A G E = s m I t e r , A G E 1 N j = 1 N X j ( I t e r 1 ) X m ( I t e r 1 ) , A G E = β ,   γ
s m I t e r , A G E = s m ( I t e r 1 ) , A G E × w s
where S m I t e r , A G E represents the movement vector of horse i, while S m I t e r , A G E denotes the movement direction of horse i concerning the livestock during the iteration. Taking into account the coefficient ωs, the value of S m I t e r , A G E diminishes with each iteration. AGE signifies the age of each horse, and N represents the total number of horses.
Imitation: The illustration in Figure 3 depicts the imitation behavior of horses, where they mimic each other’s actions such as locating appropriate grazing land. The degree of imitation among horses is assessed by a factor denoted as i. This habit is more pronounced in younger horses [36].
I m I t e r , A G E = i m I t e r , A G E 1 p N j = 1 p N X ^ j ( I t e r 1 ) X m ( I t e r 1 ) , A G E = γ
i m I t e r , A G E = i m ( I t e r 1 ) , A G E × w i
where I m I t e r , A G E is the movement of the horse i vector with respect to a horse at positions x ^ , and pN represents the percentage of horses that achieved the highest positions.
Defense mechanism (D): The horses display protective actions, which involve fleeing from threats and yielding, considered as less effective responses. These protective actions are characterized by the factor d. In the following model, the horses’ defensive conduct is indicated by a negative factor, aiming to discourage them from unfavorable outcomes [36].
D m I t e r , A G E = d m I t e r , A G E 1 q N j = 1 q N X ^ j ( I t e r 1 ) X m ( I t e r 1 ) , A G E = α , β , γ
d m I t e r , A G E = d m ( I t e r 1 ) , A G E × w d
where w d represents the reduction rate per iteration, qN is the count of horses with the least favorable positions, and D m I t e r , A G E denotes the vector of horse i escape.
Roaming: In their natural habitat, horses roam and shift between grasslands and pastures in search of food. The coefficient r defines the erratic movements associated with this wandering behavior, which is more common among young horses and tends to diminish as they grow older. The definition of the roaming habit is delineated by
R m I t e r , A G E = r m I t e r , A G E p X m ( I t e r 1 ) , A G E = γ , δ
r m I t e r , A G E = r m ( I t e r 1 ) , A G E × w r
where R m I t e r , A G E denotes the speed vector of horse i utilized for random escape from local minima, while ωr indicates the decrease in a constant per iteration.
The pseudocode for HHO is depicted in Algorithm 1.
Algorithm 1: Horse Herd Optimization
(a) Fundamental framework: Setting up the algorithm’s parameters and variables.
(b) Initial placement: Randomly dispersing horses across the search space.
(c) Evaluating fitness: Assessing the fitness level of each horse based on its location.
(d) Age determination: Calculating the age of each horse (α, β, γ, δ).
(e) Velocity adjustment: Adjusting the velocity of each horse relative to its age.
(f) Updating positions: Modifying the search space to accommodate the new positions of each horse.
(g) Convergence check: Returning to step c until the algorithm terminates and the convergence criterion is met.

3.2. Overview of the IHHO

The existing body of research indicates that conventional algorithms encounter difficulties when seeking optimal solutions in complex problem scenarios or when dealing with combined approaches, often becoming trapped in local optima. To mitigate these challenges, specific integration techniques have been proposed as a partial remedy. In this study, the RDR is employed to address premature convergence issues encountered by the traditional HHO. The HHO is prone to becoming ensnared in local minima and prematurely converging due to the complexity of the problem and the combined structures involved. To enhance the traditional HHO’s performance in the face of these challenges, the RDR [37] is applied, resulting in the development of the improved HHO (IHHO). In this approach, the RDR local search technique’s starting search direction serves as the coordinate axes, which rotate in these directions prior to transitioning to a fresh starting place where productive actions are produced.
This procedure keeps going until, in any search orientation, preferably one effective phase and one failure step are found. The present phase ends at this point, and the recognition foundation is looked at to determine the total effect of every stage that was effective in all dimensions [37]. The subsequent protocol is used to update the orthonormal foundation:
x k + 1 x k + = i = 1 n λ i · d i
The equation below outlines a series of directives. Here, λi denotes the aggregate count of successful variables, while x k + 1 x k + indicates the point exhibiting the most beneficial search trajectory. Consequently, it is integrated into the adjusted search orientation.
p i = d i , λ i = 0 j = 0 n λ j · d j λ i 0
Subsequently, the outcomes of the search, following the Gram–Schmidt normalizing process, are revised according to the subsequent equation.
q i = p i , i = 1 p i j = 1 i 1 q j T · p i q j T · q j i 2
The revised and standardized search instructions are outlined by
d i = q i q i , i = 1 , 2 , 3 , , n .
Following the local search adjustment, this approach conducts the search procedure until the algorithm fulfills the convergence criteria in the new opposing direction.
The IHHO Flowchart is depicted in Figure 4.

3.3. The IHHO Implementation

Expanding on the conceptual overview given, we can outline the procedural steps of the IHHO algorithm for solving deterministic optimization problems:
(1)
Initialization: The algorithm starts by generating an initial population of horses within the search space in a random manner. Every horse symbolizes a potential solution to the optimization problem.
(2)
Fitness Evaluation: Each horse’s fitness is assessed by utilizing the objective function of the optimization problem. The candidate solutions’ quality is evident in this.
(3)
Herd Movement: The horses in the herd exhibit movements that mimic the natural behavior of horses. This involves horses taking the lead in guiding the herd, other horses following and aligning themselves with the herd’s direction, and some horses lagging behind to explore new regions of the search space.
(4)
The IHHO incorporates a technique called RDR local search to address the problem of premature convergence. This process entails rotating the coordinate axes in the direction of the initial search direction and subsequently transitioning to a new starting point to generate effective search actions.
(5)
Orthonormal Basis Update: Utilizing the equations provided in the overview, the orthonormal basis is updated following the RDR local search. This allows for the ongoing enhancement and optimization of the search directions.
(6)
Convergence check: The algorithm assesses if the termination criteria, such as a maximum number of iterations or a target fitness value, have been met. Otherwise, the process goes back to Step 3 for the next iteration.
(7)
Output: Upon convergence, the IHHO outputs the most optimal solution discovered, which represents the best or second-best solution to the deterministic optimization problem.
By incorporating the RDR local search into the HHO framework and consistently updating the orthonormal basis, the IHHO demonstrates strong problem-solving capabilities and effectively prevents premature failure. This modification of the original HHO algorithm is anticipated to result in enhanced optimization performance for various deterministic optimization problems.

4. Results and Discussion

4.1. Application and Simulation Scenarios

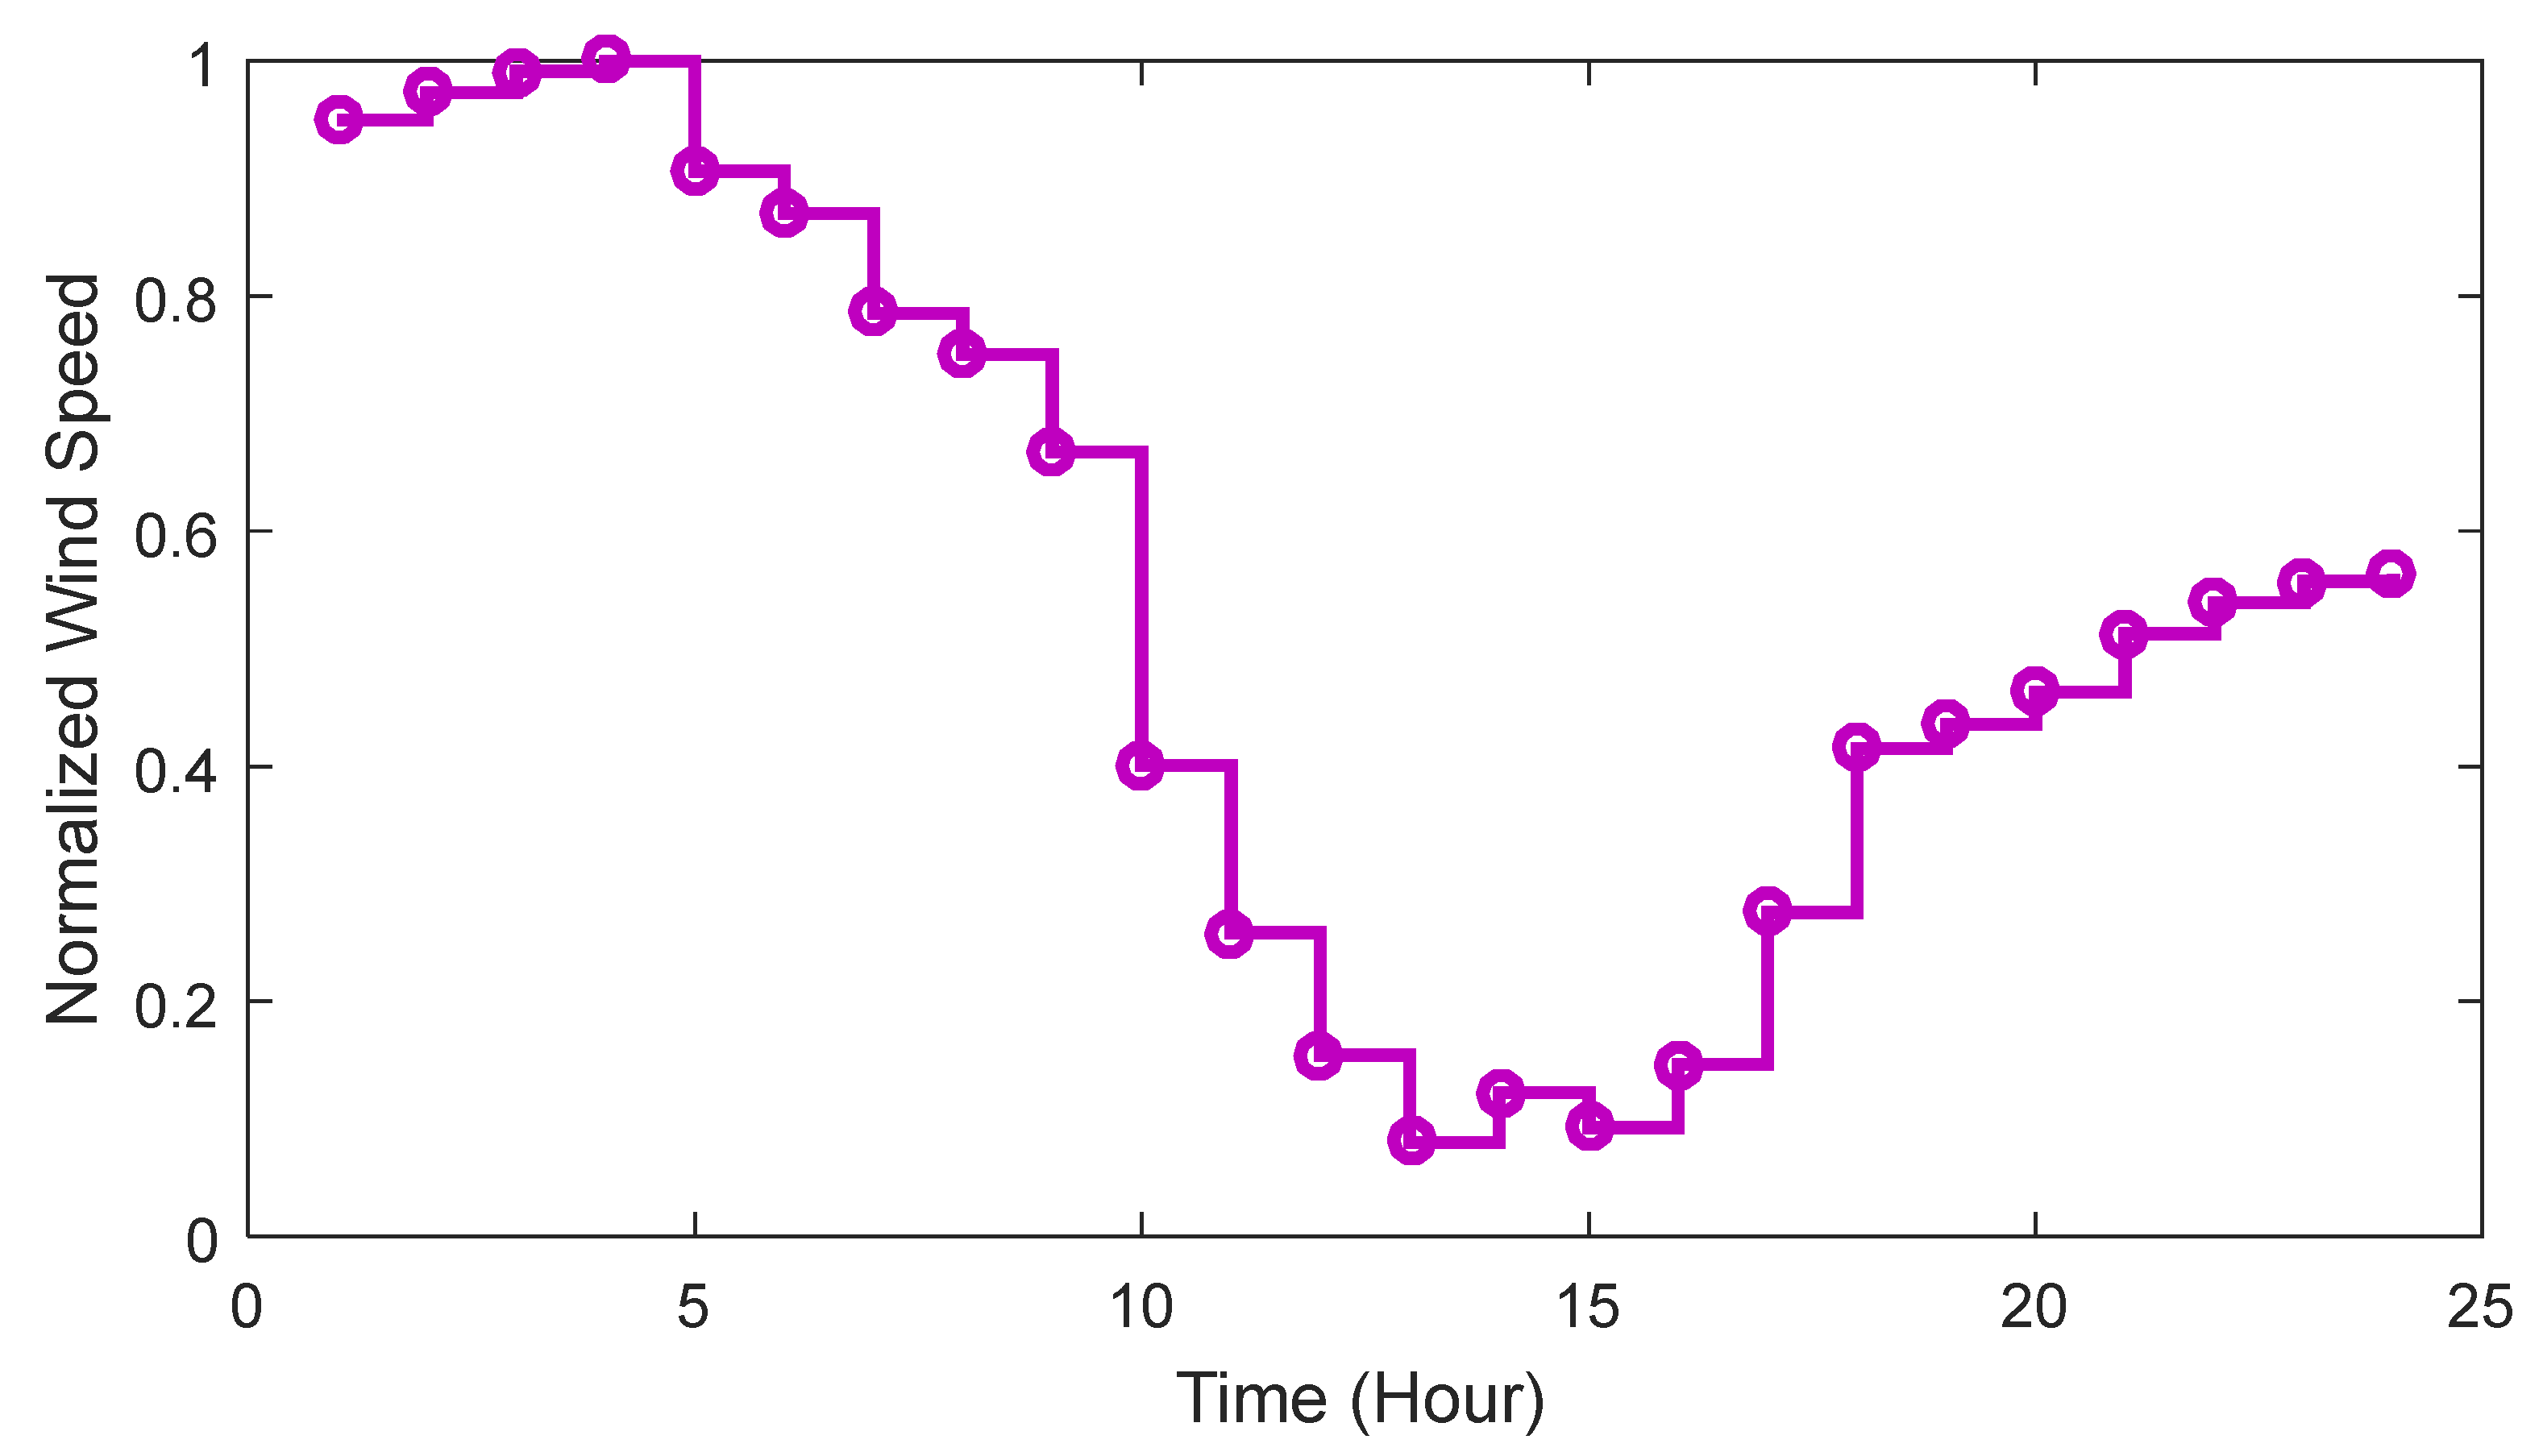
The proposed methodology is used for the hybrid Wind/Battery/CHP/TES system depicted in Figure 1, utilizing real data obtained from the city of Al-Jubail (26.9598° N, 49.5687° E) in Saudi Arabia. This system is characterized by electrical and thermal demand peaks of 15 kW and 5 kW, respectively. The load profiles for both electrical and thermal consumers hourly and daily, derived from peak load and demand curve data, are illustrated in Figure 5 [15]. The maximum wind speed in the specified area is recorded at 15 m/s. Figure 6 illustrates the daily load curve [15]. Furthermore, Table 1 provides the techno-economic data concerning resources and storage.
The simulations were implemented in Matlab 2021b and independent runs were executed on a desktop PC with an Intel Core i5-4590M processor @ 3.30 GHz, 8GB RAM, under the Windows 7 64-bit OS. The parameters for the population size, maximum iteration, and independent runs are set to 50, 300, and 30, respectively, for both the IHHO and comparative algorithms such as HHO, PSO, and MRFO, as detailed in [36,42,43]. Simulation scenarios assessing the effectiveness of the methodology are outlined as follows:
  • Scenario 1: Optimization of the hybrid Wind/Battery system;
  • Scenario 2: Optimization of the hybrid Wind/CHP/Battery system;
  • Scenario 3: Optimization of the hybrid Wind/CHP/Battery/TES system.

4.2. Deterministic Results of Scenario 1

In this section, the outcomes of the deterministic optimization process for scenario 1, focusing on the hybrid Wind/Battery energy system, are presented. Table 2 illustrates the capacities of various sources and storage units. The results indicate that in scenario 1, which solely accounts for WT and batteries, approximately 22 wind turbines and 108 batteries are necessary to meet the electrical demand requirements over a 24 h period. Six inverters are required to install this battery quantity to the AC bus. The thermal demand and supply are not incorporated in this instance. As depicted in Table 3, the calculated costs for AIC and AMC amount to USD 7528 and USD 110, respectively, with no expenses for AOC and AEC in scenario 1. Consequently, the total system cost using the IHHO is determined to be USD 7638 in scenario 1.
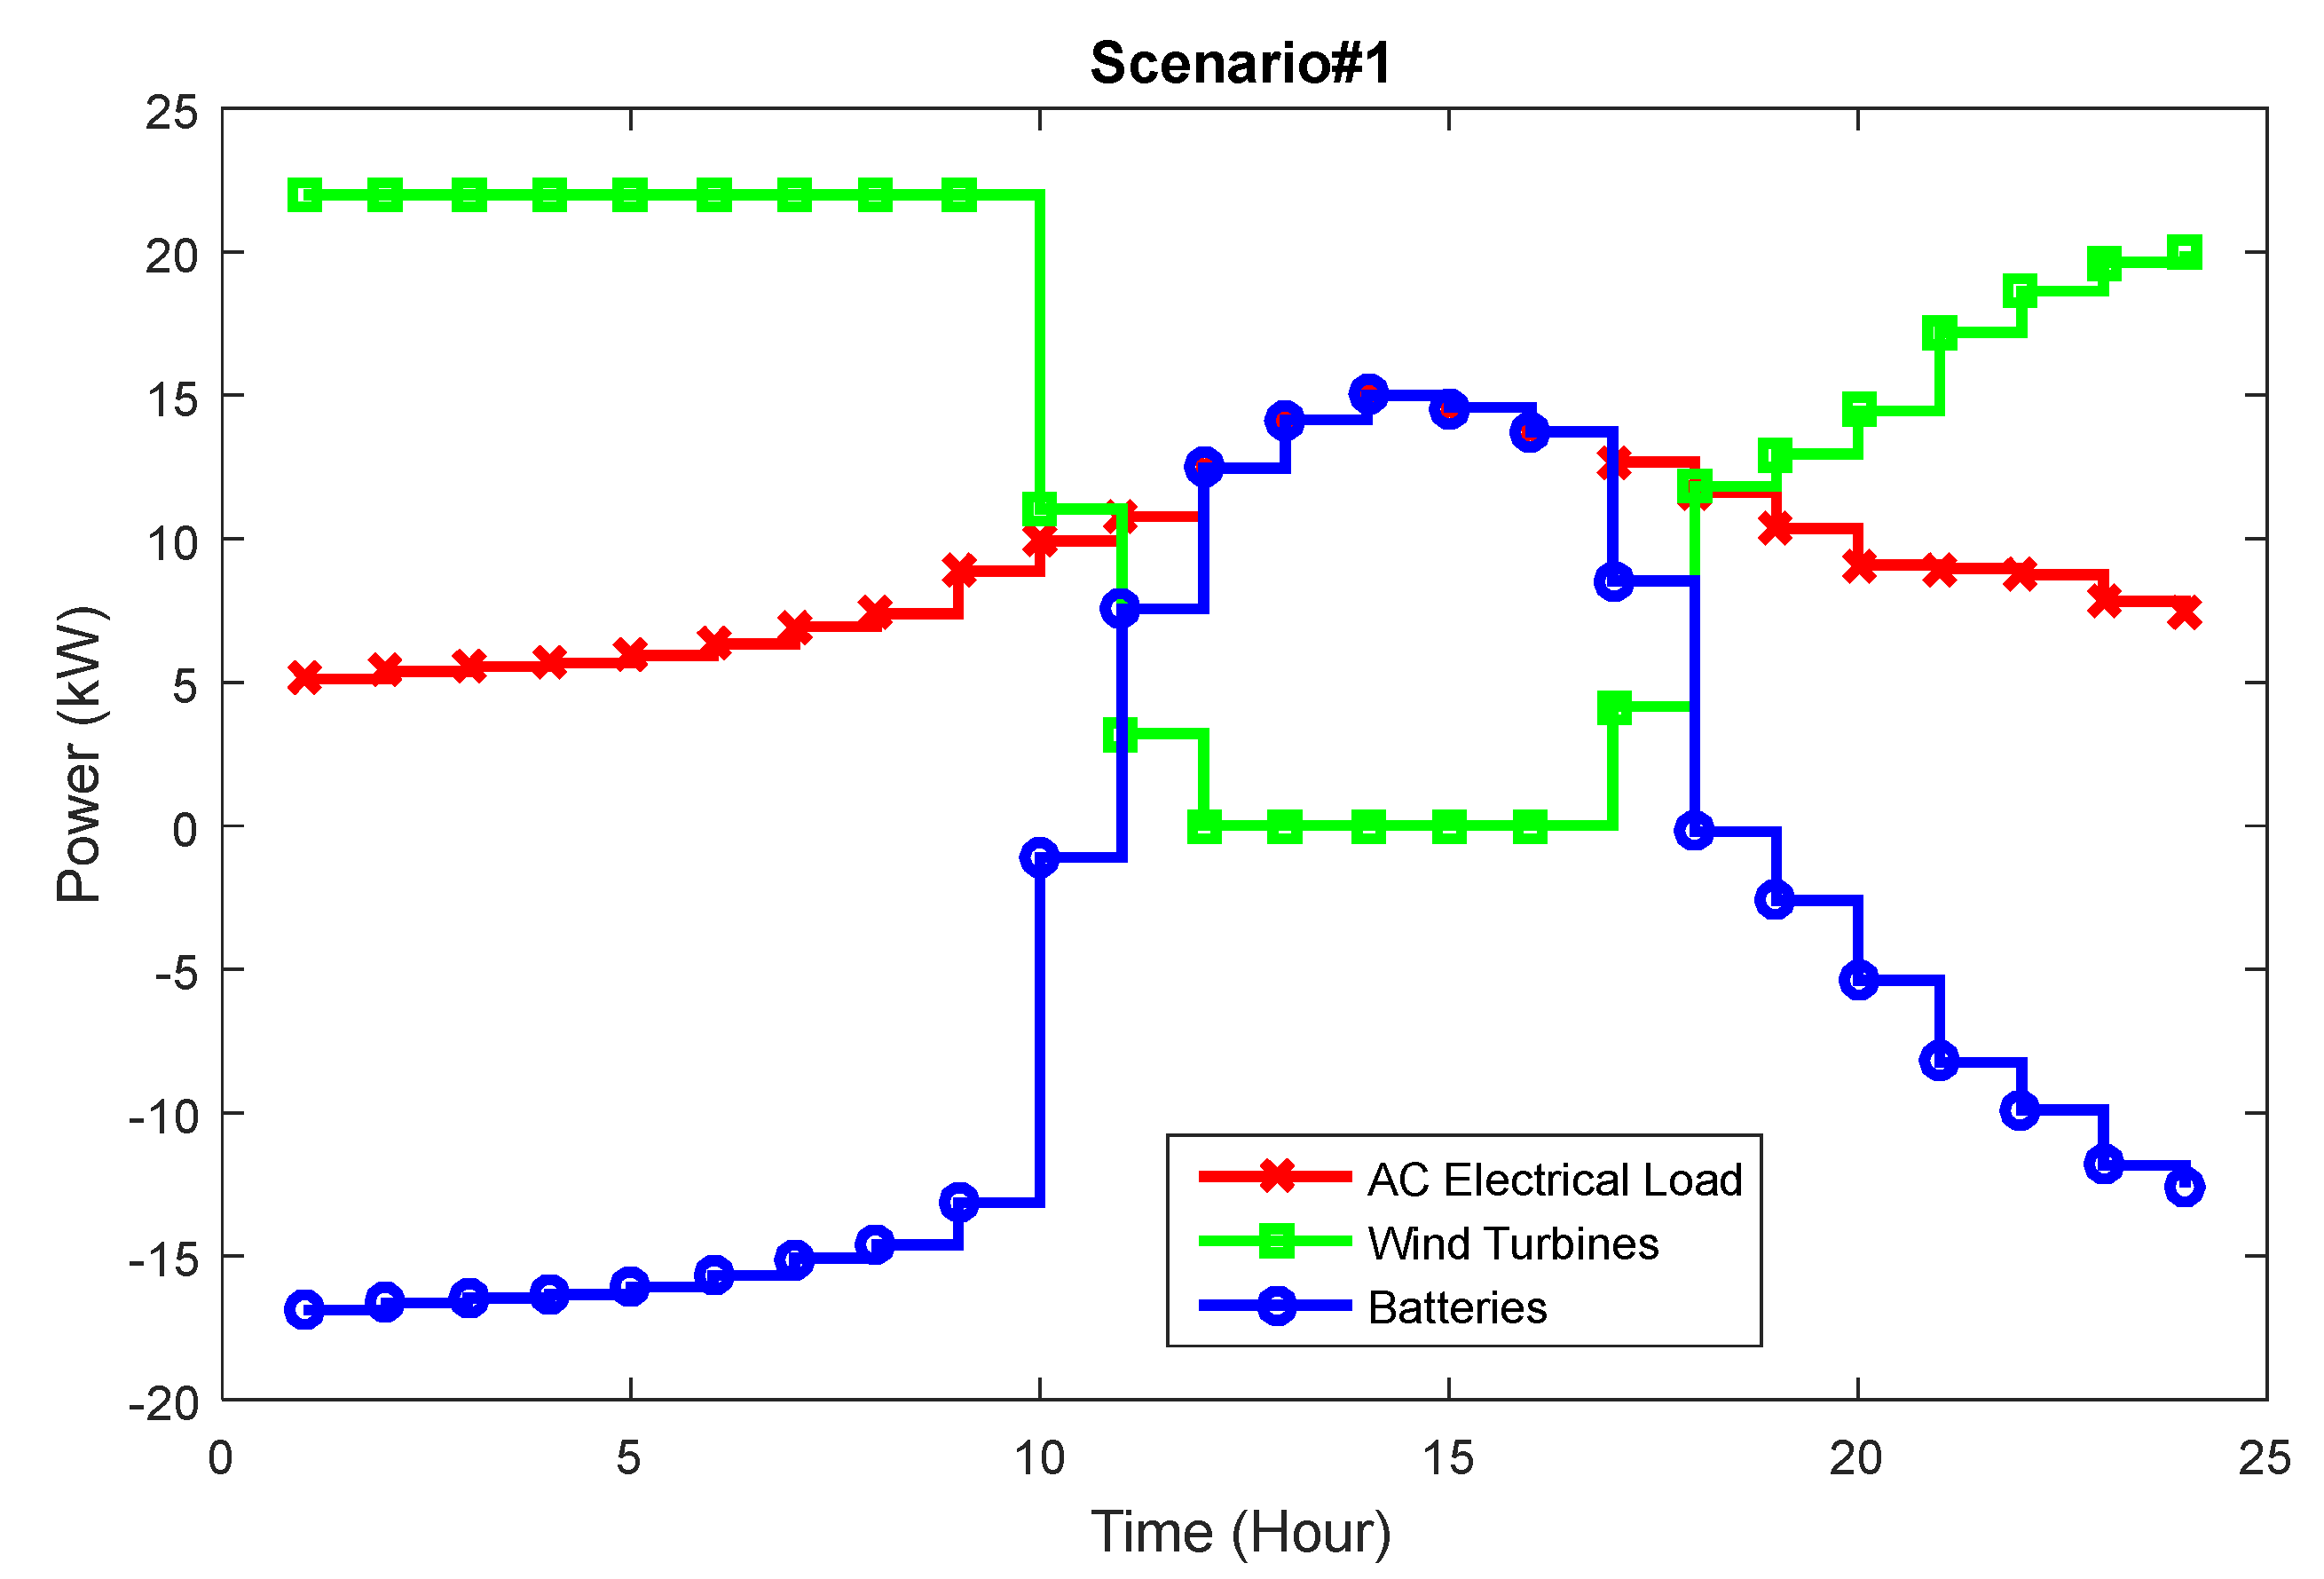
Figure 7 depicts the performance of WTs and batteries in supplying the electrical load in scenario 1. As observed, the anticipated daily power curve of WTs exhibits fluctuations, mirroring the variations in wind speed indicated in Figure 6. Further examination of Figure 7 reveals that WTs generate surplus active power compared to the AC power demand during the time intervals from 1:00 to 10:00 and 19:00 to 24:00. Consequently, the extra energy generated by the WTs during these hours relative to the electrical load is stored in batteries. During these intervals, as depicted in Figure 7, batteries are in a charging state, resulting in negative active power values. Simultaneously, the batteries switch to a mode of discharge to compensate for the insufficient energy generated using wind units in contrast to the electrical demand.

4.3. Deterministic Results of Scenario 2

In this section, the outcomes of deterministic optimization for the hybrid Wind/CHP/Battery system are presented. Scenario 2, outlined in Table 4, demonstrates a reduction in the wind units, batteries, and inverters to nine, 65, and three, compared to scenario 1, respectively. Despite this reduction, both electrical and thermal loads are concurrently supplied. Achieving this balance entails the installation of a single 8.77 kW CHP unit. As indicated in Table 5, the costs of AIC and AMC amount to USD 4125.39 and USD 80.08, respectively, while the costs of AOC and AEC stand at USD 2111.28 and USD 539.84, respectively, for scenario 2. Consequently, the overall system planning cost is USD 6856.59 in scenario 2, as determined by the IHHO.
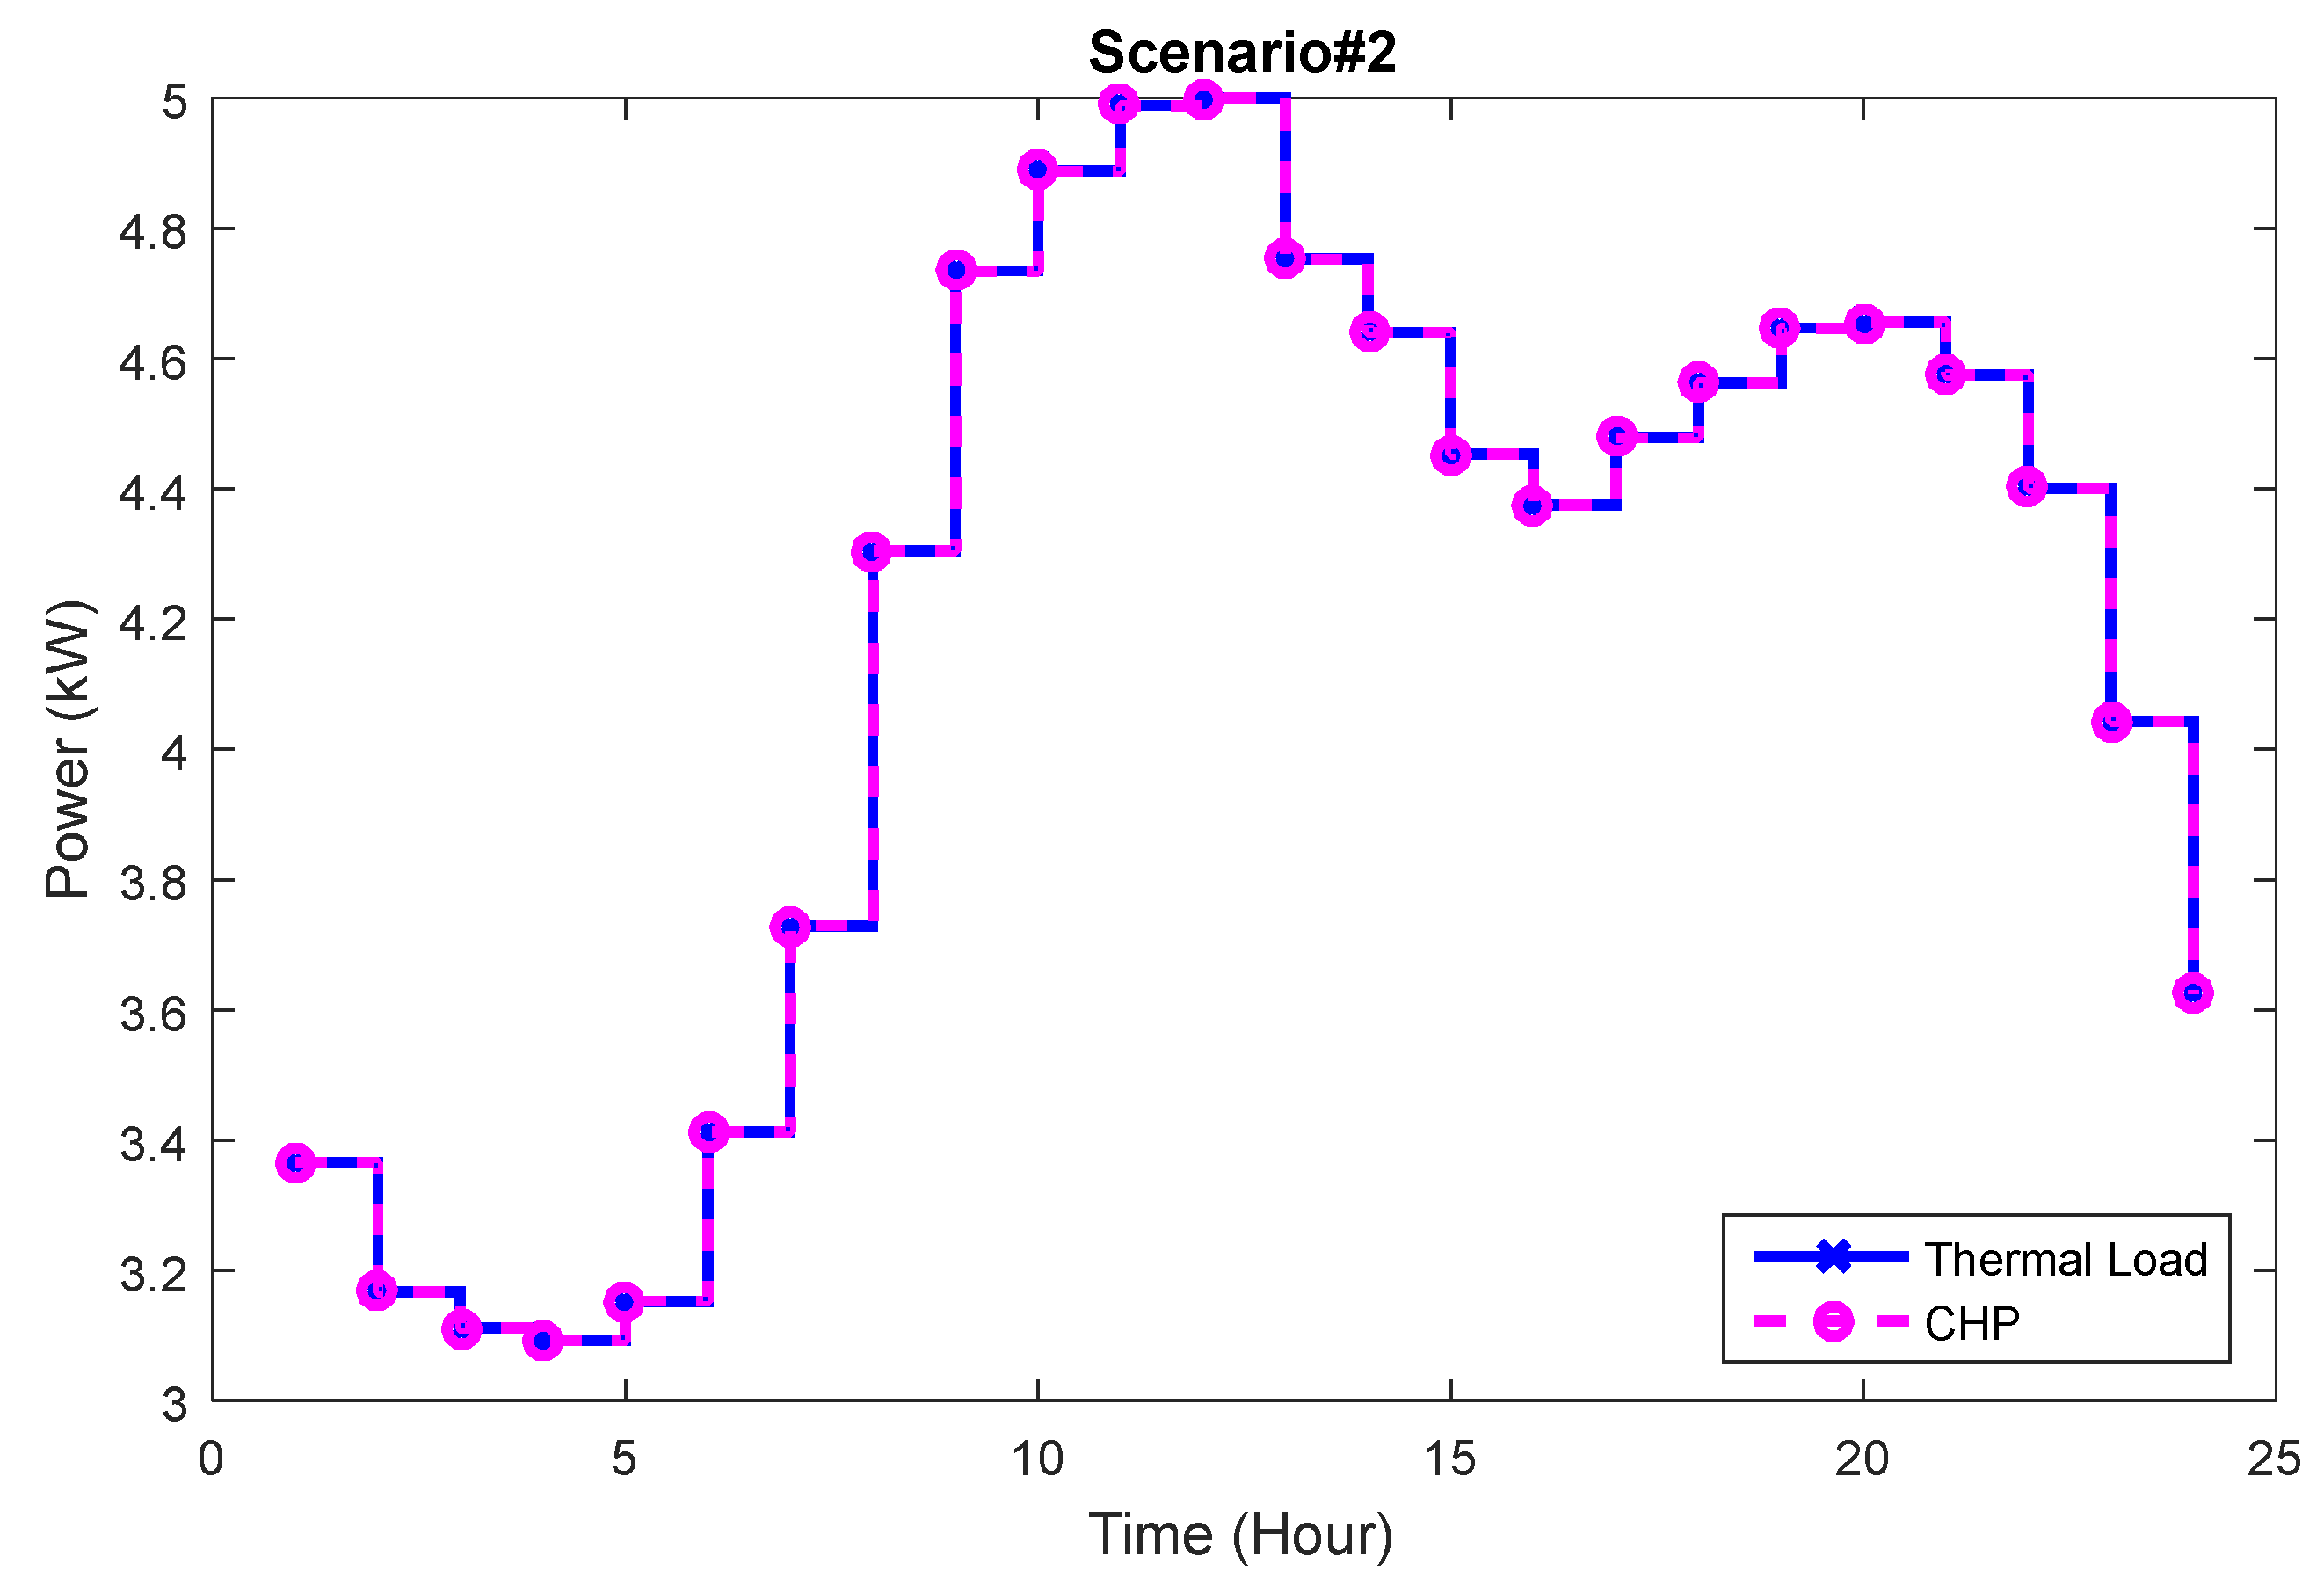
Figure 8 illustrates the anticipated daily trends of the generated power by wind units and batteries, alongside the CHP electrical and heat power, while meeting both demands in scenario 2. As depicted in Figure 8, although the wind unit power changes during a day remain consistent with those of scenario 1, numerical differences are evident between the two scenarios. In scenario 2, the active power of WTs is consistently lower than the electrical load throughout all operational hours. Additionally, Figure 9 showcases that the CHP heat power matches the thermal load throughout the entire operational duration, reflecting the assumption in scenario 2 that the CHP is only available to supply the heat demand. Consequently, the anticipated changes for the CHP production in Figure 8 mirror those of CHP thermal power (Figure 9), differing only in numerical values. Consequently, during the hours of 1:00–10:00 and 19:00–24:00, the combined CHP and wind unit active power exceeds the electrical load, prompting the batteries to enter charging mode and save surplus energy generated by these units relative to the electrical load. Conversely, during other times, storage-based batteries operate in discharge mode and, with wind turbines and CHPs, provide the electrical load requirements.

4.4. Deterministic Results of Scenario 3

In this section, the deterministic optimization outcomes of the Wind/CHP/Battery/TES system are delineated for scenario 3. In this scenario, the quantities of wind turbines, batteries, and inverters are determined as eight, 64, and four, respectively (as listed in Table 6). Additionally, five TESs are incorporated into the proposed system, resulting in a reduction in CHP capacity to 8.42 kW compared to scenario 2. As outlined in Table 7, the costs pertaining to AIC, AMC, AOC, and AEC amount to USD 4176.61, USD 81.68, USD 2008.87, and USD 510.45, respectively, for scenario 3. Consequently, the overall system cost is calculated as USD 6777.61 in scenario 3 utilizing the IHHO.
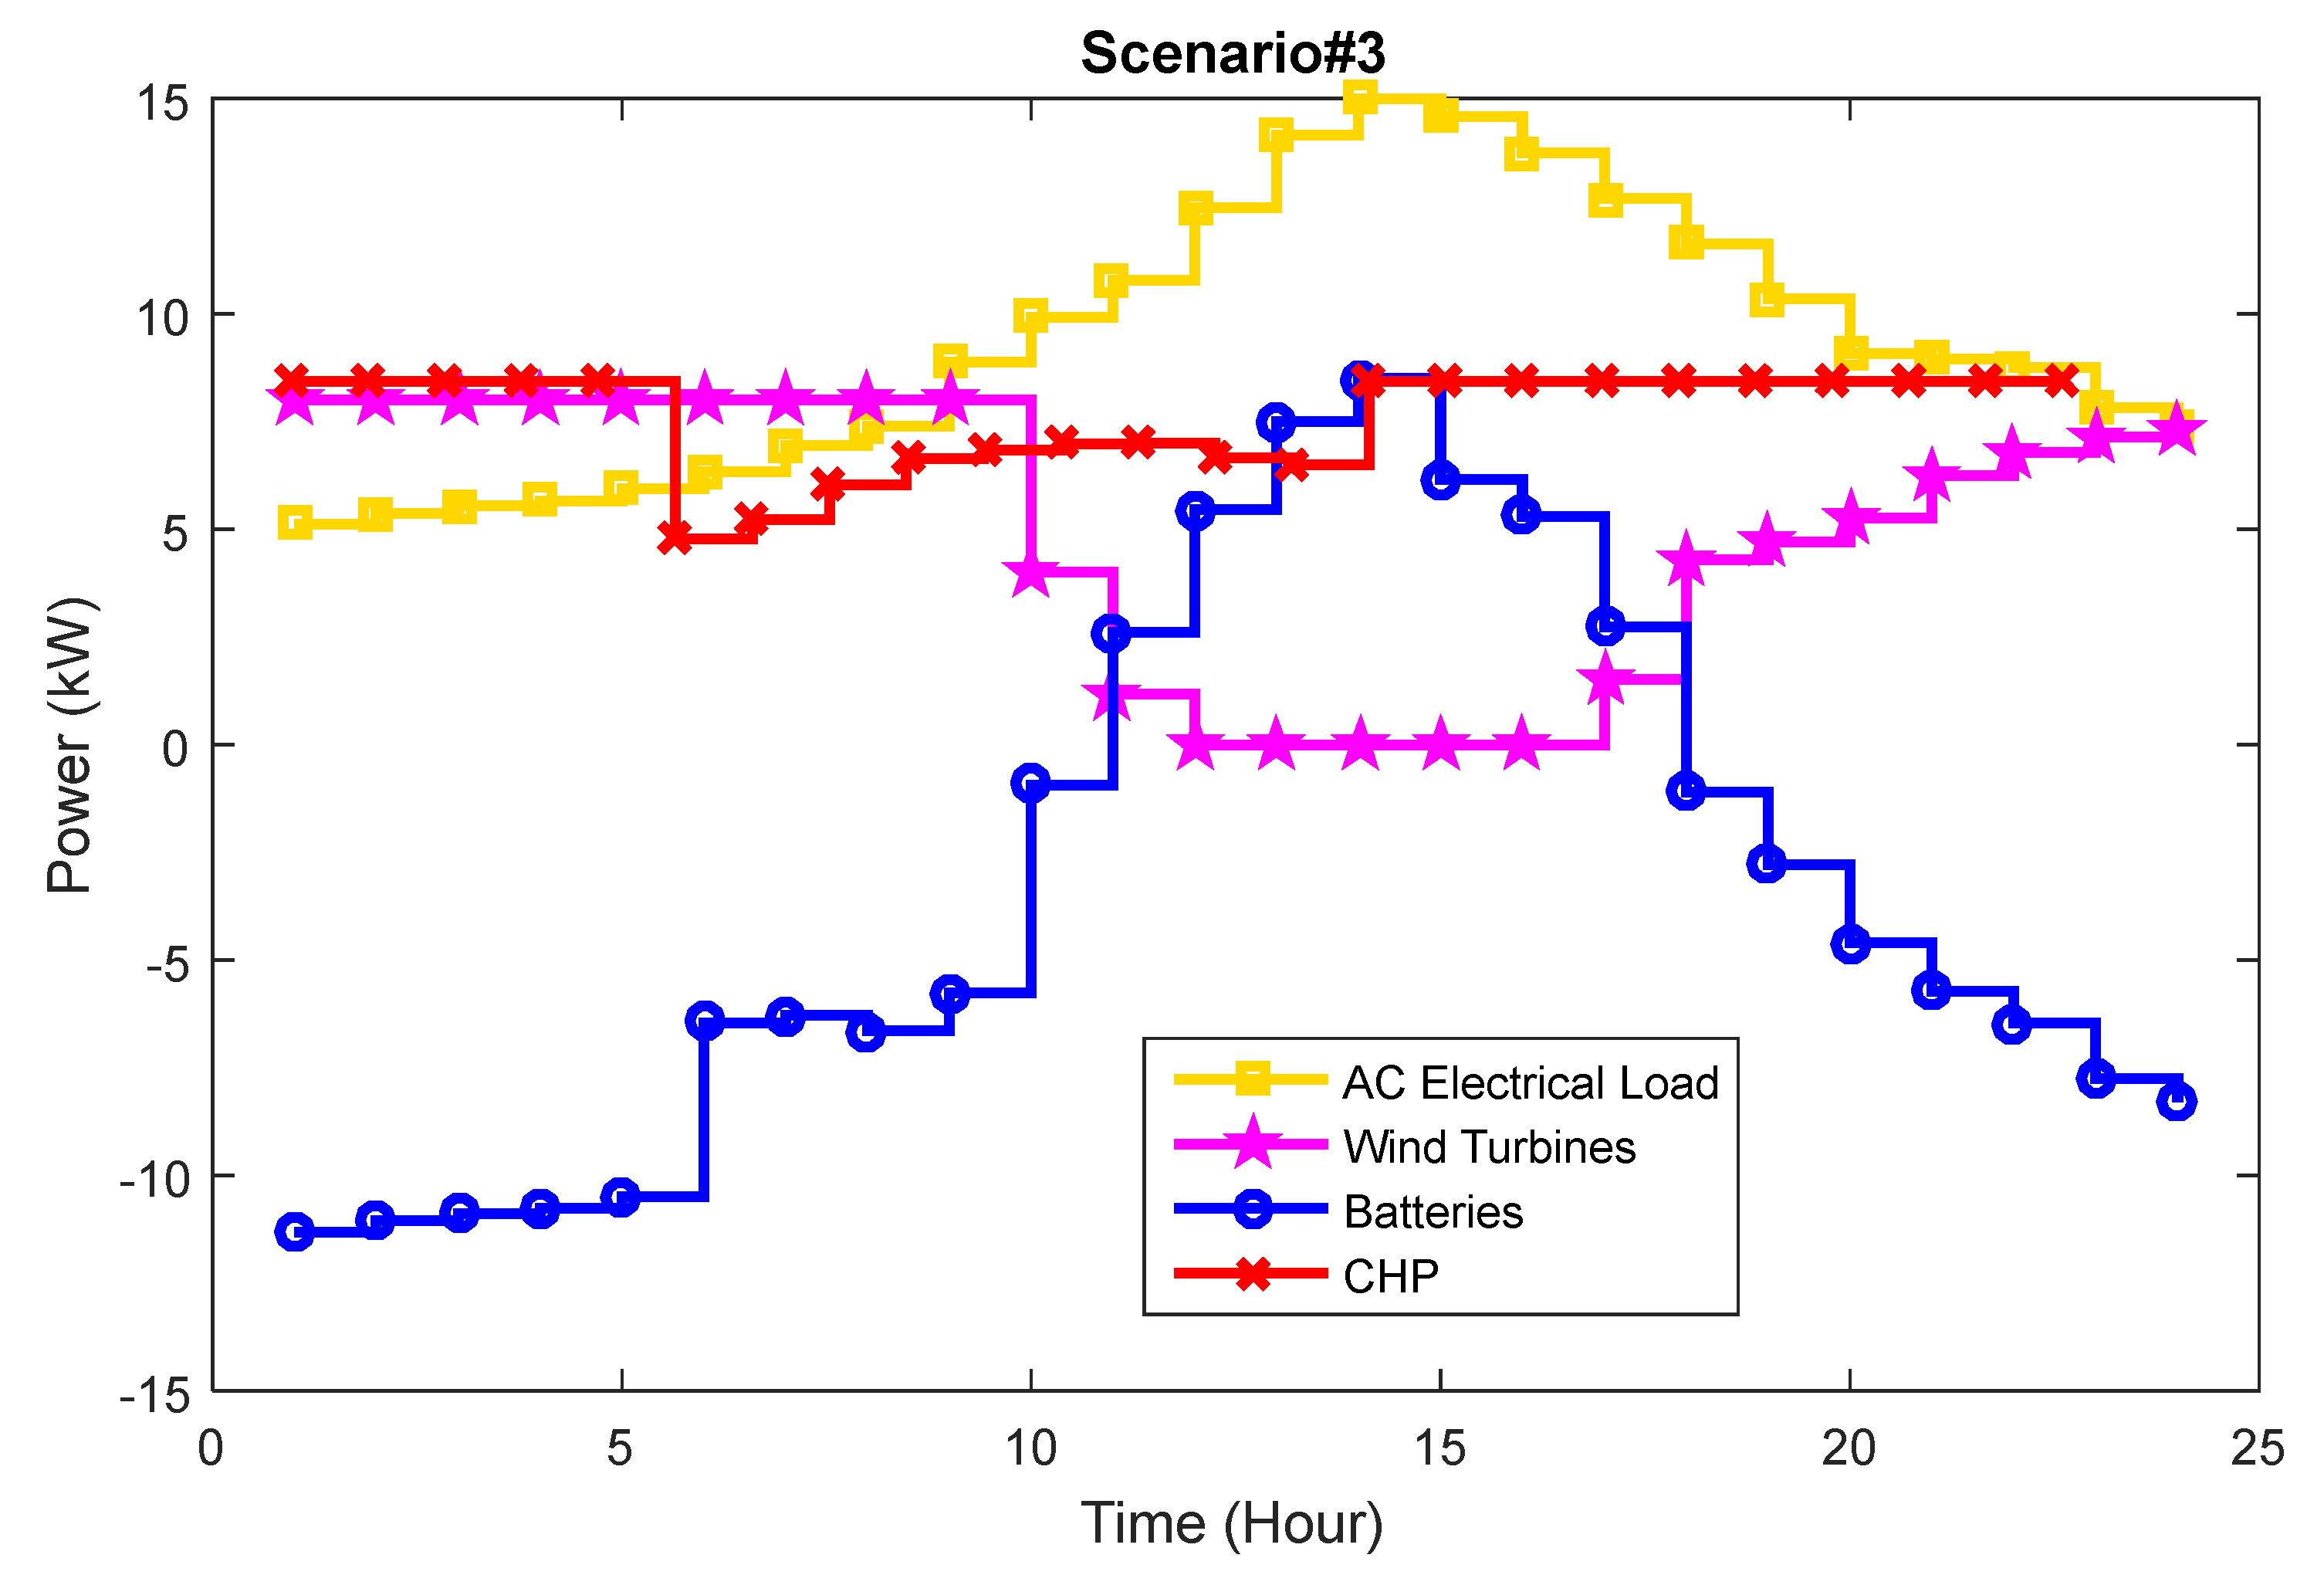
Figure 10 depicts the anticipated power profiles of production and storage resources when fulfilling the electrical and thermal demands in scenario 3. According to Figure 10, the WT power variations remain consistent with scenario 2, failing to fully meet the electrical load requirement throughout the study period. In Figure 9, the CHPs consistently produce 1.5 kW of heat power across maximum operating hours, exceeding the thermal load demand between 1:00–6:00 and 15:00–24:00. Consequently, TESs operate in charging mode during these intervals, accumulating surplus heat energy generated using the CHPs beyond the thermal demand. However, during other periods, when the CHPs cannot entirely fulfill the heat demand, the TESs switch to the mode of discharge, compensating for the shortfall in thermal energy production in contrast to the CHP. Evaluating Figure 10 and Figure 11, it is evident that in scenario 3, the inclusion of TESs allows for better control over CHP thermal power. The presence of TESs in scenario 3 enables a reduction in CHP size compared to scenario 2, as corroborated by Table 7. Ultimately, the operational act of CHPs and wind turbines results in extra power relative to the electrical demand during the hours of 1:00–10:00 am and 10:00–12:00 pm, necessitating the batteries to operate in charging mode. Conversely, during the remaining hours, the storage-based battery, CHPs, and wind turbines fulfill the electrical demand.

4.5. Comparison of the Deterministic Results

Table 8 presents a comparative analysis of the planning costs across different scenarios using the IHHO, indicating that scenario 3 has the lowest planning costs compared to the other scenarios. As per Table 3, scenario 1 incurs the highest installation and maintenance costs, amounting to USD 7528 and USD 110, respectively. Scenario 2, which involves the installation of CHP alongside WTs and batteries, experiences a reduction in costs of investment and maintenance in contrast to scenario 1, totaling USD 4125.39 and USD 80.08, respectively. The reduction in cost in scenario 2 is attributed to the decreased number of wind turbines, batteries, and inverters compared to scenario 1. However, scenario 2 incurs operating and emission costs of USD 211.28 and USD 539.84, respectively, due to the fuel cost associated with CHP. In scenario 3, where TES is integrated with CHP, wind turbines, and batteries, costs of operation and emission decrease in contrast to scenario 2, amounting to USD 2008.87 and USD 510.45, respectively. The reduction in the cost in scenario 3 is attributed to the contributions of CHP and TES. However, installation and maintenance costs in scenario 3 increase compared to scenario 2 (USD 4125.39 and USD 80.08), totaling USD 4176.61 and USD 81.68, respectively. This cost increase in scenario 3 is due to the installation of five TESs, incurring installation and maintenance/repair costs of USD 105 and USD 8, respectively. Consequently, in scenario 3, the installation and maintenance costs of CHP decrease by 4% compared to scenario 2.

4.6. Proposed Optimizer Superiority

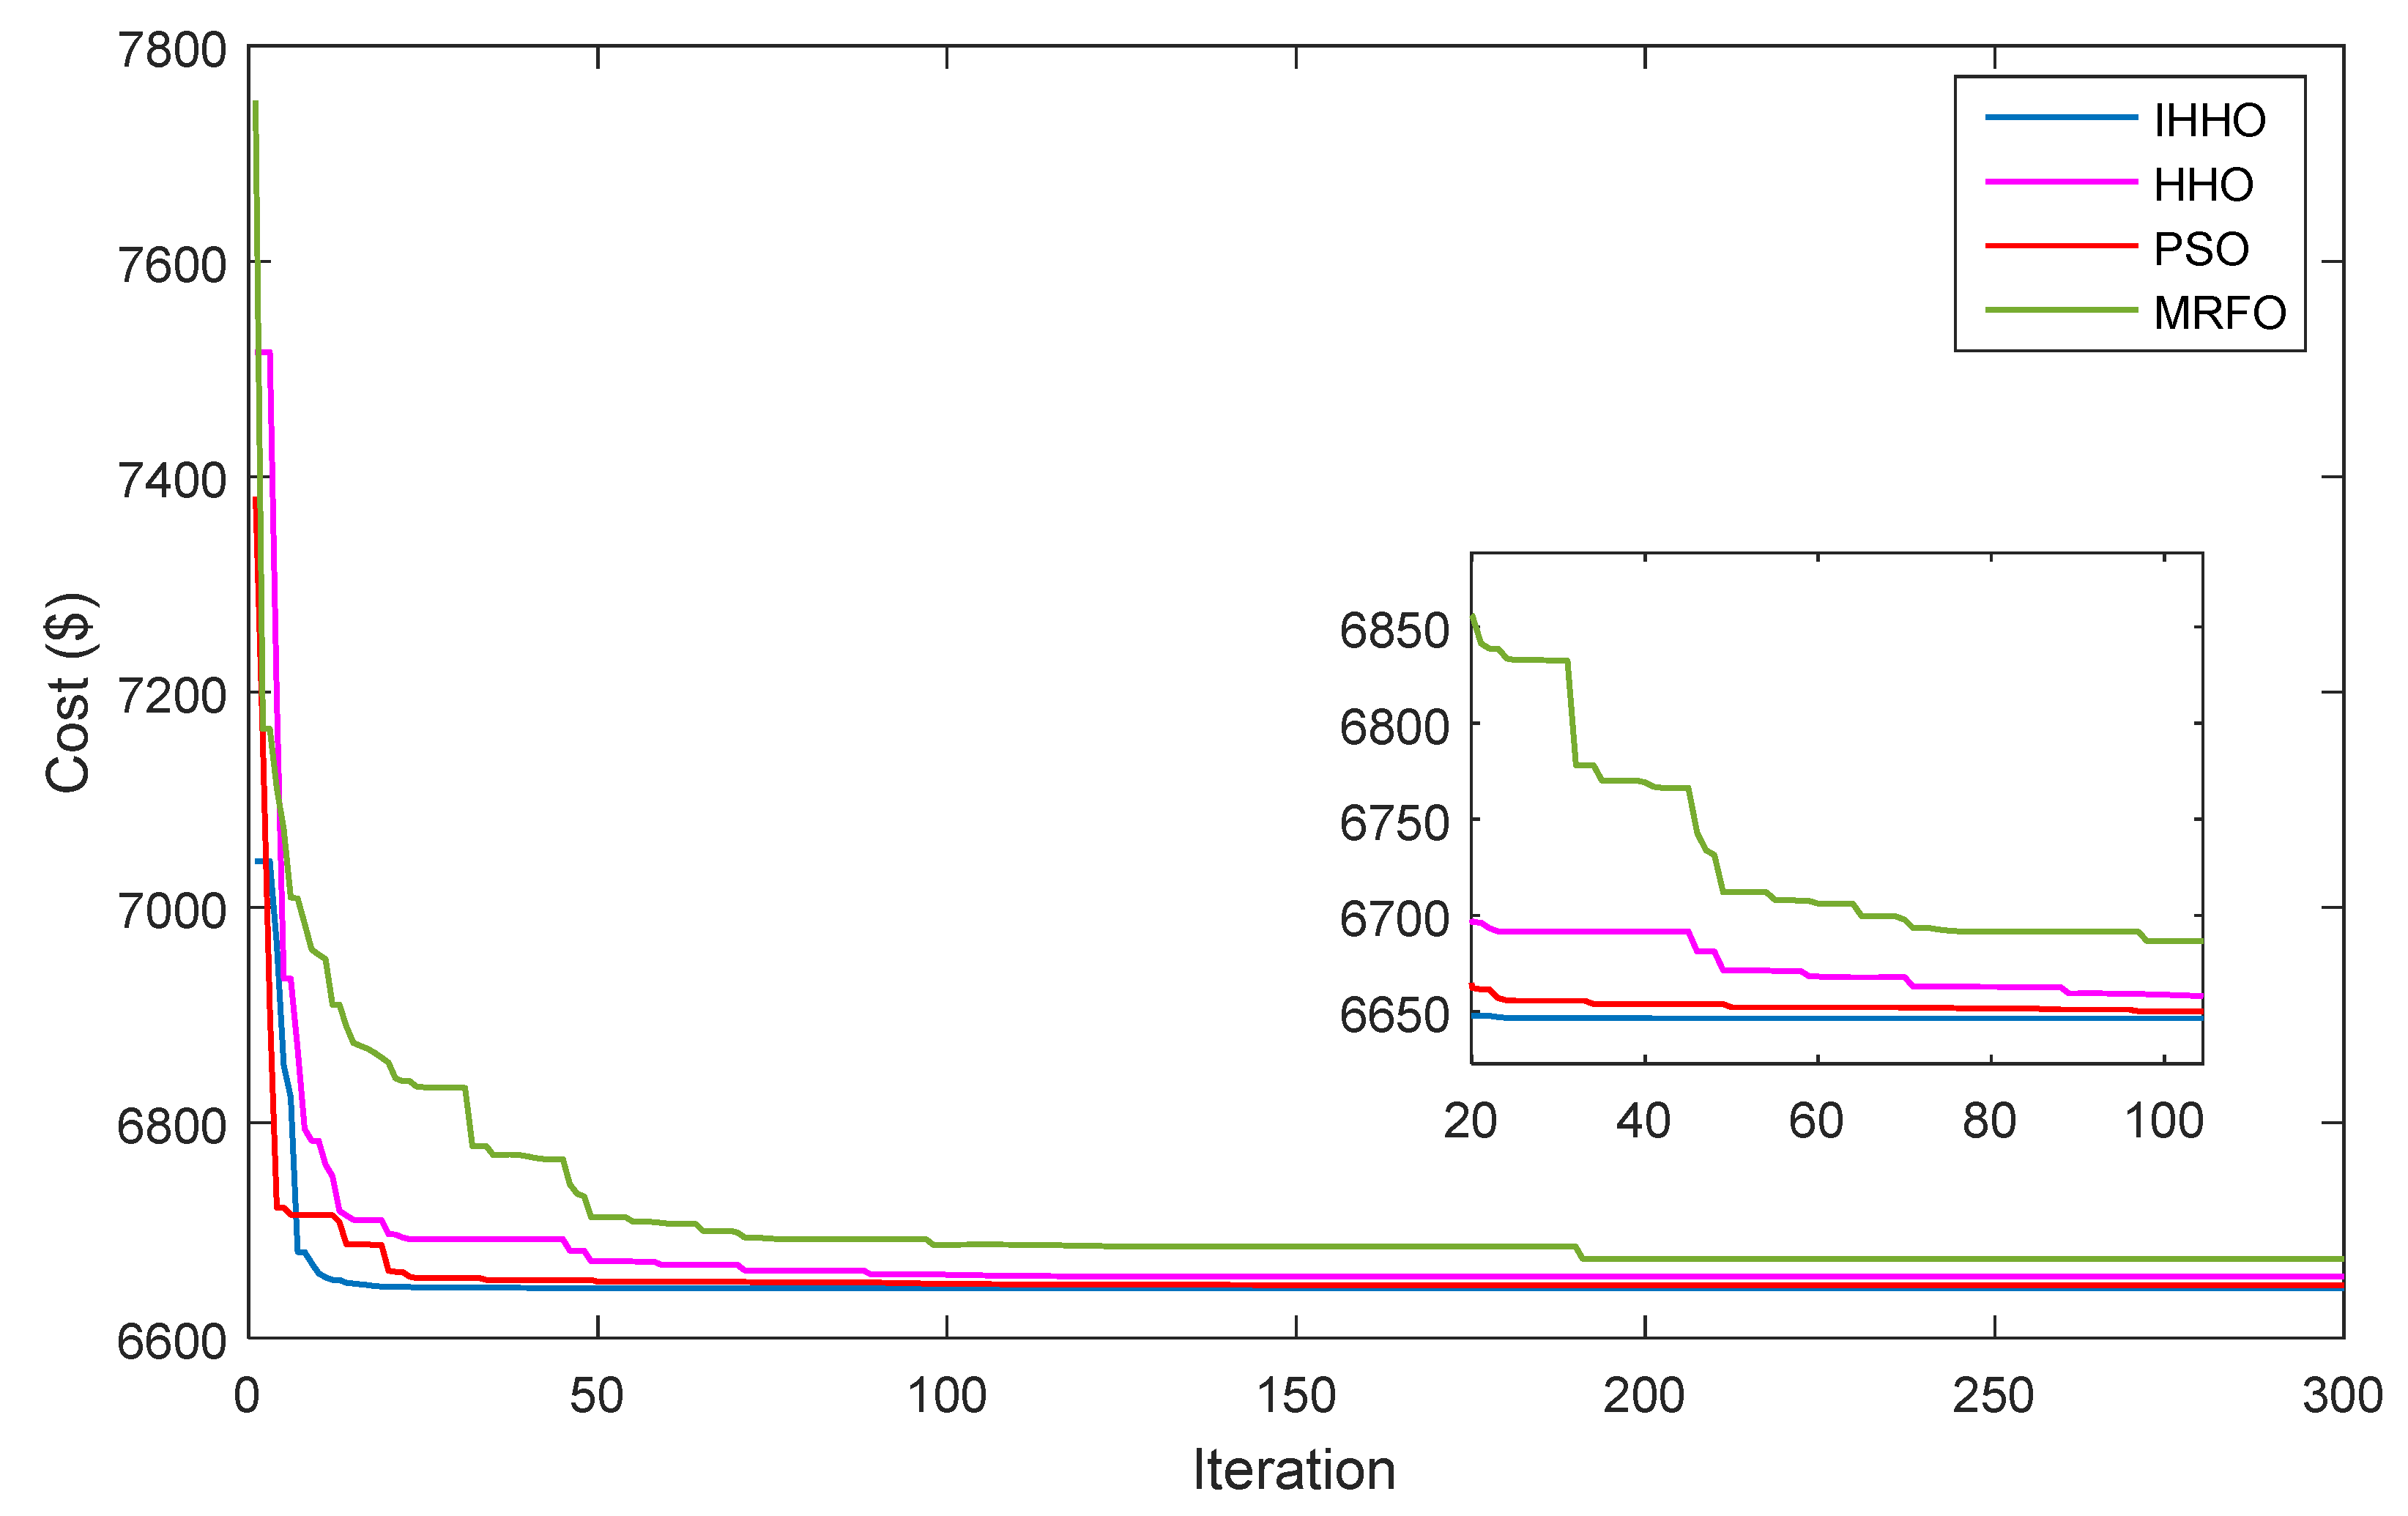
Figure 12 depicts the convergence curves of various optimizers in solving the optimal scenario, specifically scenario 3. Table 6 compares the convergence process of the recommended IHHO with HHO, PSO, and MRFO methods. The parameters for each algorithm, such as the size of the population, maximum iterations, and independent executions, are set as 50, 300, and 30, respectively. Algorithm adjustment parameters are determined based on previous references. Each optimizer is performed 30 times to derive statistical analysis results, including the best, average, and worst values, along with the standard deviation (Std) of the optimal solution. As shown in Table 9, the improved optimizer achieves the answer optimally corresponding to the lowest objective function value compared to other)algorithms. The IHHO achieves this cost value with the greatest convergence speed, requiring fewer iterations and less computation time. Additionally, the Std obtained for the improved algorithm is the lowest compared to other algorithms. Consequently, the improved algorithm offers a more precise solution and faster convergence speed than the HHO, PSO, and MRFO.

4.7. Stochastic Model Results

The system’s optimization efficacy has been assessed under uncertain load and wind power conditions utilizing the cloud theory model and the IHHO approach. To enact the stochastic optimization model, 1000 droplets have been chosen to construct cloud models for electric and thermal demands, as well as wind speed. The parameters of cloud loading and wind speed CM are detailed in Table 10. Figure 13 shows the cloud droplet distribution pattern for wind speed and electrical and thermal loads.
Table 11 and Table 12 provide the outcomes of system optimization under stochastic conditions, employing the cloud theory model and the IHHO technique. These tables outline the values of Ex, En, and He, alongside the planning costs for various scenarios. The findings indicate that incorporating uncertainty into stochastic optimization results in a higher cost of planning in contrast to the deterministic model. This escalation in costs for scenarios 1 to 3 amounts to 4.00%, 4.20%, and 3.96%, respectively, attributed to the uncertainty surrounding wind power and loads. Consequently, in the stochastic model, wind turbine power production may fall short of predicted values in deterministic optimization, and load power consumption might exceed predicted values under uncertain conditions.
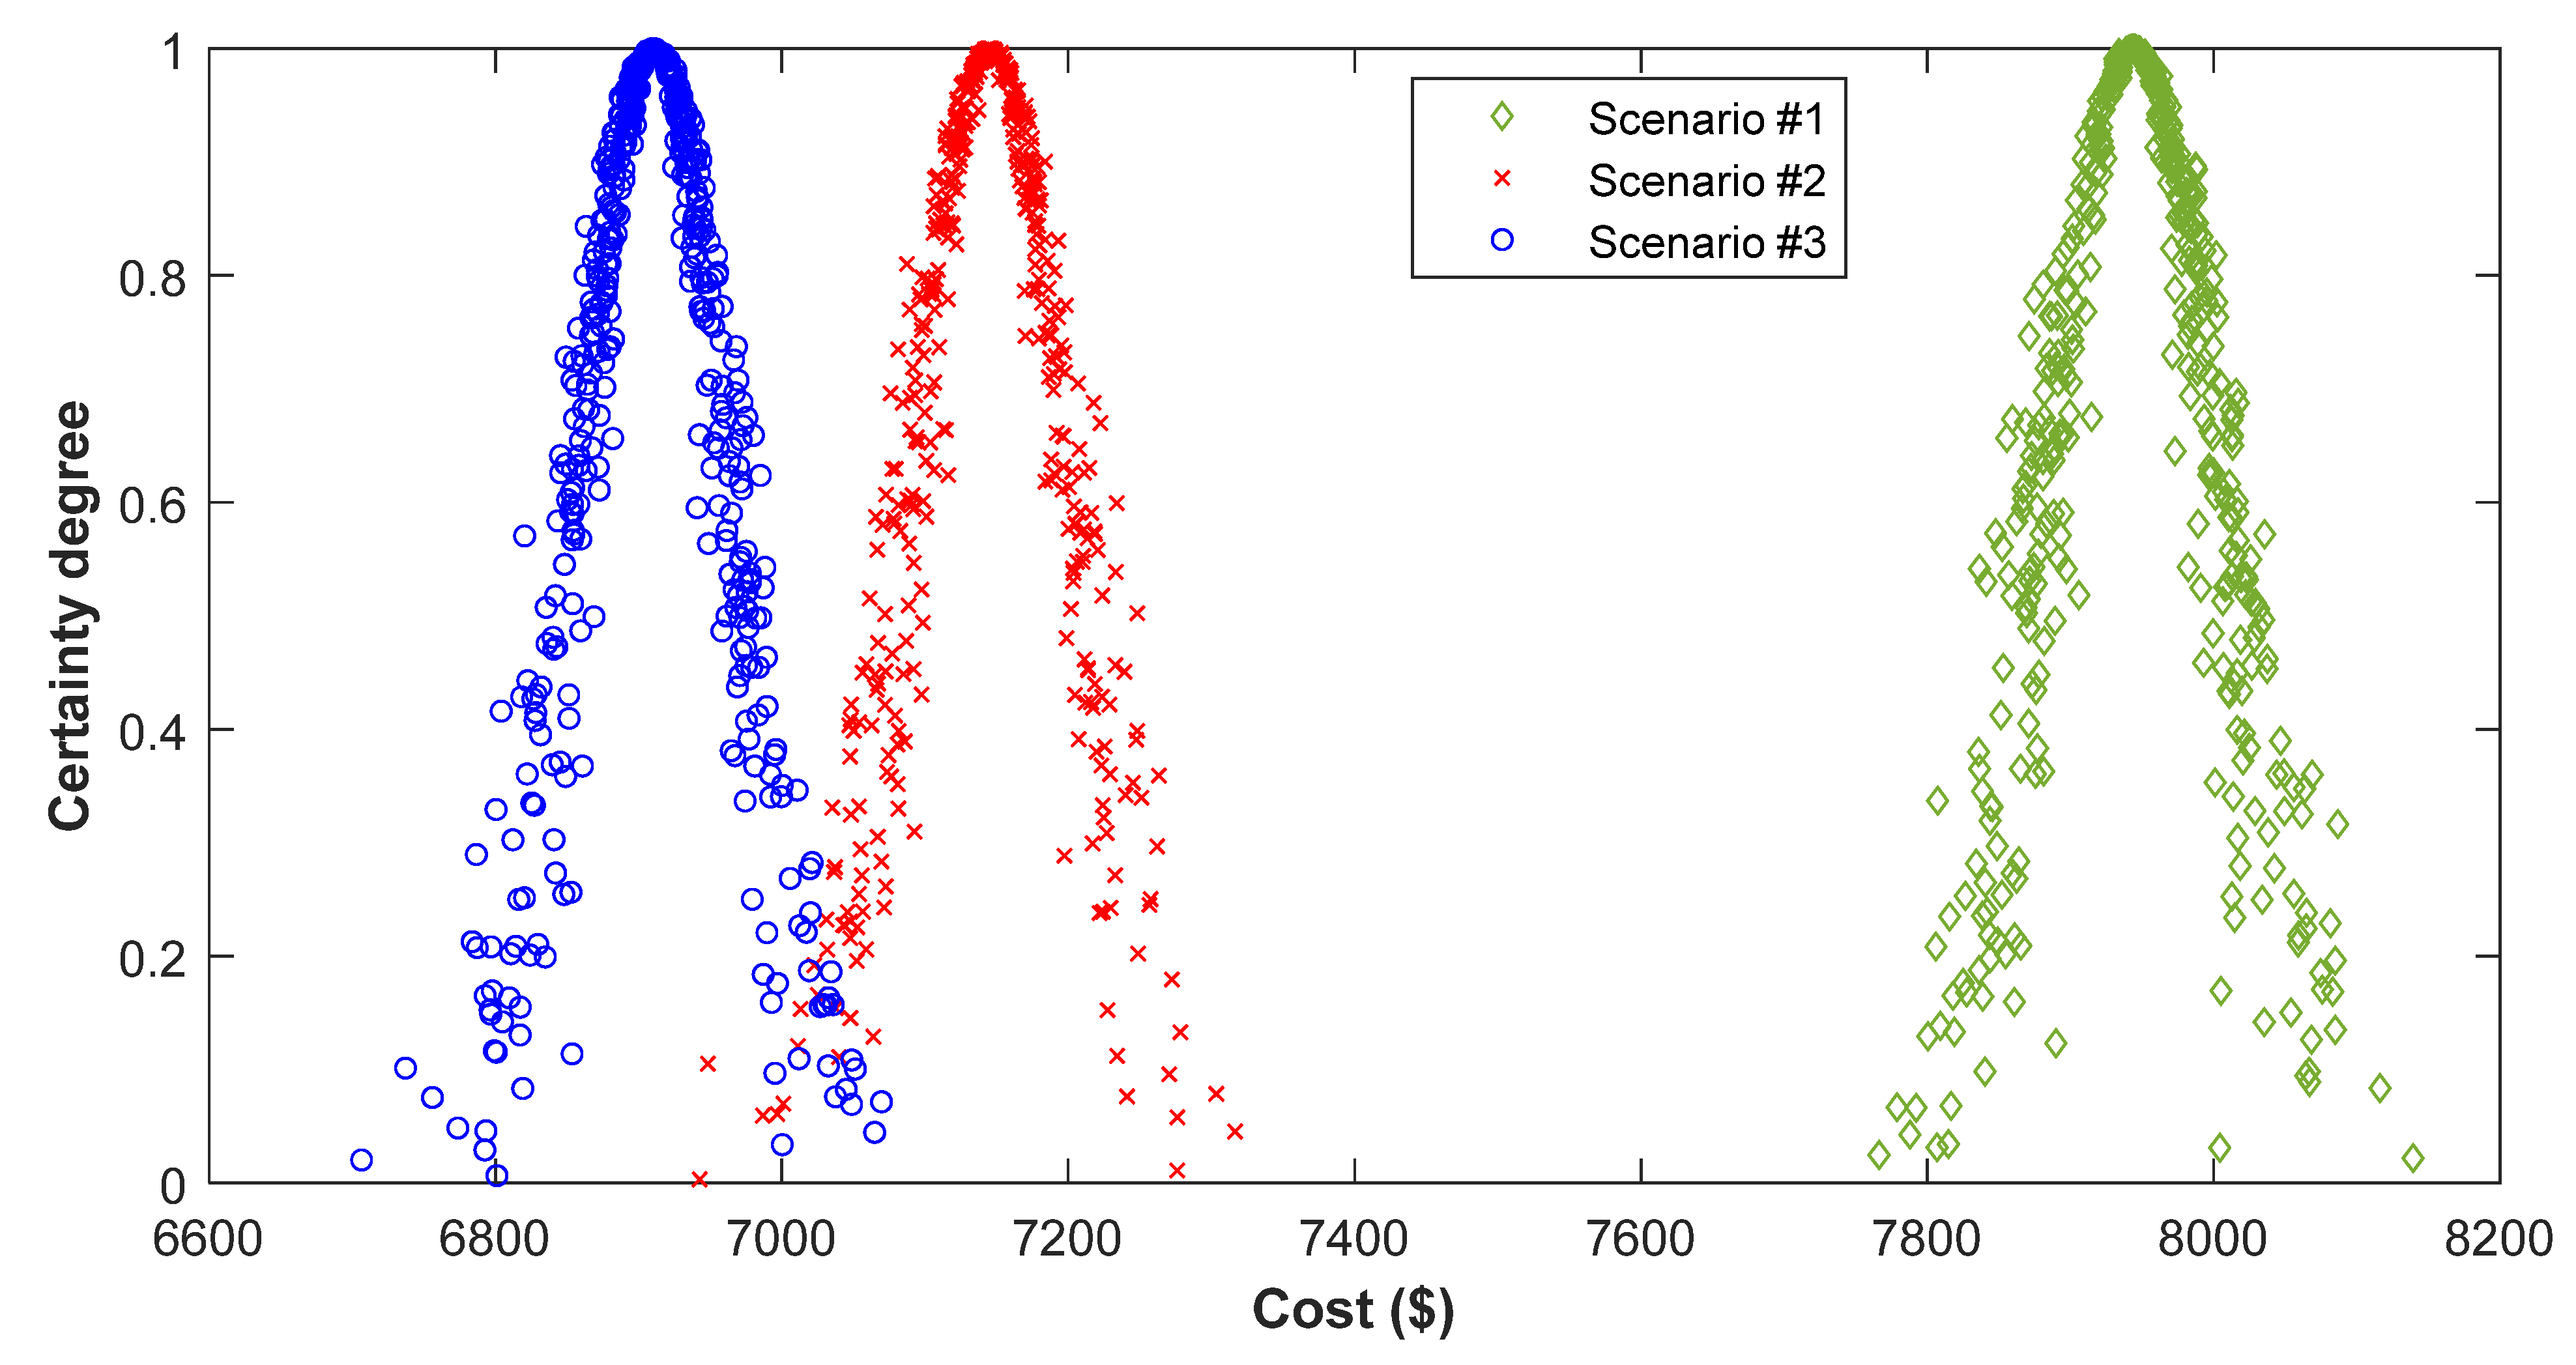
Figure 14 depicts the distribution of cloud droplets, representing the planning cost across various scenarios. Observing these figures, it is evident that the fluctuations in cloud droplets on the right side of the cloud models are comparatively smaller than those on the left side, primarily due to uncertainty. Consequently, the impact of uncertainty on cost manifests as a gradual rise in cost entropy, with higher uncertainty levels resulting in more significant cost increments.

5. Conclusions

This study demonstrated the random improvement of a wind, battery, CHP, and TES system using the IHHO algorithm and cloud model theory. The primary objective was to minimize planning expenditures while fulfilling both thermal and electrical load requirements. The methodology involved a comprehensive system description, precise component modeling, problem formulation, and the application of cloud theory to handle uncertainties through stochastic modeling. We utilized the IHHO algorithm, which incorporates the RDR method, to overcome the limitations of the conventional HHO.
We validated the proposed methodology by optimizing three distinct configurations of hybrid energy systems using real-world data from Al-Jubail, Saudi Arabia. The results indicated that the configuration integrating wind, CHP, batteries, and TES achieved the lowest planning cost, with notable reductions in both investment and maintenance expenses. This underscores the significant role of thermal energy storage in enhancing the cost-effectiveness of hybrid energy systems.
Furthermore, the IHHO algorithm demonstrated superior performance in terms of convergence speed and accuracy compared to HHO, PSO, and MRFO. We attribute this improvement to its enhanced capability to efficiently locate optimal solutions while avoiding premature convergence. However, the stochastic optimization based on the cloud model resulted in an increase in annual planning costs relative to deterministic optimization, ranging from 4.00% to 4.20%. This increase highlights the impact of uncertainties in wind power generation and demand, underscoring the necessity of incorporating stochastic modeling in the optimization process.
Future research will concentrate on the robust optimization of hybrid energy systems, including wind/CHP/hydrogen/TES configurations, with a focus on uncertainty risk aversion. Such advancements will further enhance the reliability and cost-effectiveness of sustainable energy systems for managing unpredictable variables.

Funding

This research is supported by the Deputyship for Research & Innovation, Ministry of Education in Saudi Arabia under Project Number (IFP-2020-162).

Institutional Review Board Statement

Not applicable.

Informed Consent Statement

Not applicable.

Data Availability Statement

The data presented in this study are available in this article.

Conflicts of Interest

The authors declare no conflicts of interest.

References

  1. Farhat, O.; Khaled, M.; Faraj, J.; Hachem, F.; Taher, R.; Castelain, C. A Short Recent Review on Hybrid Energy Systems: Critical Analysis and Recommendations. Energy Rep. 2022, 8, 792–802. [Google Scholar] [CrossRef]
  2. Dong, H.; Fu, Y.; Jia, Q.; Wen, X. Optimal Dispatch of Integrated Energy Microgrid Considering Hybrid Structured Electric-Thermal Energy Storage. Renew. Energy 2022, 199, 628–639. [Google Scholar] [CrossRef]
  3. Benyaghoob-Sani, A.; Sedighizadeh, M.; Sedighizadeh, D.; Abbasi, R. A RA-IGDT Model for Stochastic Optimal Operation of a Microgrid Based on Energy Hub Including Cooling and Thermal Energy Storages. Int. J. Electr. Power Energy Syst. 2021, 131, 107092. [Google Scholar] [CrossRef]
  4. Adefarati, T.; Bansal, R.C.; Naidoo, R.; Onaolapo, K.A.; Bettayeb, M.; Olulope, P.K.; Sobowale, A.A. Design and Techno-Economic Assessment of a Standalone Photovoltaic-Diesel-Battery Hybrid Energy System for Electrification of Rural Areas: A Step towards Sustainable Development. Renew. Energy 2024, 227, 120556. [Google Scholar] [CrossRef]
  5. Liu, R.; Liu, M.; Xu, C.; Liu, M.; Yuan, W. Thermodynamic Study of a Novel Combined Heat and Power System Integrated with Solar Energy. Appl. Therm. Eng. 2023, 234, 121192. [Google Scholar] [CrossRef]
  6. Chen, M.; Lu, H.; Chang, X.; Liao, H. An Optimization on an Integrated Energy System of Combined Heat and Power, Carbon Capture System and Power to Gas by Considering Flexible Load. Energy 2023, 273, 127203. [Google Scholar] [CrossRef]
  7. Zhu, S.; Wang, K.; González-Pino, I.; Song, J.; Yu, G.; Luo, E.; Markides, C.N. Techno-Economic Analysis of a Combined Heat and Power System Integrating Hybrid Photovoltaic-Thermal Collectors, a Stirling Engine and Energy Storage. Energy Convers. Manag. 2023, 284, 116968. [Google Scholar] [CrossRef]
  8. Pastore, L.M. Combining Power-to-Heat and Power-to-Vehicle Strategies to Provide System Flexibility in Smart Urban Energy Districts. Sustain. Cities Soc. 2023, 94, 104548. [Google Scholar] [CrossRef]
  9. Ren, F.; Lin, X.; Wei, Z.; Zhai, X.; Yang, J. A Novel Planning Method for Design and Dispatch of Hybrid Energy Systems. Appl. Energy 2022, 321, 119335. [Google Scholar] [CrossRef]
  10. Shi, Y.; Wang, H.; Li, C.; Negnevitsky, M.; Wang, X. Stochastic Optimization of System Configurations and Operation of Hybrid Cascade Hydro-Wind-Photovoltaic with Battery for Uncertain Medium- and Long-Term Load Growth. Appl. Energy 2024, 364, 123127. [Google Scholar] [CrossRef]
  11. Yan, Y.; Huang, C.; Guan, J.; Zhang, Q.; Cai, Y.; Wang, W. Stochastic Optimization of Solar-Based Distributed Energy System: An Error-Based Scenario with a Day-Ahead and Real-Time Dynamic Scheduling Approach. Appl. Energy 2024, 363, 123099. [Google Scholar] [CrossRef]
  12. Kim, S.; Choi, Y.; Park, J.; Adams, D.; Heo, S.; Lee, J.H. Multi-Period, Multi-Timescale Stochastic Optimization Model for Simultaneous Capacity Investment and Energy Management Decisions for Hybrid Micro-Grids with Green Hydrogen Production under Uncertainty. Renew. Sustain. Energy Rev. 2024, 190, 114049. [Google Scholar] [CrossRef]
  13. Marzband, M.; Azarinejadian, F.; Savaghebi, M.; Guerrero, J.M. An Optimal Energy Management System for Islanded Microgrids Based on Multiperiod Artificial Bee Colony Combined With Markov Chain. IEEE Syst. J. 2017, 11, 1712–1722. [Google Scholar] [CrossRef]
  14. Saffari, M.; Kia, M.; Vahidinasab, V.; Mehran, K. Integrated Active/Reactive Power Scheduling of Interdependent Microgrid and EV Fleets Based on Stochastic Multi-objective Normalised Normal Constraint. IET Gener. Transm. Distrib. 2020, 14, 2055–2064. [Google Scholar] [CrossRef]
  15. Maleki, A.; Askarzadeh, A. Optimal Sizing of a PV/Wind/Diesel System with Battery Storage for Electrification to an off-Grid Remote Region: A Case Study of Rafsanjan, Iran. Sustain. Energy Technol. Assess. 2014, 7, 147–153. [Google Scholar] [CrossRef]
  16. Khavari, F.; Badri, A.; Zangeneh, A. Energy Management in Multi-Microgrids Considering Point of Common Coupling Constraint. Int. J. Electr. Power Energy Syst. 2020, 115, 105465. [Google Scholar] [CrossRef]
  17. Rawa, M.; Al-Turki, Y.; Sedraoui, K.; Dadfar, S.; Khaki, M. Optimal Operation and Stochastic Scheduling of Renewable Energy of a Microgrid with Optimal Sizing of Battery Energy Storage Considering Cost Reduction. J. Energy Storage 2023, 59, 106475. [Google Scholar] [CrossRef]
  18. Ashraf, M.A.; Liu, Z.; Alizadeh, A.; Nojavan, S.; Jermsittiparsert, K.; Zhang, D. Designing an Optimized Configuration for a Hybrid PV/Diesel/Battery Energy System Based on Metaheuristics: A Case Study on Gobi Desert. J. Clean. Prod. 2020, 270, 122467. [Google Scholar] [CrossRef]
  19. Bolurian, A.; Akbari, H.; Mousavi, S. Day-Ahead Optimal Scheduling of Microgrid with Considering Demand Side Management under Uncertainty. Electr. Power Syst. Res. 2022, 209, 107965. [Google Scholar] [CrossRef]
  20. Konneh, K.V.; Masrur, H.; Othman, M.L.; Wahab, N.I.A.; Hizam, H.; Islam, S.Z.; Crossley, P.; Senjyu, T. Optimal Design and Performance Analysis of a Hybrid Off-Grid Renewable Power System Considering Different Component Scheduling, PV Modules, and Solar Tracking Systems. IEEE Access 2021, 9, 64393–64413. [Google Scholar] [CrossRef]
  21. Jiang, W.; Wang, X.; Huang, H.; Zhang, D.; Ghadimi, N. Optimal Economic Scheduling of Microgrids Considering Renewable Energy Sources Based on Energy Hub Model Using Demand Response and Improved Water Wave Optimization Algorithm. J. Energy Storage 2022, 55, 105311. [Google Scholar] [CrossRef]
  22. Jurasz, J.; Guezgouz, M.; Campana, P.E.; Kies, A. On the Impact of Load Profile Data on the Optimization Results of Off-Grid Energy Systems. Renew. Sustain. Energy Rev. 2022, 159, 112199. [Google Scholar] [CrossRef]
  23. Radosavljević, J.; Jevtić, M.; Klimenta, D. Energy and Operation Management of a Microgrid Using Particle Swarm Optimization. Eng. Optim. 2015, 48, 811–830. [Google Scholar] [CrossRef]
  24. Amara, S.; Toumi, S.; Salah, C.B.; Saidi, A.S. Improvement of Techno-Economic Optimal Sizing of a Hybrid off-Grid Micro-Grid System. Energy 2021, 233, 121166. [Google Scholar] [CrossRef]
  25. Goh, H.H.; Shi, S.; Liang, X.; Zhang, D.; Dai, W.; Liu, H.; Wong, S.Y.; Kurniawan, T.A.; Goh, K.C.; Cham, C.L. Optimal Energy Scheduling of Grid-Connected Microgrids with Demand Side Response Considering Uncertainty. Appl. Energy 2022, 327, 120094. [Google Scholar] [CrossRef]
  26. Yang, Z.; Ghadamyari, M.; Khorramdel, H.; Alizadeh, S.M.S.; Pirouzi, S.; Milani, M.; Banihashemi, F.; Ghadimi, N. Robust Multi-Objective Optimal Design of Islanded Hybrid System with Renewable and Diesel Sources/Stationary and Mobile Energy Storage Systems. Renew. Sustain. Energy Rev. 2021, 148, 111295. [Google Scholar] [CrossRef]
  27. Liu, X.; Zhao, M.; Wei, Z.; Lu, M. The Energy Management and Economic Optimization Scheduling of Microgrid Based on Colored Petri Net and Quantum-PSO Algorithm. Sustain. Energy Technol. Assess. 2022, 53, 102670. [Google Scholar] [CrossRef]
  28. Chennaif, M.; Maaouane, M.; Zahboune, H.; Elhafyani, M.; Zouggar, S. Tri-Objective Techno-Economic Sizing Optimization of Off-Grid and On-Grid Renewable Energy Systems Using Electric System Cascade Extended Analysis and System Advisor Model. Appl. Energy 2022, 305, 117844. [Google Scholar] [CrossRef]
  29. Davoudkhani, I.F.; Dejamkhooy, A.; Nowdeh, S.A. A Novel Cloud-Based Framework for Optimal Design of Stand-Alone Hybrid Renewable Energy System Considering Uncertainty and Battery Aging. Appl. Energy 2023, 344, 121257. [Google Scholar] [CrossRef]
  30. Nowdeh, S.A.; Naderipour, A.; Davoudkhani, I.F.; Guerrero, J.M. Stochastic Optimization—Based Economic Design for a Hybrid Sustainable System of Wind Turbine, Combined Heat, and Power Generation, and Electric and Thermal Storages Considering Uncertainty: A Case Study of Espoo, Finland. Renew. Sustain. Energy Rev. 2023, 183, 113440. [Google Scholar] [CrossRef]
  31. Alanazi, A.; Alanazi, M.; Nowdeh, S.A.; Abdelaziz, A.Y.; El-Shahat, A. An Optimal Sizing Framework for Autonomous Photovoltaic/Hydrokinetic/Hydrogen Energy System Considering Cost, Reliability and Forced Outage Rate Using Horse Herd Optimization. Energy Rep. 2022, 8, 7154–7175. [Google Scholar] [CrossRef]
  32. Yue, X.; Pye, S.; DeCarolis, J.; Li, F.G.N.; Rogan, F.; Gallachóir, B.Ó. A Review of Approaches to Uncertainty Assessment in Energy System Optimization Models. Energy Strategy Rev. 2018, 21, 204–217. [Google Scholar] [CrossRef]
  33. Singh, V.; Moger, T.; Jena, D. Uncertainty Handling Techniques in Power Systems: A Critical Review. Electr. Power Syst. Res. 2022, 203, 107633. [Google Scholar] [CrossRef]
  34. Saini, V.K.; Al-Sumaiti, A.S.; Kumar, R. Data Driven Net Load Uncertainty Quantification for Cloud Energy Storage Management in Residential Microgrid. Electr. Power Syst. Res. 2024, 226, 109920. [Google Scholar] [CrossRef]
  35. Li, Z.; Simancas, N.S.N.; Vianna, S.S.V.; Zhang, B. A Mathematical Model for Hydrogen Dispersion Cloud Based on Dimensional Analysis and Computational Fluid Dynamics (CFD). Int. J. Hydrog. Energy 2024, 60, 229–240. [Google Scholar] [CrossRef]
  36. MiarNaeimi, F.; Azizyan, G.; Rashki, M. Horse Herd Optimization Algorithm: A Nature-Inspired Algorithm for High-Dimensional Optimization Problems. Knowl.-Based Syst. 2021, 213, 106711. [Google Scholar] [CrossRef]
  37. Abualigah, L.; Diabat, A.; Zitar, R.A. Orthogonal Learning Rosenbrock’s Direct Rotation with the Gazelle Optimization Algorithm for Global Optimization. Mathematics 2022, 10, 4509. [Google Scholar] [CrossRef]
  38. Hemmati, M.; Mirzaei, M.A.; Abapour, M.; Zare, K.; Mohammadi-Ivatloo, B.; Mehrjerdi, H.; Marzband, M. Economic-Environmental Analysis of Combined Heat and Power-Based Reconfigurable Microgrid Integrated with Multiple Energy Storage and Demand Response Program. Sustain. Cities Soc. 2021, 69, 102790. [Google Scholar] [CrossRef]
  39. Liu, B. Optimal Scheduling of Combined Cooling, Heating, and Power System-Based Microgrid Coupled with Carbon Capture Storage System. J. Energy Storage 2023, 61, 106746. [Google Scholar] [CrossRef]
  40. Zhou, Y.; Min, C.; Wang, K.; Xie, L.; Fan, Y. Optimization of Integrated Energy Systems Considering Seasonal Thermal Energy Storage. J. Energy Storage 2023, 71, 108094. [Google Scholar] [CrossRef]
  41. Homayoun, R.; Bahmani-Firouzi, B.; Niknam, T. Multi-objective Operation of Distributed Generations and Thermal Blocks in Microgrids Based on Energy Management System. IET Gener. Transm. Distrib. 2021, 15, 1451–1462. [Google Scholar] [CrossRef]
  42. Kennedy, J.; Eberhart, R. Particle Swarm Optimization. In Proceedings of the ICNN’95—International Conference on Neural Networks, Perth, WA, Australia, 27 November–1 December 1995. [Google Scholar] [CrossRef]
  43. Zhao, W.; Zhang, Z.; Wang, L. Manta Ray Foraging Optimization: An Effective Bio-Inspired Optimizer for Engineering Applications. Eng. Appl. Artif. Intell. 2020, 87, 103300. [Google Scholar] [CrossRef]
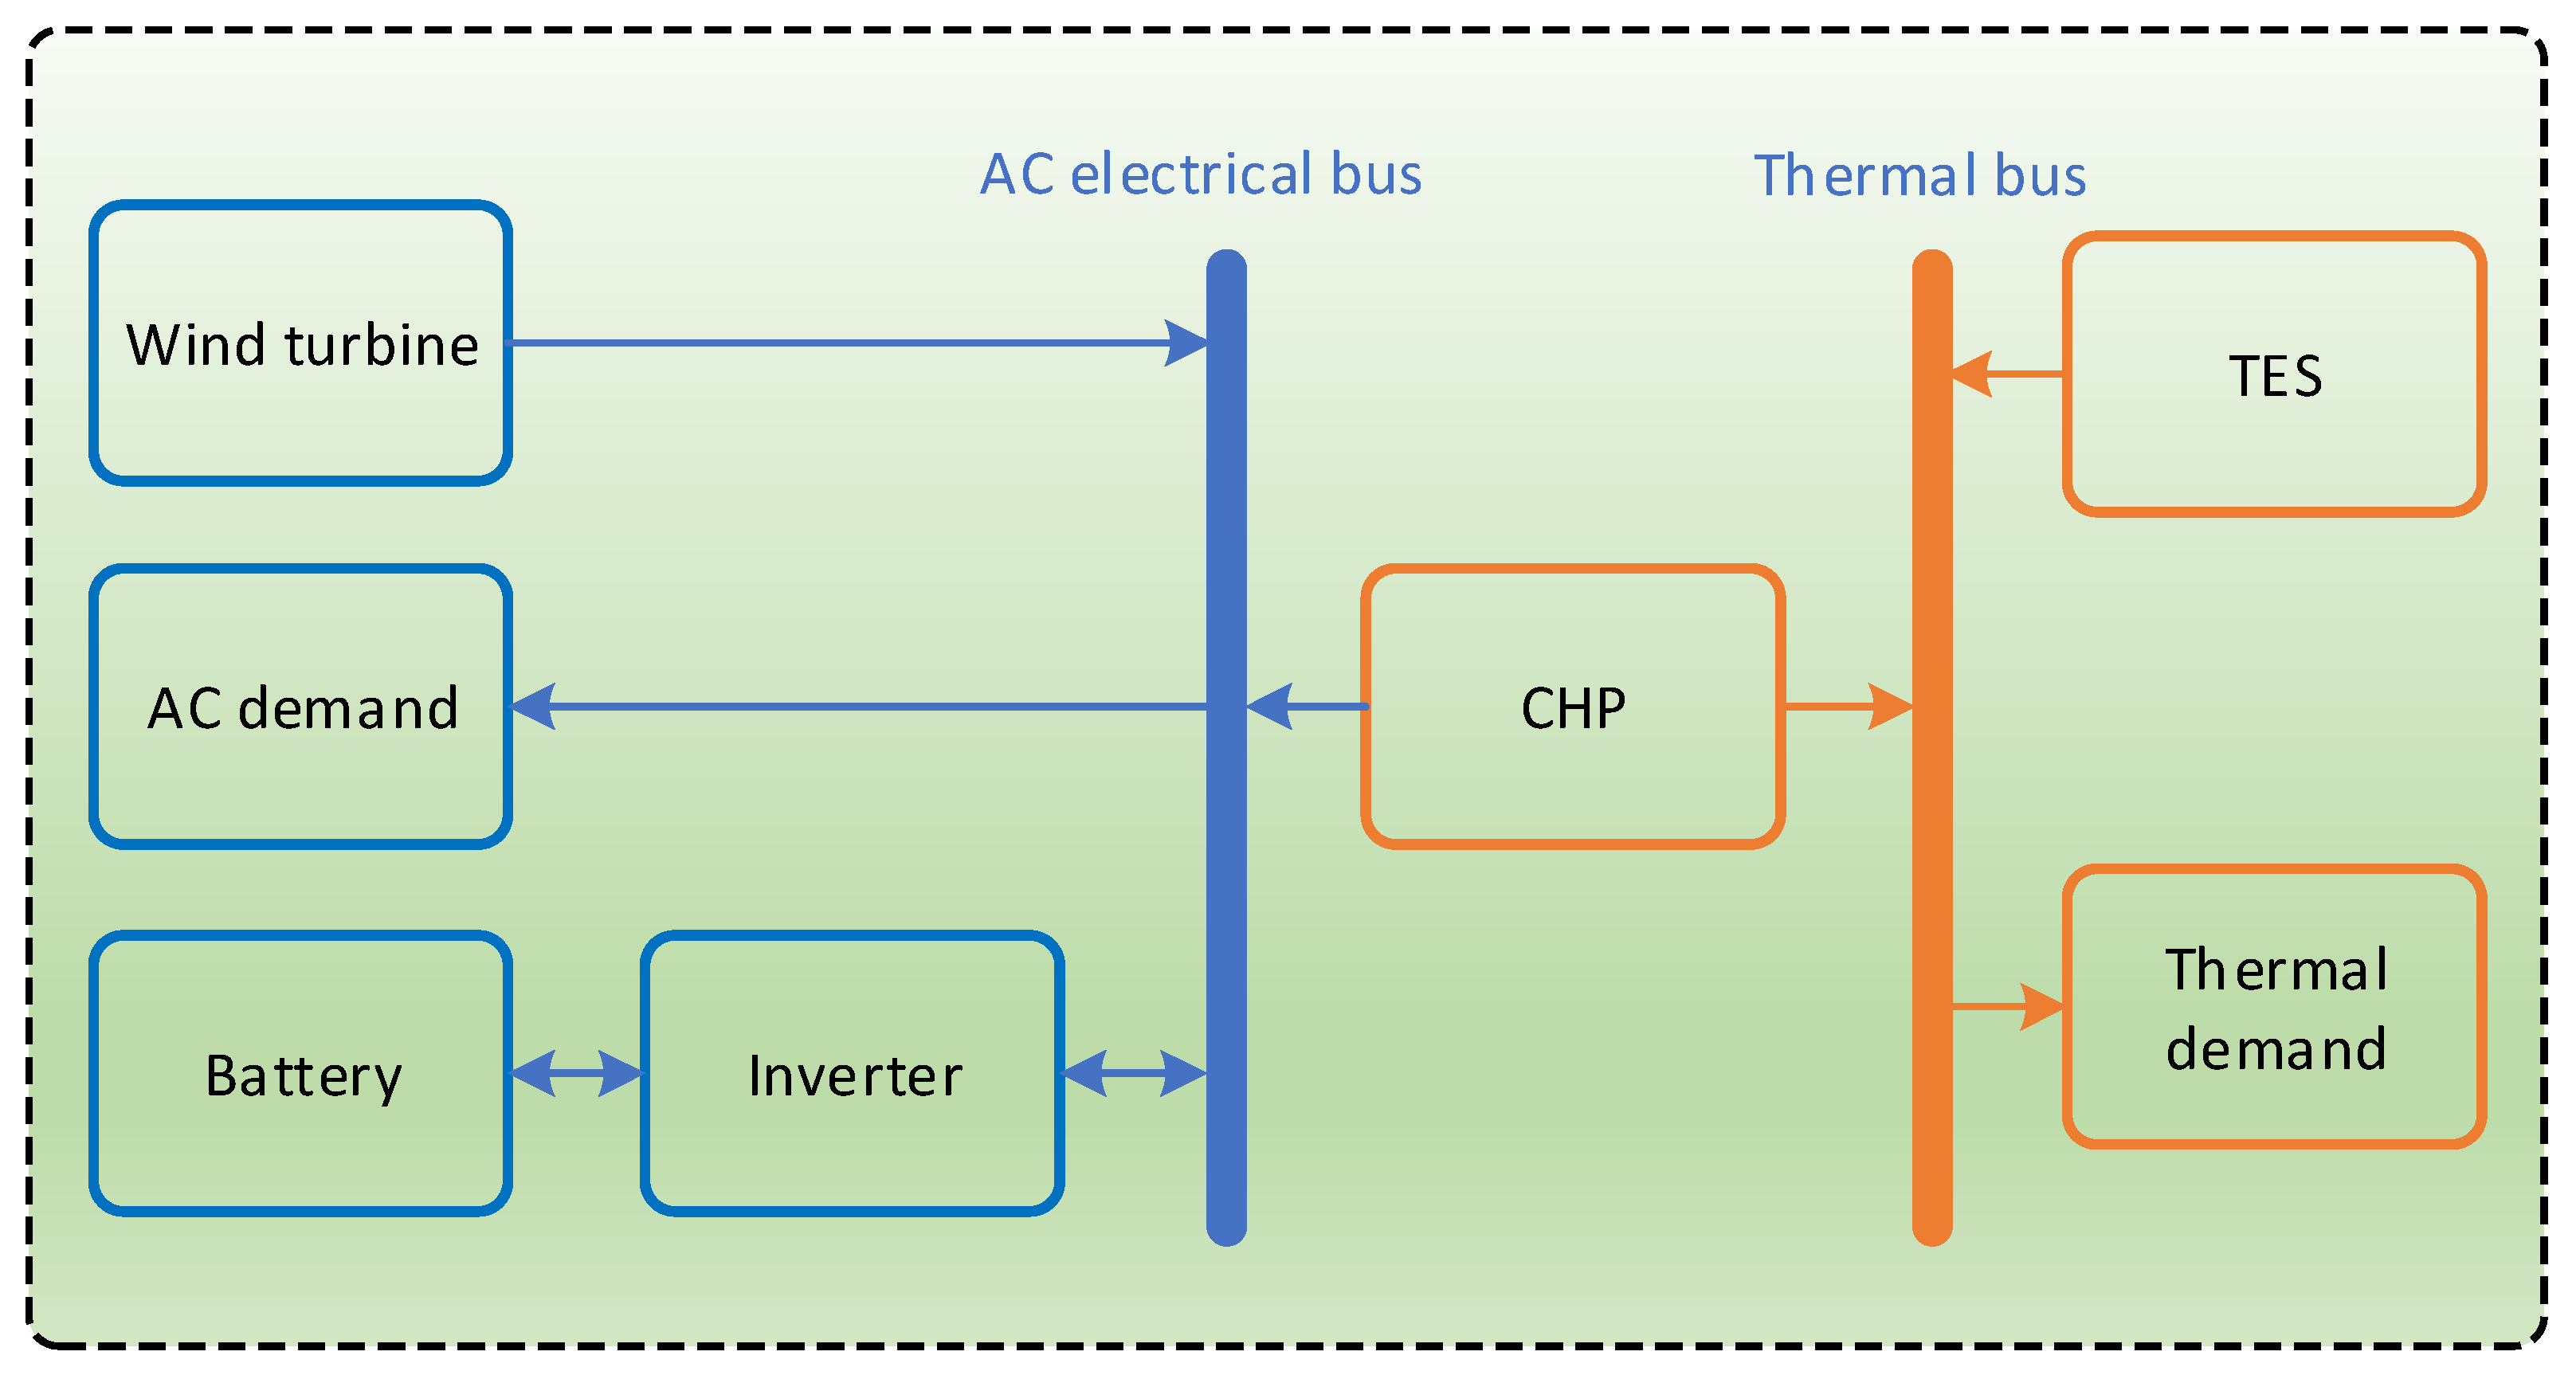
Figure 1. The hybrid Wind/Battery/CHP/TES energy system.
Electronics 13 02471 g001
Figure 2. The cloud model and its droplets react to fluctuations in parameters (ad) [29].
Electronics 13 02471 g002
Figure 3. The mimicking conduct displayed by the horses.
Electronics 13 02471 g003
Figure 4. The IHHO Flowchart.
Electronics 13 02471 g004
Figure 5. Normalized loading of electrical and thermal demand over 24 h.
Electronics 13 02471 g005
Figure 6. Normalized wind speed over 24 h.
Electronics 13 02471 g006
Figure 7. Contribution of generation, storage units, and electrical demand over 24 h in scenario 1.
Electronics 13 02471 g007
Figure 8. Contribution of resources, storage units, and electrical demand over 24 h in scenario 2.
Electronics 13 02471 g008
Figure 9. Contribution of CHP and thermal demand over 24 h in scenario 2.
Electronics 13 02471 g009
Figure 10. Contribution of resources, storage units, and electrical demand over 24 h in scenario 3.
Electronics 13 02471 g010
Figure 11. Contribution of CHP and TESs, and thermal demand over 24 h in scenario 3.
Electronics 13 02471 g011
Figure 12. Convergence process of different optimizers solving scenario 3.
Electronics 13 02471 g012
Figure 13. CM droplet distribution for wind speed (a), electrical loading (b), and thermal loading (c).
Electronics 13 02471 g013
Figure 14. The cloud droplet distribution for cost in scenarios 1 to 3.
Electronics 13 02471 g014
Table 1. The techno-economic data of the resources and storage [15,26,41].
ResourceParameterValue
WTpr (kW)1
vci (m/s)3
vr (m/s)9
vco (m/s)20
Peak wind speed (m/s)15
n ¯ W T 35
αWT (USD)3200
ϖ W T (USD/year)5
Life span (year)20
CHPηT (%)38
ηL (%)5
ηH (%)38
epc (USD/kg)0.0037
fpc (USD/l)1.24
χc (l/kWh)0.246
γc (l/kWh)0.0845
βc (kg/kW)3.25
P ¯ C (kW)11
αC (USD/kW)901.65
ϖ C (USD/kW/year)4
Life span (year)20
κ (%)10
CF (%)70
Battery E ¯ B (kWh)1.35
E ¯ B (kWh)0.15
η B c / η B d (%)90
ϖ 0.0002
n ¯ B 90
αB (USD)130
ϖ B (USD/year)0
Life span (year)5
Inverter P ¯ I (kW)3
ηI (%)95
αI (USD)2000
ϖ I (USD/year)0
Life span (year)10
TES E ¯ T (kWh)1.5
E ¯ T (kWh)0.15
η T c / η T d (%)78
0.0002
n ¯ T 10
αT (USD)210
ϖ T (USD/year)1.6
Life span (year)10
Table 2. Sizing results of resources and storage in scenario 1.
DeviceWind TurbineBattery Inverter Cost (USD/Year)
Number/Value2210867638
Table 3. Cost components of resources and storage in scenario 1.
AIC (USD/year)AMC (USD/year)
Wind turbineBattery Inverter TESCHPAICWTBattery Inverter TESCHPAMC
352028081200--752811000--110
AOC (USD/year)AEC (USD/year)
Wind turbineBattery Inverter TESCHPAOCWTBattery Inverter TESCHPAEC
Without cost-0Without cost-0
Table 4. Sizing results of resources and storage in scenario 2.
Device Wind Turbine Battery Inverter CHP Capacity (kW) Cost (USD/Year)
Number/Value96538.776856.59
Table 5. Cost components of resources and storage in scenario 2.
AIC (USD/year)AMC (USD/year)
Wind turbineBattery Inverter TESCHPAICWTBattery Inverter TESCHPAMC
14401690600-395.394125.394500-35.0880.08
AOC (USD/year)AEC (USD/year)
Wind turbineBattery Inverter TESCHPAOCWTBattery Inverter TESCHPAEC
Without cost2111.282111.28Without cost539.84539.84
Table 6. Sizing results of resources and storage in scenario 3.
DeviceWind TurbineBatteryInverterCHP Capacity (kW)TESCost (USD/Year)
Number/Value86248.4256777.61
Table 7. Cost components of resources and storage in scenario 3.
AIC (USD/year)AMC (USD/year)
Wind TurbineBattery Inverter TESCHPAICWTBattery Inverter TESCHPAMC
12801612800105379.614176.614000833.6881.68
AOC (USD/year)AEC (USD/year)
Wind TurbineBattery Inverter TESCHPAOCWTBattery Inverter TESCHPAEC
Without cost2008.872008.87Without cost510.45510.45
Table 8. Comparison of the planning cost for different scenarios using the IHHO.
Scenario/ItemCost (USD/Year)
Scenario 17638.00
Scenario 26856.59
Scenario 36646.61
Table 9. Statistical analysis of different optimizers solving scenario 3.
ScenarioBest Cost (USD)Mean Cost (USD)Worst Cost (USD)Std (USD)CT (s)
IHHO6646.616664.036675.11146.32115
HHO6655.046676.046690.04309.33144
PSO6652.326672.616684.36247.59138
MRFO6673.276688.546705.02366.15149
Table 10. CM parameters of wind, and electrical and thermal load.
CM ParameterDemand
ExBase State
En10% Ex
He10% En
β5
γ20
Table 11. Values of Ex, En, and He for the stochastic optimization.
Scenario 1Scenario 2Scenario 3
Ex79447145.156910.48
En64.1157.6755.77
He12.611.3310.96
Table 12. Comparison of the deterministic and stochastic optimization results.
Scenario/ItemCost (USD/Year)The Cost Increase Percentage Due to Uncertainties (%)
DeterministicStochastic
Scenario 17638.007944.004.00
Scenario 26856.597145.154.20
Scenario 36646.616910.483.96
Disclaimer/Publisher’s Note: The statements, opinions and data contained in all publications are solely those of the individual author(s) and contributor(s) and not of MDPI and/or the editor(s). MDPI and/or the editor(s) disclaim responsibility for any injury to people or property resulting from any ideas, methods, instructions or products referred to in the content.