Article

Development of an On-Shaft Vibration Sensing Module for Machine Wearable Rotor Imbalance Monitoring

School of Mechanical Engineering, Hebei University of Technology, Tianjin 300401, China
*
Author to whom correspondence should be addressed.
Electronics 2024, 13(13), 2466; https://doi.org/10.3390/electronics13132466
Submission received: 29 April 2024 / Revised: 30 May 2024 / Accepted: 19 June 2024 / Published: 24 June 2024

Abstract

:
Rotor imbalance is considered to be one of the main mechanical faults of rotating machinery; which may result in bearing damage and even catastrophic system failure. Recent progress in the Internet of Things (IoT) has promoted the application of novel sensing and computing techniques in the industry, and it is promising to employ novel IoT techniques for imbalance detection to avoid potential failures. Existing sensing techniques suffer from the impact of bearing structure dynamics, loss of accuracy during their lifetime, and security risks introduced by the sensor cabling and supports, which may, in turn, interfere with the machine operations due to inappropriate design and installation. This investigation provides an on-shaft machine wearable vibration sensing technique for effectively monitoring the running state of rotors while minimizing the interference with their operations. In this work, key investigations include the following: (1) theoretical modeling and an analysis of rotor imbalance, and its measurement with an on-shaft micro-electromechanical system (MEMS) accelerometer; (2) the development of a wirelessly powered, cordless on-shaft vibration measurement (OSVM) sensor for unobtrusive sensing of the vibration of rotating shafts; (3) the in-sensor computing design for optimizing the distribution of computing resources and decreasing data transmission. The tests and evaluation of the proposed techniques were conducted with a rotor test rig to demonstrate their feasibility. The presented investigation is a typical example of applying new sensing and computing paradigms to improve the flexibility and convenience of applications, which is a good reference for related investigations and practices.

1. Introduction

Rotating machines are subject to fatigue, wear, and deformation, which may cause rotor imbalance, coupling misalignment, and bearing deterioration. Rotor imbalance is considered to be the most common cause of vibrations, especially at high speeds [1]. It may introduce serious centrifugal imbalance forces that lead to damage to bearings and, finally, to the destruction of machines [2]. Therefore, rotor imbalance is a basic concern in the design and operation of machinery. Recent progress in Internet of Things (IoT) fields, including novel sensing and computing techniques, as well as artificial intelligence (AI), creates new opportunities for the condition-based maintenance (CbM) of machinery [3]. With versatile supporting techniques, flexible sensing devices that are customized to the working conditions of rotating machines for accurate data acquisition are fundamental for high-quality CbM.
Rotor imbalance may result in variations in vibration, sound, temperature, and current, which can be employed for the analysis of the operation status of machine systems. Among the different types of signals, vibration measurement is considered to be the most effective and commonly used choice for the condition monitoring of rotating machinery [4,5]. There are many sensing techniques available for shaft vibration detection through the measurement of displacement, speed, or acceleration. Piezoelectric sensors are usually mounted on the housing of machines for vibration analyses; these are noteworthy for their simple structures and ease of use [6]. Displacement sensing techniques, including eddy current, ultrasound, fiber Bragg grating (FBG), photoelectric, capacitive, inductive, and electrostatic methods, are commonly used for contactless vibration sensing and analysis [7]. Micro-electromechanical system (MEMS) accelerometers have been the object much research effort for machine condition monitoring due to their low cost, miniature size, and multi-dimensional data output [8]. Although recent years have witnessed remarkable progress, flexible sensing techniques with high sensitivity and low interference for running machines deserve further investigation.
Recent technical progress in sensing, computing, communication, and power supply has reshaped the paradigm of the industrial information systems. The new concepts of near-sensor and in-sensor computing highlight the in-depth integration of sensing and computing, which has also provided new methods for enhancing the performance of sensing techniques [9]. Motivated by the above technical innovations, this investigation aims to provide an on-shaft vibration measurement (OSVM) sensor system with minimized interference in the machine operations by integrating an MEMS accelerometer, wireless power transfer (WPT), and in-sensor computing for machine wearable rotor imbalance monitoring.
The rest of this paper is structured as follows: Section 2 presents related studies on vibration sensing for rotor condition monitoring. Section 3 establishes the theoretical fundamentals of rotor imbalance and its on-shaft acceleration measurement. Section 4 describes the development of the proposed machine wearable OSVM sensor. Section 5 presents the test and evaluation. Finally, Section 6 concludes this work.

2. Related Studies of Vibration-Based Imbalance Detection

Rotor vibration monitoring techniques mainly rely on the measurement of force, displacement, and acceleration to implement the condition monitoring of rotating machines. This section surveys recent technical progress and determines the common challenges facing state-of-the-art research and practices. Table 1 gives a classification of rotor vibration sensing techniques, including (1) on-bearing housing contact sensing, (2) non-contact shaft displacement sensing, and (3) on-shaft acceleration sensing.

2.1. Vibration-Based Condition Monitoring

On-bearing housing contact vibration sensing techniques with piezoelectric devices and MEMS accelerometers are the most common approaches for the measurement of force acting on a rotating shaft. Tarabini and Scaccabarozzi [10] proposed a method for wheel unbalance detection relying on a balancing machine capturing vibration signals through the charge outputs of two piezoelectric force sensors. Yamamoto et al. [11] presented an experimental setup for vibration measurement and imbalance fault detection of a rotating machine using ceramic piezoelectric force sensors. Ambur and Rinderknecht [12] used piezoelectric actuator as a self-sensing technique to assess bearing displacement and detect the faults of a rotor by the deflection of the piezos. Koene et al. [13] introduced a wireless MEMS accelerometer for monitoring the vibration of large rotors as an IoT solution to get rid of the cabling, which demonstrated the performance compared to tradition solutions with piezo-based accelerometers and wire-based communication. On-bearing housing contact sensing is attractive due to its simple structure, easy installation, and long service life. However, it is an indirect measurement technique for rotor imbalance analysis, which may suffer from impacts within the bearing structure dynamics and a loss of accuracy during its lifetime.
For certain cases when the mass of the machine casing is much greater than that of the rotor, conventional contact sensing techniques may not be applicable. Non-contact shaft displacement sensing techniques based on proximity sensors including optical, conductive, ultrasonic, laser, eddy current, capacitive, electrostatic, RF Doppler are promising alternatives. Chen et al. [14] employed two orthogonal laser displacement sensors for shaft vibration measurements to evaluate the influence of wear on bearing lubrication performance. Li et al. [15] and Li et al. [16] conducted investigations of FBG-based vibration sensing, which proved the accuracy and effectiveness for harsh environments. Roy et al. [17] introduced a RF-strobe based sensing technique to estimate the vibrational frequencies with the reflected-RF Doppler spectrum obtained using a stroboscope. Chai et al. [18] employed a high-speed industrial camera and proposed a semantic segmentation network-based algorithm to sense the vibration displacement of a rotating body. He et al. [19] presented a progressive video super-resolution construction network to enhance the image feature information for vibration displacement measurements; those authors demonstrated the accuracy of this approach with experimental studies. The aforementioned optical, laser, FBG, and RF sensors may be competitive in terms of sensitivity and signal quality, but they may also face challenges in providing space for sensing devices and cabling, and may suffer from higher cost as well.
In contrast, electronic sensing techniques are also sensitive but more competitive in cost-efficiency. Reda and Yan [1] presented an electrostatic sensing technique for online, continuous, and non-contact measurements of rotary shaft displacement due to imbalance faults, achieving a relative error in ±0.6%. Lee et al. [20] proposed a magneto-strictive patch sensor system for the battery-less and real-time measurement of torsional vibrations of a rotating shaft. Okabe and Tanaka [21] described an ultrasonic sensor-based method for shaft vibration detection by measuring the propagation time of the ultrasonic wave from the sensor to the shaft surface. Kakaley et al. [22] introduced a non-contact variable reluctance (VR) sensor system for the simultaneous estimation of the torque, speed, and axial translation of high-speed rotating shafts. The non-contact shaft vibration sensing techniques may obtain signals of high sensitivity and good quality. However, the needs of space and cabling for sensing devices and the impact of the ambient environment are their underlying limitations.

2.2. MEMS Sensor-Based On-Shaft Acceleration Sensing

To overcome the limitations of the abovementioned techniques, MEMS-based OSVM has become a promising solution. The integration of MEMS accelerometers with wireless communication enables on-shaft vibration sensing and analysis. Since a sensor is mounted on a shaft to determine the vibration directly, it is, in theory, more competitive in terms of sensitivity and signal quality, which results in less impact on system operation as well.
Pedotti et al. [23] presented a WiFi/Bluetooth low energy (BLE) wireless network consisting of two low-cost MEMS accelerometers, one on the shaft and the other on the support table, for rotating machine vibration diagnostics. Those authors verified the techniques with an electric bicycle motor. Pozzato et al. [4] presented a MEMS-enabled automobile wheel balancer for automatic unbalance detection with a rotating sensor attached to the rotating shaft and a fixed sensor attached to the support; the setup produced reasonable accuracy. Arebi et al. [24] presented a wireless MEMS accelerometer sensor mounted directly on a rotating shaft for misalignment detection and demonstrated its performance by comparing it with three different sensing techniques: a laser vibrometer, a bearing housing mounted accelerometer, and a shaft encoder. Feng et al. [25] presented a reciprocating compressor condition monitoring technique by mounting a three axis MEMS acceleration sensor close to the center of the flywheel to reconstruct the tangential acceleration for fault detection and diagnostics. Jiménez et al. [26] presented a rotor vibration sensing technique by embedding a wireless MEMS accelerometer in a hollow rotor to measure vibrations in a synchronously rotating frame of reference. Experimental studies demonstrated the feasibility for measuring the magnitude and phase of synchronous vibrations with appropriate signal processing. Koene et al. [27] presented an on-shaft wireless universal measurement unit (UMU) featuring a high measurement range and easy mounting, which allowed the measurement of torsional and lateral vibrations by applying two accelerometers to the opposite sides of a shaft. In addition, Li et al. [28] introduced an on-rotor sensor (ORS) technique for vibration sensing and online monitoring of a shaft tuning process. It demonstrated a promising way for online real-time assessments of manufacturing quality. Okhionkpamwonyi et al. [29] presented an ORS method composed of a tri-axial MEMS accelerometer installed directly on the end of the rotating crankshaft to fully capture its rotational dynamics. Those authors found that kurtosis variations with oil temperature showed good agreement with classic stribeck characteristics.
Related studies have already established the fundamentals of rotor dynamics for on-rotor or on-shaft vibration sensing in different applications. The MEMS accelerometer and wireless communication are employed to sample the 3-axis accelerometer at high sampling rates to determine the vibration parameters with appropriate data processing algorithms. It is widely accepted that the on-shaft sensing method introduces less impact from the bearing housing vibration, and therefore, that it has the potential to capture the dynamic characteristics of the rotating shaft more accurately. But if the center of mass for the sensing modules does not coincide with the radial center of the shaft, the balancing should be compensated in order to achieve accurate measurements. The light weight of the sensing module is a key parameter to determine its sensing performance. However, the employment of batteries as the power source for the present solutions may significantly increase the weight of such a sensing module. Therefore, innovations in lightweight design and novel computing paradigms could enhance its sensing performance and are topics that deserve further investigation.

2.3. Integration of Novel Sensing and Computing Techniques

Most wireless sensors rely on miniature and energy-efficient microcontroller units (MCUs) and wireless communication modules, which may limit their system performance. The optimization of hardware design and data processing has become a promising way to improve the system performance. To this end, Vitolo et al. [30] integrated a field programmable gate array (FPGA) with inertial MEMS for in-sensor computing-based low-power detection and predictive maintenance. Moni et al. [31] presented a wearable biosensor system with in-sensor adaptive learning for hand gesture classification. To handle the large amount of data generated with the high sampling rate, Yin et al. [2] presented a three-dimensional data compression method. In addition, some novel algorithms are introduced to this field for multi-sensor data fusion and intelligent processing. Xia et al. [32] provided a convolutional neural network (CNN)-based method for rotating machinery fault diagnosis by introducing multiple acceleration sensors, which achieved higher diagnosis accuracy. For practical industrial applications, a high sampling rate is expected to determine the high frequency features, which may raise challenges for the computing and transmission of data. Therefore, the optimization and customization in the hardware and software design of a sensor system could potentially alleviate the resource limitations regarding computation and communication and effectively enhance the system performance.

2.4. The Scope of This Investigation

Admittedly, MEMS accelerometer-based wireless sensing for OSVM has been proven to be a promising solution. The wireless sensors mounted on shafts are normally battery powered, the size and weight of which may impact the measurement accuracy and the machine operations. The optimization of the sensing module in terms of miniaturization, light weight, and data processing for on-rotor wearable applications with minimal interference to the operations of the machine becomes a promising way to improve the performance of vibration sensing and rotor imbalance monitoring.
This investigation aims to provide a shaft-end mounted miniature and lightweight OSVM sensor solution for unobtrusive machine wearable sensing of rotor imbalance. The foci of this investigation include the following: (1) The theoretical modelling and analysis of the imbalance of a rotating shaft and its measurement with a shaft-end mounted MEMS accelerometer; (2) The development of a wirelessly powered cordless OSVM sensor device for flexible machine wearable vibration monitoring; (3) The in-sensor computing design for the optimization of computing resource distribution and decrease of data transmission bandwidth for online evaluations.

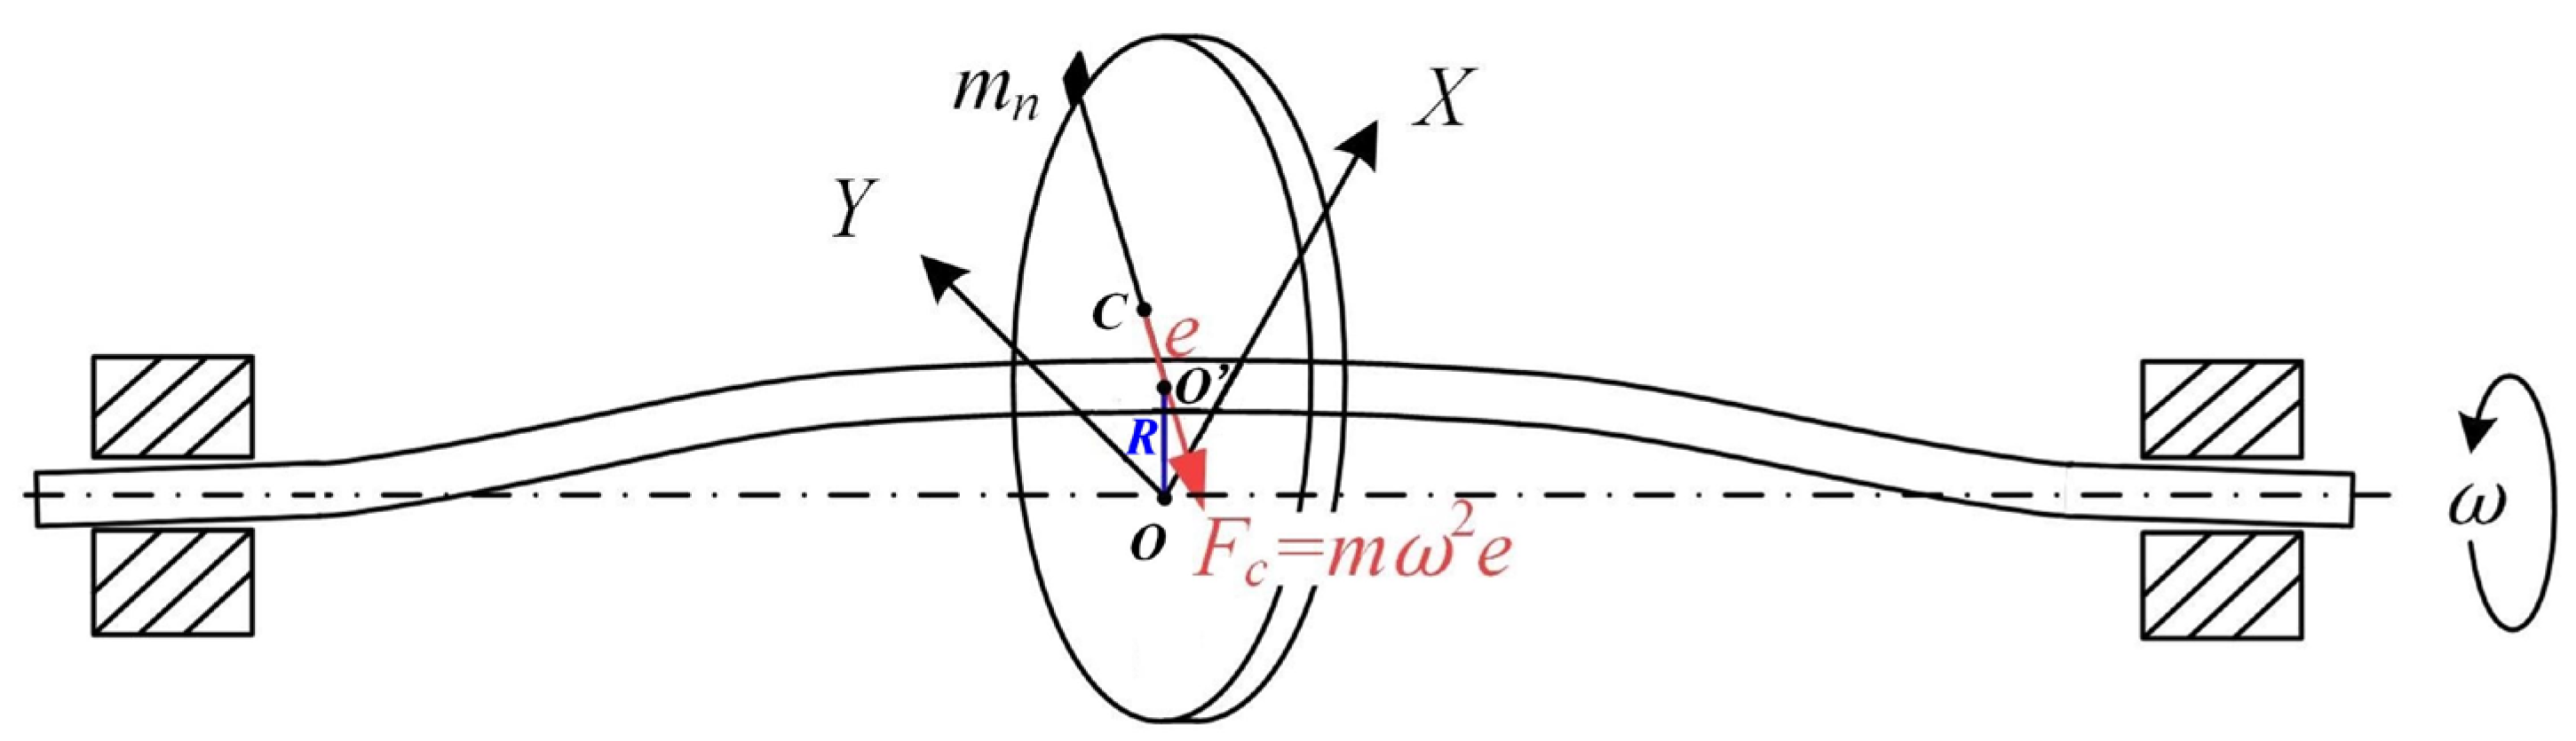
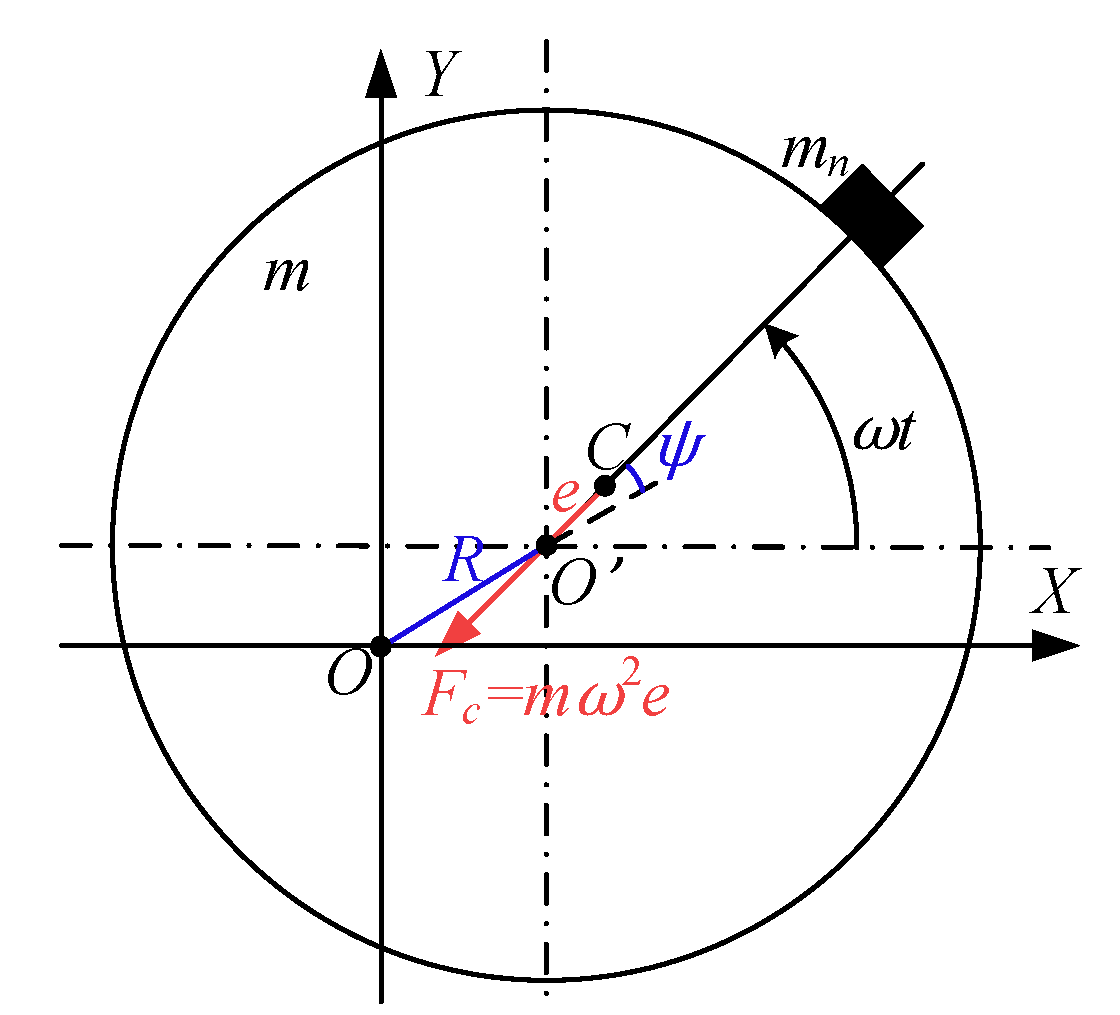
3. Theoretical Analysis of Rotor Imbalance

In this section, the variation of the shaft-end mounted accelerometer caused by changes of parameters such as eccentricity, centrifugal force, and dynamic deflection due to the imbalance of the rotating shaft is analyzed. The theoretical foundation for the on-shaft vibration sensing and analysis of rotor imbalance will be established.

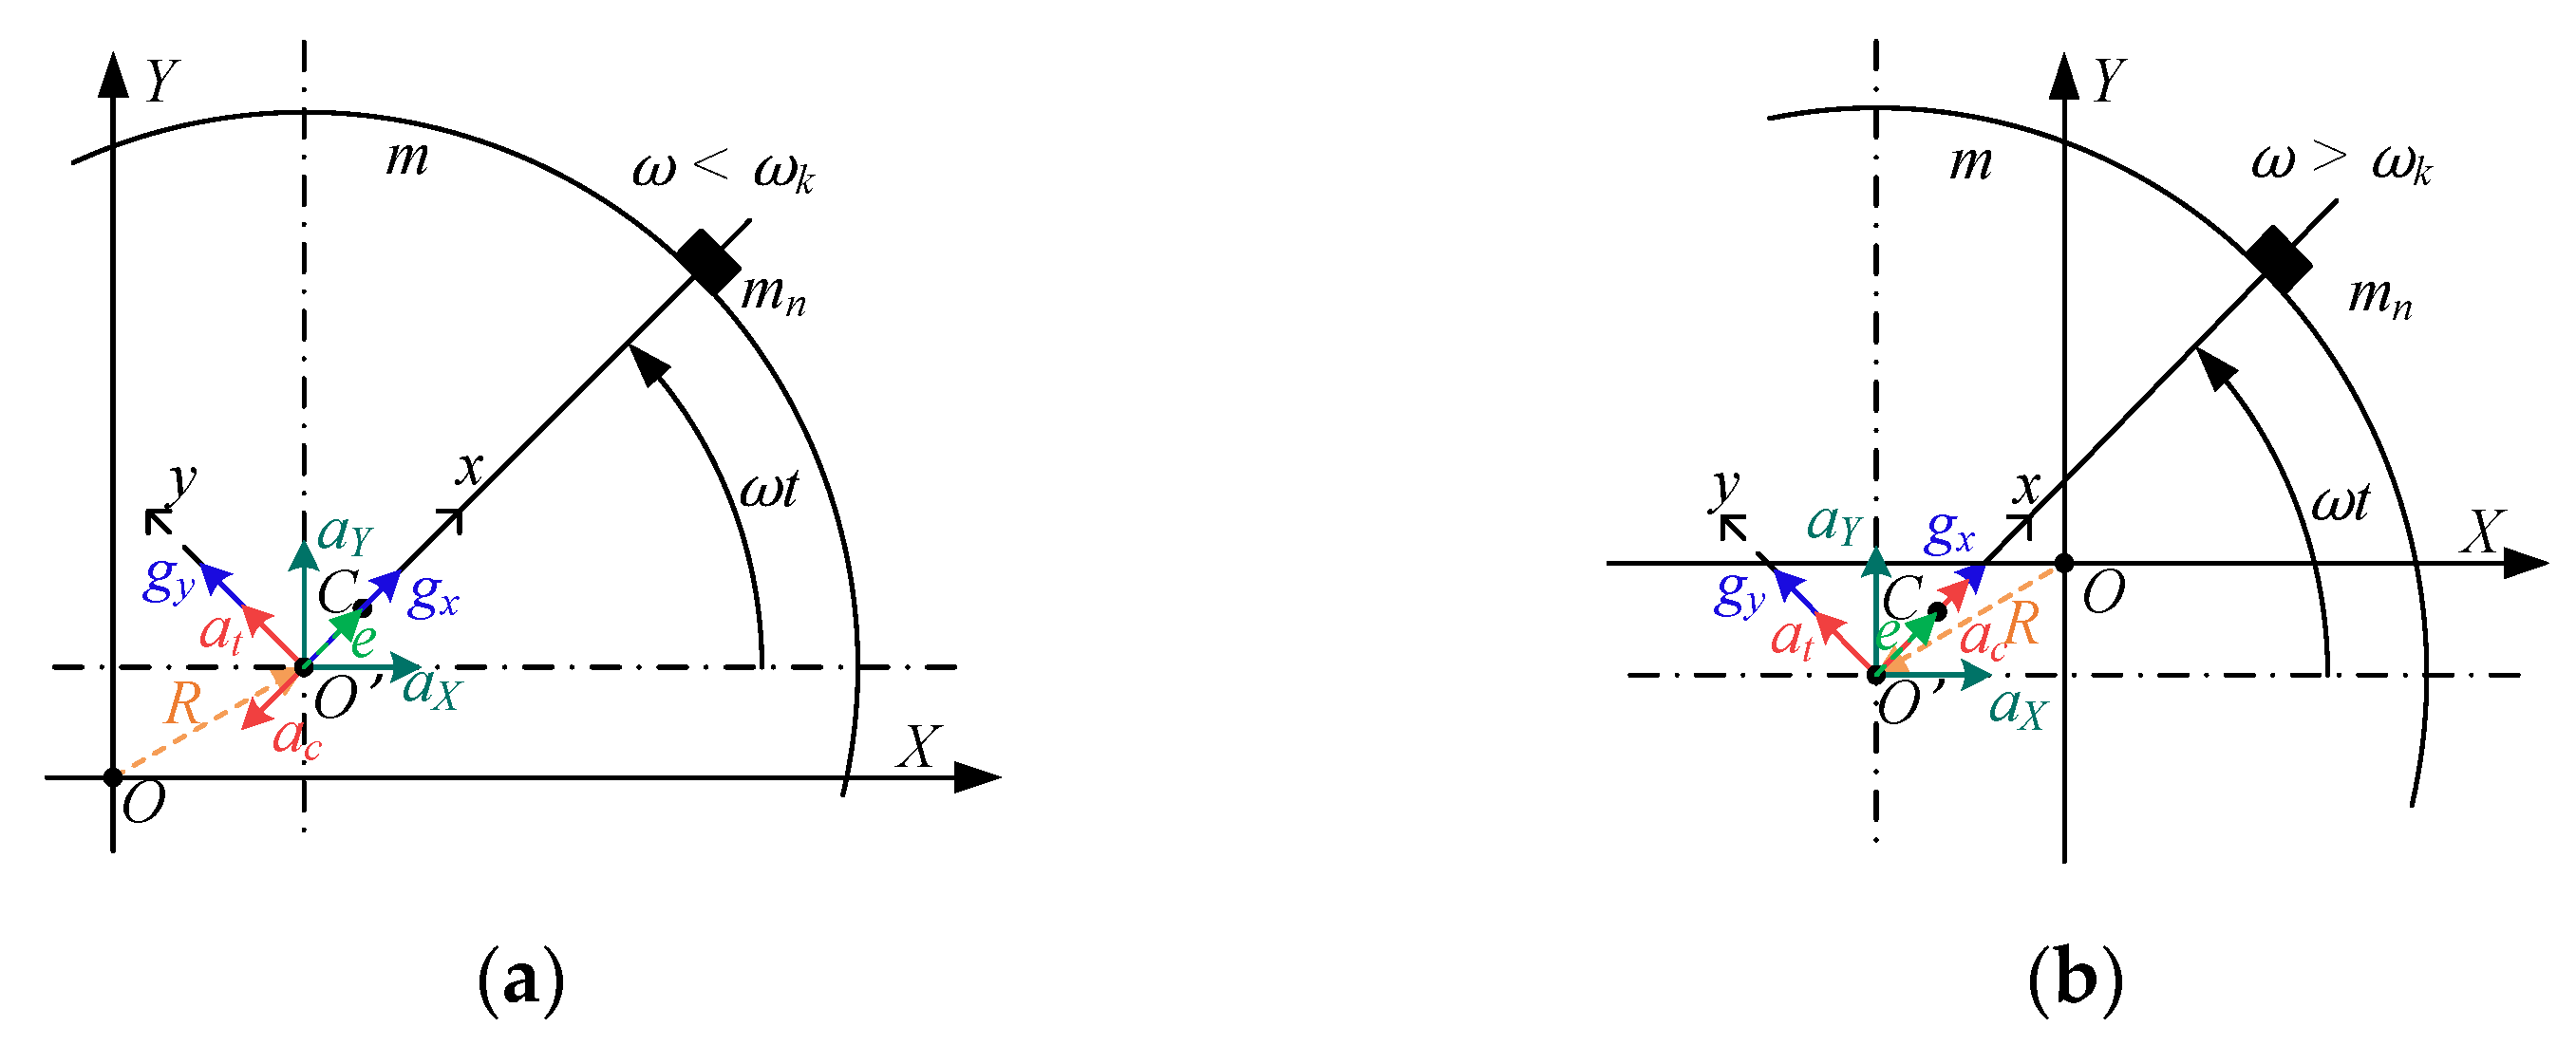
3.1. The Mechanism of Rotor Imbalance

To verify the influence of imbalance on a rotating shaft, it is a priority to establish a mathematical model of rotor imbalance. The relationship between the motion trajectory of the shaft center and rotational speed ω and eccentricity e needs to be clarified. An imbalanced rotor is shown in Figure 1; the modeling and analysis were conducted by ignoring the axial displacement of the cross section caused by static deformation and axial bending deformation.
Rotor imbalance can be considered as an imbalance mass mn on a balanced rotating disk, where the centroid shifts from the geometric center O′ to C with an eccentricity e. When the disk rotates at rotational frequency ω, the centrifugal force Fc caused by the eccentricity makes the shaft bend, resulting in dynamic deflection R, and then the geometric center O′ of the disk deviates from rotation center O [33,34].
The instantaneous position of the disk is described in Figure 2, where O is the coordinate origin, and O′ is the geometric center with a coordinate (x, y). Elastic restoring force F of the shaft acts on the disc due to the dynamic deflection, and the disc is subjected to viscous external damping force F′ in motion. According to the centroid motion theorem, the product of the mass of the centroid and the acceleration of the centroid equals the principal vector of the external force [35,36]. Therefore, the motion equation of centroid C is given by:
m x ¨ c = F x + F x = c x ˙ k x m y ¨ c = F y + F y = c y ˙ k y
where c and k are the viscous damping coefficient and transverse bending stiffness coefficient of the shaft, respectively. Coordinate of C is given by:
x c = x + e cos ω t y c = y + e sin ω t
Therefore, the differential equation of motion of the geometry center O’ is given by:
m x ¨ + c x ˙ + k x = m e ω 2 cos ω t m y ¨ + c y ˙ + k y = m e ω 2 sin ω t
Then, the solution can be obtained as follows:
x = e ω 2 ( ω n 2 ω 2 ) 2 + ( 2 ξ ω n ω ) 2 cos ( ω t ψ ) y = e ω 2 ( ω n 2 ω 2 ) 2 + ( 2 ξ ω n ω ) 2 sin ( ω t ψ ) tan ψ = 2 ξ ω n ω ω n 2 ω 2
where ξ is the relative damping coefficient that equals c / ( 2 k / m ) , ωn is the natural frequency without damping that equals k / m , and ψ is the phase difference of R and e.
For a certain rotor system, damping coefficient ξ and natural frequency ωn are fixed values. The relationship between the amplitude of dynamic deflection R and eccentricity e is shown in Figure 3a. The amplitude of R increases with e. When ω < ωn, amplitude R increases and it is in the same direction with e. When ω = ωn, ψ = π/2, amplitude R reaches its peak and the vibration is most intense. At this moment, critical rotational speed ωk equals undamped natural frequency ωn. When ω > ωn, the amplitude of R decreases, which is in the opposite direction of e. When ω is close to ∞, R approaches e and the shaft rotates around the center of mass of the disk, and the center of mass C coincides with point O. The relationship between phase angle ψ of the shaft dynamic deflection and rotational speed ω and eccentricity e is shown in Figure 3b. Phase angle ψ increases with rotational speed ω but is independent to eccentricity e.

3.2. Vibration Sensing with Shaft-End Mounted Accelerometer

The motion of the on-shaft sensor is the superposition of translational and rotational motions. When a MEMS accelerometer is mounted to the end of a shaft, the center of the shaft coincides with the center of the MEMS accelerometer. When the shaft rotates around its center O with rotational speed ω in the inertial frame X-Y, the accelerometer can sense centripetal acceleration ac and tangential acceleration at in the x and y directions of its carrier coordinates, respectively. The accelerometer can also sense the acceleration of gravity g. When the shaft rotates, the acceleration of gravity is projected to the x axis and y axis of the sensor. In addition, the accelerometer can also sense the translational vibration of the x axis and y axis.
When rotational speed ω is less than ωk, the output of the on-shaft accelerometer is as shown in Figure 4a, where R and e are in different directions, and ac is in the opposite direction of x-axis gravity acceleration component gx. The output of the accelerometer is given by:
a x = a X cos ω t + a Y sin ω t + g sin ω t ω 2 e a y = a X sin ω t + a Y cos ω t + g cos ω t + ω e
When rotational speed ω is greater than ωk, the output of the on-shaft accelerometer is as shown in Figure 4b, where R and e are in the same direction, and ac is in the same direction as gx. The output becomes:
a x = a X cos ω t + a Y sin ω t + g sin ω t + ω 2 e a y = a X sin ω t + a Y cos ω t + g cos ω t + ω e
Therefore, the shaft vibration acceleration output depends on rotational speed ω and eccentricity e. The on-shaft accelerometer signal can reflect the rotational speed and the imbalance degree of the shaft, which can be employed to analyze the operation of rotating machinery. Practically, significant rotor imbalance and misalignment of the rotor system could both contribute the vibrations and the corresponding variations of the time and frequency domain features.
Our theoretical analysis and further evaluations were based on the fundamental Laval’s/Jeffcott’s rotor with a simplified model. The motion equation will become more complicated for more complex rotors, and even for the same rotor when gyroscopic effects are taken into consideration.

4. Design and Implementation of a Machine Wearable Sensor Module

This section describes the design of a MEMS accelerometer-based shaft-end mounted OSVM sensor system. The hardware and software scheme with the assembled device for machine wearable sensing is shown in Figure 5.

4.1. System Design of the OSVM Sensor System

To minimize the impact of the sensor on the rotating machinery, the sensor module was expected to be small, lightweight, and power-efficient. For this purpose, the design of the sensor module conformed to the following rules: (1) small outline components were preferred to reduce the weight and size of the device; (2) the battery power supply was replaced with WPT. Considering the resolution, sampling frequency, power supply, and computation load, the key components selected are listed in Table 2. The BLE system-on-chip (SoC) nRF52832 (Nordic Semiconductor, Trondheim, Norway) was chosen as the processor, the three-axis accelerometer ADXL357 (Analog Devices Inc., Wilmington, NC, USA) was chosen for vibration sensing, and flash memory W25N01GVZEIG (Winbond, Taizhong, China) was chosen for local data storage.

4.2. WPT Design for a Battery-Less Power Supply

To remove the battery and achieve long-term shaft vibration monitoring, the WPT technique was employed. As a result, the weight of the sensor module could be reduced and its impact on the rotary machinery alleviated. With the simulation-based analysis and optimization, the transmitting and receiving circuits of an efficient WPT module for the power supply of the sensor module were created.

4.2.1. Circuits Design for Wireless Power Transfer

The WPT technique normally uses sound, light, or electromagnetism as the carrier to transfer energy wirelessly, and electromagnetism is a commonly used solution. Through inductive power transfer, the sensor could be mounted on a mechanical shaft that works without cabling for power supply and data communication. The direct current (DC) voltage input is converted into alternative current (AC) voltage by a high-frequency inverter, the IC XKT-412 (XKT, Shenzhen, China), and then input to IC XKT335 (XKT, Shenzhen, CN) for frequency multiplying. The output the transmitting coil with a compensation capacitor to generate an induced magnetic field. By electromagnetic inductive coupling, the receiver receives the electromagnetic energy from the transmitter end to generate an AC voltage, which is full-wave rectified by the Schottky diode SS34 with a compensation capacitor. Then, an IC T3168 receiver (XKT, Shenzhen, China) outputs a constant voltage which powers the load sensor module by means of a resistance divider to obtain the desired DC voltage.
The transmission power and its efficiency are key indicators to measure the performance of a WPT system. When the distance between the transmitter and the receiver coils is in the order of a couple of centimeters, they are in a loose coupling and the transmission performance decreases with the distance. A compensation circuit is needed to offset the reactive power to ensure the maximum transmission power and transmission efficiency. Since the coupling coil works in a high-frequency band, the P–P type compensation method was employed. P–P is a type of network in which an inductance coil is equivalent to a resistor and a series inductor, which is then connected in parallel with a capacitor. When the imaginary part of the total impedance of the transmitting loop and the reflected impedance of the receiving loop are 0, the reactive power of the circuit system is 0, and the compensation for all reactive power is achieved. Output power Pout and transmission efficiency η reach the maximum. The resonant frequency is given by:
ω = 1 L 1 C 1 = 1 L 2 C 2
where L1 and L2 are the inductance of the transmitting and receiving coils, and C1 and C2 are their capacitance. The resonant frequency of the system is the most significant parameter affecting the distance of the WPT. A higher resonant frequency may result in a stronger transmitting magnetic field and a longer transmission distance. In addition, the Bluetooth/BLE in the sensor works in the 2.4 GHz, industrial scientific medical (ISM) band. A system frequency of about 500 kHz was selected to ensure the transmission distance and avoid crosstalk. Therefore, it was necessary to optimize the parameters of the coupling coils and resonant capacitors to improve the performance of WPT, considering the requirement of miniaturization.

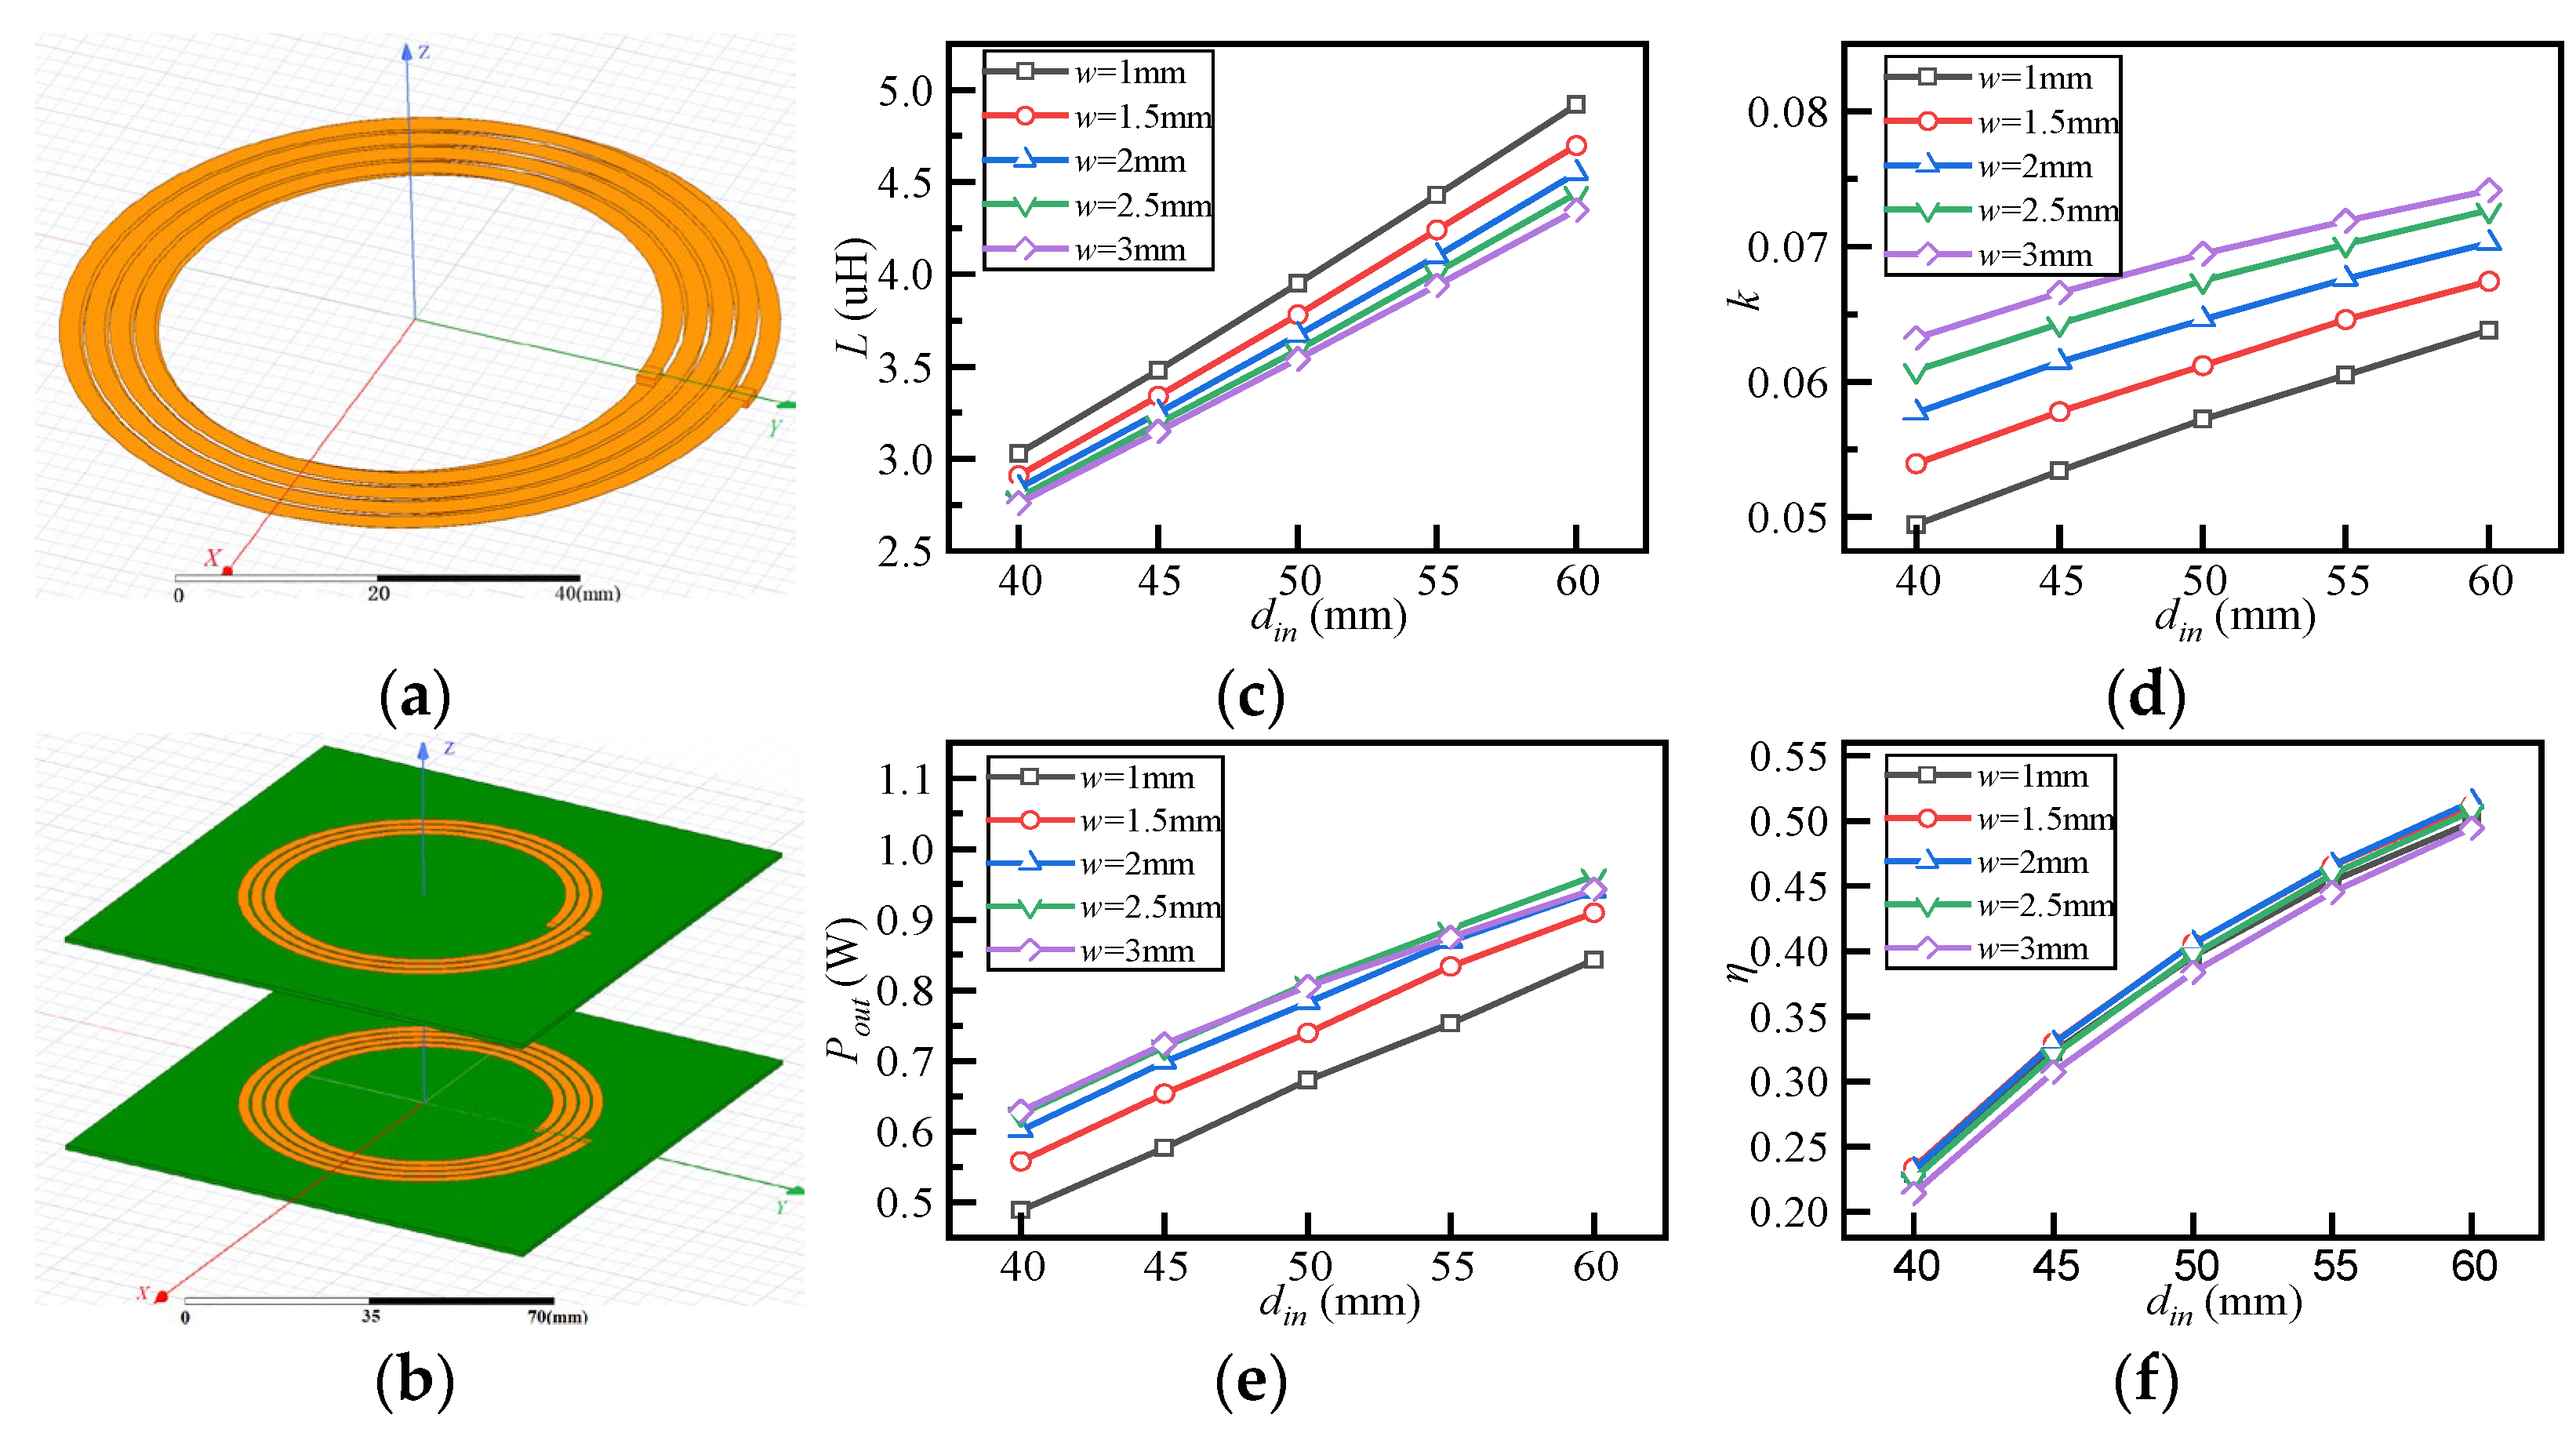
4.2.2. Design of Transmitting and Receiving Coils

The Litz wire coil and printed planar spiral coil are commonly used solutions for WTP. The printed circuit board (PCB) planar spiral coil is widely used in the field of electronic systems because of its small size, high precision, high consistency, and ease of design and fabrication. The PCB planar spiral coil is more suitable for on-shaft vibration monitoring systems than other shapes, such as squares and octagons. The geometric parameters of the circular planar spiral coil include inner diameter din, outer diameter dout, the width of wire w, the spacing of wire s, and the number of turns of the coil n. Among them, n has the greatest impact on the coil inductance value, while the three parameters, i.e., din, w and s, have less impact.
Considering the practical application, the designed transmitting coil is a two-layer structure with six turns. When the distance between the two coils was 40.0 mm, the relationship between inductance L, coupling coefficient k, output power Pout, and transmission efficiency η of the transmitting coil with coil diameter din and wire width w were obtained with Maxwell, as shown in Figure 6. To ensure the mutual inductance, output power, and transmission efficiency, the width of wire w of the transmitting coil was set to 2.5 mm, and the inner diameter din of the coil was set to 55.0 mm. At that moment, the inductance was 4.14 μH. According to the relationship between the resonant frequency and the inductance and capacitance, the transmitter compensation capacitor was 27.0 nF.

4.3. The Data Computing for On-Shaft Vibration Sensing

The wireless power supply and wireless communication techniques allow the sensor module to be mounted on the shaft for vibration sensing, which can minimize noise for indirect sensing. However, it suffers from the limited bandwidth of the wireless channel, which makes it a challenge for imbalance analyses at high rotational speeds. The concept of integrated sensing and computing was introduced to the system design, which accomplished the computation with the processing unit of the sensor and reduced the redundant data for wireless transmission. This can potentially overcome the restriction of wireless communication bandwidth and achieve efficient and accurate online vibration sensing and analysis.

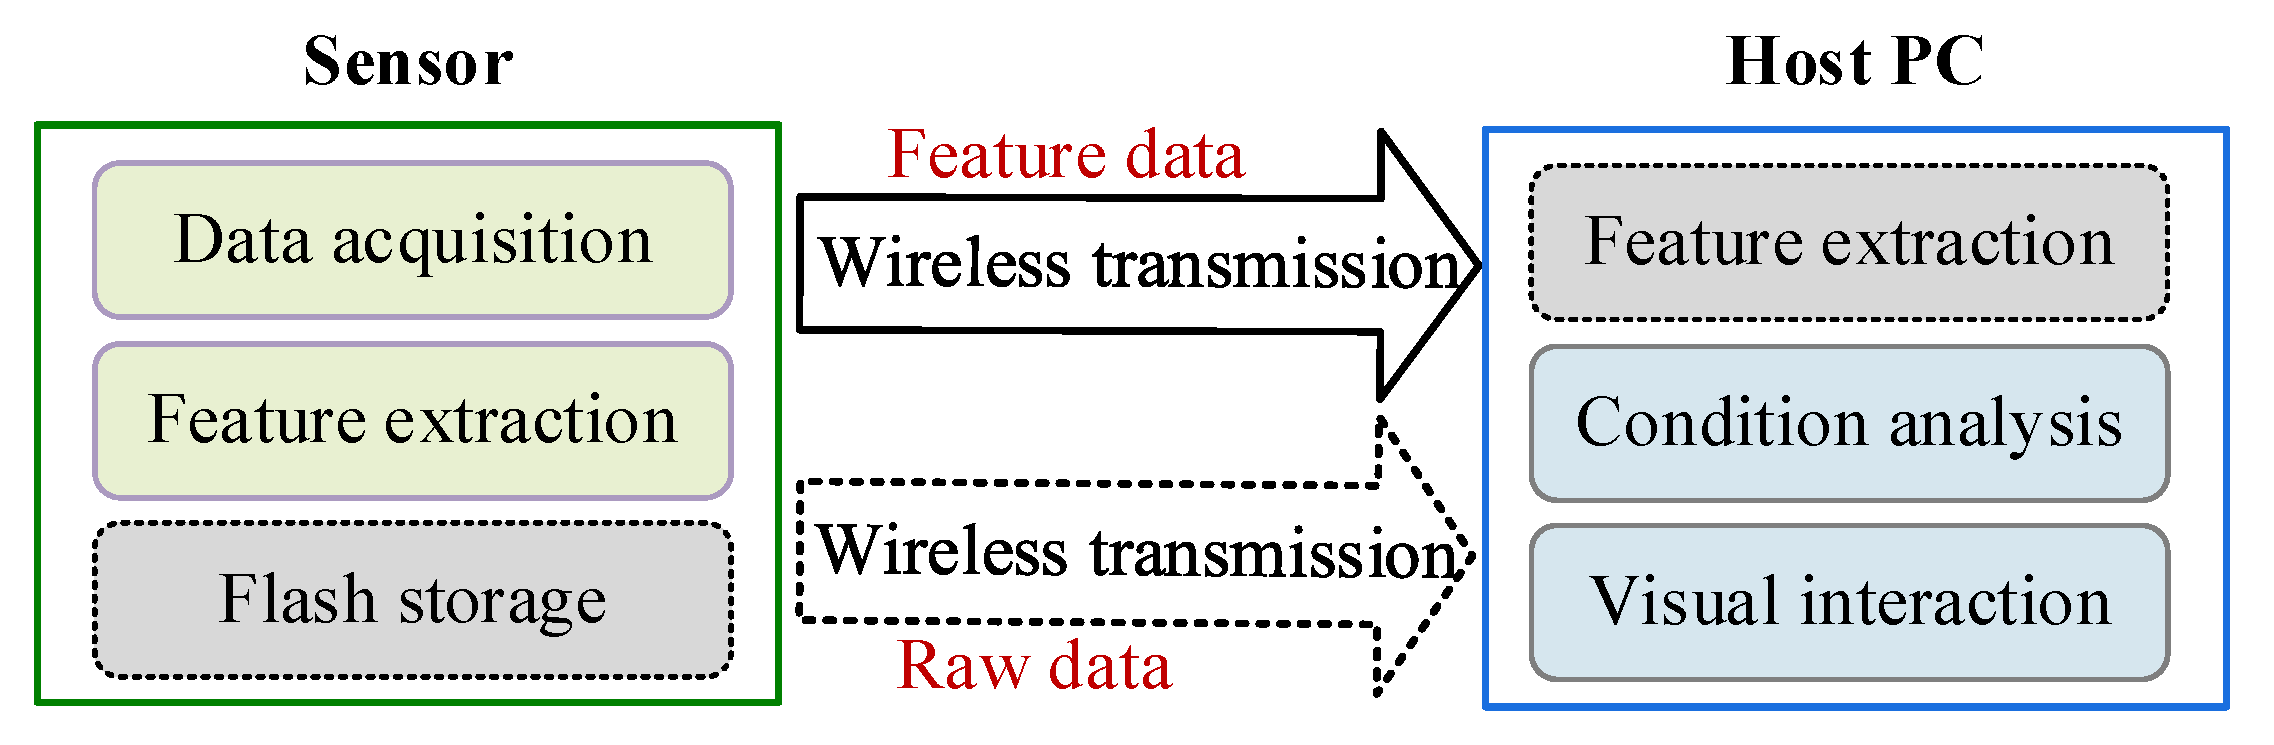
4.3.1. The Computing Paradigm of the On-Shaft Vibration Sensor

For a wireless sensor, there are two commonly used method for the implementation of computing tasks with the sensor and the host PC. One is to collect the sensing data with the sensor and then transmit the raw data to the host PC for online processing. The other is to collect the sensor data, save it to the sensor end memory, and transmit the data to the host PC for offline processing. The former is restricted by the limited throughput of the wireless data transmission, and the latter cannot be used for online sensing and analysis.
In contrast to the above two methods, an in-sensor computing based computing paradigm shown in Figure 7 is proposed. The data acquisition and feature extraction are all completed with the sensor end, and the data is saved to local memory in the same time. The feature data is transmitted to the host PC for condition analysis and visual interaction, and the raw data saved to the flash memory can be transmitted to the host PC offline for further processing and analysis. This method avoids the transmission of redundant raw data which can potentially enhance the real-time performance of the system by exploring the limited in-sensor computing resource.

4.3.2. Time and Frequency Domain Data Processing

The vibration signal contains a lot of information to reflect the operation state of the machine system. It is significant to extract the effective features of the signal with the appropriate vibration signal processing methods. Since the vibration signal is generated by the rotational shaft, the features of the vibration signal including amplitude, phase, and frequency can be obtained to suggest the characteristics of the vibration. The commonly used time-domain characteristic indexes of vibration signals include mean, peak-peak, root mean square (RMS), variance, etc. It is widely accepted that the analysis is most effective based on a complete vibration signature rather than on a threshold [37]. The frequency domain analysis reflects the changing pattern of the signal more intuitively by decomposing the signal into various frequency components. The most common frequency domain analysis method is fast Fourier transform (FFT). The radix-2 decimation-in-time FFT algorithm is employed to decompose the original sequence into a series of short sequences. By exploring the periodicity and symmetry of rotation factor, the discrete Fourier transform (DFT) of the short sequences is obtained and properly combined to eliminate redundant computations.

4.3.3. In-Sensor Computing for Feature Extraction

To enhance the performance of the system for vibration sensing and analysis, an in-sensor computing functional module is developed. According to the Nyquist theorem, the sampling frequency should be 2.56~4 times of the highest frequency of the signal. To determine the high-frequency components for further analysis, the maximum sampling rate of 2000 Hz is achieved with the system, and therefore 12 KB raw data are generated in each second. For real-time sensing, storage, and processing, the data acquisition, data storing, and feature extraction processing are performed simultaneously with 3 interrupts and a specifically designed data packet format.
To avoid errors when saving data to flash memory, the raw data is saved with a packet format for verification. Each 9 bytes data for the three-axis accelerations are extended to a 13 bytes packet by adding two start bytes (0 × 65, 0 × 56) before the load and one checking byte and one end byte after the load. The checking byte is the XOR of the 9 load bytes. Each page of the flash memory has a volume of 2 KB, which can store 157 packets. To make sure the saving and reading of data in whole pages, each 128 packets of data, namely 1664 bytes are saved to each page. When an error is determined in the checking of a packet, the whole packet of data will be discarded and replaced with the last packet.
The workflow of the sensing, data storing, and in-sensor processing is as shown in Figure 8. The main function initiates the BLE connection and the three timers for the timing of data acquisition and caching, data storing, and data conversion for in-sensor processing. The data processing operates are in parallel with the data acquisition and data storing, which is triggered by a feature extraction flag after the data is ready. Timer 1 implements the 2000 Hz sampling with EasyDMA and saves the data to caching RAM. Timer 2 achieves the package format wrapping and data storing with column and page address handling. The collected data are saved to flash memory each 16 samplings, namely 208 bytes. After storing the data of the specified number of pages, timers 1 and 2 stop and data collection and storing steps are completed. Then, timer 3 completes bytes to float conversion of raw data and triggers the in-sensor feature extraction by setting the flag to 1 when the number of float caching digits are over 512 per axis. The main function then completes the feature extraction processing and the results are transmitted to the host PC with BLE while not disturbing the data acquisition and data storing. The above logic starts over again when it is finished.

5. Tests and Evaluations

In this section, an OSVM sensor-based imbalance analysis system is established for experimental verification with a test rig. The feasibility of the presented techniques including wireless power supply, vibration signal acquisition, and in-sensor computing are experimentally verified.

5.1. Experimental Setup

The developed sensor module weighted 5.16 g in a round shape with diameter of 53.0 mm and the experimental setup are shown in Figure 9. The test rig chosen is machinery fault & rotor dynamics simulator (MFS-RDS) (SpectraQuest Inc., Richmond, VA, USA). The sensor module is mounted on the shaft end with a flange and the WPT transmitter is installed with a support facing the sensor module in a distance 4.0 mm. A host PC receives the data from the sensor module and displays the results in graphical user interface. The shaft rotational speed of the test rig can be set between 0~50 Hz, namely 0~3000 RPM. Considering the sensitivity of the sensor and the safety of the test rig with the selected load, the rotational speed range 20~35 Hz is chosen for the experimental verifications. The host PC provides choices for the users to select the working mode of the sensor, namely host PC processing mode and in-sensor processing mode. For host PC processing mode, the sensor collects vibration data, saves them in the Flash memory, and sent to the host PC for further processing. For the in-sensor processing mode, the sensor collects the three-axis acceleration data and implements the processing with the local processing unit of the sensor.

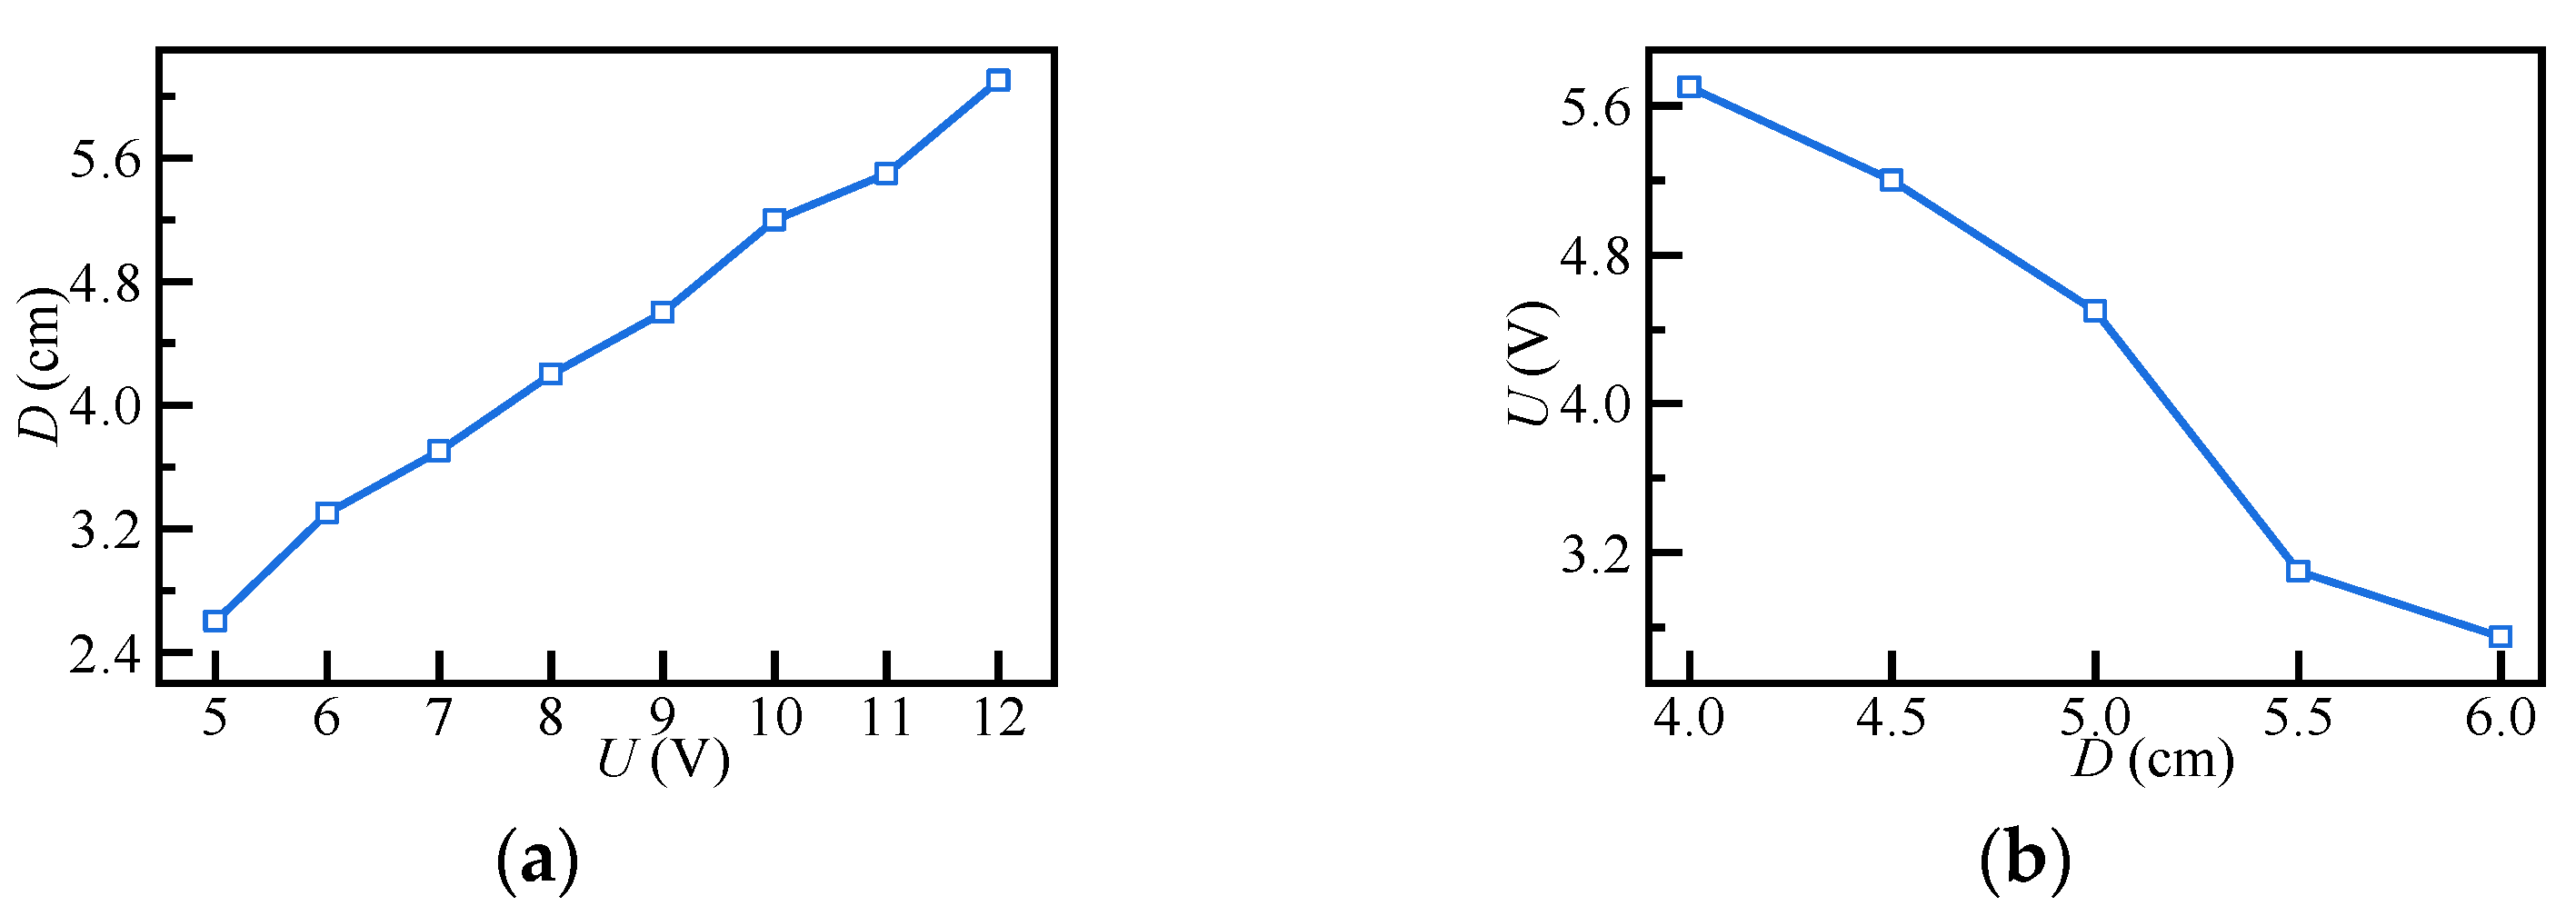
5.2. WPT Performance Evaluation

To evaluate the design for wireless power supply, tests are carried out to determine the output of the system with different input voltage and transmitter-receiver distances. The transmitter is fixed on the PCB bracket that is placed facing the sensor module. Firstly, the relationship between the input voltage of transmitter and the transmission distance is determined. The maximum distance that can power the sensor module in proper functioning is defined the transmission distance. As shown in Figure 10a, the transmission distance increases from 2.6 cm to 6.0 cm when the power supply for the transmitter increases from 5.0 V to 12.0 V. Secondly, when the power supply for the transmitter is set to 12.0 V, the relationship between the transmitter-receiver distance and received effective value of AC power is determined with an oscilloscope shown in Figure 10b. When the distance varies from 4.0 cm to 6.0 cm, the corresponding received power decreases from 5.7 V to 2.8 V. Therefore, the transmitter-receiver distance is set to 4.0 cm for the further tests.

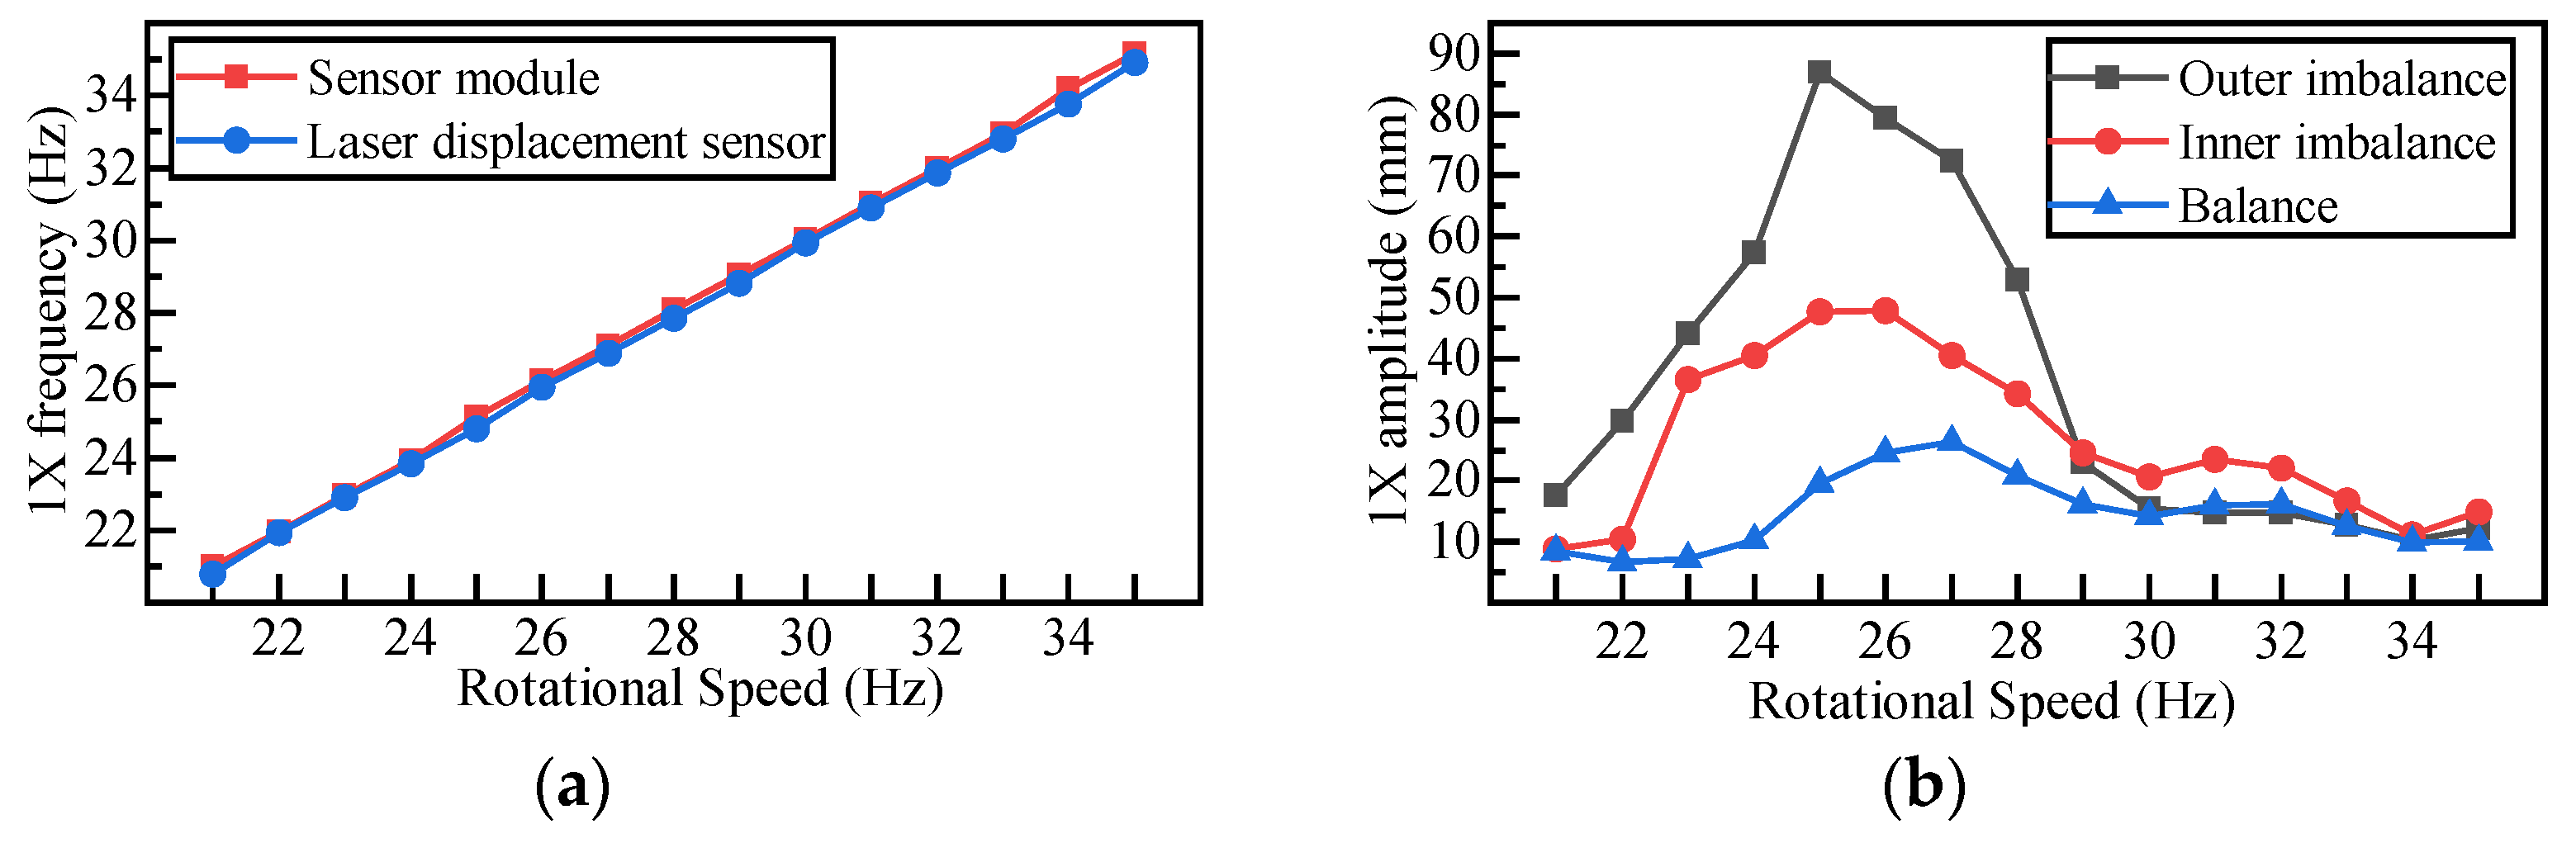
5.3. Effectiveness of the Acceleration Sensing

Before rotor vibration sensing, the effectiveness of the acceleration data of the sensor module is verified in advance. In this test, the rotational speed is set to 20 Hz, 25 Hz, 30 Hz and 35 Hz in a balanced state, and sensing data are collected with a sampling rate of 2000 Hz. The effectiveness of the three-axis acceleration data for vibration analysis is verified by comparing and analysing the features obtained by the time domain and frequency domain analysis. Figure 11 gives the raw acceleration data of X-axis and Y-axis, and the signal shows obvious periodic oscillation agreeing well with the rotational speed of the shaft.
The time domain and frequency domain analysis for the collected acceleration data including curve fitting and FFT are performed. The error between the measured rotational speed and the actual rotational speed is shown in Table 3. The measurement error of rotational speed is within 0.60%. Therefore, the method that collects the acceleration data to be saved in flash memory and transmits to host PC with BLE for processing is effective for monitoring the machine operations.

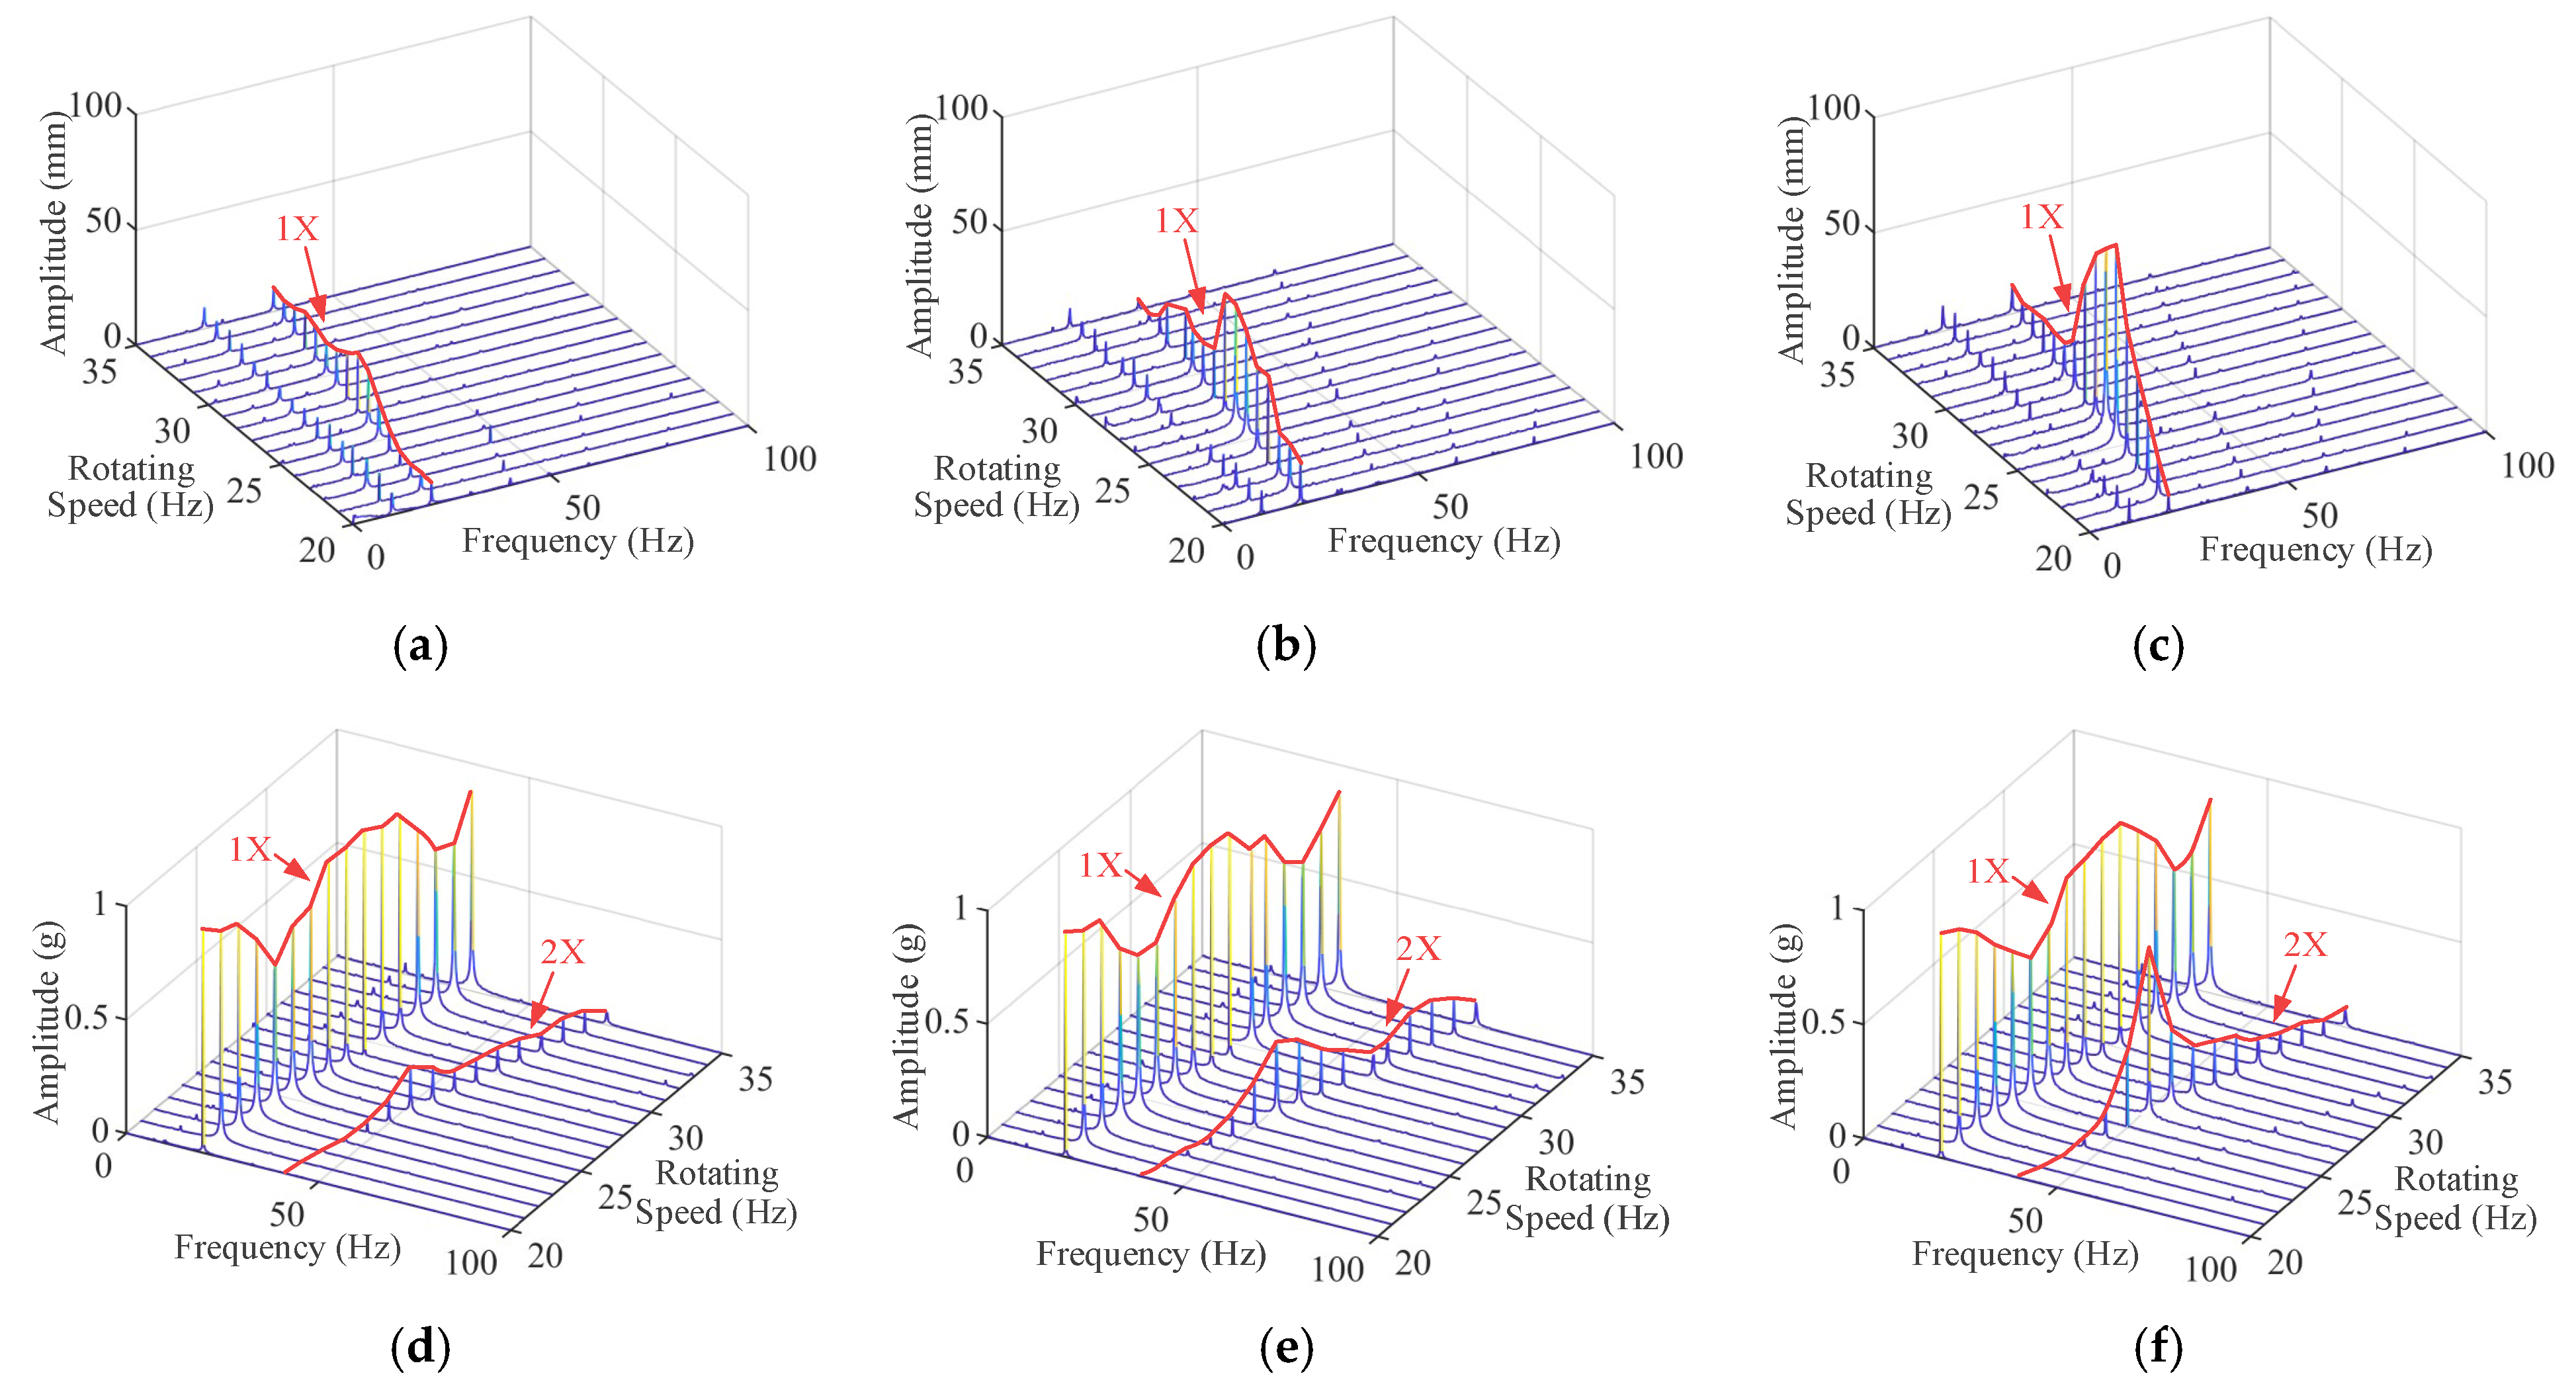
5.4. Verification of Imbalance Analysis

The next step is to verify its feasibility for vibration-based imbalance analysis. In this test, two orthogonal laser displacement sensors are used as the benchmark to evaluate the sensor module and the setup is shown in Figure 12a. The two laser displacement sensors are mounted vertically above and horizontally on the right side of the shaft to measure the X-axis and Y-axis displacement. As shown in Figure 12b, a screw weighted 6.06 g is placed in an inner and outer positions of the load disc to animate the degree of imbalance of the shaft. The screw in position 1, position 2, and non-screw indicate three states of outer imbalance, inner imbalance, and balance. Admittedly, the misalignment between the sensor module’s mass center and the shaft’s radial center introduces imbalance to the system. Since the OSVM sensor module mounted to the shaft end is just 5.16 g with a round shape, the results of tests with and without the sensor module in balance state show insignificant difference. Therefore, the impact of the sensor module on the rotation of shaft is ignored in the following verifications.
The sampling rate of the laser displacement sensor is set to 6250 Hz, and that of the sensing module is set to 2000 Hz. The acceleration data of 5.0 s are collected for rotational speeds 20~35 Hz with an incremental of 1 Hz in the three states. The rotational speed is set to the desired value by adjusting the AC frequency conversion. The host PC then sends the command for data collection to the sensor module when the shaft rotation is stable. Then, by setting the test frequency values one by one, the data for the rest frequencies are collected. The data collection for the balance state is conducted first, and that for the inner imbalance and outer imbalance states are completed by repeating the above steps.
When the data acquisition is completed, the acceleration data of each frequency in the flash memory can be read from the sensor module to the host PC. The number of sampling points of the laser displacement sensor is 16,384, and that of the OSVM sensor module is 8192. The X-axis vibration displacement collected by the laser displacement sensor and the acceleration data by the OSVM sensor module are processed with FFT. The spectrum analysis results of the X-axis vibration signal are shown in Figure 13, where the fundamental frequency of signal is denoted by 1X and the second order harmonic is denoted by 2X. The variation pattern of 1X for the displacement by the laser sensor in Figure 13a–c and that of 2X for the acceleration by the OSVM sensor module in Figure 13d–f agree very well. The rotator imbalance theoretically corresponds to the synchronous motion. In practice, the unbalance mass artificially added on the disc forming the rotor unbalance could cause the 2X vibration component. In addition, the resulted misalignment of rotor system could be another cause for the 2X vibration component. Since previous studies have proven that the 1X of displacement can be used to evaluate vibration, the 2X of acceleration having the same variation pattern can also be used as a metric for vibration evaluation.
To verify the feasibility of the sensor node for imbalance fault monitoring, the frequency and amplitude of 1X and 2X for the acceleration and that of 1X for the displacement are obtained with FFT, which are shown in Figure 14. From the results, the following findings can be derived. Firstly, the 1X frequency of the acceleration and displacement in Figure 14a agree very well, which suggests the feasibility of the on-shaft vibration sensing techniques to provide valid data for the analysis of rotor vibration. Secondly, the variation patterns for 1X amplitude of the displacement and that for the 2X amplitude of the acceleration agree very well, which reflects the degree of imbalance. When the rotational speed increases from low, the amplitude of the shaft vibration increases firstly and then decreases. When the rotational speed reaches the critical rotational speed 26 Hz, the vibration is the most intensive. For a certain rotational speed, the vibration amplitude varies slightly at the frequencies less than 22 Hz and greater than 29 Hz, and significantly at the frequencies near 26 Hz. Therefore, the 2X amplitude of the OSVM sensor data at the critical frequency can be used to determine the intensity of the vibration for rotor imbalance analysis.

5.5. Verification of In-Sensor Processing

The verification of the in-sensor processing function of the system is then carried out with experimental studies. Since the RAM of the processing unit of the sensor device is only 64 K Bytes, the number of data pints for FFT is restricted. To verify the effectiveness and explore the potential of in-sensor processing, its comparison with host PC processing for time domain and frequency domain feature extraction are conducted.

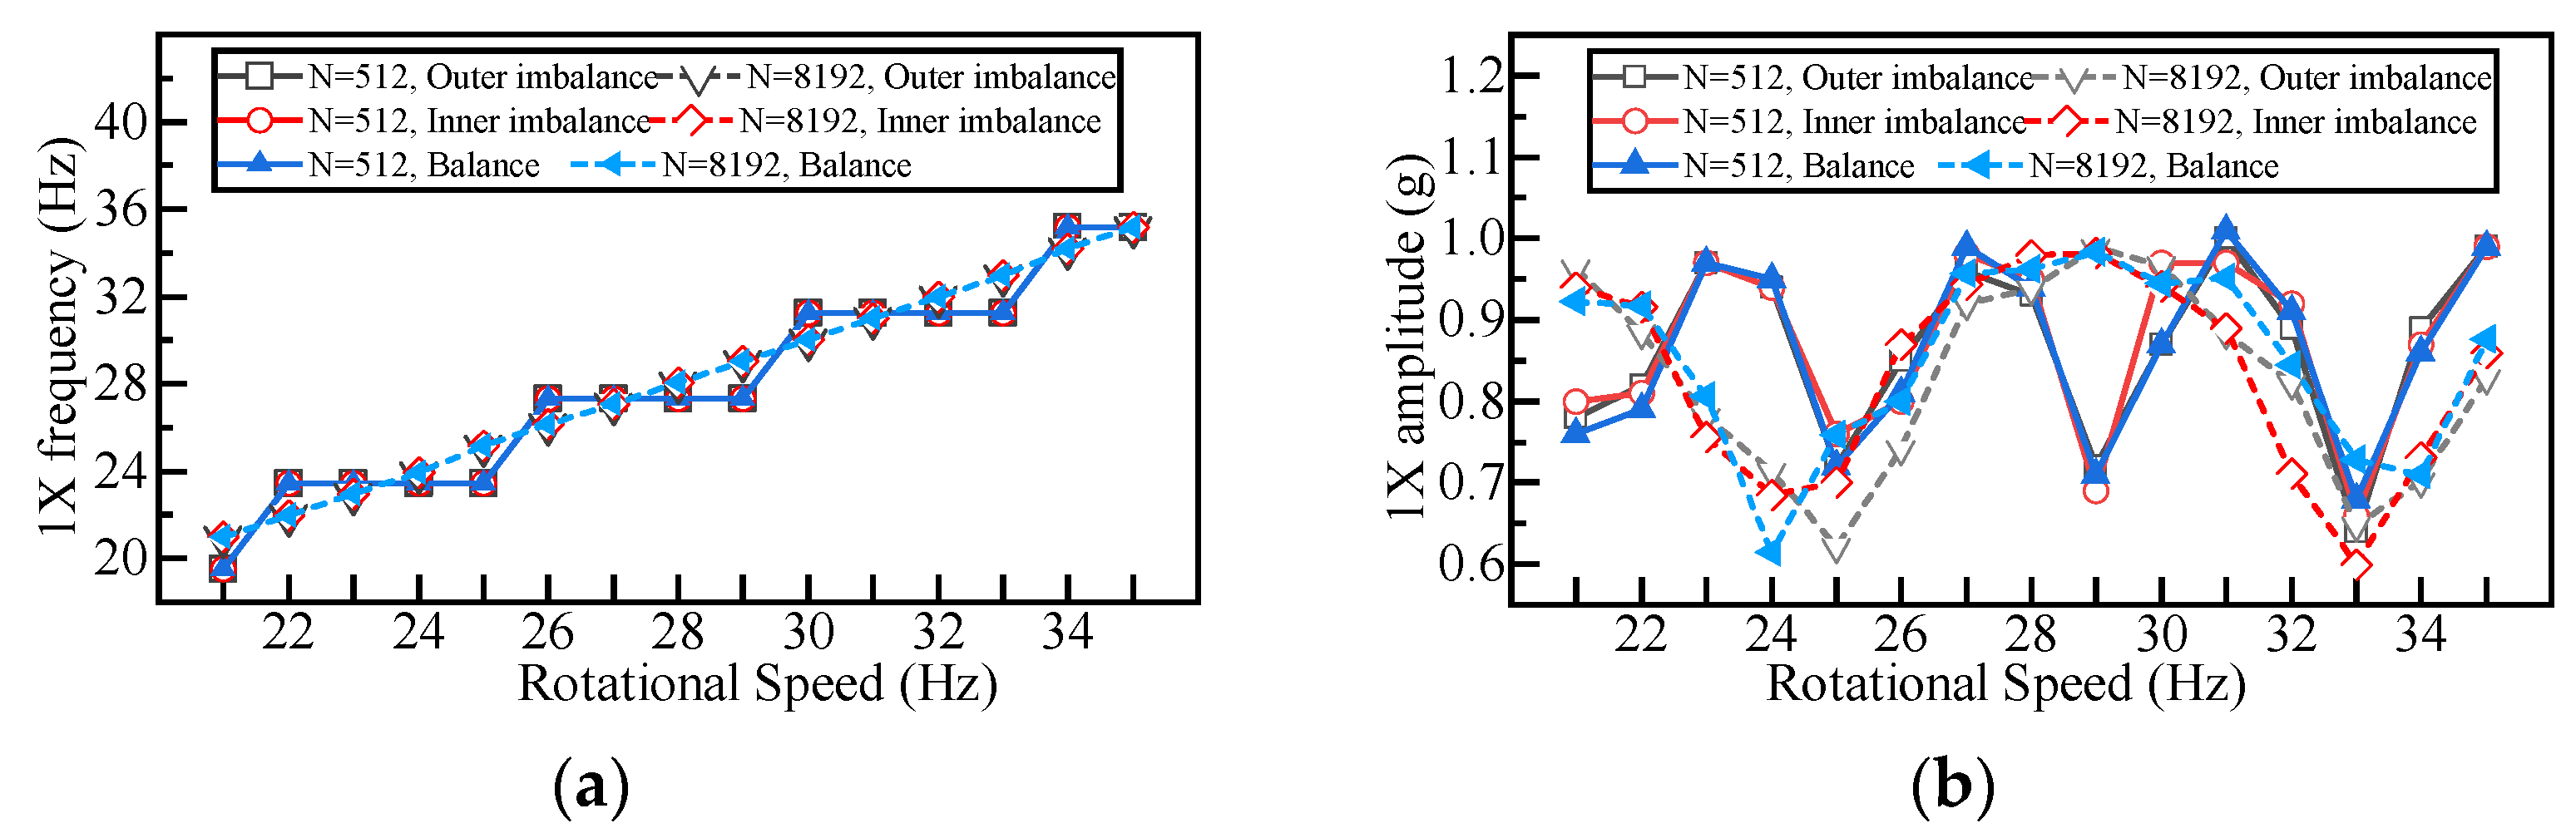
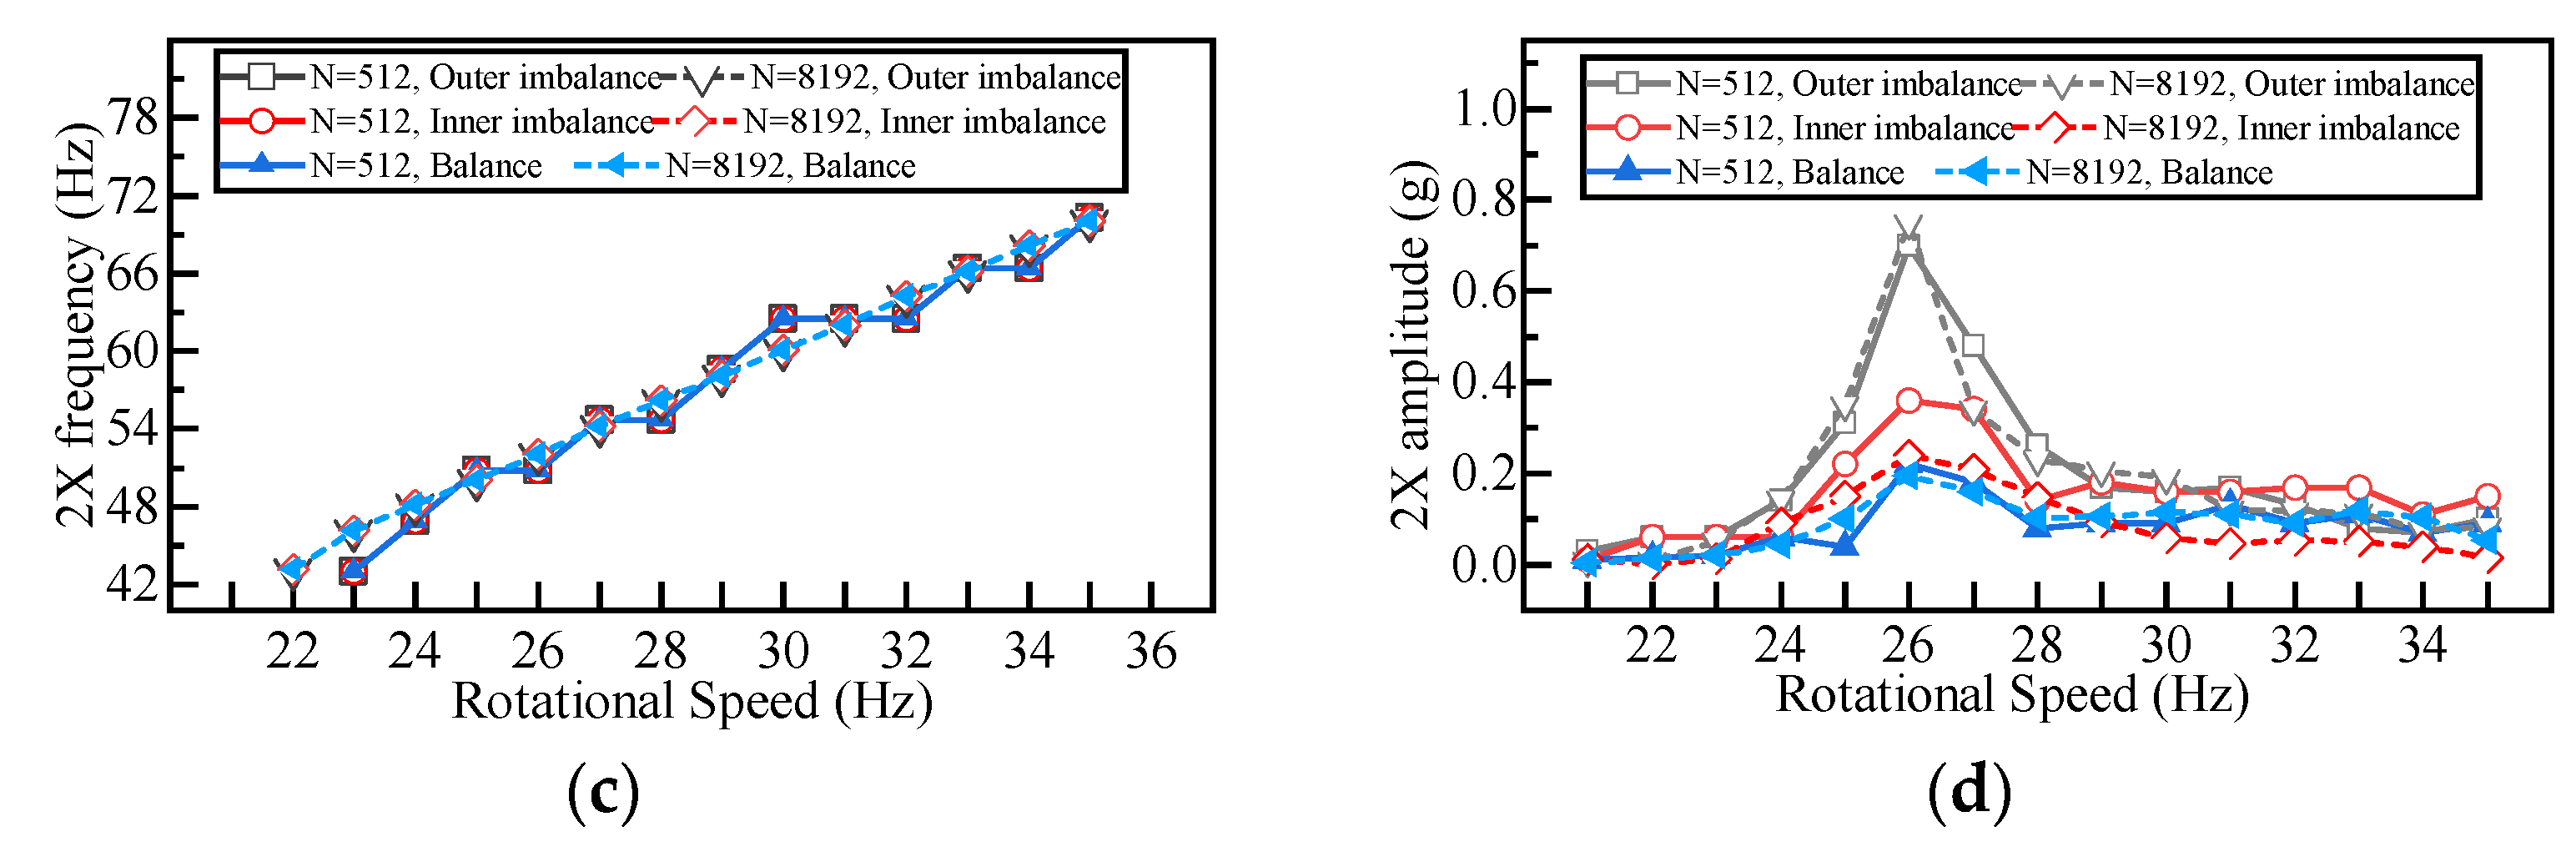
5.5.1. Frequency Domain Feature Extraction

The frequency domain features are important for imbalance analysis. But they are more computation-intensive which is challenging for resource limited devices like MCU. For the limited in-built RAM, the sensor processing unit can only withstand 512 points FFT processing. Therefore, it is necessary to compare the features of vibration signal when the number of points N is over 512, and determine the number of points to generate the feature values with acceptable accuracy. To determine the proper number of points for FFT processing for the extraction of frequency domain features, the FFT analysis of the three-axis acceleration of rotational speeds 21~35 Hz with 512 points online in-sensor processing and 8192 points offline host PC processing in different operation states are carried out.
The relationship between the frequency domain features and the number of acquisition points is shown in Figure 15. From the results, it is found that the 1X and 2X frequency increase with the rotational speed for FFT with different points, and the accuracy of the rotational speed increases with the number of points. The 1X amplitude does not show obvious variation pattern with the increase of the rotational speed. Then, the 2X amplitude of FFT have the same variation pattern with different number of points. When the rotational speed increases from low, its 2X amplitude increases firstly and then decreases. For a certain rotational speed, the 2X amplitude increase with the degree of imbalance near the critical rotational speed of 26 Hz. Therefore, for frequency domain analysis of in-sensor computing with 512 points FFT, the variation pattern of the 2X acceleration agrees well with the degree of rotor imbalance, which can be potentially used for rotor imbalance analysis.

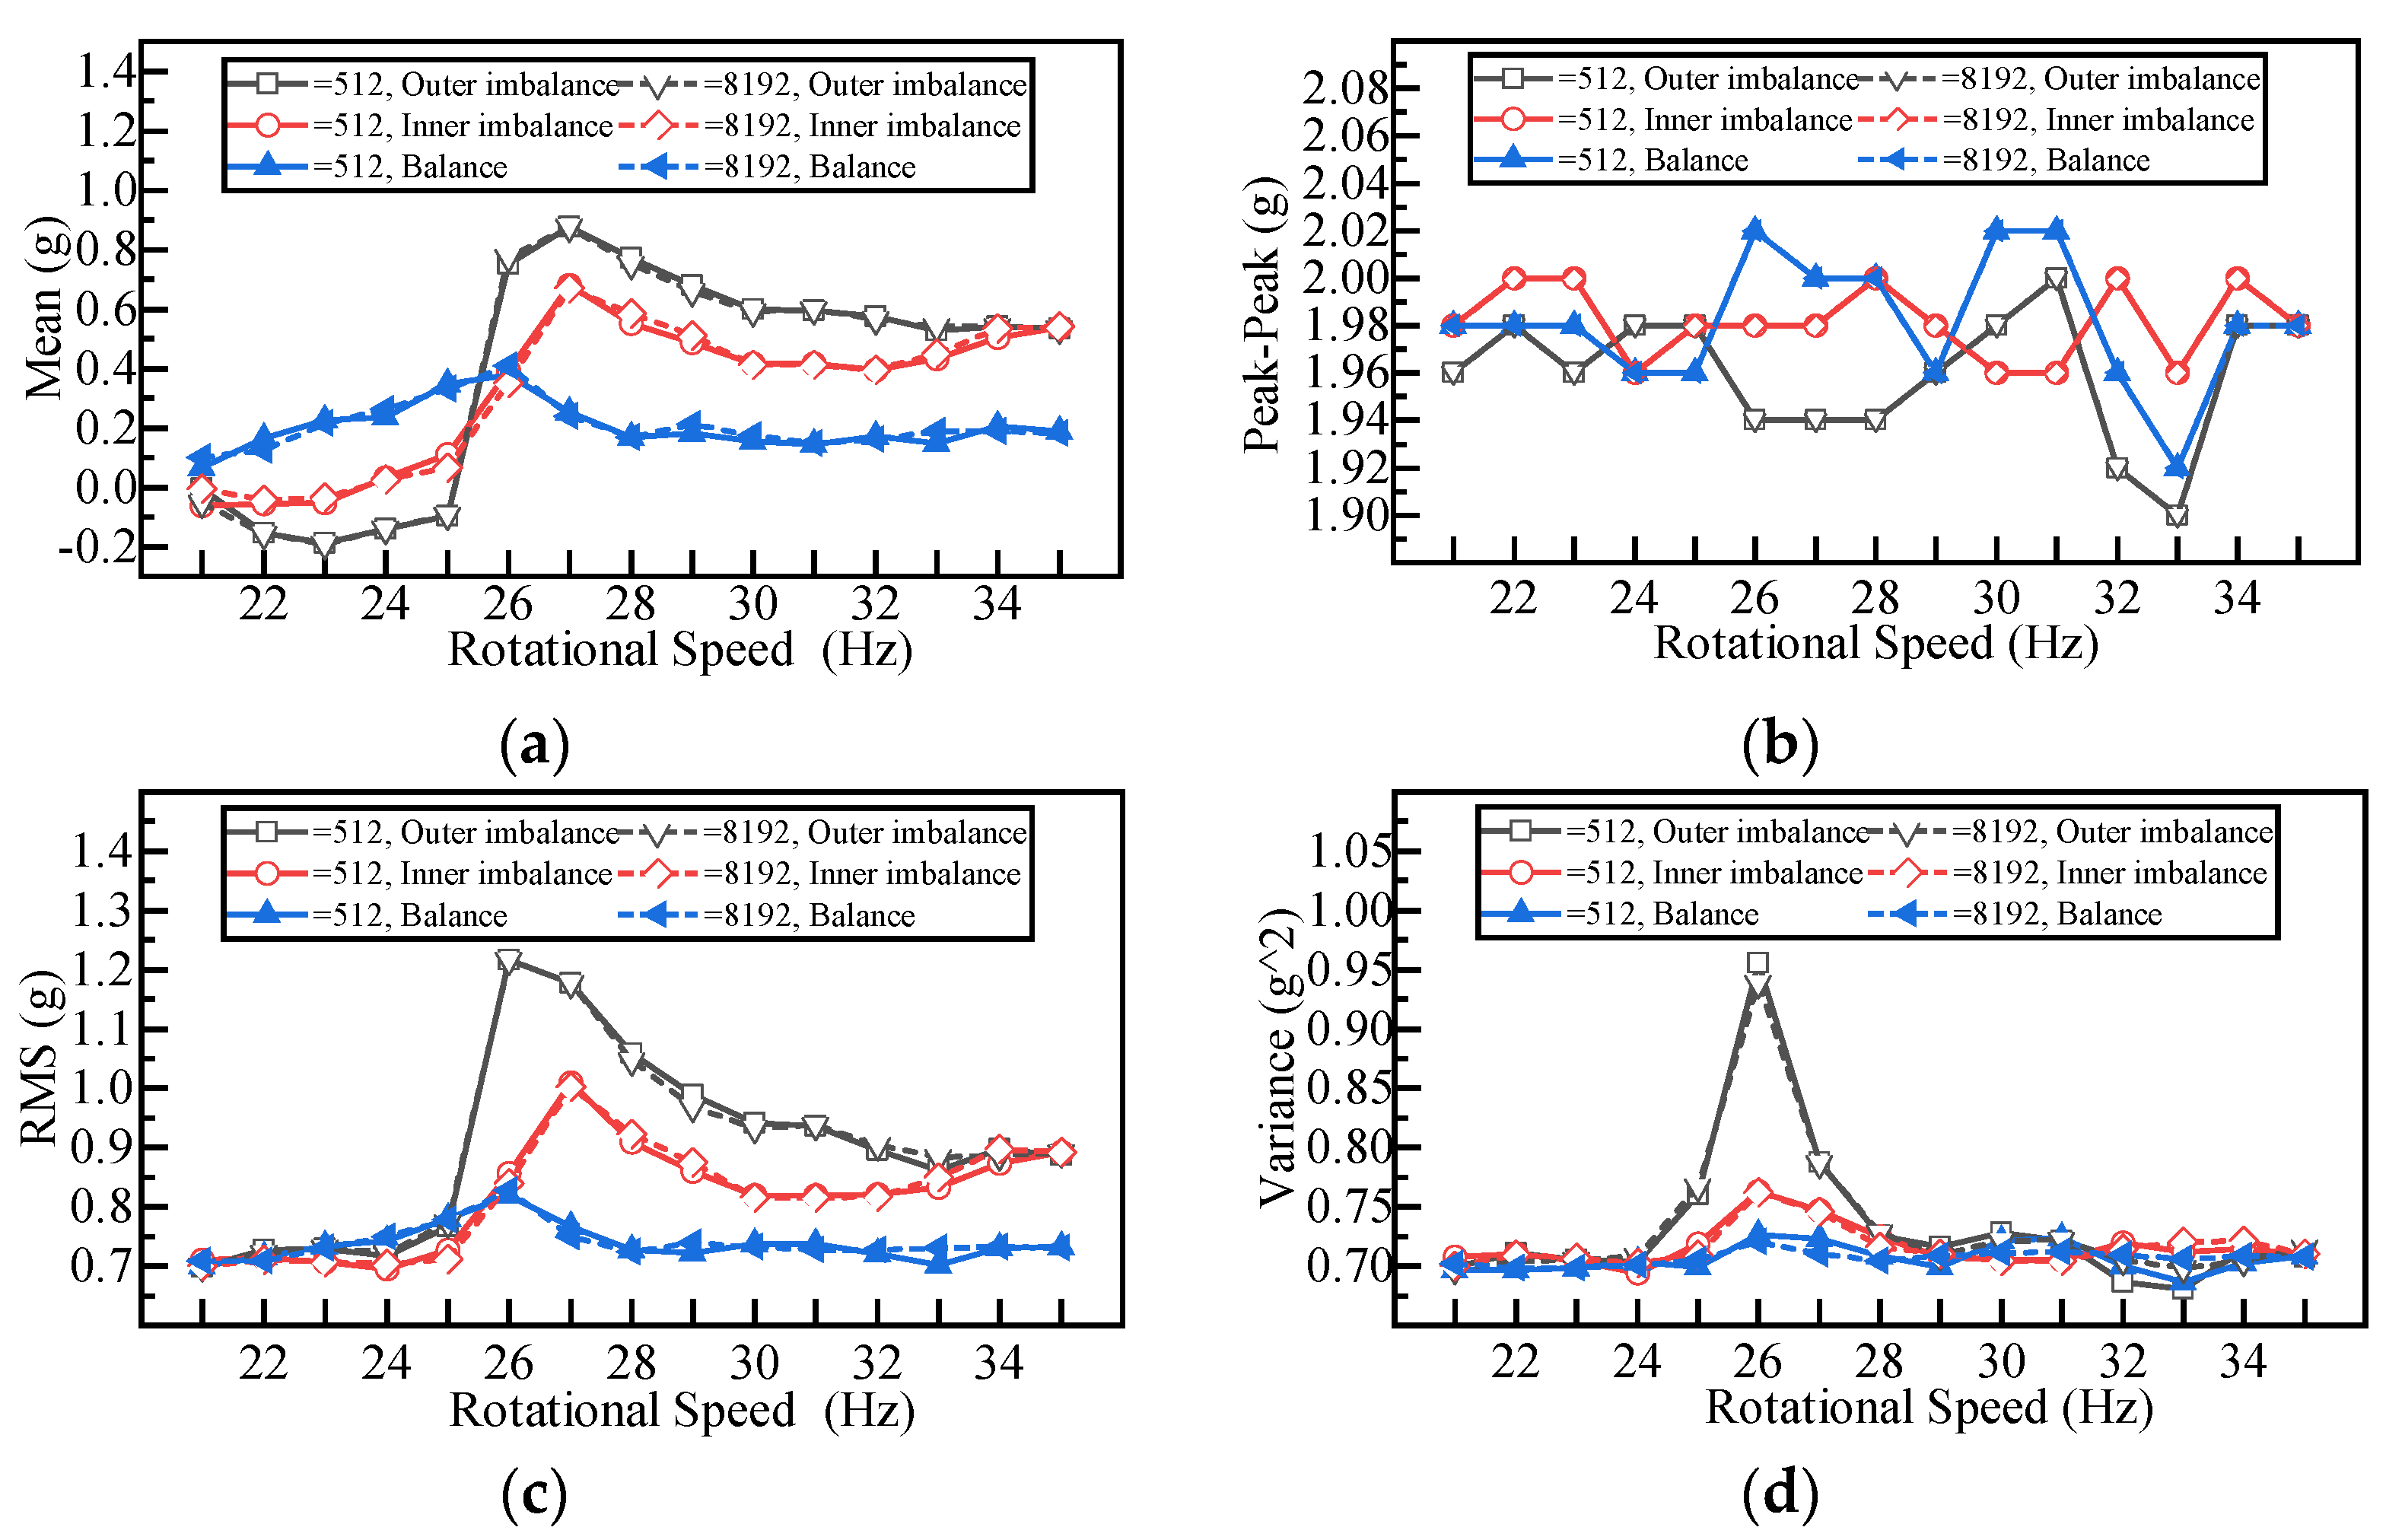
5.5.2. Time Domain Feature Extraction

The analysis of time domain features including the mean, peak-to-peak, RMS, and variance are conducted as well. Since it consumes less computational resource, it can be easily implemented with in-sensor processing. To verify the influence of the number of acquisition points on the time domain feature computation of the vibration signal, the time domain analysis of the three-axis acceleration of the rotational speeds 21~35 Hz in different operation states is carried out with the number of sampling points 512 and 8192.
The relationship between the time domain features and the number of sampling points is shown in Figure 16. It is found that the mean, RMS, and variance do not change significantly with the number of points. The mean, RMS and variance increase first and then decrease with the rotational speed. It shows a general trend that the RMS and variance increase with the degree of imbalance, especially near the critical rotational speed 26 Hz. However, the peak-to-peak value does not show apparent variation pattern with the increase of rotational speed, and the degree of imbalance with different number of points. The peak value is affected by the gravity effect of the sensor itself and is less affected by the speed and imbalance, which fluctuates around 2.0 g. Therefore, the in-sensor computing for time domain analysis of RMS and variance of the vibration signal can be employed to evaluate the machine operations.

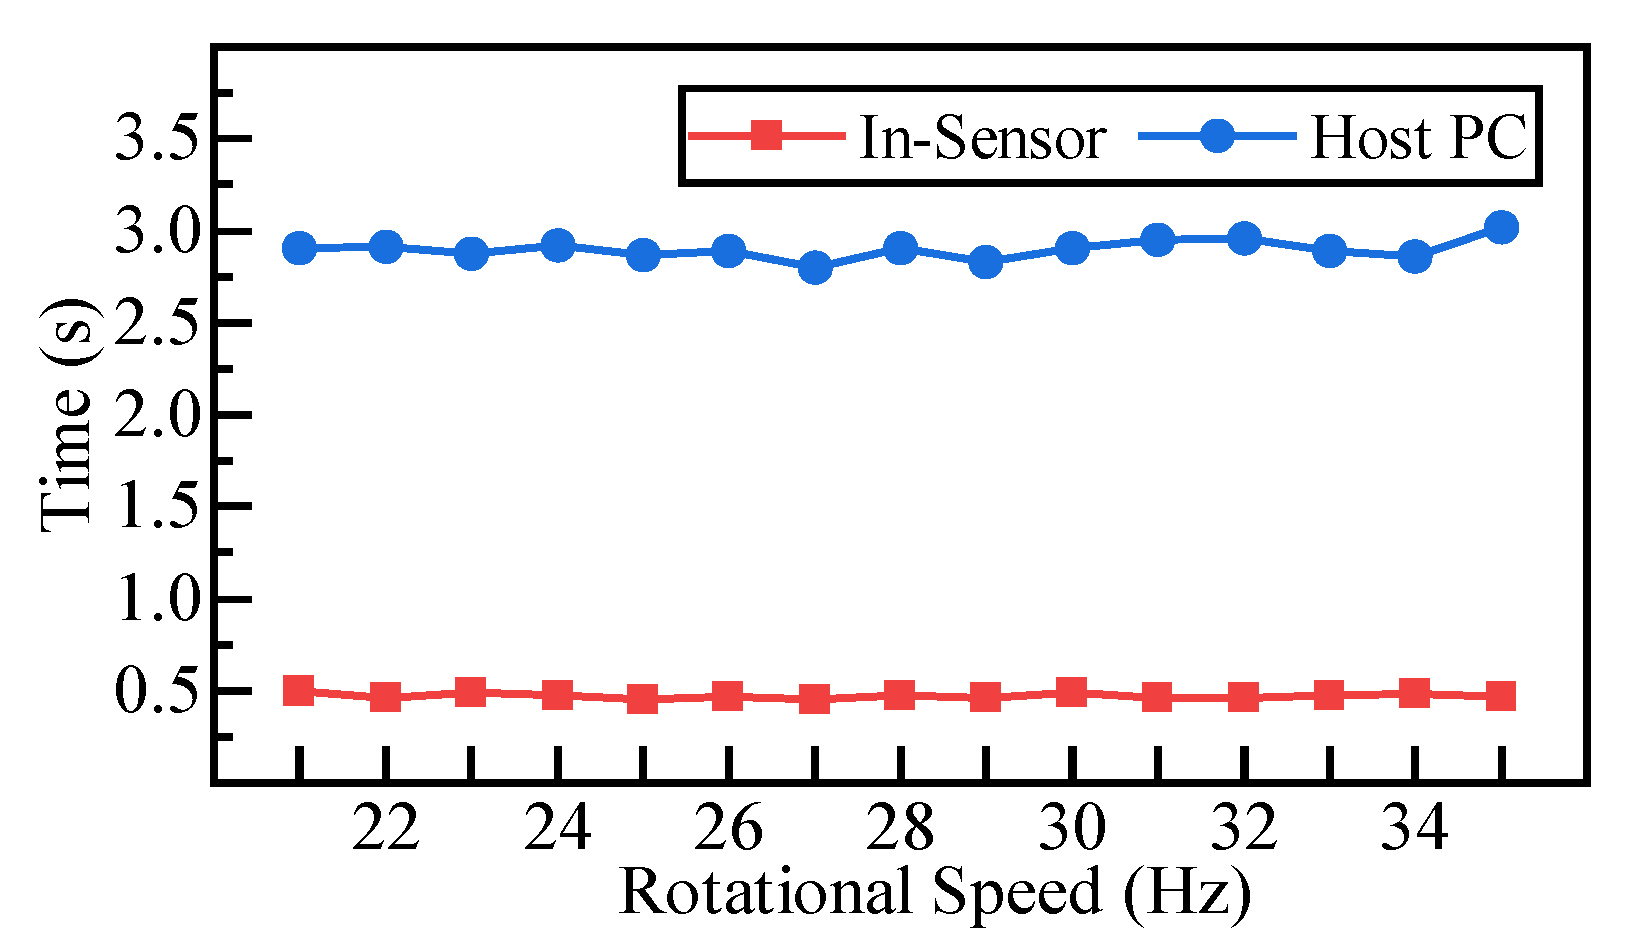
5.5.3. Feasibility and Performance of In-Sensor Processing

The feasibility and real-time performance of the in-sensor feature extraction of the proposed OSVM sensor for rotor imbalance analysis is experimentally verified. For in-sensor computing, the sensor module accomplishes the data acquisition and feature extraction with the in-sensor computing unit and wirelessly transmits the result feature information to host PC. For host PC computing, the sensor module collects the data and then wirelessly transmit to the host PC for the rest processing. Both in-sensor computing and host PC computing are tested and the time consumption is evaluated for rotational speeds 21~35 Hz in the outer imbalance state at 2000 Hz sampling rate.
As shown in Figure 17, the average time consumption of the 512 points in-sensor computing and host PC computing for feature extraction are 0.472 s and 2.898 s, respectively. This means the in-sensor computing can complete the data acquisition, feature extraction, and transmission of the features 1X frequency, 2X amplitude, and RMS wrapped in a 12 bytes package to the host PC in 0.472 s. It is acceptable for online monitoring to observe the imbalance faults. Since the host PC computing requires the transmission of the raw sensor data to the host PC for further processing through BLE, it yielded a significant delay of 2.898 s. For a higher sampling rate or a greater window size N, the delay will increase inevitably. Therefore, the presented in-sensor computing technique for feature extraction is an effective way to enhanced the performance of the system for online rotor imbalance monitoring.

6. Conclusions and Future Work

This investigation presents a MEMS accelerator-based on-shaft vibration measurement sensor module for vibration sensing and rotor imbalance analysis. A theoretical model for rotor imbalance and shaft-end mounted accelerometer vibration sensing has been established. The optimized hardware and software design were intended to reduce the size and weight of the sensor and enhance its computational efficiency. A WPT-based power supply was employed to get rid of battery power supply and reduce the interference of the mass on the rotor operation. The in-sensor computing for feature extraction was accomplished with the limited resources of the computing unit of low-power devices, which enabled real-time processing, especially for high-speed rotors, although this was restricted by the limited bandwidth of wireless communication. Experimental studies were carried out; the results showed that the OSVM sensor could determine the vibrations for rotor imbalance analyses with both the frequency and time domain features of the acceleration signal. Admittedly, shaft-end mounted sensing is not applicable for machines with closed housing, which is a potential limitation of the presented techniques. The work of this investigation demonstrates the feasibility of the optimized sensing and computing techniques with the miniature and lightweight devices for machine wearable condition monitoring of machine systems. Future work will focus on the vibration sensing of more complex rotor systems and the in-depth analysis of the gyroscopic effects.

Author Contributions

Conceptualization, Z.M., G.F. and H.Z.; Formal analysis, Y.C.; Funding acquisition, Z.M.; Methodology, Z.M., Y.L. and G.F.; Project administration, Z.M.; Resources, Y.L.; Software, Y.L.; Supervision, H.Z., N.G. and Z.Z.; Validation, Y.L. and Y.C.; Visualization, Z.C.; Writing—original draft, Z.M. and Y.L.; Writing—review & editing, Z.C. and Z.Z. All authors have read and agreed to the published version of the manuscript.

Funding

This research was funded by National Natural Science Foundation of China (NSFC), grant numbers 52275485, and in part by Natural Science Foundation of Hebei Province, grant number E2022202128.

Data Availability Statement

Dataset available on request from the authors.

Conflicts of Interest

The authors declare no conflicts of interest.

References

  1. Reda, K.; Yan, Y. Vibration measurement of an unbalanced metallic shaft using electrostatic sensors. IEEE Trans. Instrum. Meas. 2019, 68, 1467–1476. [Google Scholar] [CrossRef]
  2. Yin, Y.; Liu, Z.; Zuo, M.; Zhou, Z.; Zhang, J. A three-dimensional vibration data compression method for rolling bearing condition monitoring. IEEE Trans. Instrum. Meas. 2023, 72, 3506010. [Google Scholar] [CrossRef]
  3. Cui, M.; Wang, Y.; Lin, X.; Zhong, M. Fault diagnosis of rolling bearings based on an improved stack autoencoder and support vector machine. IEEE Sens. J. 2021, 21, 4927–4937. [Google Scholar] [CrossRef]
  4. Pozzato, G.; Strada, S.C.; Tanelli, M.; Savaresi, S.M.; Dambach, G. MEMS-enabled retrofitting of automobile wheel balancer for automatic unbalance detection. IEEE/ASME Trans. Mechatron. 2021, 26, 830–840. [Google Scholar] [CrossRef]
  5. Tiboni, M.; Remino, C.; Bussola, R.; Amici, C. A review on vibration-based condition monitoring of rotating machinery. Appl. Sci. 2022, 12, 972. [Google Scholar] [CrossRef]
  6. Maruthi, G.S.; Hegde, V. Application of MEMS accelerometer for detection and diagnosis of multiple faults in the roller element bearings of three phase induction motor. IEEE Sens. J. 2016, 16, 145–152. [Google Scholar] [CrossRef]
  7. Li, T.; Shi, C.; Tan, Y.; Zhou, Z. Fiber Bragg Grating sensing-based online torque detection on coupled bending and torsional vibration of rotating shaft. IEEE Sens. J. 2017, 17, 1999–2007. [Google Scholar] [CrossRef]
  8. Manikandan, K.G.; Pannirselvam, K.; Kenned, J.J.; Kumar, C.S. Investigations on suitability of MEMS based accelerometer for vibration measurements. Mater. Today Proc. 2021, 5, 6183–6192. [Google Scholar] [CrossRef]
  9. Zhou, F.; Chai, Y. Near-sensor and in-sensor computing. Nat. Electron. 2020, 3, 664–671. [Google Scholar] [CrossRef]
  10. Tarabini, M.; Scaccabarozzi, D. Uncertainty-based combination of signal processing techniques for the identification of rotor imbalance. Measurement 2018, 114, 409–416. [Google Scholar] [CrossRef]
  11. Yamamoto, G.K.; Costa, C.; Silva Sousa, J.S. A smart experimental setup for vibration measurement and imbalance fault detection in rotating machinery. Case Stud. Mech. Syst. Signal Process. 2016, 4, 8–18. [Google Scholar] [CrossRef]
  12. Ambur, R.; Rinderknecht, S. Self-sensing techniques of piezoelectric actuators in detecting unbalance faults in a rotating machine. Procedia Eng. 2016, 144, 833–840. [Google Scholar] [CrossRef]
  13. Koene, I.; Viitala, R.; Kuosmanen, P. Internet of Things Based Monitoring of Large Rotor Vibration with a Microelectromechanical Systems Accelerometer. IEEE Access 2019, 7, 92210. [Google Scholar] [CrossRef]
  14. Chen, Y.; Zhang, H.; Li, X.; Xiao, S.; Gu, F.; Shi, Z. Effects of wear on lubrication performance and vibration signatures of rotor system supported by hydrodynamic bearings. Lubricants 2023, 11, 107. [Google Scholar] [CrossRef]
  15. Li, T.L.; Tan, Y.G.; Wei, L.; Zhou, Z.D.; Zheng, K. A non-contact Fiber Bragg Grating vibration sensor. Rev. Sci. Instrum. 2014, 85, 015002. [Google Scholar] [PubMed]
  16. Li, T.; Tan, Y.; Zhou, Z.; Zheng, K. A non-contact FBG vibration sensor with double differential temperature compensation. Opt. Rev. 2015, 23, 26–32. [Google Scholar] [CrossRef]
  17. Roy, D.; Sinharay, A.; Bhowmick, B.; Rakshit, R.; Chakravarty, T.; Pal, A. A Novel RF-assisted-strobe system for unobtrusive vibration detection of machine parts. IEEE Sens. J. 2020, 20, 10924–10935. [Google Scholar] [CrossRef]
  18. Chai, S.; Wang, S.; Liu, C.; Liu, T.; Liu, X.; Xing, K. Using semantic segmentation network to measure vibration displacement of rotating body. IEEE Sens. J. 2023, 23, 7977–7991. [Google Scholar] [CrossRef]
  19. He, Q.; Wang, S.; Liu, T.; Liu, C.; Liu, X. Enhanced measurement precision for rotor vibration displacement via a progressive video super resolution network. IEEE Trans. Instrum. Meas. 2024, 73, 6005113. [Google Scholar] [CrossRef]
  20. Lee, J.K.; Seung, H.M.; Park, C.I.; Lee, J.K.; Lim, D.H.; Kim, Y.Y. Magnetostrictive patch sensor system for battery-less real-time measurement of torsional vibrations of rotating shafts. J. Sound Vib. 2018, 414, 248–258. [Google Scholar] [CrossRef]
  21. Okabe, S.; Tanaka, S. Measurement of shaft vibration using ultrasonic sensor. In Proceedings of the SICE Annual Conference, Fukui, Japan, 4–6 August 2003; pp. 1155–1158. [Google Scholar]
  22. Kakaley, D.E.; Altieri, R.E.; Buckner, G.D. Non-contacting measurement of torque and axial translation in high-speed rotating shafts. Mech. Syst. Signal Process. 2020, 138, 106520. [Google Scholar] [CrossRef]
  23. Dos Santos Pedotti, L.A.; Zago, R.M.; Giesbrecht, M.; Fruett, F. Low-cost MEMS accelerometer network for rotating machine vibration diagnostics. IEEE Instrum. Meas. Mag. 2020, 23, 25–33. [Google Scholar] [CrossRef]
  24. Arebi, L.; Gu, F.; Ball, A. A comparative study of misalignment detection using a novel wireless sensor with conventional wired sensors. J. Phys. Conf. Ser. 2012, 364, 012049. [Google Scholar] [CrossRef]
  25. Feng, G.; Hu, N.; Mones, Z.; Gu, F.; Ball, A.D. An investigation of the orthogonal outputs from an on-rotor MEMS accelerometer for reciprocating compressor condition monitoring. Mech. Syst. Signal Process. 2016, 76–77, 228–241. [Google Scholar] [CrossRef]
  26. Jiménez, S.; Cole, M.O.T.; Keogh, P.S. Vibration sensing in smart machine rotors using internal MEMS accelerometers. J. Sound Vib. 2016, 377, 58–75. [Google Scholar] [CrossRef]
  27. Koene, I.; Haikonen, S.; Tiainen, T.; Keski-Rahkonen, J.; Manngard, M.; Viitala, R. On-shaft wireless vibration measurement unit and signal processing method for torsional and lateral vibration. IEEE/ASME Trans. Mechatron. 2022, 27, 5857–5868. [Google Scholar]
  28. Li, C.; Li, B.; Gu, L.; Feng, G.; Gu, F.; Ball, A.D. Online monitoring of a shaft tuning process based on vibration signals from on-rotor sensor. In Proceedings of the 3rd World Conference on Mechanical Engineering and Intelligent Manufacturing (WCMEIM), Shanghai, China, 4–6 December 2020. [Google Scholar]
  29. Okhionkpamwonyi, S.; Otuyemi, F.; Shi, D.; Gu, F.; Ball, A.D. Experimental investigation of vibration signals from an on-rotor sensing for diesel engine crankshaft lubrication monitoring. In Proceedings of the International Conference on the Efficiency and Performance Engineering Network, Baotou, China, 18–21 August 2022. [Google Scholar]
  30. Vitolo, P.; De Vita, A.; Benedetto, L.D.; Pau, D.; Licciardo, G.D. Low-power detection and classification for in-sensor predictive maintenance based on vibration monitoring. IEEE Sens. J. 2022, 22, 6942–6951. [Google Scholar] [CrossRef]
  31. Moin, A.; Zhou, A.; Rahimi, A.; Menon, A.; Benatti, S.; Alexandrov, G.; Tamakloe, S.; Ting, J.; Yamamoto, N.; Khan, Y.; et al. A wearable biosensing system with in-sensor adaptive machine learning for hand gesture recognition. Nat. Electron. 2021, 4, 54–63. [Google Scholar] [CrossRef]
  32. Xia, M.; Li, T.; Xu, L.; Liu, L.; Silva, C.W. Fault diagnosis for rotating machinery using multiple sensors and conventional neural networks. IEEE/ASME Trans. Mechatron. 2018, 23, 101–110. [Google Scholar] [CrossRef]
  33. Chen, W.J.; Gunter, E.J. Introduction to Dynamics of Rotor-Bearing Systems; Trafford Publishing: Trafford, UK, 2007. [Google Scholar]
  34. Friswell, M.I.; Penny, J.E.; Garvey, S.D.; Lees, A.W. Dynamics of Rotating Machines; Cambridge University Press: Cambridge, UK, 2010. [Google Scholar]
  35. Genta, G. Dynamics of Rotating Systems; Springer: Berlin/Heidelberg, Germany, 2005. [Google Scholar]
  36. Vance, J.M.; Zeidan, F.Y.; Murphy, B.G. Machinery Vibration and Rotordynamics; Wiley: Hoboken, NJ, USA, 2010. [Google Scholar]
  37. Wang, J.; Peng, Y.; Qiao, W. Current-aided order tracking of vibration signals for bearing fault diagnosis of direct-drive wind turbines. IEEE Trans. Ind. Electron. 2016, 63, 6336–6346. [Google Scholar] [CrossRef]
Figure 1. The model of rotor imbalance.
Electronics 13 02466 g001
Figure 2. Instantaneous position of the rotational disc.
Electronics 13 02466 g002
Figure 3. The relationship between the dynamic deflection of the rotating shaft and rotational speed ω and eccentricity e: (a) amplitude-frequency diagram; (b) phase-frequency diagram.
Electronics 13 02466 g003
Figure 4. MEMS Accelerometer Outputs: (a) ω < ωk, (b) ω > ωk.
Electronics 13 02466 g004
Figure 5. The OSVM sensor module: (a) Hardware and software scheme; (b) Assembled hardware device.
Electronics 13 02466 g005
Figure 6. Simulation studies of power transmission performance: (a) Two-layer planar spiral coil; (b) simulation model; (c) variation of L with din and w; (d) variation of k with din and w; (e) variation of Pout with din and w; (f) variation of η with din and w.
Electronics 13 02466 g006
Figure 7. The computing paradigm of the OSVM sensor.
Electronics 13 02466 g007
Figure 8. The flow chart of in-sensor feature extraction.
Electronics 13 02466 g008
Figure 9. The test rig and experimental setup.
Electronics 13 02466 g009
Figure 10. Test results of wireless power supply: (a) variation of transmission distance with input voltage; (b) variation of received voltage with transmitter-receiver distance.
Electronics 13 02466 g010
Figure 11. Three-axis vibration acceleration signals collected by the OSVM sensor: (a) 20 Hz; (b) 25 Hz; (c) 30 Hz; (d) 35 Hz.
Electronics 13 02466 g011
Figure 12. Reference sensors installation and imbalance settings: (a) installation of the two orthogonal laser displacement sensors; (b) the placing positions of the disc imbalanced block.
Electronics 13 02466 g012
Figure 13. Spectral analysis of X-axis vibration in the three balancing states: (a) laser displacement sensor in balance state; (b) laser displacement sensor in the inner imbalanced state; (c) laser displacement sensor in the outer imbalanced state; (d) OSVM sensor in balance; (e) OSVM sensor in the inner imbalanced state; (f) OSVM sensor in the outer imbalanced state.
Electronics 13 02466 g013
Figure 14. Comparison of X-axis vibration signal feature values of the two sensors: (a) 1X frequency of laser displacement sensor and OSVM sensor; (b) 1X amplitude of laser displacement sensor; (c) 1X amplitude of OSVM sensor; (d) 2X amplitude of OSVM sensor.
Electronics 13 02466 g014aElectronics 13 02466 g014b
Figure 15. The variation pattern of frequency domain feature values under different point numbers: (a) FFT 1X frequency; (b) FFT 1X amplitude; (c) FFT 2X frequency; (d) FFT 2X amplitude.
Electronics 13 02466 g015aElectronics 13 02466 g015b
Figure 16. The time−domain feature variation pattern under different point numbers: (a) mean; (b) peak-to-peak; (c) RMS; (d) variance.
Electronics 13 02466 g016
Figure 17. The time consumption of the 512 points feature extraction for in-sensor computing and host PC computing.
Electronics 13 02466 g017
Table 1. A comparison of the rotor vibration sensing techniques.
MethodsSensor ComponentsProsCons
On-bearing housing contact sensing [10,11,12]Piezoelectric, accelerometerSimple structure,
long service life
Impacted by bearing structure dynamics, loss of accuracy during lifetime
Non-contact shaft displacement sensing [13,14,15,16,17,18,19,20]Optical, conductive, ultrasonic, laser, eddy current, electrostatic, RF Doppler, capacitiveHigh sensitivity,
good signal quality
Needs space for sensing devices and cabling, impact by ambient environment, costly
On-shaft acceleration sensing [4,21,22,23]MEMS accelerometer and gyroscopeHigh sensitivity, good signal quality, less impact on system operation, low costNeeds lightweight system design and balanced installation
Table 2. Key Components of the OSVM Sensor.
ComponentsModelPower Key parametersFootprint
BLE SoC with MCUnRF528321.7–3.6 V64 MHz Cortex-M46 × 6 mm QFN
MEMS accelerometerADXL3572.25–3.6 V4 KHz sampling rate6 × 6 mm LCC
Flash memoryW25N012.7–3.6 V1 G Bytes8 × 6 mm WSON
Table 3. The Test Results of Acceleration Sensing.
Sampling Rate
/Hz
FFTCurve Fitting
Measured Frequency
/Hz
ErrorMeasured Frequency
/Hz
Error
2020.0190.09%20.0190.09%
2525.1460.58%25.0530.21%
3030.0290.10%30.0830.28%
3535.0540.15%35.0540.15%
Disclaimer/Publisher’s Note: The statements, opinions and data contained in all publications are solely those of the individual author(s) and contributor(s) and not of MDPI and/or the editor(s). MDPI and/or the editor(s) disclaim responsibility for any injury to people or property resulting from any ideas, methods, instructions or products referred to in the content.

