Abstract
Proton exchange membrane fuel cells (PEMFC) are widely acknowledged as a prospective power source, but durability problems have constrained development. Therefore, a compound prediction framework is proposed in this paper by integrating the locally weighted scatter plot smoothing method (LOESS), uniform information coefficient (UIC), and attention-based stacked generalization model (ASGM) with improved dung beetle optimization (IDBO). Firstly, LOESS is adopted to filter original degraded sequences. Then, UIC is applied to obtain critical information by selecting relevant factors of the processed degraded sequences. Subsequently, the critical information is input into the base models of ASGM, including kernel ridge regression (KRR), extreme learning machine (ELM), and the temporal convolutional network (TCN), to acquire corresponding prediction results. Finally, the prediction results are fused using the meta-model attention-based LSTM of ASGM to obtain future degradation trends (FDT) and the remaining useful life (RUL), in which the attention mechanism is introduced to deduce weight coefficients of the base model prediction results in LSTM. Meanwhile, IDBO based on Levy flight, adaptive mutation, and polynomial mutation strategies are proposed to search for optimal parameters in LSTM. The application of two different datasets and their comparison with five related models shows that the proposed framework is suitable and effective for forecasting the FDT and RUL of PEMFC.
1. Introduction
1.1. Motivations
Proton exchange membrane fuel cells (PEMFC) are extensively acknowledged as one of the most prospective energy techniques, which has the advantages of strong anti-interference, faster start-up, zero pollution emission, low operating temperature, pleasurable portability, and so on. After nearly two decades of continuous and rapid development, they have entered the initial commercialization phase, which is widely adopted in fixed, portable, and transport fields [1,2]. However, operating expenses and the useful life of PEMFC still face challenges, which have become major constraints to their large-scale promotion and adoption [3]. While degradation of proton exchange membrane fuel cells is unavoidable in real-life applications, the accurate forecasting of FDT can effectively assist users in taking timely maintenance measures, thus significantly extending the useful life of PEMFC [4,5,6].
1.2. Literature Review
Existing PEMFC prediction methods are classified into three categories: model-based [7,8], data-driven [9,10], and hybrid [11,12,13]. Among them, model-based methods mainly predict the RUL of PEMFC through parameter estimation by establishing a mathematical model according to the attenuation mechanism of PEMFC. As such, Zhou et al. [7] proposed an aging prediction model based on particle filters. Chen et al. [8] combined the unscented Kalman filter (UKF) with the empirical voltage attenuation model to pre-RUL. Xie et al. [14] used singular spectrum analysis to preprocess the measured data and then used a deep Gaussian process to achieve RUL prediction. Ao et al. [15] proposed an RUL prediction method based on the Kalman filter in the frequency domain to process aging data of PEMFC in groups. Wang et al. [16] established an aging model based on polarization curves, used the particle filter algorithm to estimate the aging parameters online, and used the rated voltage as a new health index. Although model-based methods can analyze the aging process combined with the mechanism, the aging mechanism of PEMFC has not been thoroughly studied, and various aging models are usually unproven, so the prediction accuracy of model-driven methods is usually not guaranteed [4].
To predict degradation more accurately, researchers proposed hybrid methods combining model-based and data-driven ones. Although hybrid methods play a positive role in improving accuracy, they inevitably raise complications. Considering that hybrid methods inherently depend on model-based ones, the limitations associated with model-based methods are also manifested in hybrid ones [17]. On the contrary, data-driven methods do not need to fully understand the internal degradation mechanism of fuel cells, which is trained by a large number of known experimental data, after which the accurate prediction effect is obtained by a deep learning algorithm [9,10]. Therefore, data-driven methods are employed in this study.
Data-driven methods primarily contain an extreme learning machine (ELM) [11], an echo state network (ESN) [18,19], kernel ridge regression (KRR) [20], a long short-term memory neural network (LSTM) [21,22,23,24,25,26], a temporal convolutional network (TCN) [27,28], and so on. For example, Pan et al. [27] constructed a prediction framework and joint degradation metrics of TCN to predict the RUL of PEMFC, confirming that the TCN can accurately predict the RUL of PEMFC. Deng et al. [17] proposed a highly accurate and efficient degradation prediction method for PEMFC by integrating ELM based on an auto-encoder and the fuzzy extension broad learning system, demonstrating superior competitiveness in accuracy, especially when applied to power time series with multiple input variables. Li et al. [29] decomposed voltage data into linear and nonlinear parts and applied the autoregressive integral moving average (ARIMA) and attention-based gated recurrent unit (GRU) for prediction, respectively, which achieved good prediction results. However, the prediction effect of the individual model is limited, so the integrated model, which blends multiple models, is gradually preferred by academics and employed in various fields, among which the common integrated models contain bagging, boosting, and stacking [30]. Compared to the other two integrated models, stacking is able to effectively merge heterogeneous model variation characteristics to achieve better prediction than a single model [31]. Specifically, base models utilize their respective strengths to obtain forecast results, which are integrated by the meta-model to obtain final composite forecast results [32]. The stacked generalization model is rarely applied in the field of fuel cells at present, and the meta-model in the stacked generalization model has limited ability to focus on important information and cannot fully utilize the forecast result from the base models. For this reason, an attention-based stacked generalization model (ASGM) is proposed in which base models not only contain ELM with better nonlinear fitting ability and KRR with strong high-dimensional data processing ability but also choose TCN with long-time sequence learning ability. Furthermore, attention-based LSTM with a strong generalization capability is employed as the meta-model layer. By introducing a meta-model with an attention mechanism, it can adaptively adjust the weights of the base model. This allows it to enhance the impact of the high-precision base model as well as diminish the influence of the lower-precision base model, contributing to achieving a better understanding of the base model outputs and improving prediction accuracy.
For the meta-model layer, the parameters of LSTM directly impact prediction results and can be calibrated in an artificial way, an empirical way, and using an optimizer. Among them, artificial and empirical methods mainly calibrate the parameters through human awareness or experience subjectively, which makes it difficult for LSTM to achieve optimal prediction performance. Contrastively, optimization algorithms can solve this problem by automatically searching the optimal parameters, such as the grey wolf optimization algorithm [33], sine cosine algorithm [34], and dung beetle optimization [35]. Wang et al. [25] proposed a stacked LSTM model to predict the degradation of PEMFC and achieved good predictions using a differential evolutionary algorithm to optimize the hyperparameters. Ren et al. [36] employed a particle swarm optimization algorithm to select the parameters of LSTM. In Ref. [37], the grey wolf optimizer algorithm was employed to optimize support vector regression. To boost the performance of optimization algorithms further, a variety of complementary strategies have been successively proposed, such as the Levy flight strategy, polynomial variation strategy, and adaptive variation strategy. For example, Liu et al. [38] enhanced the candidate selection process in ant colony optimization by integrating the Levy flight strategy, ensuring both rapid search speed and an expanded search space for improved performance. Motivated by previous studies, an improved dung beetle optimization (IDBO) algorithm is presented in this paper to calibrate the optimal parameters of LSTM, which contributes to the improvement of the prediction accuracy. To promote the performance of dung beetle optimization (DBO), Levy flight [38] and polynomial variation strategy [39] are introduced to enhance global exploration ability, as an adaptive variation strategy [40] is embedded to avoid trapping into local optimal solution and thus maintain solution diversity in later iterations.
1.3. Research Gaps and Contributions
In conjunction with the above discussion, a summary is presented of the challenges faced by current researchers. Firstly, stacking has the problem of the output information of the base models not being fully utilized. Secondly, existing studies often rely on empirical values or manual selection to determine model hyperparameters, which cannot guarantee optimal prediction performance. In addition, existing research often neglects to provide an extensive discussion of the precise choice of the best input variables for the model, which is a critical element influencing forecast precision. To address the above challenges, a compound forecasting framework incorporating LOESS, UIC, and ASGM with IDBO is presented to forecast the FDT and RUL of PEMFC. Within the proposed framework, LOESS is regarded as a preprocessing method to filter original degraded sequences. Then, UIC is applied to obtain critical information by selecting relevant factors of the processed degraded sequences. Subsequently, the critical information is input into base models of ASGM, including KRR, ELM, and TCN, for prediction to acquire corresponding forecast results, respectively. Finally, the forecast results are fused using the meta-model attention-based LSTM of ASGM to obtain FDT and RUL, in which the attention mechanism is introduced to deduce weight coefficients of the base model prediction results in the dense layer of LSTM, where the proposed IDBO is applied to search optimum parameters in LSTM. The main contributions of this paper are illustrated below:
- (1)
- In view of the problem that the meta-model of stacking has a limited ability to capture significant information output of the base models, ASGM integrating the single model ELM, KRR, TCN, and LSTM is established, and an attention mechanism module is embedded into stacking to improve the prediction effect further.
- (2)
- IDBO is employed to optimize the hyperparameters of LSTM to achieve higher forecasting accuracy, where IDBO is attained by embedding the Levy flight strategy, adaptive variation, and polynomial variation into DBO to promote the global and local detection ability.
- (3)
- UIC is utilized in the selection of input variables to capture critical information, which is able to decrease the training complexity and enhance the overall efficiency of the proposed model.
The rest of this article is structured as follows. Section 2 presents theoretical approaches. Section 3 details the proposed framework and its procedures. Data processing and experimental setup are described in Section 4. Section 5 demonstrates the experiment and contrastive results, while Section 6 presents the conclusion.
2. Related Methodologies
2.1. Locally Weighted Scatterplot Smoothing (LOESS)
LOESS stands out as a non-parametric anti-noise method founded in local regression analysis and possesses superior performance when fitting data with complex waves in comparison to classical linear and polynomial regression [41]. It consists of predefining a window and specifying a weighted regression based on a range of neighboring data to obtain a smoothed value. Assuming that x and y are the data to be smoothed, the procedure can be formulated as follows:
In the corresponding smoothed fitting equation , a and b are defined as follows:
where and denote the weighted average of x and y, respectively.
2.2. Uniform Information Coefficient (UIC)
UIC is a novel correlation analysis method that was proposed in 2022. The feature datasets are represented as and , respectively, where n represents the number of features, m represents the number of samples, and the mutual information (MI) value is as follows:
where is the joint probability density of X and Y, and and imply the marginal probability densities of X and Y, respectively.
For a finite sample data set , the distribution range of x and y is randomly divided into a and b segments, and an grid can be obtained using B, which is defined as one of the many partition methods. Then, the MI values of each grid in different partition methods are calculated to obtain the maximum value of , in which the partition method is called Bmax. Therefore, under the partition mode Bmax, the mutual information value of A is called the maximum mutual information coefficient, and the value is obtained as follows:
where means that data set A is meshed using B. The maximum mutual information obtained under the partition mode Bmax is normalized to obtain , and the calculation formula is as follows:
Taking the of each sample and the label to form the coefficient matrix, the maximal information coefficient (MIC) [42] of the original sample set is obtained, and the expression is outlined below:
where BT denotes the set of all partition methods of the grid . The grid partition method of MIC is based on the dynamic programming algorithm, which has become the mainstream algorithm for calculating the correlation of variables. However, the calculation of MIC must determine the maximum mutual information value in all partition methods, which leads to low speed and efficiency.
UIC makes correlation analysis more concise and efficient using a uniform partitioning algorithm (UPA) and reduces the impact of data noise on correlation analysis by noise estimation [43]. In UIC, the dynamic programming algorithm is not considered to determine the best data grid, but the grid is uniformly divided by UPA. For n-dimensional variable , each dimension of the data is uniformly divided into a′ segments; then, the length of each cell is . Similarly, for the variable , the data range is divided evenly into segments; then, each cell is . Naming the above partition methods as U, the calculation expression of UIC is as follows:
2.3. Attention-Based Stacked Generalization Model (ASGM)
2.3.1. Extreme Learning Machine (ELM)
ELM, as a fast and accurate learning algorithm, can ensure the matrix of implied neurons H remains unchanged during training compared to other machine learning methods [44]. The output weight matrix is computed at once by calculating a generalized inverse matrix of the form.
In ELMs, for N arbitrary samples (Xj, tj), the network with M hidden layer neurons is calculated as follows:
where , implies the activation function, wi denotes the hidden layer threshold value, βi implies the threshold of the output layer, and bi denotes the boundary value. Assuming that the output is approximately equal to the training sample, the presence of βi, wi, and bi facilitates the following:
The equation shown in the preceding paragraph is representable in matrix form:
where β represents the output weight matrix, T denotes the target matrix, and H implies the hidden layer output matrix.
2.3.2. Kernel Ridge Regression (KRR)
Based on the kernel technique, KRR nonlinearly transforms the time series data patterns into high-dimensional eigenspace [45]. Let the given training set be , then the nonlinear mapping function converts the original input space into a high-dimensional feature space. The linear regression model is expressed as follows:
where represents the relaxation variable, and βi forms the weight vector β.
The weight vector β is obtained by the least squares method:
where C denotes the regularization coefficient. Among which, the following is applicable:
Introducing the Lagrange multiplier yields the following:
Compute the output weight vector β as follows:
where , and I is the identity matrix of dimension.
Adding positive values of I/C to the diagonal elements of matrix can produce stable solutions for β, enhancing its generalization capability.
In the feature space, the inner product can be represented in kernel form by Mercer conditions:
Therefore, the corresponding regression equation is obtained as follows:
where K denotes the kernel matrix .
2.3.3. Temporal Convolutional Network (TCN)
TCN, as a one-dimensional full convolutional network, combines the structure of causal convolution suitable for sequences and dilated convolution with a residual module suitable for historical data memory [27]. As to the large time span of the PEMFC degradation data, dilation convolution with the residual module can learn more historical data. The structure of dilation convolution is shown in Figure 1.
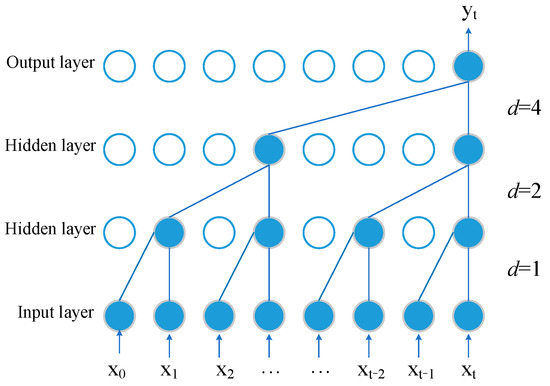
Figure 1.
The structure of dilation convolution.
For temporal sequence x, the output of the s-th neuron after a single dilation convolution is represented as follows:
where d implies the expansion coefficient, k denotes the convolution kernel size, f(i) implies the i-th element of the convolution kernel, and xs−di implies convolving for only the states over the past.
The residual module can effectively solve the performance degradation problem due to the deepening of the layers of the deep learning network, and its core idea is introducing residual connections to skip hidden layers [46]. The architecture of the residual module is shown in Figure 2.
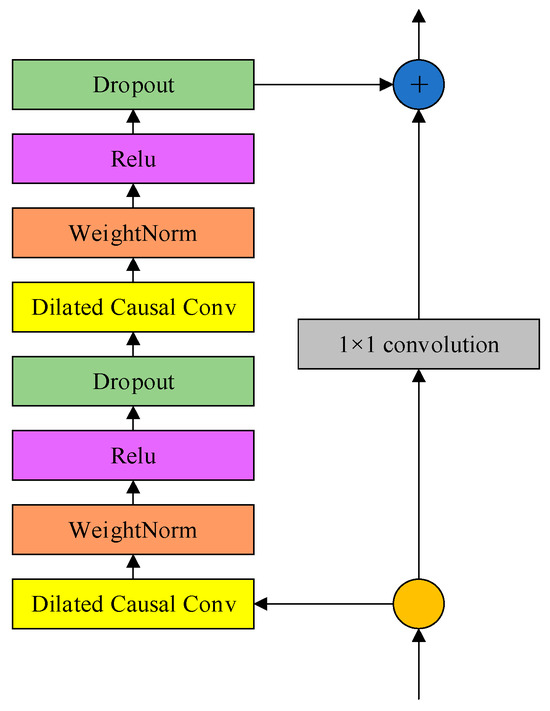
Figure 2.
The structure of the residual module.
2.3.4. Long Short-Term Memory Network (LSTM)
Compared to conventional recurrent neural networks, LSTM has advantages in aspects of controlling the memory state, making it suitable for dealing with problems that are highly correlated with time series [47]. LSTM network normally consists of an input layer, output layer, hidden layer memory cells, and peephole connections. The core formulations of LSTM are shown below [48]:
where ft represents the output of forget gate, σ(∙) denotes the hidden layer whose activation function is sigmoid, Wxf, Wxi, Wxc, and Wxo represent different weighting matrices, Whf, Whi, Whc, and Who are recurrent weight matrices, Wcf, Wci, Wcc, and Wco are peephole weight matrices, bi, bf, bc, and bo represent different kinds of biases, ht−1 is the output of the module at the previous moment, xt denotes the input of the module at moment t, ct−1 is the state of the module at the previous moment, ct indicates output gate, ot represents the memory cell state, it denotes the input gate, and ht denotes the output of the module at that moment.
2.3.5. Attention Mechanism
The essence of the attention mechanism is directing limited focus to essential information. It involves modifying the weights of dominant features within the hidden layer, which enables the extraction of more valuable information and improves task performance [49]. In this paper, by introducing a meta-model with an attention mechanism, the weights of the results from the base model can be adaptively adjusted, enhancing the impact of high-precision base model outputs on the prediction results while diminishing the influence of lower-precision base model outputs. Its architecture is depicted in Figure 3.
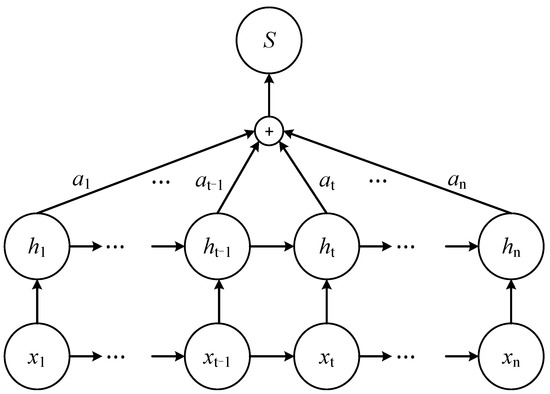
Figure 3.
The structure of the attention mechanism model.
The attention mechanism first calculates the attention probability distribution value based on the output of LSTM:
where u and w represent weight coefficients, b stands for bias coefficient, is the hidden layer output obtained by LSTM corresponding to each input, and et donates the attention weight at moment t determined by the output layer vector ht of LSTM network.
Secondly, the attention scores are normalized using the softmax function, as shown below:
where represents the weight of the attention mechanism corresponding to the output of the hidden layer of LSTM.
Finally, the calculated value is weighted and summed with vector ht to obtain state value yt. The formula is as follows:
where represents the output value of the attention mechanism.
2.3.6. The Proposed Attention-Based Stacked Generalization Model (ASGM)
Stacking is characterized as a sophisticated nonlinear amalgamation strategy, which applies a meta-model to fuse the outputs of base models. To enhance the forecasting accuracy of FDT and RUL of PEMFC, an attention-based stacked generalization model (ASGM) is proposed in this paper. Firstly, ELM, KRR, and TCN are employed as base models of ASGM to achieve stacking modeling to enhance the forecasting accuracy, where ELM has the better nonlinear fitting ability, KRR has good adaptability to high-dimensional data, and TCN is able to capture long-time dependencies in a time series. Thus, prediction results corresponding to the prediction outputs of base models are obtained. An attention mechanism is introduced to deduce the weight coefficients of prediction results in the dense layer of LSTM. Then, attention-based LSTM with strong generalization capability is applied as the meta-model of ASGM to fuse the predicted prediction results and obtain FDT and RUL of PEMFC, which can enhance the impact of high-precision base model outputs on the prediction results and diminish the influence of lower-precision base model outputs. The concrete implementation procedures of ASGM are listed as shown below:
Step 1: Divide the data set. Historical degradation data are segmented into two parts, which are S_train = and S_test = , where the output of S_train and S_test are denoted by Y_train = and Y_test = , respectively. Based on three-fold cross-validation, S_train is separated into three sub-training components, , with M/3 samples each. In addition, the training and testing sets are DSk = STS − STS4−k and STS4−k in k-th fold cross-validation, respectively.
Step 2: Model and train base models of ELM, KRR, and TCN. Firstly, the base models are modeled and trained to adopt DSk, after which STS4−k and S_test are imported into each base model to obtain the prediction results and in order.
Step 3: Build the training and testing set for the meta-model attention-based LSTM. By reconstructing the SMi and AMi of the three base models, the training matrix SM = [SME, SMK, SMT] and the testing matrix AM = [AME, AMK, AMT] are obtained. The matrices SME, SMK, and SMT are acquired by stacking . The matrices AME, AMK, and AMT are gained by averaging . The reconstructed matrices are employed as the input data of the meta-model attention-based LSTM. The corresponding outputs are denoted as Y_train and Y_test, respectively.
Step 4: Meta-model attention-based LSTM integrates prediction results. SM and Y_train are utilized to train the meta-model attention-based LSTM, and the trained model is employed to fuse AM to obtain the FDT and RUL.
2.4. The Proposed IDBO for Optimization
As a new algorithm inspired by the habits of dung beetles and proposed in 2022, DBO [35] simultaneously considers global search and local search, demonstrating features by rapid convergence and high accuracy, divided into five steps in the update iteration process: ball rolling, dancing, foraging, breeding of dung beetles, and stealing. Although DBO shows excellent performance in some applications, it also presents some limitations, such as inadequate global search ability and premature convergence to local optima. To address these shortcomings, IDBO is proposed in this paper with specific enhancement strategies. In order to improve the global search capability, the Levy flight strategy [38] is introduced into the dancing process of the DBO algorithm, which can prevent the beetle from falling into local optimum while performing a global search. The next iteration calculation for the beetles is updated as follows:
where d and indicate the random number and step length of dung beetles, respectively, d0 denotes a constant, indicates the Levy index, whose value is a random number in scope [0, 2], and 1.5 is taken in this paper.
The detailed description of Levy flight can be summarized as Equation (33):
where u and v are normal distributions and represents the standard gamma function.
In order to further improve the searching ability of DBO in the whole space and maintain the solution diversity of the late iterations, polynomial variation is introduced in the stealing process, which can be formulized as follows [39]:
where indicates the position of the primitive dung beetle, represents the optimal individual position after mutation, u denotes the upper limit value, and 0.7 is taken in this paper. l indicates the lower limit value, and 0.1 is taken in this paper. s and denote random numbers in scope [0, 1].
In order to improve the ability of DBO to escape local optima, an adaptive variation strategy [40] is introduced, which acts on the optimal dung beetle:
where denotes the position of the best dung beetle after mutation, X* represents the position of the best dung beetle before mutation, and and denote standard Gaussian variation and standard Cauchy variation, respectively. indicates the mutation control coefficient, and adaptively adjusts with the number of iterations to coordinate the local development and global exploration capacity.
The mutated position may not necessarily be better than the original one, so a greedy selection strategy is employed to define a favorable evolution direction. The steps for updating the position are as follows:
- (1)
- obtain the position information of the optimal dung beetle X*;
- (2)
- perform the mutation operation on X* to obtain the new position according to Equation (44);
- (3)
- compare the fitness values of the two positions to update them optimally. Thus, the optimal position of dung beetles can be formulated as follows:
Optimization Process of IDBO-ASGM
The optimal hyperparameters of ASGM are calibrated by the proposed IDBO. Specifically, IDBO is employed to optimize the epochs of training and the initial learning rate of LSTM. The detailed procedures are as follows:
Step 1: Set the parameters of IDBO, including population number, maximum iterations, and search range. Meanwhile, the hyperparameters of LSTM are treated as the position of the dung beetle, and the root mean square error between the predicted values and the real values is employed as the objective function.
Step 2: Calculate the fitness values of all target agents according to the objective function, update the positions of all dung beetles based on Levy flight and polynomial variation strategies, and make the updated positions as new hyperparameters of LSTM.
Step 3: Take the final position of the dung beetle as the best fitness position X*, perform adaptive mutation operation on X* according to Equation (39), and judge whether to retain the mutated individual according to Equation (40).
Step 4: Repeat steps 2 and 3 until the maximum number of iterations is reached.
Step 5: Output optimal parameters of LSTM.
3. PEMFC FDT and RUL Forecasting Framework Based on LOESS, UIC, ASGM, and IDBO
In this section, a compound forecasting framework incorporating LOESS, UIC, and ASGM with IDBO is presented to forecast the FDT and RUL of PEMFC. The detailed procedures are depicted in Figure 4 and outlined below:
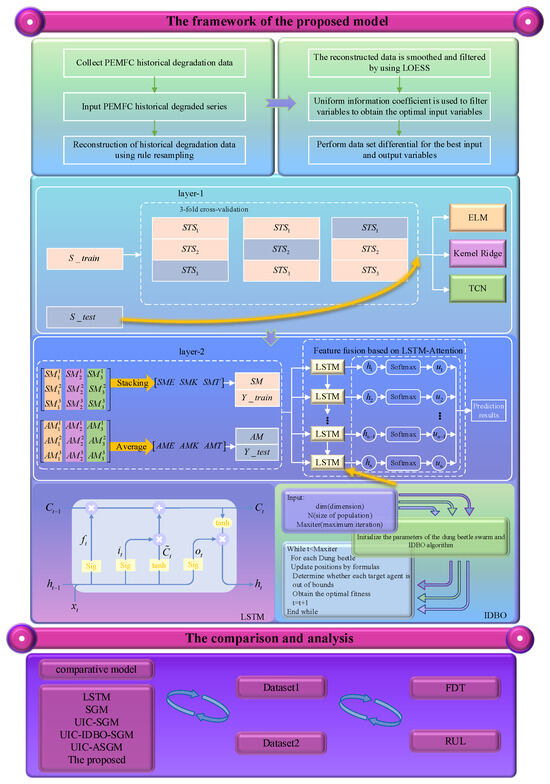
Figure 4.
Flow chart of the proposed UIC-IDBO-ASGM prediction model.
Step 1: Historically degraded datasets are processed through a half-hour interval resampling, after which LOESS is deployed to filter the reconstructed data to remove noise and spikes.
Step 2: Optimal input variables are obtained by employing UIC to select the processed data.
Step 3: Perform dataset splits based on three-fold cross-validation with the best input and output variables.
Step 4: A split dataset is input into the base models of ASGM, including KRR, ELM, and TCN, for prediction to acquire corresponding prediction results.
Step 5: The prediction results are reconstructed by stacking and averaging to obtain the input data for the meta-model.
Step 6: The reconstructed data are input into the meta-model attention-based LSTM of ASGM to obtain the FDT and RUL of PEMFC. Meanwhile, IDBO is applied to calibrate the parameters of LSTM.
Step 7: The RMSE, MAPE, and R2 between the predicted and true values are calculated to verify the generalization ability and prediction accuracy of the model.
4. Experiment
4.1. Data Preprocessing
The FCLAB released the PEMFC durability experimental dataset in the 2014 Data Challenge [18,50]. One dataset, FC1, was operated under static conditions, roughly at rated conditions, with a load current of 70 A. The other dataset, FC2, was operated under quasi-dynamic conditions with a load current set to 70 A but with a 10% triangular current ripple (5 kHz). Table 1 shows the relevant information on degradation parameters monitored by the PEMFC reactor experiment.

Table 1.
Aging parameter information in FC1 and FC2.
Considering the vast quantity of collected data points exceeding 100,000, from the PEMFC stack degradation, data reduction and extraction of representative data are essential. The degradation dataset is reconstructed by regular sampling at half-hour intervals. Meanwhile, LOESS is applied to process the reconstructed data to remove noise and spikes, creating two new degradation datasets, FC1 and FC2 [25]. In particular, stack voltage fluctuates or decreases significantly over time, while the other parameters do not change obviously. Thus, stack voltage is adopted as an indicator to detect the health of the PEMFC in this study. The stack voltage degradation trend of FC1 and FC2 after resampling and smoothing is illustrated in Figure 5a,b, from which it can be seen that the processed dataset retains the primary trends of the original data and eliminates noise and spikes effectively.
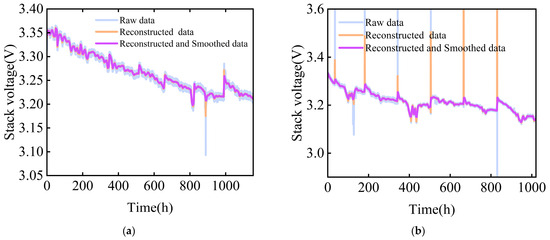
Figure 5.
Degradation data of stack voltage: (a) FC1 and (b) FC2.
It is noteworthy that the degradation data include 24 variables, among which stack voltage is chosen as the output variable. Further analysis is necessary to determine whether all of the remaining variables contribute to the degradation of the stack voltage of PEMFC. To do this, UIC is adopted to select the input variables. Firstly, the UIC values between the remaining variables and the stacked voltage are calculated, and the results are shown in Figure 6. Thus, U1~U5 are adopted as the best input variables for FC1 and FC2. The input dataset is composed of the optimal input and output variables, where the first 50% of the data are allocated for training, and the remaining are designated for testing, as shown in Figure 7.
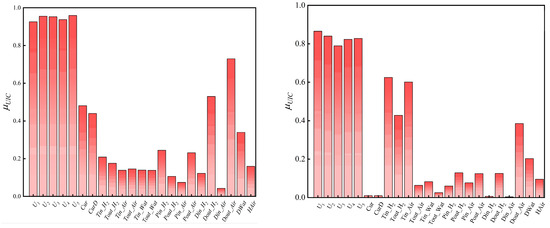
Figure 6.
The calculation results of UIC values.
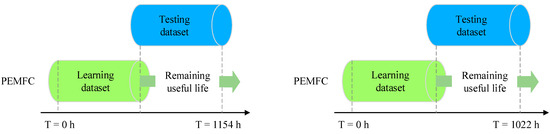
Figure 7.
Illustration of training and testing datasets.
4.2. Model Hyperparameter Setting
To promote the performance of the proposed model, the inherent parameters of ELM and KRR are optimized using a grid search. The search ranges for the number of neurons of ELM and the regularization parameter of KRR are set as [50, 200] and [0, 1], respectively. The internal parameters of LSTM and TCN, including the number of hidden layer nodes, convolution kernel size, batch size, epochs of training, etc., are determined through the trial and error method. The parameters of SGM, UIC-SGM, and UIC-ASGM are consistent with the single models. For UIC-IDBO-SGM and UIC-IDBO-ASGM, IDBO is applied to optimize the parameters of LSTM, where the maximum number of iterations and the population size in IDBO are set to 50 and 30 separately. The optimization search ranges for epochs of training and the initial learning rate of LSTM are [300, 500] and [0, 1], respectively. In particular, Table 2 provides a comprehensive overview of the detailed settings of the parameters for the experiment.
Table 2.
Parameter settings of all experimental models.
5. Results and Discussion
To assess the precision of forecast results, several common indicators, including root mean square error (RMSE), mean absolute percentage error (MAPE), and R square (R2), are introduced to measure the results of all experiments in a comprehensive manner [51]. The smaller the values of RMSE and MAPE, the smaller the error between actual and predicted values, and the nearer R2 approaches 1, the more excellent fit is achieved. The formulas for calculating the three metrics are as follows:
where Y and Y* denote the observed and forecasted stack voltage values, respectively. In addition, in the experiments of FC1 and FC2, RUL is regarded as the time before reaching a certain level of voltage loss. Specifically, 3.0%, 3.5%, and 4.0% of the initial voltage (Vinit = 3.35 V) are considered as the failure thresholds (FTS) of FC1. Under the quasi-dynamic condition, the stack voltage of the fuel cell degrades more severely compared to the static condition. Similar to static operation, 4.5%, 5.0%, and 5.5% of the initial voltage (Vinit = 3.33 V) are considered as FTS for FC2. Meanwhile, the final score accuracy (FAscore) of whole forecasting at different FTS is applied to assess the model’s prediction results on RUL [52]. When the FAscore approaches 1, it indicates that the model is more accurate and has better prediction performance [52]. The score is calculated as follows:
- (1)
- Compute the predicted RUL (PRUL) and observe RUL (ORUL) with various FTS:where Tpred denotes the start moment of prediction, ToFT indicates the moment when the original signal first arrives at FTS, and TpFT implies the moment when the predicted signal first arrives at FTS.
- (2)
- Compute the error (Er) between PRUL and ORUL:
- (3)
- Compute the accuracy score (Ascore) of RUL prediction:
- (4)
- Average the Ascore under all FTS to obtain the FAscore:where Z denotes the value of defined FTS and is set to three in this study.
In addition, the percentage improvement index (index = RMSE, MAPE, and R2) is also employed to represent the extent of improvement in the prediction results of the proposed model. The computational formula is as follows:
where and represent the values of the evaluation indicators for the proposed model and the comparison model, respectively.
5.1. Results
5.1.1. Future Degradation Trend Forecasting Results
The evaluation indicator results of the six models in predicting FDT for FC1 are provided in Table 3, as well as displayed in Figure 8 for visual representation. The following conclusions can be drawn according to Table 3 and Figure 8: (i) UIC-IDBO-ASGM achieves the optimal forecasting performance. The proposed model exhibits the best RMSE and MAPE, which are 0.00147 and 4.296. Moreover, R2 stands at 0.98969, which is nearest to 1. (ii) UIC-SGM shows superior forecasting performance compared to SGM, with smaller RMSE and MAPE and larger R2, revealing that UIC is able to optimize the input variables efficiently. (iii) Comparing the forecasting results of UIC-SGM, UIC-ASGM, UIC-IDBO-SGM, and UIC-IDBO-ASGM, it is evident that the fusion of IDBO and attention mechanism into SGM can improve the prediction performance, indicating that optimizing model hyperparameters using IDBO is effective, and the attention mechanism can enhance the learning capability of the meta-model.
Table 3.
Evaluation results in FC1.
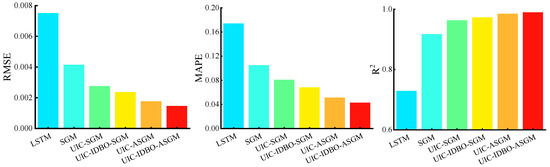
Figure 8.
RMSE, MAPE, and R2 of the six models adopted to predict FDT for FC1.
Likewise, Table 4 and Figure 9 present the evaluation indicator results of the six models in predicting FDT for FC2. Similar conclusions can be obtained according to Table 4 and Figure 9: (i) UIC-IDBO-ASGM achieves the best results with the smallest RMSE and MAPE of 0.00212% and 0.04572%, respectively, and R2 of 0.99359. (ii) UIC effectively selects input variables, and UIC-SGM outperforms SGM in terms of RMSE, MAPE, and R2. (iii) Introducing the IDBO for hyperparameter optimization and incorporating attention mechanism to enhance the learning capability of the meta-model both improve forecasting performance. In addition, prediction curves and linearly fitted scatter plots are drawn to further show the superior performance of the proposed model intuitively for LSTM, SGM, UIC-SGM, UIC-ASGM, and UIC-IDBO-SGM, as shown in Figure 10 and Figure 11 for FC1 and FC2, respectively. In the magnified view, it is evident that the prediction curve of the proposed model closely aligns with the actual curve. It is notable that the proposed model exhibits the narrowest 95% prediction band in the linear fit scatter plot. The above conclusions illustrate that UIC-IDBO-ASGM can achieve better performance in predicting FDT.
Table 4.
Evaluation results in FC2.
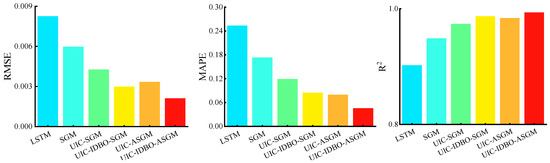
Figure 9.
RMSE, MAPE, and R2 of the six models adopted to predict FDT for FC2.
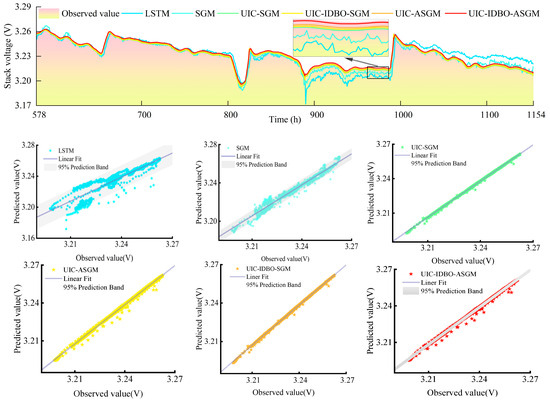
Figure 10.
FDT prediction results for FC1.
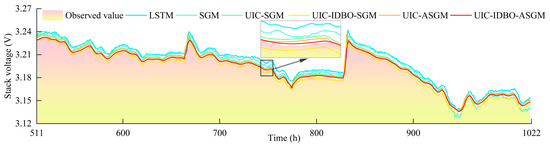
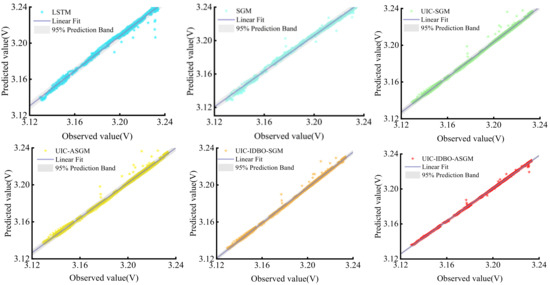
Figure 11.
FDT prediction results for FC2.
5.1.2. Remaining Useful Life Forecasting Results
In the static operation task, the experiment data come from a 1050 h duration test on the PEMFC reactor. For FC1, the actual values of RUL at various FTS conditions are 63 h (3.0%), 227 h (3.5%), and 232 h (4.0%), respectively. Table 5 and Figure 12 present the FAscores for the six models. It is observed that the FAscores for the six models are 0.6708, 0.7837, 0.8912, 0.9293, 0.93192, and 0.9671, respectively, with the FAscore of UIC-IDBO-ASGM nearest to 1. When FT is 3%, the RUL forecasted with the proposed model is 62 h, advancing one hour from reaching the failure threshold, which can facilitate maintenance of the PEMFC system. In summary, the prediction performance of the proposed model is pleasurable in static operation tasks.
Table 5.
The final scores in the FC1 evaluation.
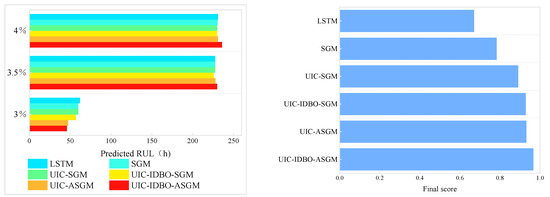
Figure 12.
RUL prediction results of the six models for FC1.
Likewise, the actual values of RUL at various FTS conditions are 246 h (4.5%), 264 h (5%), and 424 h (5.5%) in FC2, respectively. The FAscore for RUL forecast precision of the six models is presented in Table 6 and Figure 13, from which it can be noticed that the FAscore of RUL forecast precision for UIC-IDBO-ASGM is 0.9832, which is closest to 1. When FT is 5%, the RUL forecasted with the proposed model is 263 h, which is one hour ahead of reaching the failure threshold. The results demonstrate that the proposed model also exhibits excellent forecasting performance for FC2. On the whole, the proposed UIC-IDBO-ASGM attains the optimal prediction performance under the two conditions.
Table 6.
The final scores in the FC2 evaluation.
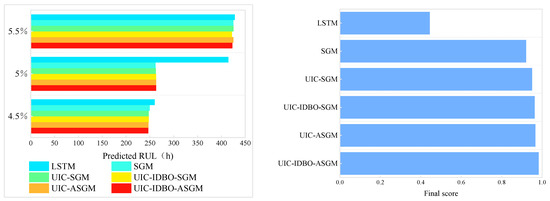
Figure 13.
RUL prediction results of the six models for FC.
5.2. Discussion
5.2.1. Discussion on the Effectiveness of UIC
To ascertain the effectiveness of UIC, the performance improvement percentages between contrastive models with and without UIC for predicting FC1 and FC2 are presented in Table 7, from which it can be seen that the performance of models with UIC has improved to different degrees. Taking FC2 prediction as an example, UIC-SGM reduces RMSE by 33.49%, MAPE by 22.94%, and improves R2 by 5.00% compared to SGM, which demonstrates UIC can effectively eliminate irrelevant variables and select the best input variables, thus promoting the prediction performance.
Table 7.
Performance improvement percentages.
5.2.2. Discussion on the Effectiveness of the Proposed IDBO
To validate the effectiveness of the proposed IDBO, nine benchmark functions are applied for analysis. Meanwhile, DBO, WOA, ALO, SCA, GWO, and MFO are employed for comparison. The nine benchmark functions illustrated in Table 8 include unimodal functions (F5, F6, and F7), multimodal functions (F10, F12, and F13), and fixed-dimension multi-modal functions (F14, F15, and F17) [53].
Table 8.
Benchmark functions.
All algorithms are run 10 times on each benchmark function with population size and maximum iteration number set to 30 and 200, respectively [54]. In addition, two statistical metrics, average (Ave.) and standard deviation (Std.), are applied as evaluation indicators. Figure 14 illustrates the convergence curves, and Table 9 provides a performance comparison. Table 9 reveals that IDBO achieves superior performance and better convergence speed among all optimization algorithms. As shown in Figure 14, compared with other algorithms, IDBO not only performs well in discovering globally optimal solutions but also exhibits promising convergence within a relatively short time. For F17, although IDBO has similar search results compared to the other algorithms, IDBO converges faster. Moreover, the performance improvement of the prediction model with IDBO is demonstrated in Table 7. Taking FC2 as an example, compared to UIC-SGM, UIC-IDBO-SGM achieves a reduction of 30.14% for RMSE and a decrease of 28.92% for MAPE, while R2 is increased by 1.37%. In summary, the proposed IDBO demonstrates robust global search capability and can effectively optimize the parameters of the prediction model.
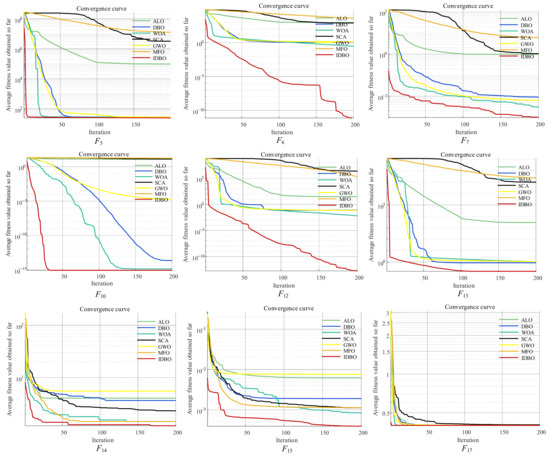
Figure 14.
Convergence curves of IDBO, DBO, ALO, WOA, SCA, GWO, and MFO for different benchmark functions.
Table 9.
Performance comparison algorithms.
5.2.3. Discussion on the Effectiveness of the Proposed ASGM
The prediction results of the proposed model surpass those of comparative models, as illustrated in Table 3 and Table 4, from which it can be concluded that the proposed ASGM integrating attention mechanism into the meta-model of SGM attains promising forecasting performance. In addition, it is obvious from Table 7 that the performance of the prediction model blended with the attention mechanism is improved to some extent. In the case of FC1, the RMSE and MAPE of UIC-IDBO-ASGM are decreased by 37.9% and 37.1%, respectively, compared to UIC-IDBO-SGM, while R2 is raised by 1.718%. The experimental results demonstrate that integrating the attention mechanism can further enhance the learning ability of the meta-model, thus improving the prediction performance of the overall model.
6. Conclusions
To enhance the forecasting accuracy of the FDT and RUL for PEMFC, a compound framework incorporating LOESS, UIC, and ASGM with IDBO is proposed in this paper. Within the proposed framework, UIC is adopted to acquire critical information by selecting relevant factors of the degraded sequences, which are filtered by LOESS. Subsequently, base models of ASGM are applied to acquire corresponding prediction results by forecasting critical information. Finally, the meta-model attention-based LSTM of ASGM, in which the attention mechanism is introduced to deduce weight coefficients of prediction results in the dense layer of LSTM, is employed to fuse the corresponding prediction results for obtaining FDT and RUL. Meanwhile, an IDBO based on Levy flight, adaptive mutation, and polynomial mutation strategies is utilized to optimize the parameters of LSTM. Through the application of two different datasets of PEMFC and comparison with five related models, the conclusions are obtained as follows: (1) for RMSE, the MAPE of UIC-IDBO-ASGM attains the smallest and its R2 attains the largest, demonstrating that UIC-IDBO-ASGM has a better prediction performance; (2) the proposed IDBO surpasses the comparative optimization algorithm, such as DBO, WOA, ALO, SCA, GWO, and MFO, which can supply adequate support for ASGM; (3) UIC-based correlation analysis methods can be effective to eliminate irrelevant variables and select the best input variables; (4) the introduction of a meta-model with an attention mechanism in ASGM can effectively fuse the prediction results of the base models to obtain better prediction results. Future research will focus on exploring long-term aging prediction and RUL online estimation under dynamic operating conditions.
Author Contributions
Methodology, software, experiments, and writing the original draft, C.W.; conceptualization and review of this manuscript, W.F.; supervision and project management, Y.S.; software, M.S. All authors have read and agreed to the published version of the manuscript.
Funding
This work was funded by the Natural Science Foundation of Hubei Province of China (No. 2022CFB935) and the Open Fund of Hubei Key Laboratory for Operation and Control of Cascaded Hydropower Station (No. 2022KJX10).
Data Availability Statement
The datasets in this paper are public datasets, which are available at https://search-data.ubfc.fr/FR-18008901306731-2021-07-19_IEEE-PHM-Data-Challenge-2014.html (accessed on 13 April 2024).
Conflicts of Interest
The authors declare no competing interests.
Abbreviations
| ASGM | Attention-based Stacked Generalization Model |
| ARIMA | Autoregressive Integral Moving Average |
| Ave. | Average |
| DBO | Dung Beetle Optimization |
| ELM | Extreme Learning Machine |
| ESN | Echo State Network |
| FDT | Future Degradation Trend |
| FAscore | Final Score Accuracy |
| FTS | Failure Thresholds |
| GRU | Gated Recurrent Unit |
| IDBO | Improved Dung Beetle Optimization |
| KRR | Kernel Ridge Regression |
| LOESS | Locally Weighted Scatter Plot Smoothing |
| LSTM | Long Short-term Memory Neural Network |
| MAPE | Mean Absolute Percentage Error |
| PEMFC | Proton Exchange Membrane Fuel Cell |
| UIC | Uniform Information Coefficient |
| RUL | Remaining Useful Life |
| R2 | R Square |
| RMSE | Root Mean Square Error |
| SGM | Stacked Generalization Model |
| Std. | Standard Deviation |
| TCN | Temporal Convolutional Network |
References
- Liu, Z.; Xu, S.; Zhao, H.; Wang, Y. Durability estimation and short-term voltage degradation forecasting of vehicle PEMFC system: Development and evaluation of machine learning models. Appl. Energy 2022, 326, 119975. [Google Scholar] [CrossRef]
- Li, W.; Zhang, Q.; Wang, C.; Yan, X.; Shen, S.; Xia, G. Experimental and numerical analysis of a three-dimensional flow field for PEMFCs. Appl. Energy 2017, 195, 278–288. [Google Scholar] [CrossRef]
- Zhou, D.; Gao, F.; Breaz, E.; Ravey, A.; Miraoui, A. Degradation prediction of PEM fuel cell using a moving window based hybrid prognostic approach. Energy 2017, 138, 1175–1186. [Google Scholar] [CrossRef]
- Liu, H.; Chen, J.; Hissel, D.; Lu, J.; Hou, M.; Shao, Z. Prognostics methods and degradation indexes of proton exchange membrane fuel cells: A review. Renew. Sustain. Energy Rev. 2020, 123, 109721–109743. [Google Scholar] [CrossRef]
- Zuo, J.; Lv, H.; Zhou, D.; Xue, Q.; Jin, L.; Zhou, W. Deep learning based prognostic framework towards proton exchange membrane fuel cell for automotive application. Appl. Energy 2021, 281, 115937–115950. [Google Scholar] [CrossRef]
- Wang, C.; Wang, Z.; Chu, S.; Ma, H.; Yang, N. A two-stage underfrequency load shedding strategy for microgrid groups considering risk avoidance. Appl. Energy 2024, 367, 123343. [Google Scholar] [CrossRef]
- Zhou, D.; Wu, Y.; Gao, F. Degradation prediction of PEM fuel cell stack based on multiphysical aging model with particle filter approach. IEEE Trans. Ind. Appl 2017, 53, 4041–4052. [Google Scholar] [CrossRef]
- Chen, K.; Laghrouche, S.; Djerdir, A. Fuel cell health prognosis using Unscented Kalman Filter: Postal fuel cell electric vehicles case study. Int. J. Hydrogen Energy 2019, 44, 1930–1939. [Google Scholar] [CrossRef]
- Ma, R.; Yang, T.; Breaz, E.; Li, Z.; Briois, P.; Gao, F. Data-driven proton exchange membrane fuel cell degradation predication through deep learning method. Appl. Energy 2018, 231, 102–115. [Google Scholar] [CrossRef]
- Benaggoune, K.; Yue, M.; Jemei, S.; Zerhouni, N. A data-driven method for multistep ahead prediction and long-term prognostics of proton exchange membrane fuel cell. Appl. Energy 2022, 313, 118835–118850. [Google Scholar] [CrossRef]
- Chen, K.; Laghrouche, S.; Djerdir, S. Degradation model of proton exchange membrane fuel cell based on a novel hybrid method. Appl. Energy 2019, 252, 113439–113448. [Google Scholar] [CrossRef]
- Pan, R.; Yang, D.; Wang, Y.; Chen, Z. Performance degradation prediction of proton exchange membrane fuel cell using a hybrid prognostic approach. Int. J. Hydrogen Energy 2020, 45, 30994–31008. [Google Scholar] [CrossRef]
- Liu, H.; Chen, J.; Hissel, D.; Su, H. Remaining useful life estimation for proton exchange membrane fuel cells using a hybrid method. Appl. Energy 2019, 237, 910–919. [Google Scholar] [CrossRef]
- Xie, Y.; Zou, J.; Peng, C. A novel PEM fuel cell remaining useful life prediction method based on singular spectrum analysis and deep Gaussian processes. Int. J. Hydrogen Energy 2020, 45, 30942–30956. [Google Scholar] [CrossRef]
- Ao, Y.; Laghrouche, S.; Depernet, D. Proton exchange membrane fuel cell prognosis based on frequency-domain Kalman filter. IEEE Trans. Transport. Electrific. 2021, 7, 2332–2343. [Google Scholar] [CrossRef]
- Wang, P.; Liu, H.; Hou, M. Estimating the Remaining Useful Life of Proton Exchange Membrane Fuel Cells under Variable Loading Conditions Online. Processes 2021, 9, 1459. [Google Scholar] [CrossRef]
- Deng, Z.; Chan, S.; Chen, Q.; Liu, H.; Zhang, L.; Zhou, K.; Fu, Z. Efficient degradation prediction of PEMFCs using ELM-AE based on fuzzy extension broad learning system. Appl. Energy 2023, 331, 120385. [Google Scholar] [CrossRef]
- Hua, Z.; Zheng, Z.; Péra, M.-C.; Gao, F. Remaining useful life prediction of PEMFC systems based on the multi-input echo state network. Appl. Energy 2020, 265, 114791. [Google Scholar] [CrossRef]
- Mezzi, R.; Yousfi-Steiner, N.; Péra, M.C.; Hissel, D.; Larger, L. An Echo State Network for fuel cell lifetime prediction under a dynamic micro-cogeneration load profile. Appl. Energy 2021, 283, 116297. [Google Scholar] [CrossRef]
- Durganjali, C.S.; Avinash, G.; Megha, K. Prediction of PV cell parameters at different temperatures via ML algorithms and comparative performance analysis in Multiphysics environment. Energ. Convers. Manag. 2023, 282, 116881. [Google Scholar] [CrossRef]
- Liao, W.; Fu, W.; Yang, K. Multi-scale residual neural network with enhanced gated recurrent unit for fault diagnosis of rolling bearing. Meas. Sci. Technol. 2024, 35, 056114. [Google Scholar] [CrossRef]
- Yang, J.; Wu, Y.; Liu, X. Proton Exchange Membrane Fuel Cell Power Prediction Based on Ridge Regression and Convolutional Neural Network Data-Driven Model. Sustainability 2023, 15, 11010. [Google Scholar] [CrossRef]
- Chen, K.; Laghrouche, S.; Djerdir, A. Aging prognosis model of proton exchange membrane fuel cell in different operating conditions. Int. J. Hydrogen Energy 2020, 45, 11761–11772. [Google Scholar] [CrossRef]
- Zheng, L.; Hou, Y.; Zhang, T.; Pan, X. Performance prediction of fuel cells using long short-term memory recurrent neural network. Int. J. Energy Res. 2021, 45, 9141–9161. [Google Scholar] [CrossRef]
- Liu, J.; Li, Q.; Chen, W.; Yan, Y.; Qiu, Y.; Cao, T. Remaining useful life prediction of PEMFC based on long short-term memory recurrent neural networks. Int. J. Hydrogen Energy 2019, 44, 5470–5480. [Google Scholar] [CrossRef]
- Ullah, N.; Ahmad, Z.; Siddique, M.F.; Im, K.; Shon, D.-K.; Yoon, T.-H.; Yoo, D.-S.; Kim, J.-M. An Intelligent Framework for Fault Diagnosis of Centrifugal Pump Leveraging Wavelet Coherence Analysis and Deep Learning. Sensors 2023, 23, 8850. [Google Scholar] [CrossRef] [PubMed]
- Pan, M.; Hu, P.; Gao, R. Multistep prediction of remaining useful life of proton exchange membrane fuel cell based on temporal convolutional network. Int. J. Green Energy 2023, 20, 408–422. [Google Scholar] [CrossRef]
- Siddique, M.F.; Ahmad, Z.; Ullah, N.; Kim, J. A Hybrid Deep Learning Approach: Integrating Short-Time Fourier Transform and Continuous Wavelet Transform for Improved Pipeline Leak Detection. Sensors 2023, 23, 8079. [Google Scholar] [CrossRef] [PubMed]
- Li, C.; Lin, W.; Wu, H.; Li, Y.; Zhu, W.; Xie, C.; Gooi, H.B.; Zhao, B.; Zhang, L. Performance degradation decomposition-ensemble prediction of PEMFC using CEEMDAN and dual data-driven model. Renew. Energy 2023, 215, 118913. [Google Scholar] [CrossRef]
- Yuan, Z.; Meng, L.; Gu, X.; Bai, Y.; Cui, H.; Jiang, C. Prediction of NOx emissions for coal-fired power plants with stacked generalization ensemble method. Fuel 2021, 289, 119748. [Google Scholar] [CrossRef]
- Fu, W.; Fu, Y.; Li, B. A compound framework incorporating improved outlier detection and correction, VMD, weight-based stacked generalization with enhanced DESMA for multi-step short-term wind speed forecasting. Appl. Energy 2023, 348, 121587. [Google Scholar] [CrossRef]
- Wolpert, D.H. Stacked generalization. Neural Netw. 1992, 5, 241–259. [Google Scholar] [CrossRef]
- Mirjalili, S.; Mirjalili, S.M.; Lewis, A. Grey wolf optimizer. Adv. Eng. Softw. 2014, 69, 46–61. [Google Scholar] [CrossRef]
- Wang, J.; Yang, W.; Du, P.; Niu, T. A novel hybrid forecasting system of wind speed based on a newly developed multi-objective sine cosine algorithm. Energ. Conver. Manage. 2018, 163, 134–150. [Google Scholar] [CrossRef]
- Xue, J.; Shen, B. Dung beetle optimizer: A new meta-heuristic algorithm for global optimization. J. Supercomput. 2023, 79, 7305–7336. [Google Scholar] [CrossRef]
- Ren, X.; Liu, S.; Yu, X. A method for state-of-charge estimation of lithium-ion batteries based on PSO-LSTM. Energy 2021, 234, 121236. [Google Scholar] [CrossRef]
- Chen, K.; Laghrouche, S.; Djerdir, A. Remaining useful life prediction for fuel cell based on support vector regression and grey wolf optimizer algorithm. IEEE Trans. Energy Convers. 2021, 37, 778–787. [Google Scholar] [CrossRef]
- Liu, Y.; Cao, B. A novel ant colony optimization algorithm with Levy flight. IEEE Access 2020, 8, 67205–67213. [Google Scholar] [CrossRef]
- Abed-alguni, B.H.; Paul, D. Island-based Cuckoo Search with elite opposition-based learning and multiple mutation methods for solving optimization problems. Soft Comput. 2022, 26, 3293–3312. [Google Scholar] [CrossRef]
- Dong, W.; Kang, L.; Zhang, W. Opposition-based particle swarm optimization with adaptive mutation strategy. Soft Computing 2017, 21, 5081–5090. [Google Scholar] [CrossRef]
- Venthuruthiyil, S.P.; Chunchu, M. Trajectory reconstruction using locally weighted regression: A new methodology to identify the optimum window size and polynomial order. Transp. A Transp. Sci. 2018, 14, 881–900. [Google Scholar] [CrossRef] [PubMed]
- Reshef, D.N.; Reshef, Y.A.; Finucane, H.K. Detecting novel associations in large data sets. Science 2011, 334, 1518–1524. [Google Scholar] [CrossRef] [PubMed]
- Mousavi, A.; Baraniuk, R.G. Uniform partitioning of data grid for association detection. IEEE Trans. Pattern Anal. Mach. Intell. 2020, 44, 1098–1107. [Google Scholar] [CrossRef] [PubMed]
- Tang, X.; Chen, F.; Xu, Q. Short-term load forecasting based on multi-dimensional deep extreme learning machine optimized by improved whale algorithm. Shandong Electr. Power 2023, 50, 1–7. (In Chinese) [Google Scholar]
- Naik, J.; Satapathy, P.; Dash, P.K. Short-term wind speed and wind power prediction using hybrid empirical mode decomposition and kernel ridge regression. Appl. Soft Comput. 2018, 70, 1167–1188. [Google Scholar] [CrossRef]
- Huang, Y.; Wen, B.; Liao, W. Image Enhancement Based on Dual-Branch Generative Adversarial Network Combining Spatial and Frequency Domain Information for Imbalanced Fault Diagnosis of Rolling Bearing. Symmetry 2024, 16, 512. [Google Scholar] [CrossRef]
- Fu, W.; Yang, K.; Wen, B.; Shan, Y. Rotating machinery fault diagnosis with limited multisensor fusion samples by fused attention-guided wasserstein GAN. Symmetry 2024, 16, 285. [Google Scholar] [CrossRef]
- Greff, K.; Srivastava, R.K.; Koutník, J. LSTM: A search space odyssey. IEEE Trans. Neural Netw. Learn. Syst. 2016, 28, 2222–2232. [Google Scholar] [CrossRef] [PubMed]
- Guo, M.; Xu, T.; Liu, J. Attention mechanisms in computer vision: A survey. Comput. Vis. Media 2022, 8, 331–368. [Google Scholar] [CrossRef]
- Jin, J.; Chen, Y.; Xie, C.; Zhu, W.; Wu, F. Remaining useful life prediction of PEMFC based on cycle reservoir with jump model. Int. J. Hydrogen Energy 2021, 46, 40001–40013. [Google Scholar] [CrossRef]
- Chen, X.; Wu, J.; Cai, J. Short-term load prediction based on BiLSTM optimized by hunter-prey optimization algorithm. Shandong Electr. Power 2024, 51, 64–71. (In Chinese) [Google Scholar]
- Hua, Z.; Zheng, Z.; Pahon, E. A review on lifetime prediction of proton exchange membrane fuel cells system. J. Power Sources 2022, 529, 231256. [Google Scholar] [CrossRef]
- Fu, W.; Zhang, K.; Wang, K. A hybrid approach for multi-step wind speed forecasting based on two-layer decomposition, improved hybrid DE-HHO optimization and KELM. Renew. Energy 2021, 164, 211–229. [Google Scholar] [CrossRef]
- Wang, K.; Fu, W.; Chen, T. A compound framework for wind speed forecasting based on comprehensive feature selection, quantile regression incorporated into convolutional simplified long short-term memory network and residual error correction. Energy Convers. Manag. 2020, 222, 113234. [Google Scholar] [CrossRef]
Disclaimer/Publisher’s Note: The statements, opinions and data contained in all publications are solely those of the individual author(s) and contributor(s) and not of MDPI and/or the editor(s). MDPI and/or the editor(s) disclaim responsibility for any injury to people or property resulting from any ideas, methods, instructions or products referred to in the content. |
© 2024 by the authors. Licensee MDPI, Basel, Switzerland. This article is an open access article distributed under the terms and conditions of the Creative Commons Attribution (CC BY) license (https://creativecommons.org/licenses/by/4.0/).