Abstract
Connected and automated vehicles (CAVs), integrated with sensors, cameras, and communication networks, are transforming the transportation industry and providing new opportunities for consumers to enjoy personalized and seamless experiences. The fast proliferation of connected vehicles on the road and the growing trend of autonomous driving create vast amounts of data that need to be analyzed in real time. Anomaly detection in CAVs refers to identifying any unusual or unforeseen behavior in the data generated by vehicles’ various sensors and components. Anomaly detection aims to identify any unusual behavior that might indicate a problem or a malfunction in the vehicle. To identify and detect anomalies efficiently, a method must deal with noisy data, missing data, dynamic frequency data, and low- and high-magnitude data, and it must be accurate enough to detect anomalies in a dynamic sensor streaming environment. Therefore, this paper proposes a fast and efficient hard-voting-based technique named FT-HV, comprising three fine-tuned machine learning algorithms to detect and classify anomaly behavior in CAVs for single and mixed sensory datasets. In experiments, we evaluate our approach on the benchmark Sensor Anomaly dataset that contains data from various vehicle sensors at low and high magnitudes. Further, it contains single and mixed anomaly types that are challenging to detect and identify. The results reveal that the proposed approach outperforms existing solutions for detecting single anomaly types at low magnitudes and detecting mixed anomaly types in all settings. Furthermore, this research is envisioned to help detect and identify anomalies early and efficiently promote safer and more resilient CAVs.
1. Introduction
Connected and automated vehicle (CAV) facilities create a safer, more efficient, and more sustainable transportation system for consumers [1,2,3]. The development of CAVs is closely linked to the development of other emerging technologies, such as artificial intelligence (AI) and the Internet of Things (IoT), which are expected to transform various industries and consumer experiences [4,5]. CAVs can be categorized into different levels of automation, ranging from partially automated vehicles with features such as adaptive cruise control and lane-keeping assistance to fully autonomous vehicles that can operate without human input [6,7,8]. Integrating connectivity and automation in vehicles enables new capabilities such as improved road safety, reduced traffic congestion, and increased energy efficiency. CAVs can transform the transportation industry and change how people travel [9]. By communicating with each other and the infrastructure around them, CAVs can share information about road conditions, traffic patterns, and other factors that can improve the driving experience and make the roads safer [10,11]. However, CAVs can still malfunction due to cyberattacks and anomalies that need to be detected in the preliminary stage [12,13].
Anomaly detection in CAV sensors is an essential and challenging task, as many security and privacy concerns are involved. In connected vehicles, anomaly detection can be performed on various data sources, such as GPS signals, engine data, or other sensor readings. Machine learning algorithms, such as clustering and classification algorithms, can be used to analyze these data and identify anomalies [5,7,14]. For example, a clustering algorithm can identify data patterns and points that deviate significantly from these patterns. Another critical aspect of anomaly detection in connected vehicles is real-time monitoring. Since connected vehicles generate vast amounts of data in real time, anomaly detection algorithms must be able to process these data in real time and identify anomalies as they occur. Additionally, anomalies must be investigated to determine the root cause of the problem, as they could indicate a severe issue that requires immediate attention. Data generated by the various systems of a connected and automated vehicle, such as sensors, cameras, and GPS, are constantly monitored to identify anomalies and prevent potential issues. With the help of advanced machine learning algorithms, the system can learn normal behavior patterns and detect any deviations that might indicate a problem. This helps prevent potential accidents and improve the vehicle’s overall performance.
Motivation: Anomalies in CAVs can have significant consequences for consumers (i.e., drivers) since anomalies in CAVs can result in a reduced vehicle performance, loss of control, increased risk of minor and major accidents (sometimes fatal accidents), and increased costs. Therefore, detecting and addressing them as quickly as possible ensure these systems’ safe and reliable operation. Some studies [5,7,14] focused on anomaly detection; however, they failed to provide a good performance for detecting low-magnitude anomalies and did not focus on early-stage (less time complexity) anomaly detection. Keeping in mind the above limitations, this paper makes the following contributions:
- It introduces a methodology that employs a swiftly optimized machine learning algorithm alongside hard voting to efficiently identify both low- and high-magnitude single anomalies as well as mixed anomalies in connected and automated vehicles.
- The proposed approach preprocesses sensor data streams, applies random oversampling to minority class instances and subsequently conducts anomaly detection.
- The experimental findings indicate that the proposed approach enhances anomaly detection performance when compared to other leading classifiers. This enhancement could potentially enhance the identification of abnormal vehicle behavior, thereby bolstering overall safety and reliability.
- Designed to be adaptable across various types of automated vehicles and driving scenarios, the proposed approach holds promise for a broader applicability, catering to developers and researchers within this domain.
The subsequent sections of this paper are structured as follows: Section 2 reviews state-of-the-art studies concerning sensory anomaly detection in connected and automated vehicles. Section 3 outlines the proposed anomaly detection approach. The experimental analysis and results of the proposed approach are detailed in Section 4. Finally, Section 5 encapsulates the conclusion and highlights future directions.
2. Related Work
The research in [15] explores the integration of digital forensics into the Internet of Vehicles (IoV) ecosystem, addressing challenges and proposing solutions. It emphasizes the significance of preserving the chain of custody, gathering forensically sound evidence and navigating privacy concerns within the IoV. This article introduces the Attack Attribution and Forensics Readiness Tool (AAFRT) within the Novel Adaptive Cybersecurity Framework for the IoV, aiming to ensure the collection and utilization of appropriate forensic data. The AAFRT is designed to be adaptable, undergo continuous improvement, and comply with data privacy regulations like GDPR, ensuring legality and ethicality in IoV digital forensic practices. The research in [16] offers a thorough examination of stakeholders involved in CAVs within intelligent transportation systems (ITSs), particularly focusing on their roles in shaping a Cybersecurity Regulatory Framework (CRF). By visualizing the scope of these stakeholders, this study highlights various aspects, including compliance requirements for ITS communication service providers, regulatory standards for CAV automakers, policy readiness for CAV users, and the role of CAV network operator centers in managing data flows. Additionally, it sheds light on essential pathways for future endeavors, emphasizing the need to synthesize and forecast the legal landscape of CAV-based transportation systems to facilitate the integration of regulatory frameworks for all CAV stakeholders. The insights provided by the study can significantly aid policymakers in the development of a comprehensive CRF.
The authors of [14] demonstrated that sensors in connected automated vehicles (CAVs) are vulnerable to malfunctions or failures, leading to possible safety hazards if not detected and addressed promptly. They suggested an approach named the Kalman filter-based convolutional network, KF-CNN. The KF can track sensor data in real time, look for anomalies, and pinpoint problematic sensors. They also focused on creating a publicly available dataset for CAV-based anomaly identification. They employed a deep autoencoder neural network trained on typical and unusual sensor readings. This system can continuously monitor several sensors and identify irregularities in real time. Once an anomaly is detected, the system can identify the faulty sensor using a feature ranking algorithm. The authors of [5] proposed two approaches MSALSTM and WAVED to detect complex anomalies based on multiple stages of attention, effectively a Convolutional Neural Network (CNN). They tested the proposed system using a dataset of sensor readings from a real-world automated vehicle. They used CNN blocks and attention mechanisms to detect anomalies. They took the input’s spatial properties, enhanced them, and raised the level of abstraction. The authors reported that the system could accurately detect and identify sensor anomalies in real time.
The authors of [17] proposed a symmetrical simulation scheme that creates a mirrored environment for autonomous vehicles, allowing for detecting anomalies in both real and simulated environments. They used LSTM for anomaly detection using data from the symmetrical simulation scheme. The LSTM model is trained on a combination of real and simulated data to improve its accuracy in detecting anomalies. The authors of [18] discussed the need for post-accident analysis of cyberattacks on connected and automated vehicles. They proposed a framework for post-accident analysis of cyberattacks on these vehicles, which involves collecting data from various sources, such as the vehicle’s sensors and computer systems, and analyzing these data to determine if a cyberattack was involved in the accident. The authors also discussed various challenges and limitations of this framework, such as the difficulty of collecting accurate and comprehensive data and the need for standardized data analysis methods.
The authors of [19] focused on creating a dataset to simulate various types of cyberattacks on VANETs, including jamming attacks, spoofing attacks, and denial-of-service attacks. They describe the methodology used to create the dataset, which involves simulating various cyberattacks on a VANET using the NS-3 network simulator. The dataset includes many network features, such as packet counts, transmission rates, and signal strengths, that can be used as input features for machine learning algorithms. The authors of [20] proposed a hybrid deep sensor anomaly detection approach that combines the advantages of both deep learning and sensor-based approaches. They used CNNs and long short-term memory (LSTM) networks to analyze sensor data from an autonomous vehicle. A CNN was used to extract spatial features from the sensor data, while LSTM was used to analyze the temporal features. The author of [21] proposed a new approach that combines deep reinforcement learning and Bayesian inference to detect real-time anomalies. They used a deep reinforcement learning agent that learns to detect anomalies in a dynamic environment by interacting with the environment and receiving rewards based on its actions. The agent also has a Bayesian inference module that updates its beliefs about the environment based on new observations.
The author of [22] proposed an explainable AI (XAI)-based neural network to detect real-time anomalies while explaining its decisions. The paper describes the implementation of the proposed approach using an autoencoder-based neural network that learns to reconstruct normal traffic patterns and detect anomalies based on reconstruction errors. The network also has an attention mechanism that highlights the features contributing to its decisions and provides explanations. The authors evaluated the proposed approach using a real-world vehicular network traffic dataset and compared it to traditional anomaly detection methods. The authors of [23] proposed a cooperative trust-aware tolerant misbehavior detection system (CT2-MDS) to detect misbehavior in a cooperative environment. They used trust management and machine learning techniques to detect misbehavior. The CT2-MDS system uses trust values to evaluate the reliability of the data received from other vehicles and combines them with machine learning algorithms to detect misbehavior.
The author of [24] proposed a new approach called ADS-Lead that uses a lifelong learning algorithm to learn and adapt to new data while detecting anomalies continuously. They used an adaptive mixture of Gaussians (AMoG) algorithm that learns the normal behavior of the ADS and detects anomalies based on deviation from the learned behavior. The AMoG algorithm also has a lifelong learning mechanism that updates the learned behavior as new data are received. The authors of [25] propose a response-type road anomaly detection and evaluation method that uses sensors and algorithms to detect and evaluate road anomalies. They analyze the vehicle’s response to the road surface and detect anomalies based on deviation from the normal response. The algorithm is also equipped with a road anomaly evaluation mechanism that evaluates the severity of the detected anomaly based on the response characteristics of the vehicle.
In summary (See Table 1), some studies exist [5,7,14,22], but they lack to provide promising performance and early detection of anomalies in automated vehicles. Therefore, we proposed this study to detect anomalies efficiently in the early stages.

Table 1.
Summary of related work.
3. Proposed Approach
This section elucidates all the building blocks of the proposed approach. Figure 1 shows the working of our presented approach, which comprises four major blocks: dataset selection, data preprocessing, data oversampling, and detection. We then discuss the dataset and the concepts of the Fine Tuned k Nearest Neighbor (FT-KNN), Fine Tuned Extremely Randomized Trees (FT-ERTs), Fine Tuned Random Forest (FT-RF), and Single and Mixed Anomaly Detection Fine Tuned Hard Voting (FT-HV) approaches.
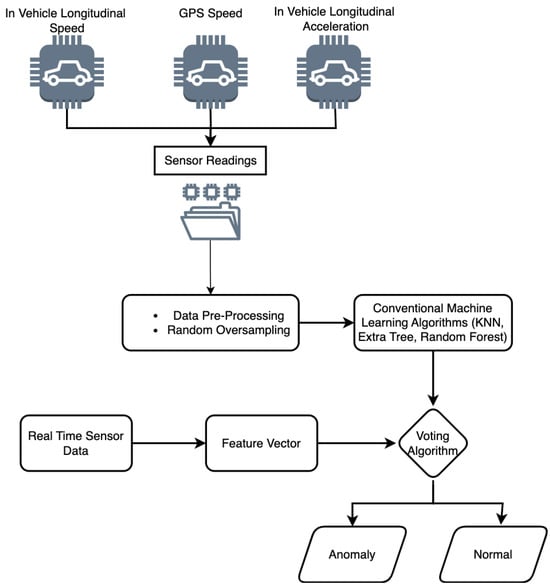
Figure 1.
An overview of the proposed approach for anomaly detection.
3.1. Dataset Selection
A typical dataset for anomaly detection in automated vehicles can include sensor data from various sources, such as cameras, lidars, radars (accelerometers and gyroscopes), magnetometers, and temperature and GPS sensors. Furthermore, data may include the vehicle’s position, speed, acceleration, orientation, and environment and any anomalies or errors the sensors detect. We use the benchmark dataset provided by Van Wyk et al. [14]. The dataset contains several sensors denoted by . Each sensor in produces numerical data that are stored in the form of an instance. This collection of instances from each sensor results in a feature matrix of , where I represents the number of instances and J represents the number of features. The overall feature matrix (FM) is represented in Equation (1).
3.2. Data Analysis
We perform exploratory data analysis of the sensor readings to visually understand the pattern of anomalies of various sensors (i.e., in-vehicle longitudinal speed, GPS speed and in-vehicle longitudinal acceleration). This step enabled us to gain insights into the data’s distribution, correlation, and patterns. As shown in Figure 1, some irregular spikes show the anomalies.
3.3. Data Preprocessing
Data concerning vehicles are frequently gathered from a variety of origins, including sensors, GPS devices, and telematic systems. However, these data often need to be more complete, consistent, and accurate. Moreover, due to their voluminous and intricate nature, processing them can result in prolonged processing periods, subpar performances, and storage constraints. Data preprocessing is instrumental in enhancing the data quality by pinpointing and rectifying errors, filling in missing values, and eliminating duplicates. Additionally, it aids in reducing data size by filtering out irrelevant or redundant information, thereby enhancing the processing and storage efficiency. Our approach encompasses several data preprocessing stages: managing duplicate data, detecting outliers, normalizing linear data, and oversampling data to ensure quality. When dealing with imbalanced datasets during preprocessing, a technique called random oversampling is often employed to address this issue. This technique, employed for preprocessing imbalanced datasets in machine learning [26], entails augmenting the number of instances in the minority class by randomly duplicating some until it reaches a level comparable to the majority class. Let X denote the feature matrix and y the target vector of the original dataset. Similarly, let X_min and y_min represent the feature matrix and target vector of minority class instances, respectively. With n_major denoting the number of instances in the majority class and n_minor representing the number of instances in the minority class, random oversampling can be executed by randomly selecting k instances from X_min and adding them to X and y k times. Here, k is chosen such that n_minor + k(n_minor) equals n_major. In mathematical notation, let x_resampled and y_resampled be the resampled feature matrix and target vector, respectively. First, we calculate k as shown in Equation (2):
Next, it randomly selects k instances from X_min and adds them to and k times.
3.4. Detection Approach
We use multiple classification algorithms for anomaly detection in connected vehicles. We use K-Nearest Neighbor (KNN), Extremely Randomized Trees (ERTs), Random Forest (RF), and the Voting classifier. The classification algorithms were selected based on their capability to cover scenarios such as small, large, and noisy datasets and the detection rate improvement of weak learning classifiers. Below are the descriptions and parameters of all algorithms.
K-Nearest Neighbor (KNN): is an effective non-parametric and lazy learning algorithm that does not make any assumptions about the underlying distribution of the data and only makes predictions when a new input is given [https://scikit-learn.org/stable/modules/generated/sklearn.neighbors.KNeighborsClassifier.html (accessed on 1 April 2024)]. FT-KNN finds the nearest neighbors in the training data based on the distance metric and assigns the class label that appears most frequently among the KNNs to the new input. The value of k is an important parameter in the FT-KNN algorithm. A larger value of k means that the decision boundary is smoother and less prone to overfitting. Still, it also reduces the ability of the algorithm to capture fine-grained patterns in the data. The parameter setting of FT-KNN is set as follows: is set to 3, the weights are uniform, and the algorithm parameter is set to auto. Three searching algorithms in FT-KNN, , , and , will use a brute-force search. Furthermore, is set to 30, the power parameter (pint) is set to 2, and or callable is set to .
Extremely Randomized Trees (ERTs) is an ensemble learning algorithm that extends the RF algorithm and uses a similar approach with some additional modifications. This algorithm works by building many decision trees, where each tree is trained on a random subset of the training data and a random subset of the features. The splitting of the tree nodes is also performed randomly, without considering the optimal split that would minimize the impurity measure (such as Gini impurity or entropy). The main advantage of FT-ERT is that it reduces the variance of the model compared to FT-RF by introducing more randomness in the tree-building process. This results in a less complex and biased model, which can be more robust and less prone to overfitting, especially when the training dataset is small. The parameter setting for FT-ERT is as follows: n_estimators is set to 100, criterion is set to , max_depthint is set to , bootstrapbool is set to , oob_scorebool is set to , n_jobsint is set to , random_stateint is set to 0, verboseint is set to 0, warm_startbool is set to , ccp_alphanon-negative float is set to , max_samplesint is set to , and class_weight is set to .
Random Forest (RF) is an ensemble algorithm widely used for classification, regression, and feature selection tasks [https://scikit-learn.org/stable/modules/generated/sklearn.ensemble.RandomForestClassifier.html (accessed on 1 April 2024)]. It creates many decision trees, each trained on a random subset of the training data and a random subset of the features. The trees are then combined to make predictions by taking the majority vote for classification tasks or the average for regression tasks. The main advantage of FT-RF is that it is highly accurate and robust to noise and overfitting due to the use of multiple trees and the random selection of features for each tree. The parameter setting for FT-RF is as follows: n_estimators is set to 100, criterion is set to , max_depthint is set to , min_samples_splitint is set to 2, min_samples_leafint is set to 1, min_weight_fraction_leaffloat is set to , max_features is set to , max_leaf_nodesint is set to , min_impurity_decreasefloat is set to , bootstrapbool is set to , oob_scorebool is set to , n_jobsint is set to , random_stateint is set to 0, verboseint is set to 0, warm_startbool is set to , ccp_alphanon-negative float, default = and class_weight is set to .
Voting Classifier is an ensemble learning algorithm that combines multiple individual classification models to make predictions [https://scikit-learn.org/stable/modules/generated/sklearn.ensemble.VotingClassifier.html (accessed on 1 April 2024)]. It aggregates the predictions of multiple individual classifiers and predicts the class with the highest vote. The FT-HV classifier can also be used for model selection, where multiple models with different hyperparameters are trained and combined using the ensemble approach. This can help to find the best combination of hyperparameters and improve the performance of the overall model. The parameter setting for FT-ERT is as follows: voting is set to , n_jobsint is set to , flatten_transformbool is set to , and verbosebool is set to .
Algorithm 1 provides the functioning of the proposed approach, where C is a set of classifiers and R is the instance to be classified. The proposed algorithm iterates through each classifier in C and uses it to predict the class labels for each instance in R. The results are stored in the S set. The algorithm then computes the majority vote for each data point in R based on the results in S. If the majority vote for an instance is an “Anomaly”, it is stored in the set V along with the instance itself. The final result is a set V of all data points predicted to be anomalous by the FT-HV classifier.
| Algorithm 1 FT-HV for anomaly detection in vehicle sensor networks |
Evaluation Measures: Accuracy, F-Score, Recall, Precision
|
4. Experimental Analysis and Results
This section provides the experimental setup, analysis, and results of the proposed approach. We first present the results of all detection algorithms and provide a comparison. Next, we compare the results with state-of-the-art methods KF-CNN [14], MSALSTM-CNN and WAVED [5]. We evaluate our approach on two important factors: detection performance and time complexity. For the performance analysis, we select standard evaluation measures such as the accuracy, precision, recall, F1-Score and Area Under Curve (AUC).
4.1. Single Anomaly Types
This section elucidates the results of single anomaly types detected during the classification: instant, constant, gradual drift, and bias.
(1) Instant: Table 2 presents the detection performance of instant anomaly detection using FT-HV. The first row represents the results of instant anomaly detection when the magnitude is low. In all the next rows, the magnitude of the anomaly increases. There is less danger when the magnitude is low, and there is a higher chance of danger when the magnitude is higher. For a magnitude of “25 × N(0, 0.01)”, the model achieves an accuracy of 99.27, a recall of 99.27, a precision of 99.28, an F1-Score of 99.27, and an AUC of 99.26. The training time (second(s)) is reported as , the prediction time is , and the overall time is . The table shows that as the number of anomalies increases, the accuracy, recall, precision, F1-Score, and AUC of the model decrease slightly. However, the decrease in performance is relatively small, indicating that the model can still accurately predict the labels even when the number of anomalies is high. We can also see that as the number of anomalies increases, the model’s training time and prediction time increase, which is expected as the model processes more data.

Table 2.
Instant anomaly detection using the FT-HV classifier.
(2) Constant: From Table 3, we can see that as the duration of the anomaly increases, the accuracy, recall, precision, F1-Score, and AUC of the model decrease. This indicates that the model has a harder time detecting longer anomalies. Additionally, we can see that as the range of the uniform distribution decreases, the accuracy, recall, precision, F1-Score, and AUC of the model decrease. This indicates that anomalies with a smaller range are harder to detect. Finally, we can see that the model’s training time and prediction time remain relatively constant across different instances of constant anomalies.

Table 3.
Constant anomaly detection using FT-HV.
(3) Gradual Drift: Table 4 shows the performance of the proposed approach for gradual drift anomaly detection. The first two rows of the table indicate that the algorithm performs well when the drift anomaly has a small duration (either 10 or 20) and a low drift intensity (between 0 and 2). The algorithm achieved an accuracy of 81.63% and 64.00%, respectively. The recall and AUC values are also high, indicating that the algorithm can effectively identify anomalies. The third row shows the results for a drift anomaly with a higher intensity of up to four. In this case, the algorithm achieved an accuracy of 81.51%, slightly lower than the first row but still acceptable. However, the recall is relatively low at 51.51%, which suggests that the algorithm had some difficulty detecting the anomaly in this case. The fourth row shows the results for a longer-duration drift anomaly with a low intensity of up to four. In this case, the algorithm achieved an accuracy of 63.88%, which is lower than the other rows. The recall, precision, and F1-Score values are also low, indicating that the algorithm had significant difficulty detecting the anomaly in this case.

Table 4.
Drift anomaly detection using FT-HV.
(4) Bias: From Table 5, we can see that for the first three samples of bias, the accuracy, recall, precision, and F1-Score of the model are low. However, for the next two levels of bias anomalies, the model’s performance is still relatively high compared to the other levels of bias anomaly. The training time, prediction time, and total time are relatively consistent across different levels of bias anomaly. Moreover, the 0_5_dur_3 level of bias anomaly is slightly longer than the others. Finally, we can see that the AUC is highest for the 0_5_dur_5 level and lowest (at 81.67%) for the 0_3_dur_10 level.

Table 5.
Bias anomaly detection using FT-HV.
4.2. Mixed Anomaly Types
This section elucidates the results of mixed anomaly types. As shown in Table 6, for the “Instant Anomaly” type, the FT-HV achieved a high accuracy, precision, recall, and F1-Score across all sensors, indicating that it could detect instant anomalies with a very high accuracy. The training time and prediction time were also reasonable. The AUC value was close to 1, indicating that the classifier performed well in distinguishing between normal and anomalous data points. The FT-HV also performed well for the “Constant Anomaly” type, achieving a high accuracy, precision, recall, and F1-Score. The training time and prediction time were reasonable as well. However, the AUC values were slightly lower than for the “Instant Anomaly” type, indicating that the classifier’s performance distinguishing between normal and anomalous data points was slightly worse. For the “Gradual Drift Anomaly” type, the FT-HV did not perform as well as the other types of anomalies, achieving a lower accuracy, precision, recall, and F1-Score across all sensors. The training and prediction time was reasonable, and the AUC value was also lower, indicating that the classifier’s performance in distinguishing between normal and anomalous data points was poor. For the “Bias Anomaly” type, FT-HV achieved a high accuracy, precision, recall, and F1-Score across all sensors, indicating that it could detect bias anomalies with a high accuracy. The training and prediction times were reasonable, and the AUC value was close to 1, indicating that the classifier performed well in distinguishing between normal and anomalous data points. Overall, the FT-HV classifier performed well for instant and bias anomalies but struggled with gradual drift anomalies. The results also suggest that the classifier’s performance varies depending on the type of anomaly and the sensor used.

Table 6.
Mixed anomaly types.
Figure 2, Figure 3, Figure 4 and Figure 5 provide the overall comparison of three models, FT-KNN, FT-ERT, and FT-RF, and FT-HV (a combination of the previous three models). All the algorithms perform well in detecting instant anomalies, with F1-Scores ranging from 98.29% to 99.27%. Figure 2 compares the F1-Scores and total time (in seconds) for different anomaly detection models applied to datasets with varying numbers of instant anomalies. FT-RF and FT-HV algorithms show the highest F1-Scores for all the magnitudes of instant anomalies, followed closely by FT-ERT. The time the algorithms take to detect instant anomalies increases with the magnitude of the anomalies. FT-KNN is the fastest algorithm for detecting anomalies for all magnitudes, taking less than 4 s for all cases. FT-ERT and FT-HV algorithms take around 4 to 25 s, while FT-RF takes the longest time, ranging from 13 to 41.5 s. In most cases, the FT-HV model has the highest F1-Score, followed closely by the FT-RF model. The FT-KNN model has the lowest F1-Score across all datasets. The FT-KNN model has the lowest run time, while the others take longer to train. However, the difference in run time between the models needs to be larger to significantly impact the choice of model, considering the high F1-Scores achieved by all models. Figure 3 compares all classifiers and the time consumption. Among the algorithms, FT-HV performs better than FT-KNN and others, as indicated by the higher F1-Scores across different dataset settings. The FT-KNN model has the lowest F1-Score across all datasets. The FT-KNN model has the lowest run time, while the others take longer to train. Figure 4 shows that the FT-RF model performs consistently well across all drift anomalies and durations, with the highest F1-Score in most cases. The FT-ERT model performs well, with high F1-Scores and relatively short total times. FT-HV, which combines the predictions of multiple models, performs similarly to individual models in most cases. The FT-KNN model has lower F1-Scores and shorter total times than the other models. Figure 5 shows that the FT-HV algorithm performs well for most anomaly types and durations, while the FT-ERT algorithm is particularly effective at detecting bias anomalies with short durations. The FT-KNN model has lower F1-Scores and shorter total times than the other models.
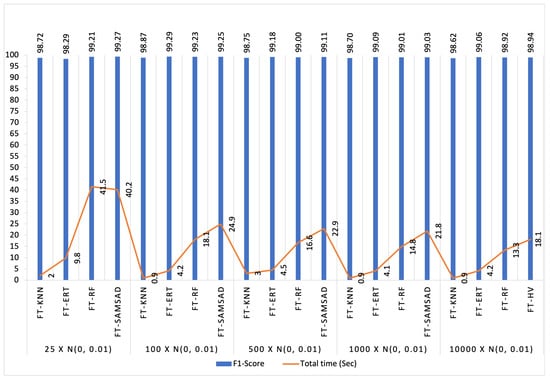
Figure 2.
Instant anomaly detection (F1-Score) and time comparison.
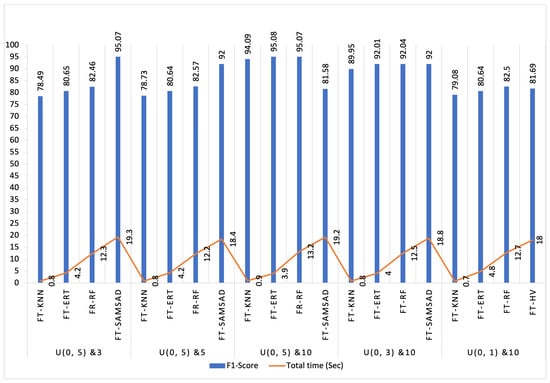
Figure 3.
Constant anomaly detection (F1-Score) and time comparison.
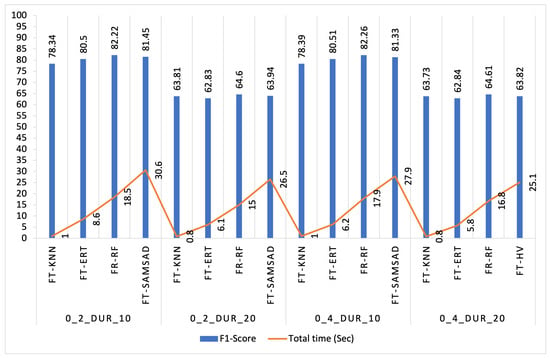
Figure 4.
Gradual drift anomaly detection (F1-Score) and time comparison.
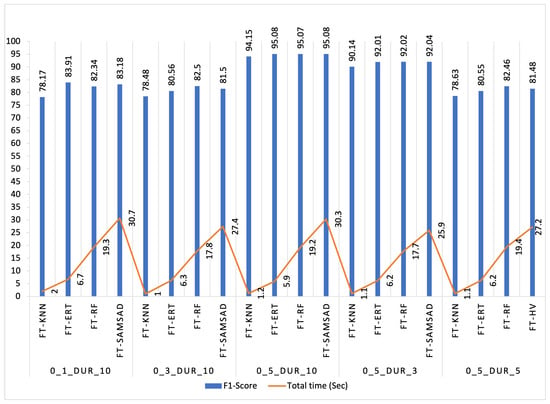
Figure 5.
Bias anomaly detection (F1-Score) and time comparison.
Figure 6, Figure 7, Figure 8 and Figure 9 show the results of our approach alongside the baseline results. Figure 6 shows that our FT-ERT model achieves better results in most instant anomaly detection cases. Furthermore, Figure 7 depicts that our FT-HV model achieves better results when the anomaly magnitude is low and obtained poorer results in the rest of the cases for instant anomaly detection. In Figure 8, it can be noted that our FT-RF model achieves poorer results in the rest of the cases for instant anomaly detection. Finally, Figure 9 depicts that our FT-HV model achieves better results when the anomaly magnitude is low and obtains poorer results for instant anomaly detection in the rest of the cases.
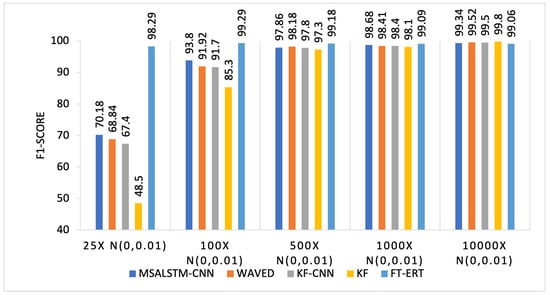
Figure 6.
Performance comparison of Instant anomaly detection (F1-Score) with existing approaches.
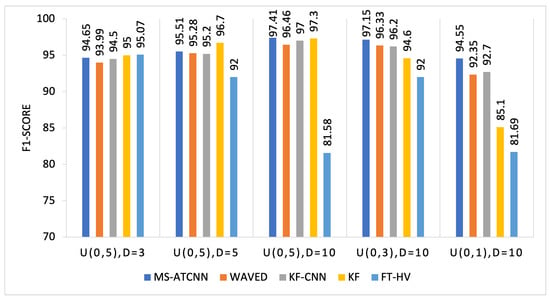
Figure 7.
Performance comparison of Performance Comparison of Constant anomaly detection (F1-Score) with existing approaches.
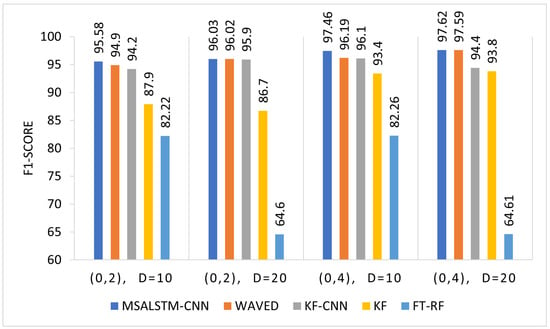
Figure 8.
Performance comparison of Gradual drift anomaly detection (F1-Score) with existing approaches.
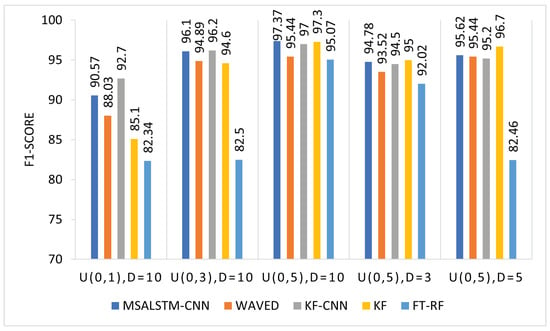
Figure 9.
Performance comparison of Bias anomaly detection (F1-Score) with existing approaches.
Table 7 shows that the proposed approach outperforms the other two methods regarding the accuracy and F1-Score for all types of anomalies and all sensors. We provide a comparison only with studies that used all sensor anomalies, single anomalies, and mixed sensor anomalies. Specifically, the proposed approach achieves an accuracy and F1-Score close to 100% for most cases, while the other two achieve an accuracy and F1-Score around 90% or lower. It is also worth noting that the performance of all methods is affected by the type of anomaly and the sensor used. For example, the proposed approach achieves a lower F1-Score for the gradient anomaly type than other types. In contrast, the other two methods achieve a higher accuracy and F1-Score for the constant anomaly type compared to other types. Overall, this table suggests that the proposed approach is promising for detecting various types of anomalies in sensor data.

Table 7.
Performance comparison with existing studies.
Overall, the proposed FT-RF approach performed well in the case of a single anomaly type, and FT-HV performed well in mixed anomaly detection compared to other classifiers and state-of-the-art studies. Further, it is noted that there is a trade-off between speed and accuracy. FT-KNN and FT-RF are seen to be the fastest algorithms, but in some cases, they did not perform well. Meanwhile, FT-HV takes a lot of time but performs well on mixed anomaly types. Further, it is noted that since the datasets have few features and deep learning needs high feature dimensions and a large dataset, this is the reasoning behind the superior working of our approach.
5. Conclusions
Anomaly detection is an important area of research in connected and automated vehicles, as anomalies can pose a significant risk to safety, reliability, and performance. Developing fast and efficient anomaly detection systems is critical for ensuring the timely identification and response to anomalies in these vehicles. This paper proposes an approach that uses a fine-tuned machine learning algorithm and a hard voting classifier (FT-HV) to efficiently detect low/high-magnitude single anomalies and low/high-magnitude mixed anomalies in connected and automated vehicles. The experiments reveal that FT-RF performs well in the case of single anomalies, and FT-HV improves the performance of mixed anomaly detection compared to other classifiers and state-of-the-art studies. Further, it is noted that there is a trade-off between speed and accuracy. FT-KNN and FT-RF are seen to be the fastest algorithms; however, in some cases, they did not perform well. Meanwhile, FT-HV took a lot of time, but performed well on mixed anomaly types. The results suggest that this study could lead to more effective identification of abnormal behavior in vehicles, improving their overall safety and reliability and making them more trustworthy and dependable for consumers. Future research could focus on data collection from more sensors, improving anomaly detection systems’ accuracy, efficiency, and transferability, and could explore new applications and use cases for these systems.
Author Contributions
Conceptualization, T.H.K., S.O. and M.K.; Data curation, T.H.K. and M.A.A.; Formal analysis, S.O.; Funding acquisition, T.H.K.; Investigation T.H.K., M.A.A., M.K. and S.O.; Methodology, M.A.A., M.K. and S.O.; Project administration, M.A.A. Software, T.H.K. and S.O.; Supervision, T.H.K. and M.K.; Validation, M.A.A.; Visualization, M.K.; Writing—original draft, T.H.K., S.O. and M.A.A.; Writing—review and editing, T.H.K., M.K., S.O. and M.A.A. All authors have read and agreed to the published version of the manuscript.
Funding
This research received no external funding.
Data Availability Statement
The dataset is publicly available.
Acknowledgments
Princess Nourah Bint Abdulrahman University Researchers Supporting Project number (PNURSP2024R503), Princess Nourah bint Abdulrahman University, Riyadh, Saudi Arabia.
Conflicts of Interest
The authors share no conflicts of interest.
References
- Fang, Y.; Min, H.; Wu, X.; Wang, W.; Zhao, X.; Martinez-Pastor, B.; Teixeira, R. Anomaly diagnosis of connected autonomous vehicles: A survey. Inf. Fusion 2024, 105, 102223. [Google Scholar] [CrossRef]
- Monteiro, F.V.; Ioannou, P. Safe autonomous lane changes and impact on traffic flow in a connected vehicle environment. Transp. Res. Part Emerg. Technol. 2023, 151, 104138. [Google Scholar] [CrossRef]
- Sadaf, M.; Iqbal, Z.; Javed, A.R.; Saba, I.; Krichen, M.; Majeed, S.; Raza, A. Connected and automated vehicles: Infrastructure, applications, security, critical challenges, and future aspects. Technologies 2023, 11, 117. [Google Scholar] [CrossRef]
- Gao, J.; Hu, C.; Wang, L.; Ding, N. Data Validity Analysis Based on Reinforcement Learning for Mixed Types of Anomalies Coexistence in Intelligent Connected Vehicle (ICV). Electronics 2024, 13, 444. [Google Scholar] [CrossRef]
- Javed, A.R.; Usman, M.; Rehman, S.U.; Khan, M.U.; Haghighi, M.S. Anomaly Detection in Automated Vehicles Using Multistage Attention-Based Convolutional Neural Network. IEEE Trans. Intell. Transp. Syst. 2021, 22, 4291–4300. [Google Scholar] [CrossRef]
- Yun, K.; Yun, H.; Lee, S.; Oh, J.; Kim, M.; Lim, M.; Lee, J.; Kim, C.; Seo, J.; Choi, J. A Study on Machine Learning-Enhanced Roadside Unit-Based Detection of Abnormal Driving in Autonomous Vehicles. Electronics 2024, 13, 288. [Google Scholar] [CrossRef]
- Wang, Y.; Khojandi, A.; Masoud, N. Anomaly Detection in Connected and Automated Vehicles using an Augmented State Formulation. arXiv 2020, arXiv:2004.09496. [Google Scholar]
- Chen, S.; Hu, X.; Zhao, J.; Wang, R.; Qiao, M. A Review of Decision-Making and Planning for Autonomous Vehicles in Intersection Environments. World Electr. Veh. J. 2024, 15, 99. [Google Scholar] [CrossRef]
- Wang, Y.; Masoud, N.; Khojandi, A. Real-Time Sensor Anomaly Detection and Recovery in Connected Automated Vehicle Sensors. IEEE Trans. Intell. Transp. Syst. 2020, 22, 1411–1421. [Google Scholar] [CrossRef]
- Sajid, F.; Javed, A.R.; Basharat, A.; Kryvinska, N.; Afzal, A.; Rizwan, M. An efficient deep learning framework for distracted driver detection. IEEE Access 2021, 9, 169270–169280. [Google Scholar] [CrossRef]
- Javed, A.R.; Shahzad, F.; ur Rehman, S.; Zikria, Y.B.; Razzak, I.; Jalil, Z.; Xu, G. Future smart cities requirements, emerging technologies, applications, challenges, and future aspects. Cities 2022, 129, 103794. [Google Scholar] [CrossRef]
- Rehman Javed, A.; Jalil, Z.; Atif Moqurrab, S.; Abbas, S.; Liu, X. Ensemble adaboost classifier for accurate and fast detection of botnet attacks in connected vehicles. Trans. Emerg. Telecommun. Technol. 2022, 33, e4088. [Google Scholar] [CrossRef]
- Anthony, C.; Elgenaidi, W.; Rao, M. Intrusion Detection System for Autonomous Vehicles Using Non-Tree Based Machine Learning Algorithms. Electronics 2024, 13, 809. [Google Scholar] [CrossRef]
- van Wyk, F.; Wang, Y.; Khojandi, A.; Masoud, N. Real-Time Sensor Anomaly Detection and Identification in Automated Vehicles. IEEE Trans. Intell. Transp. Syst. 2020, 21, 1264–1276. [Google Scholar] [CrossRef]
- Gopikrishna, P.; Mohan, N. Empowering Digital Forensic Readiness for Internet of Vehicles: A Review. Available online: https://www.irjmets.com/uploadedfiles/paper/issue_12_december_2023/47944/final/fin_irjmets1704721321.pdf (accessed on 1 April 2024).
- Khan, S.K.; Shiwakoti, N.; Stasinopoulos, P.; Warren, M. Cybersecurity regulatory challenges for connected and automated vehicles–State-of-the-art and future directions. Transp. Policy 2023, 143, 58–71. [Google Scholar] [CrossRef]
- Alsulami, A.A.; Abu Al-Haija, Q.; Alqahtani, A.; Alsini, R. Symmetrical Simulation Scheme for Anomaly Detection in Autonomous Vehicles Based on LSTM Model. Symmetry 2022, 14, 1450. [Google Scholar] [CrossRef]
- Girdhar, M.; You, Y.; Song, T.J.; Ghosh, S.; Hong, J. Post-accident cyberattack event analysis for connected and automated vehicles. IEEE Access 2022, 10, 83176–83194. [Google Scholar] [CrossRef]
- Iqbal, S.; Ball, P.; Kamarudin, M.H.; Bradley, A. Simulating Malicious Attacks on VANETs for Connected and Autonomous Vehicle Cybersecurity: A Machine Learning Dataset. In Proceedings of the 2022 13th International Symposium on Communication Systems, Networks and Digital Signal Processing (CSNDSP), Porto, Portugal, 20–22 July 2022; pp. 332–337. [Google Scholar]
- Prathiba, S.B.; Raja, G.; Anbalagan, S.; Arikumar, K.; Gurumoorthy, S.; Dev, K. A Hybrid Deep Sensor Anomaly Detection for Autonomous Vehicles in 6G-V2X Environment. IEEE Trans. Netw. Sci. Eng. 2022, 10, 1246–1255. [Google Scholar] [CrossRef]
- Watts, J.; Van Wyk, F.; Rezaei, S.; Wang, Y.; Masoud, N.; Khojandi, A. A dynamic deep reinforcement learning-Bayesian framework for anomaly detection. IEEE Trans. Intell. Transp. Syst. 2022, 23, 22884–22894. [Google Scholar] [CrossRef]
- Aziz, S.; Faiz, M.T.; Adeniyi, A.M.; Loo, K.H.; Hasan, K.N.; Xu, L.; Irshad, M. Anomaly detection in the internet of vehicular networks using explainable neural networks (xnn). Mathematics 2022, 10, 1267. [Google Scholar] [CrossRef]
- Liu, Y.; Xue, H.; Zhuang, W.; Wang, F.; Xu, L.; Yin, G. CT2-MDS: Cooperative trust-aware tolerant misbehaviour detection system for connected and automated vehicles. IET Intell. Transp. Syst. 2022, 16, 218–231. [Google Scholar] [CrossRef]
- Han, X.; Zhou, Y.; Chen, K.; Qiu, H.; Qiu, M.; Liu, Y.; Zhang, T. ADS-lead: Lifelong anomaly detection in autonomous driving systems. IEEE Trans. Intell. Transp. Syst. 2022, 24, 1039–1051. [Google Scholar] [CrossRef]
- Liu, C.; Nie, T.; Du, Y.; Cao, J.; Wu, D.; Li, F. A response-type road anomaly detection and evaluation method for steady driving of automated vehicles. IEEE Trans. Intell. Transp. Syst. 2022, 23, 21984–21995. [Google Scholar] [CrossRef]
- Fernández, A.; García, S.; Galar, M.; Prati, R.C.; Krawczyk, B.; Herrera, F. Learning from Imbalanced Data Sets; Springer: Berlin/Heidelberg, Germany, 2018; Volume 10. [Google Scholar]
Disclaimer/Publisher’s Note: The statements, opinions and data contained in all publications are solely those of the individual author(s) and contributor(s) and not of MDPI and/or the editor(s). MDPI and/or the editor(s) disclaim responsibility for any injury to people or property resulting from any ideas, methods, instructions or products referred to in the content. |
© 2024 by the authors. Licensee MDPI, Basel, Switzerland. This article is an open access article distributed under the terms and conditions of the Creative Commons Attribution (CC BY) license (https://creativecommons.org/licenses/by/4.0/).