1. Introduction
Recently, technologically advanced systems such as autonomous vehicles and factories have been invented [
1,
2,
3]. Safety-critical applications associated with these systems require high levels of network reliability in real-time to ensure stability [
4,
5,
6]. However, if a link or bridge fails in an application network, the time required to retransmit the lost frames over an alternate path can be excessively long. The time-sensitive networking (TSN) standard, known as IEEE802.1CB or frame replication and elimination for reliability (FRER), proposes replicating frames and transmits them over multiple paths from the sending node to the destination node [
7,
8]. This standard enables the network to achieve reliable features.
To apply the FRER standard, a redundant topology that can transmit frames over multiple paths from the origin to destination node must be designed. A redundant topology eliminates the transmission problems caused by network failures. Thus, the loss or delay of frames owing to faults, physical damage, etc., during the communication process can be prevented [
9,
10]. However, for safety-critical applications such as autonomous vehicles and automation facilities, frames within a redundant topology are transmitted with a simple structure to reduce cost and design complexity [
11,
12,
13]. Such a simple path networks can decrease the reliability of safety-critical applications owing to bottlenecks [
14,
15].
In addition, real-time monitoring is an important consideration [
5,
16,
17]. The IEEE802.1Qbv TSN standard proposes transmitting time-critical traffic as scheduled traffic (ST) using a time-aware shaper (TAS) [
18]. Therefore, transmitting ST using a TAS requires the scheduling of ST across the entire network. Consequently, various scheduling methods are used to minimize transmission delay, jitter, and free bandwidth [
19,
20,
21,
22].
To achieve the primary objectives of TSN, which are real-time operation and reliability, redundant topology designs and traffic scheduling must be considered together. Therefore, a method to design a redundant topology that considers the characteristics of TSN is required [
23,
24]. Garvrilut et al. [
23] proposed a method for designing a topology with redundant paths to carry urgency-based scheduler traffic in a TSN. Three optimization methods were proposed to minimize the topology architecture cost. Atallah et al. [
24] designed a topology with redundant paths for transmitting ST.
These studies designed redundancy by considering the characteristics of the traffic used in a TSN. In particular, they aimed to minimize the architectural cost of the constructed topology. However, they did not consider the scheduling performance of the ST, which is important for TSN. According to Nayak et al. [
25], scheduling performance changes depending on the transmission path of the ST. Therefore, a redundant topology that considers the performance of the ST must be designed to ensure the free bandwidth of TSN networks.
This study proposes a method for designing a redundant topology for transmitting critical ST based on the IEEE802.1CB standard. The proposed method uses Yen’s
K-shortest-path (KSP) algorithm to design the topology by generating
k-paths and selecting the path that is likely to improve the scheduling performance among the
k-paths. In particular, the topology was designed to minimize the flowspan, which is the performance of no-wait packet scheduling problem (NW-PSP) scheduling among the various scheduling methods [
22]. Furthermore, the proposed method’s performance was verified through comparisons with two topology design methods in a simulation environment.
The rest of this study is organized as follows.
Section 2 briefly describes the topology planning method using Yen’s KSP and the NW-PSP’s performance.
Section 3 describes the design of a redundant topology for transmitting ST, considering the architectural cost and the NW-PSP’s performance.
Section 4 evaluates the performance of three methods: the proposed approach, a method considering only architectural cost, and a method incorporating traffic distribution into the comparison. Finally,
Section 5 discusses this study’s results and limitations.
2. Background
2.1. Overview of TSN-Based Topology Design
In TSN networks, ensuring fault tolerance is crucial. One technique used for this purpose is the IEEE802.1CB FRER. FRER involves replicating frames and identifying and eliminating duplicate frames, thereby allowing frame transmission via redundant paths. Multiple paths are required to achieve this, which necessitates a redundant network topology.
A common approach for designing a redundant topology involves rendering the entire topology redundant. However, this method results in unnecessary paths and increased topology costs and may not be feasible owing to physical limitations. Therefore, an alternative approach involves duplicating only the specific paths required to transmit important messages.
The method for creating a redundant topology by duplicating specific paths relies on routing algorithms. This process configures the network links to be fully connected, performs routing, and activates links in the topology model. In a typical design process, the network cost is calculated as the sum of the topology and hop costs. Subsequently, the topology is designed using routing paths that minimize the overall network cost.
However, this approach overlooks the scheduling performance, which is a primary goal in TSN.
Figure 1 illustrates the paths routed using different methods in the same topology, along with their corresponding schedules. In (a), the path is routed using the shortest-path algorithm, whereas in (b), the traffic is distributed. Furthermore, (c) and (d) show the schedules for the shortest-path algorithm and distributed traffic, respectively. The ‘flowspan’ in each schedule table suggests a performance metric for NW-PSP, indicating the time required for a frame’s transmission to complete within the schedule duration.
It is evident that the frame transmission delay is low in the schedule generated using the shortest-path algorithm. Distributing traffic increases frame delay while reducing the flowspan. Reducing the flowspan facilitates the scheduling of more frames and minimizes bandwidth waste by reducing the schedule space within the schedule cycle. This highlights the potential drawback of considering only the shortest path, particularly when designing a topology. To minimize bandwidth wastage, the scheduling performance must be considered during the routing stage.
2.2. Overview of Yen’s KSP Algorithm
The proposed topology design method employs Yen’s K-shortest paths (KSP), which is based on Dijkstra’s algorithm for graph modeling to discover diverse K-shortest paths between two nodes. Therefore, to grasp Yen’s KSP thoroughly, it is essential to first understand Dijkstra’s algorithm. Consequently, in this section, we will provide explanations for both algorithms. We will begin by elucidating Dijkstra’s algorithm and subsequently delve into the specifics of Yen’s KSP. This sequential approach aims to offer a clear understanding of the concepts and functionalities of each algorithm.
Dijkstra’s algorithm, named after the computer scientist Edsger Dijkstra, is a well-known method for determining the shortest paths between nodes in a weighted graph. The algorithm starts by selecting an initial node and then iteratively updating the shortest path values to adjacent nodes until the destination node is reached. The steps of the algorithm can be summarized as follows:
Firstly, the algorithm begins by selecting the starting node and setting its shortest path value to 0, while marking all other nodes with an initial infinite distance.
Next, it iterates through each adjacent node, updating the shortest path if a shorter path is discovered through the current node.
The algorithm then selects the node with the shortest path value among the unprocessed nodes.
This process is repeated iteratively until the destination node is reached or all nodes are processed.
Dijkstra’s algorithm is guaranteed to find the shortest path from the source node to all other nodes in non-negative weighted graphs, making it widely applicable in areas such as network routing and optimization.
Yen’s KSP algorithm is an extension of Dijkstra’s methodology, specifically tailored to find multiple diverse shortest paths between two nodes. It introduces diversity by iteratively blocking edges along the initially identified shortest path. The steps are outlined as follows:
Firstly, employ Dijkstra’s algorithm to determine the initial shortest path from the source to the destination node.
Subsequently, explore alternative paths by systematically blocking one edge at a time along the initial shortest path. This process generates diverse paths, each distinguished by the obstruction of a single edge.
Finally, if K-shortest paths are required, perform the above steps K times. In each iteration, restore the previously blocked edge and obstruct the next edge along the initial path, producing a set of K distinct paths.
Yen’s KSP algorithm is crucial in network design, providing fault tolerance and load distribution by creating diverse paths. As it iterates, it discovers paths different from the initially identified shortest path, adapting to various network conditions.
In summary, Dijkstra’s algorithm excels in finding single shortest paths, while Yen’s KSP algorithm extends this capability to discover multiple diverse paths, enhancing adaptability and resilience in network design and optimization. Both algorithms showcase the power of graph theory in solving real-world problems.
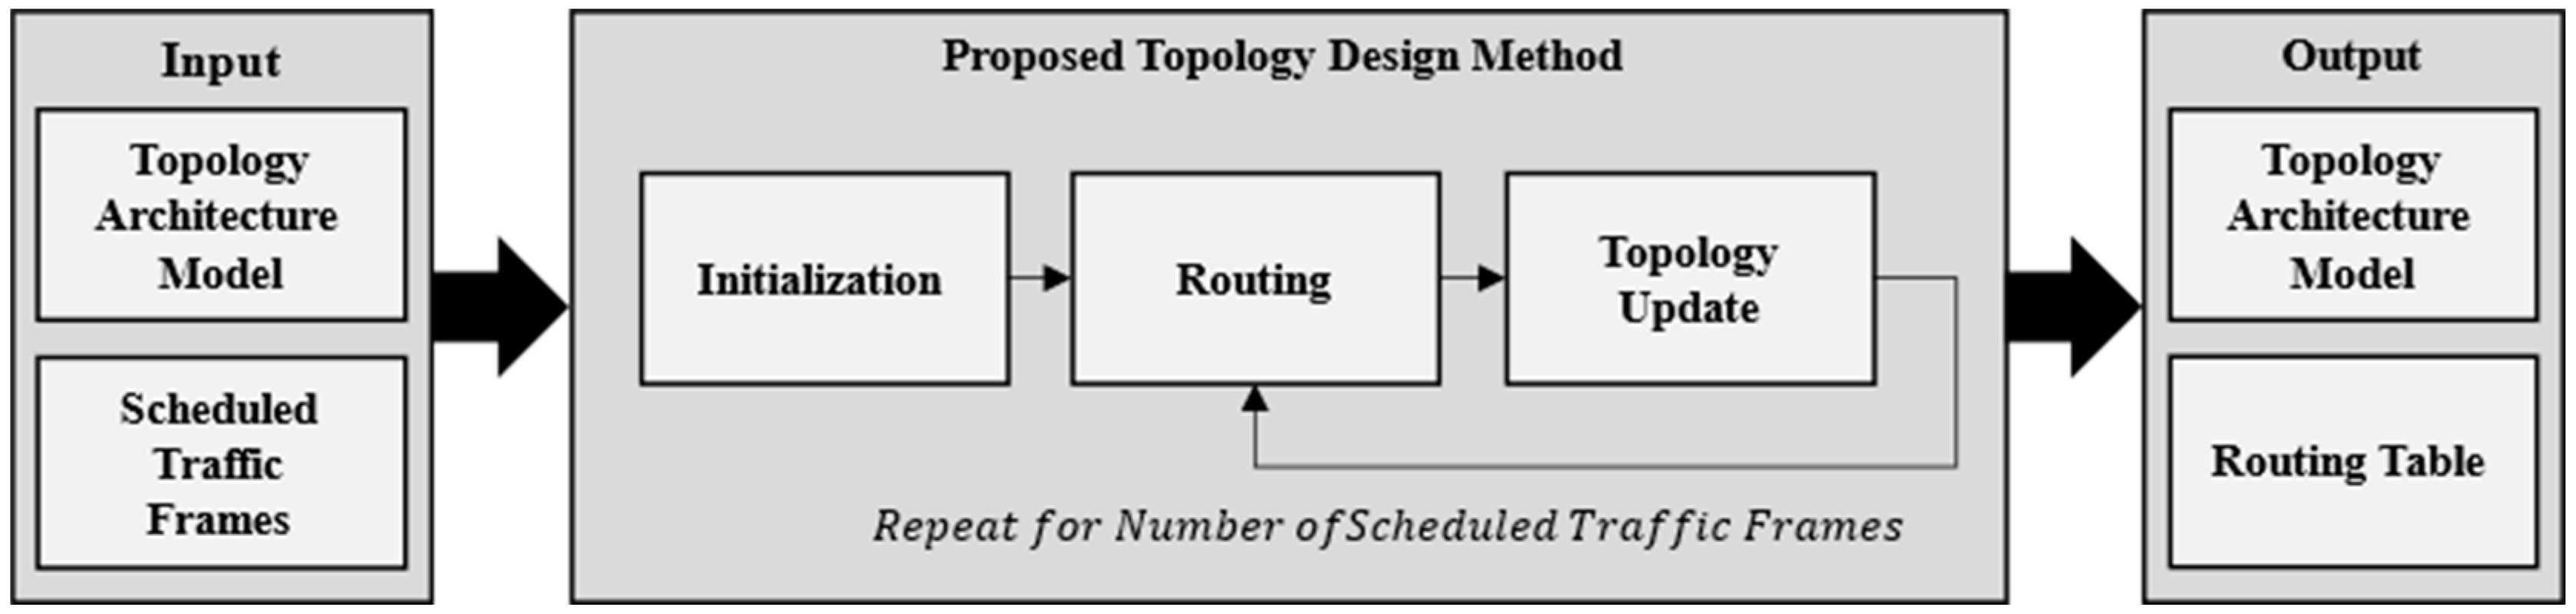
3. Topology Design Method
Figure 2 shows the topology design method proposed here. This method considers the initial topology connection and ST frame information as the input, routes the transmission paths of the ST frame individually, updates the topology, and generates the topology structure and transmission paths of the ST frames as the output.
In particular, the routing phase used Yen’s KSP to generate multiple paths and select the path that minimized the flowspan. The path was selected by assigning a schedule to the schedule table and selecting the path with the shortest transmission completion time. In the case of multiple paths with the same completion time, the path with the least amount of traffic was chosen.
This method minimized bandwidth wastage in ST transmissions by designing an efficient redundant topology.
Table 1 presents the parameters used in the proposed method.
In this study, we used the function to place schedules in the schedule table during routing. It placed the schedule of a frame in the table based on the NW-PSP and output the schedule of the frame. Therefore, the schedule was placed at the fastest transmission location without latency at each node. In addition, the function output the traffic of the most-bottlenecked transmission port as the maximum traffic when a schedule of redundant paths was placed.
Algorithm 1 shows the pseudocode for the topology planning method. The proposed method accepted
and
as input. It planned the topology by sequentially creating paths for transmitting
and activating the connections of
. The output of this process was
and
. The topology planning method comprised initialization, path selection, and topology update phases. The topology was planned by repeating the path selection and topology update steps as many times as the number of frames in
.
| Algorithm 1. Topology Design Algorithm |
| 1: |
|
| 2: |
# |
| 3: |
|
| 4: |
|
| 5: |
# |
| 6: |
|
| 7: |
# |
| 8: |
|
| 9: | |
| 10: |
|
| 11: |
# |
| 12: |
#
|
| 13: |
|
| 14: |
# |
| 15: |
|
| 16: |
|
The initialization phase initialized the to be used for routing and aligned the . was initialized by calculating the topology cost based on the connection status of . recommended enabling connectivity between the end nodes and switched to facilitate routing. was sorted in ascending order by transmission period and then in descending order by the length of the frame. This sorting method ensured that frames with longer lengths were used first, and those with shorter transmission cycles were used instead if they had the same frame length. Consequently, the gaps between the schedules were minimized when they were placed sequentially.
The path-selection phase selected a path for a single ST-frame. If the of a was zero, a single path was created; if the was one, a redundant path was created. Path selection used a schedule table to generate a transmission schedule for a selected path. The topology update step used the generated routes to update the routing table and topology model. In addition, the schedule table was updated using the generated schedule.
In the presented approach, the time complexity of the algorithm responsible for generating a single path is lower than that of the algorithm generating multiple paths. Consequently, the best-case time complexity is expressed as , where denotes the number of ST frames, and is the time complexity corresponding to the function. Conversely, the worst-case time complexity is characterized as , where corresponds to the time complexity of the function.
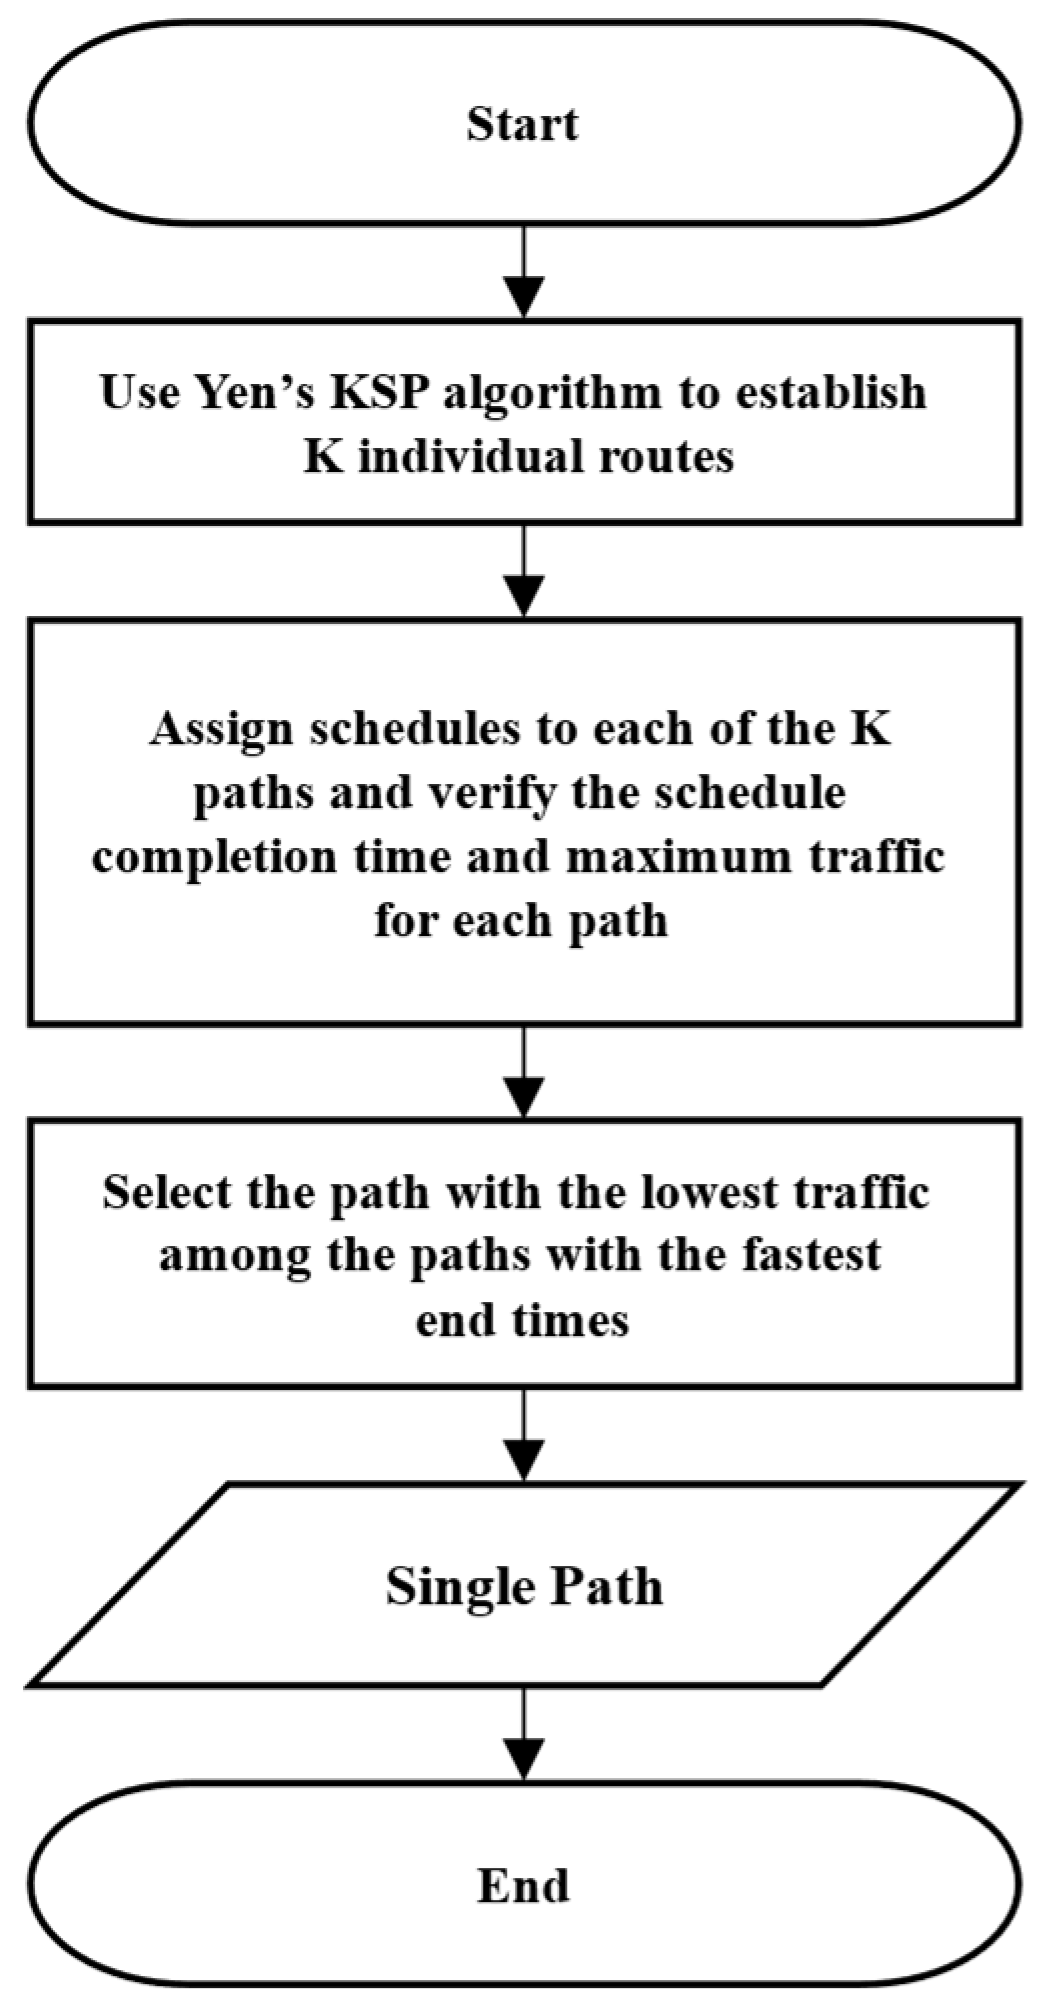
Algorithm 2 shows the pseudocode for the
function used to create a single path.
Figure 3’s flowchart visually depicts the process. It used Yen’s KSP to generate
k-paths and selected one of the
k-paths to create the path. Yen’s KSP routed
k-paths by considering the topology cost and hopping of paths. Using route
R obtained from routing, we generated a single transmission schedule for the frames and calculated the maximum traffic for each path. Schedule and traffic were stored in
as a set of paths. The maximum traffic on a path was that of the port with the highest traffic among the transmission ports of the switches comprising the path.
| Algorithm 2. Single Path Routing Algorithm |
| 1: |
|
| 2: |
|
| 3: |
|
| 4: |
|
| 5: |
|
| 6: |
|
| 7: |
|
| 8: |
|
| 9: |
|
| 10: |
|
Then, the was sorted in ascending order by and in ascending order by the time the transmission was completed in the transmission schedule of the first cycle. The routes and schedules of the top dataset were output in the after sorting. The path selection method selected the path with the fastest transfer completion time in the first cycle. If multiple paths completed a transfer simultaneously, the path with the lowest traffic level was selected. This path selection method increased the schedule density and distributed traffic when creating a single path.
The time complexity of the algorithm for generating a single path varies with the network size and the number of ST frames. For a small network size, bottlenecks intensify, resulting in an increased scheduling time complexity. In this scenario, the worst-case time complexity is denoted as . For larger network sizes, the worst-case time complexity is determined by Yen’s KSP algorithm, resulting in . Here, K denotes the number of paths generated using Yen’s KSP, N is the quantity of ST frames, V denotes the total number of nodes in the topology, and E denotes the total number of links in the network.
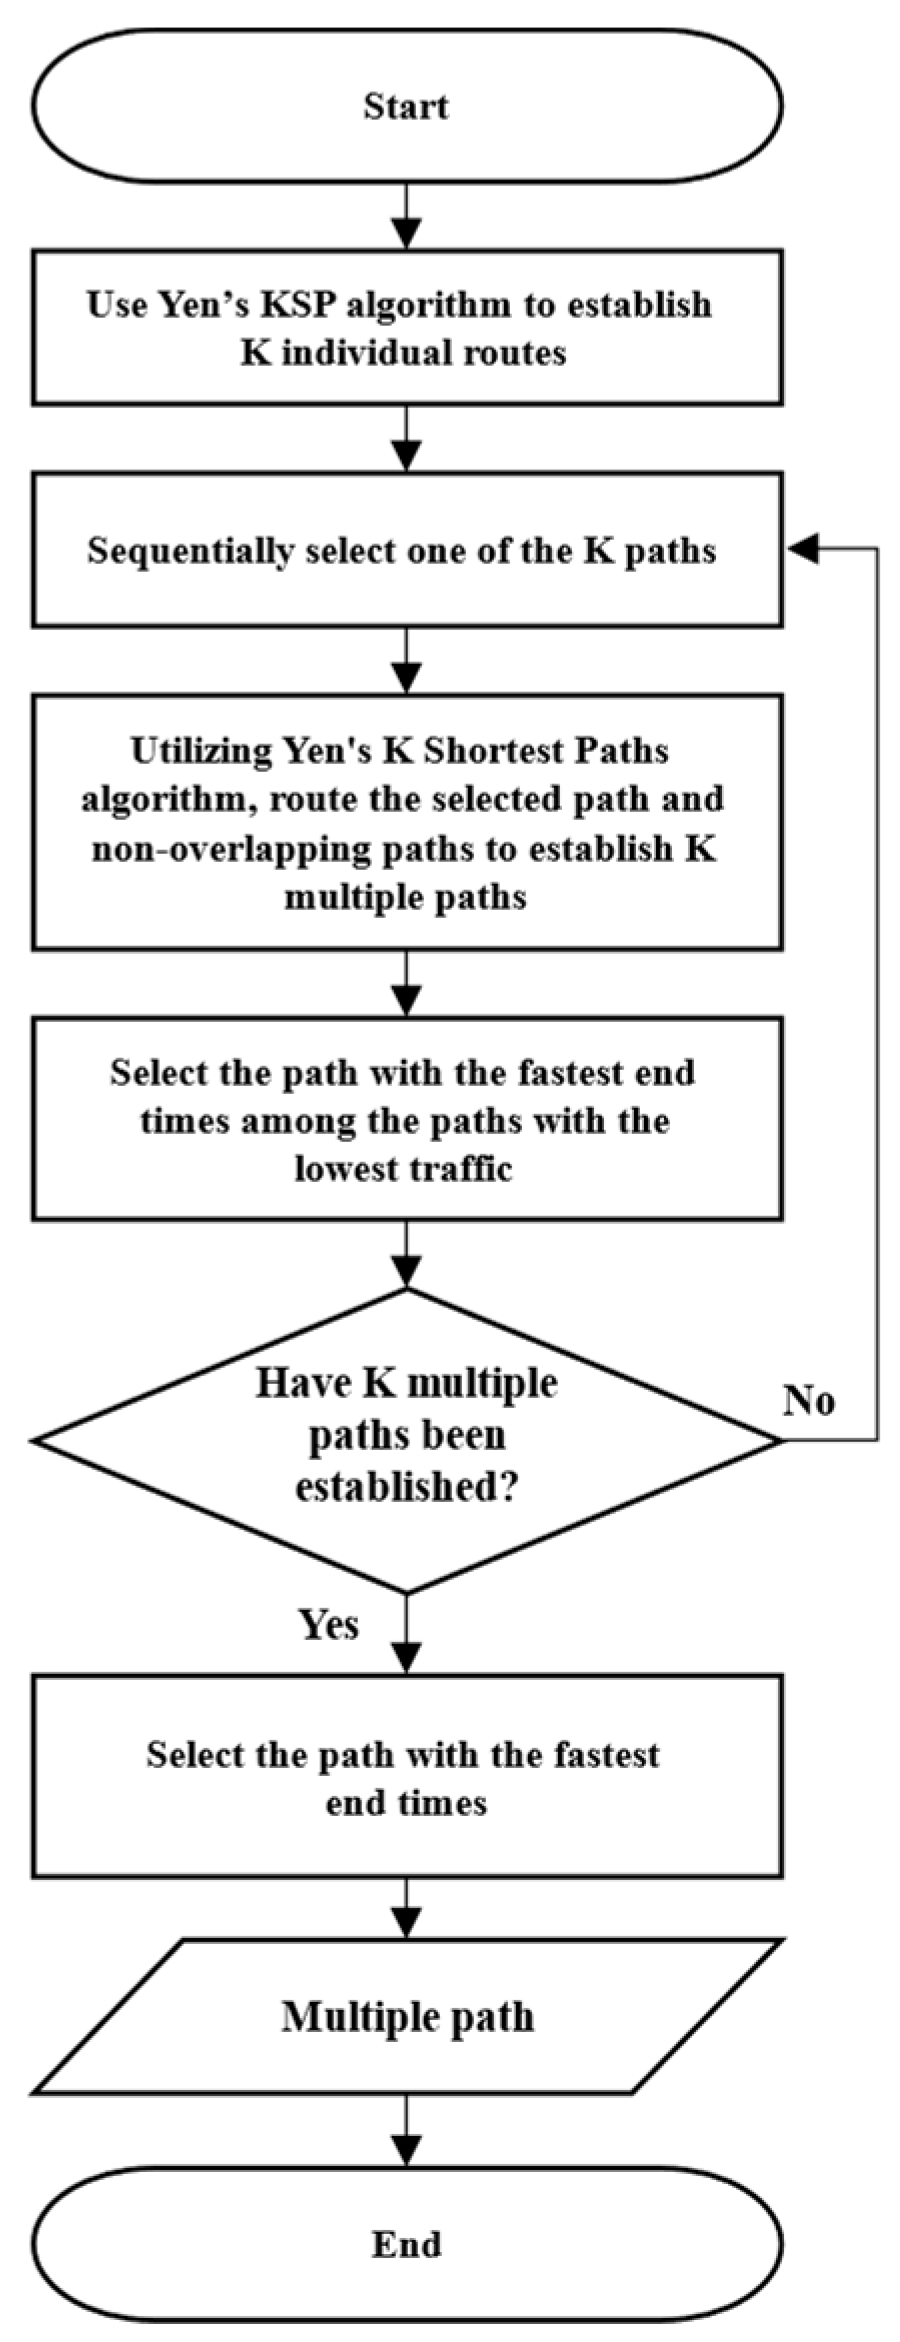
Algorithm 3 shows the pseudocode for the
function, which created redundant paths.
Figure 4’s flowchart visually depicts the process. Here,
k-paths were created using Yen’s KSP. Redundant paths were created based on the paths in created path
. Subsequently, the path with the fastest transmission completion time in the first cycle of
k-paths was selected. The selected path and transmission schedule for the selected path were the output.
| Algorithm 3. Multipath Routing Algorithm |
| 1: |
|
| 2: |
|
| 3: |
|
| 4: |
|
| 5: |
|
| 6: |
|
| 7: |
|
| 8: |
|
| 9: |
|
| 10: |
|
| 11: |
|
| 12: |
|
| 13: |
|
| 14: |
|
| 15: |
|
| 16: |
|
| 17: |
|
| 18: |
|
The create redundant path task created a path independent of the base path by removing nodes except switches that were not directly connected to the sending and receiving nodes of the base path. Consequently, it generated k-redundant paths using Yen’s KSP algorithm. The generated backup paths were combined with the reference path to form a redundant path. The schedule and maximum traffic on the redundant path were then checked and saved in .
Next, one of the k-redundant-paths was selected based on the base path . The path with the lowest maximum traffic was selected. If there were paths with the same maximum traffic, the path with the fastest transmission completion time in the first cycle was selected. The dataset containing the selected path was stored in .
Next, a redundant path of k-paths in was generated and the path that minimized the flowspan was selected. To improve the schedule density, we chose the path with the fastest transfer completion time in the first cycle among the redundant paths. This path selection method considers schedule density and traffic distribution when configuring redundant paths. Therefore, it was likely that the flowspan would be reduced when running the schedule on the completed topology.
The time complexity of the algorithm for generating duplicate paths varies based on the network size and the number of ST frames. In scenarios involving a small network size, bottlenecks become more pronounced, resulting in an increased scheduling time complexity. Specifically, the algorithm’s time complexity in this context is denoted as . Conversely, for larger network sizes, the worst-case time complexity is derived by multiplying the execution count with the time complexity of Yen’s KSP, yielding . In situations where the network size is small, the worst-case time complexity is calculated as . Here, denotes the number of paths generated using Yen’s KSP, denotes the number of ST frames, denotes the total number of nodes in the topology, and denotes the total number of links in the network.
In conclusion, the proposed method demonstrates varying worst-case time complexity based on the network size and the number of ST frames. For a small network size, the worst-case complexity is determined as . Conversely, for larger network sizes, the worst-case complexity is expressed as . Consequently, in the design of a topology for transmitting a substantial number of ST frames in a small network, there exists a relatively high likelihood of engaging in a significant number of computations.
4. Experiments
In this study, we evaluated the performance of the proposed topology design method by comparing it with two comparators in a simulation environment. The first comparator, Yen’s KSP-based topology design (YKTD) method, was based on Atallah et al. [
24]. The YKTD method employed Yen’s KSP, which used the ratio of hop count and topology cost as the network cost and checked the schedule placement. The second comparator, the flowspan-optimized routing-based topology design (FORTD) method, was derived from Nayak et al. [
25], and applied a routing algorithm to minimize the flowspan while enhancing the YKTD method. The FORTD method achieved traffic distribution by calculating the network cost as the sum of the hop count, topology cost, and maximum traffic on the path.
YKTD, FORTD, and the proposed method all used Yen’s KSP for topology design. They calculated the network cost
using the same approach. The formula for calculating the network cost was:
The network cost was calculated as the sum of and . represented the number of hops in the path, while was the expense incurred when activating the elements constituting the path. was computed as the sum of costs, which was based on the number of activated links and the number of ports on switches.
To evaluate the proposed topology design in various scenarios, we configured 20 different network environments and generated 50 random scenarios for each environment, resulting in 1000 validation scenarios.
Table 2 presents the network configuration environments, including the number of end nodes and ST frames transmitted over the network. The maximum number of switch nodes was set to 40 for all network environments.
Random scenarios involved generating ST frames under various conditions.
Table 3 outlines the ST frame generation conditions, which involved randomizing the frame periods between 1 ms and 10 ms, sizes between 200 bytes and 1500 bytes, and designating 50% of all ST frames as critical frames to ensure that 50% of the frames used redundant paths. In particular, during scenario generation, all end nodes were configured for use to prevent excessive bottlenecks from occurring.
The performance was validated on a Windows 10 computer equipped with an Intel i5-7600 CPU and 8 GB RAM. We used Python version 3.7.5 to implement and evaluate different topology design methods. We assessed these methods’ performance in terms of flowspan, traffic distribution effect, topology cost, and design time. Following the topology design, we performed NW-PSP scheduling to compare the flowspan performance.
Figure 5 shows the reduction ratios of the flowspan and maximum traffic reduction for the proposed and FORTD methods compared with the YKTD method across the entire set of scenarios. For clarity, each graph sorted the metrics in descending order. The
y-axis represented the number of scenarios, and the
x-axis represented the performance metrics. Graph (a) shows the reduction ratio of the flowspan, and (b) shows the maximum traffic reduction.
The FORTD method reduced the maximum traffic compared with the YKTD method in all scenarios, effectively alleviating bottlenecks. However, the proposed method exhibited more significant bottlenecks than the YKTD method in 7% of the scenarios. Nevertheless, the proposed method achieved a smaller flowspan than the YKTD method in all scheduling scenarios. Conversely, the FORTD method, which excelled in traffic distribution, had the same or a larger flowspan than the YKTD method in 10% of the scenarios.
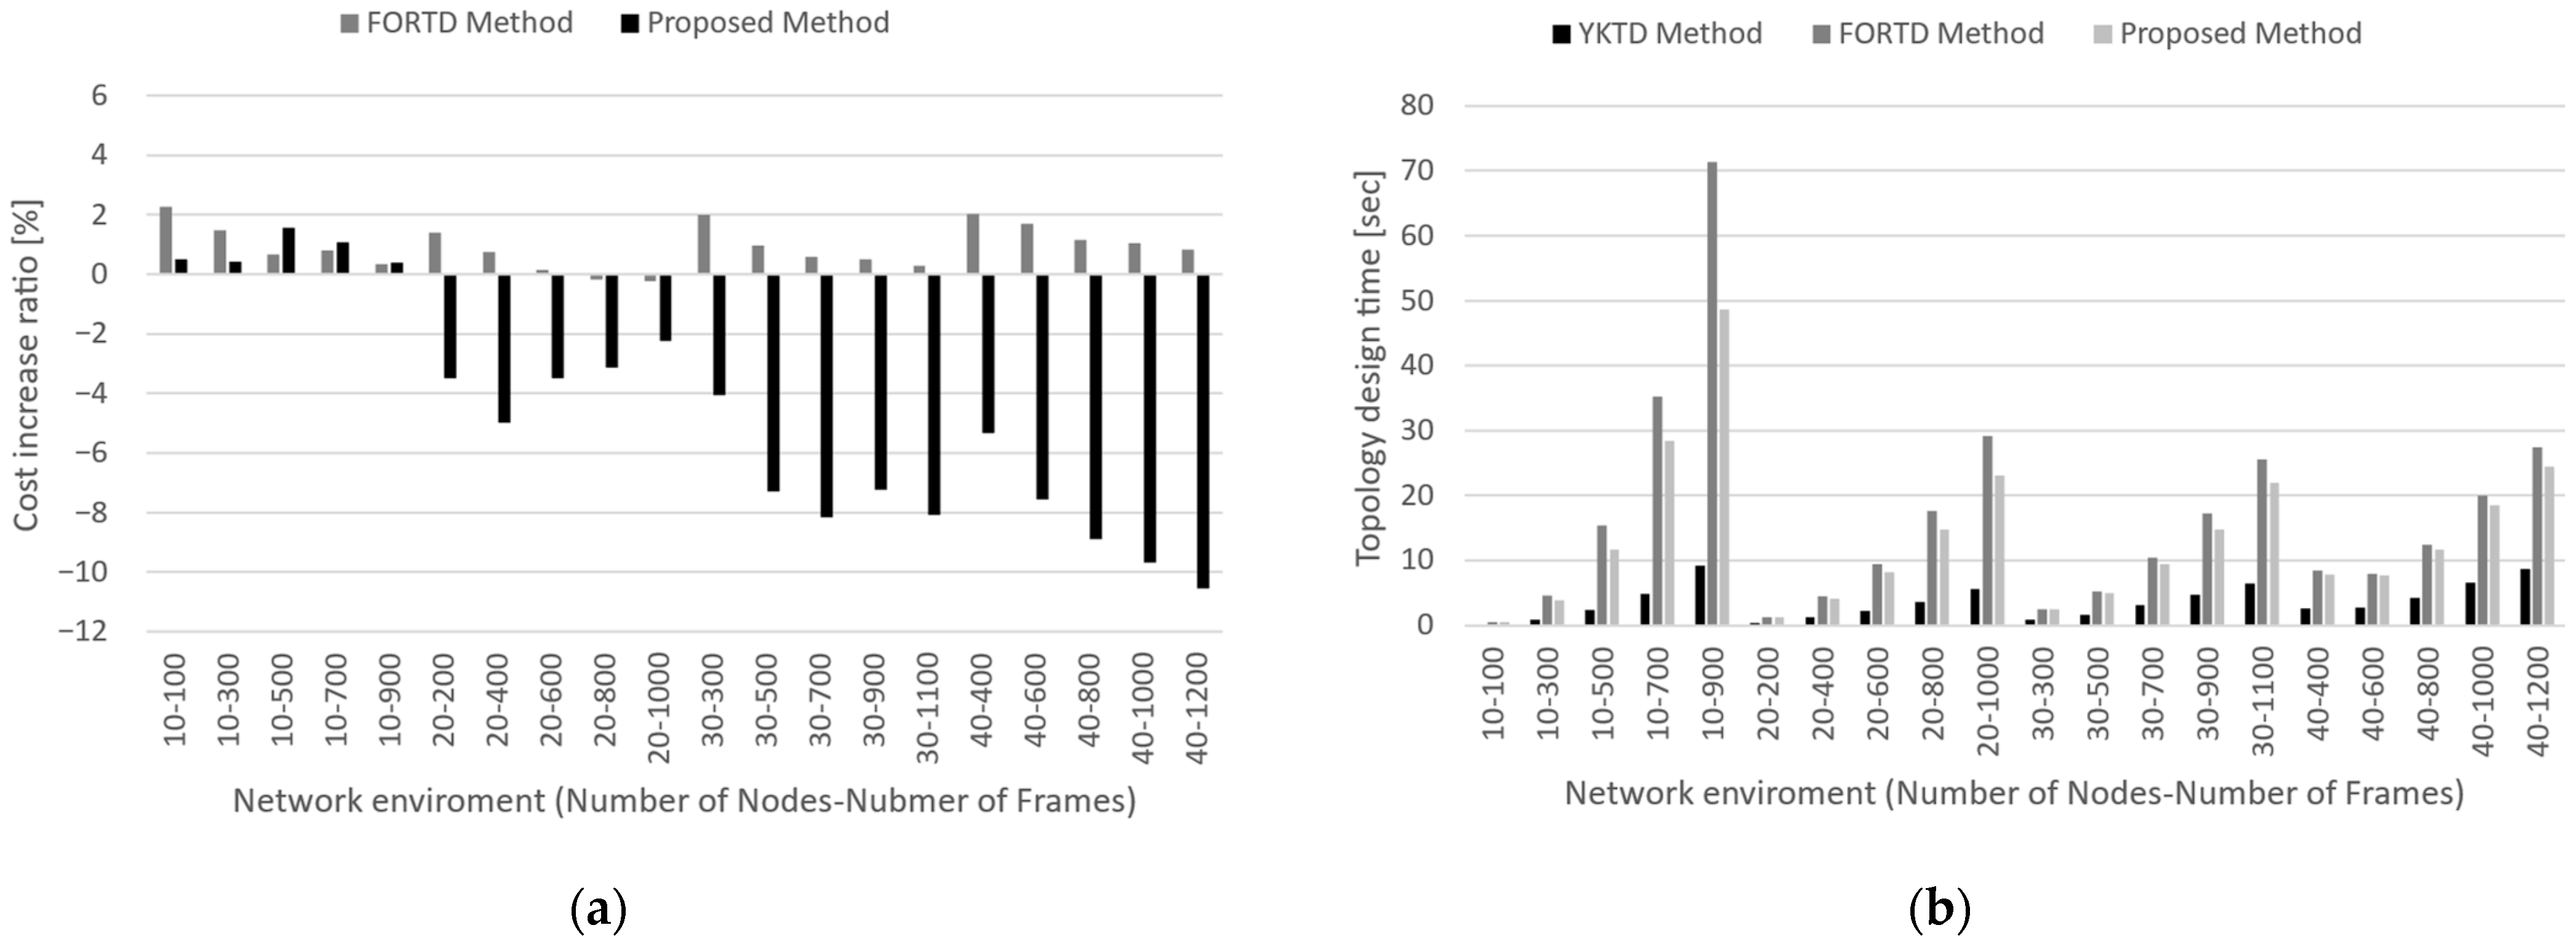
Figure 6 illustrates the cost growth rate (a) and topology design time (b) as functions of the number of nodes and frames. In most scenarios, the FORTD method incurred higher topological costs than the YKTD method. Conversely, the proposed method incurred higher costs only when the topology size was small, and the topology costs decreased as the network size increased. This behavior was attributed to the FORTD method, which selected dense paths in the schedule even if the hop count was long.
The topology design time increased with the number of frames, particularly when the number of terminating nodes was small. This was because it took more time to check the feasibility of ST schedule placement owing to the complexity of the schedule table during path selection. Notably, the FORTD method required the most time for topology design. This was because Yen’s KSP added the traffic distribution process to routing, thereby increasing the complexity of route discovery.
In summary, the proposed method exhibited a less effective traffic distribution than the FORTD method and required more time for topology design than the YKTD method. However, it reduced the topology costs when the topology size increased, with the topology design requiring a short time of up to 50 s. In particular, the proposed method reduced the flowspan in all scenarios compared with the YKTD method. These results demonstrated that the proposed topology design method could design redundant topologies with improved scheduling performance.
5. Conclusions
This study proposes a method for designing a redundant topology required for ST frame transmission using the fault-tolerant feature of the IEEE 802.1CB FRER standard in TSN networks. The proposed method used Yen’s KSP for topology design, establishing two redundant paths for the inherent fault tolerance of critical ST frames. Specifically, during topology design, the method minimized bandwidth waste during ST transmission by activating paths that optimize the performance of the NW-PSP.
The proposed topology design method comprised three main stages: initialization, routing, and topology update. In the initialization stage, the graph model used for the topology design was initialized. In the routing stage, K-paths were generated using Yen’s KSP. After placing ST frames in the schedule table using K-paths, the method selected paths with the potential to optimize the scheduling performance, considering the maximum traffic and transmission completion time. Then, the selected paths were used to update the topology, thereby completing the topology design.
To evaluate the performance of the proposed topology design method, we conducted simulations in various network environments while considering the network cost and traffic distribution methods. In conclusion, the proposed method streamlined scheduling and demonstrated notable efficiency in large-scale topologies, thereby providing an effective approach for topology design that minimized bandwidth waste.
However, note that the proposed topology design method focuses exclusively on optimizing the flowspan, which was a crucial performance metric for NW-PSP. Further research is required to assess the impact of the proposed method on scheduling optimization related to guard bands, jitter, and delays.
Another limitation of the proposed method is the absence of consideration of physical constraints during topology design. Therefore, future studies should investigate the integration of physical limitations into the proposed approach.


