Article

Risk-Based System-Call Sequence Grouping Method for Malware Intrusion Detection

Department of Information Systems, Faculty of Fundamental Sciences, Vilnius Gediminas Technical University, LT-08412 Vilnius, Lithuania
*
Author to whom correspondence should be addressed.
Electronics 2024, 13(1), 206; https://doi.org/10.3390/electronics13010206
Submission received: 7 November 2023 / Revised: 30 December 2023 / Accepted: 1 January 2024 / Published: 2 January 2024
(This article belongs to the Special Issue Feature Papers in "Networks" Section)

Abstract

:
Malware intrusion is a serious threat to cybersecurity; that is why new and innovative methods are constantly being developed to detect and prevent it. This research focuses on malware intrusion detection through the usage of system calls and machine learning. An effective and clearly described system-call grouping method could increase the various metrics of machine learning methods, thereby improving the malware detection rate in host-based intrusion-detection systems. In this article, a risk-based system-call sequence grouping method is proposed that assigns riskiness values from low to high based on function risk value. The application of the newly proposed grouping method improved classification accuracy by 23.4% and 7.6% with the SVM and DT methods, respectively, compared to previous results obtained on the same methods and data. The results suggest the use of lightweight machine learning methods for malware attack can ensure detection accuracy comparable to deep learning methods.

1. Introduction

An intrusion-detection system (IDS) is a device or software that monitors a network or system for malicious activity or violations of established policies [1]. IDSs can be divided into two major types [1]: network-based intrusion-detection systems (NIDSs) [2] and host-based intrusion-detection systems (HIDSs) that detect malware or host-level attacks on a server or local computer and are able to perform additional system-level checks such as data integrity, registry monitoring, log analysis, rootkit detection and system-call analysis [2] and complement network-based intrusion-detection systems by focusing on internal threats and unauthorized activities [3]. HIDSs can detect various types of attacks, including malware infections, unauthorized access attempts, privilege escalation, and suspicious system modifications [4]. In this research, we focus on the host-level intrusion detection of malware attacks since network-level detection has been thoroughly examined and presented in numerous articles that contain promising results [5,6], while different malware, especially ransomware attacks still pose one of the major threats to cybersecurity.
Classical HIDS and antivirus (AV) approaches are based on change monitoring of critical files and malware signatures, respectively, but are not resistant to zero-day attacks [7]. Although modern malware types, such as advanced persistent threats (APTs) cause more and more threats, classical malware types still dominate the landscape and the need for attack detection using anomaly-based methods remains not fully met. Recent research has focused on using system calls as a basis for intrusion detection, with an increasing number of papers exploring this approach. System calls provide the raw source of information about what the applications are doing in the system and they allow us to predict the maliciousness of the application itself [8,9,10]. An operating system API function call (or a system call) is a programmatic way to request the operating system to perform an activity. Many of these functions are implemented in a part of the operating system called the kernel, which interacts directly with the computer’s hardware, hard disk, input and output devices and tells the computer when and at what time CPU and memory resources must be made available to execute a particular process [11]. System functions are called through the underlying libraries offered by the operating system to perform the required functionality so that the required library module is included to execute a selected process, and then the desired method is called from the selected module that interacts with the operating system kernel [12]. By analyzing system-call patterns, it is possible to detect anomalies and identify potential security breaches in Windows systems [13], which are still used by more than 74% of desktop users in 2022 [14], and other operating systems. This is particularly relevant given the popularity of Windows as an operating system, making it a prime target for attackers [7].
In recent years, there has been growing interest in leveraging artificial intelligence (AI) techniques to enhance the detection capabilities of HIDSs by analyzing large volumes of data, identifying patterns, and detecting anomalies that may indicate malicious activities [15] and for system-call-pattern recognition [7]. One approach in the AI direction is the use of autoencoders, a type of neural network, for intrusion detection [16]. Autoencoders can learn the normal behavior of a system and detect deviations from it, which can be indicative of an intrusion. By training the autoencoder on a large dataset of normal system behavior, it can effectively reconstruct and predict the features of the system. When presented with anomalous behavior, the reconstruction error will be higher, triggering an alert for potential intrusion [16]. Another AI-based improvement for HIDSs is the use of ensemble methods, where multiple AI models are combined to improve detection accuracy. Neural network ensembles have been proposed for distributed intrusion-detection systems, allowing for better adaptation to the challenges of modern attacks [17]. Additionally, support vector machine (SVM) algorithms have been utilized in hybrid intrusion-detection systems for wireless sensor networks, combining anomaly detection and signature-based rules to provide lightweight and effective intrusion detection [18]. Still, the need to increase the detection accuracy of machine learning methods for attack detection at system level remains, as well as the need for relatively lightweight machine learning methods. In this article, we propose a risk-based system-call sequence grouping method for malware intrusion detection that allows deep learning method accuracy to be achieved using relatively lightweight SVM and decision tree (DT) methods.
Simple machine learning methods for malware detection based on API calls offer several advantages that align with contemporary requirements. These methods have been shown to be effective in detecting malware by analyzing the behavioral semantics of applications and API calls, as demonstrated by [19]. Additionally, the use of lightweight classifiers and feature extraction methods based on API call graphs, as seen in the work of [20], provides efficient and practical solutions for malware detection. Furthermore, consideration of the relationships between API calls during training, as highlighted by [21], contributes to the successful prediction of malware families.
The main contributions of this paper are the following:
  • The proposed malware riskiness method evaluation based on sequence call frequency and function risk value;
  • Experimental evaluation of several of the most prospective ML methods for malware intrusion detection on the converted dataset with riskiness data that demonstrated results comparable with DL methods applied on the original dataset without riskiness data.
This paper is organized as follows: the Introduction section presents the host level intrusion-detection problem area; the second section describes prior and related work carried out on anomaly-based malware detection using system calls as well as available datasets used for training; the third section introduces the proposed risk-based system-call sequence grouping method for malware intrusion detection and the fourth sections discusses the experimental results obtained. Finally, the article offers its conclusions and possible directions of future work.

2. Prior and Related Work

The first part of this section will analyze the methods used for system-call grouping in the scope of applicability for malware detection. In addition, this part also reviews the ML and DL methods used for malware and intrusion detection. The second part evaluates datasets suitable for malware and intrusion-detection training.

2.1. Overview of Research on System-Call Grouping and Machine Learning Methods

System-call grouping is an important technique in computer science and intrusion-detection systems. System-call grouping refers to the categorization and organization of system calls based on their characteristics and relationships. This grouping allows the analysis and understanding of system-call patterns and dependencies, which can be useful in various domains such as malware detection [22] and anomaly-based intrusion-detection systems [23]. By grouping system calls together, researchers and practitioners can identify commonalities and differences among system-call behaviors, enabling them to develop more effective detection and classification algorithms [22].
One example of system-call grouping is the study conducted by [23], where they considered system calls such as read, readv, pread, and fread as the same system call. This approach of grouping similar system calls together enabled a more comprehensive analysis of their behavior and could improve the accuracy of anomaly-detection systems. Another relevant reference is the work by [22], which discusses the utilization of temporal graphs of system-call group relations for malicious software detection and classification. By creating a system-call dependency graph and grouping related system calls, it demonstrates how the graph can be used to identify patterns and relationships among system calls, aiding in the detection and classification of malicious software. However, the research does not mention any experiments conducted with real data as the focus of the paper is on discussing the technological status of malware detection and classification and presenting the main components of the proposed model.
System-call grouping is not only used in malware detection, but also in the graphical representation of applications. The graphical representation of system calls is a valuable approach for understanding and analyzing the behavior of these calls in an operating system. Several studies have explored the use of clustering methods in conjunction with graphical representations of system calls. One study [24] utilized the open-source tool Graphviz to generate graphical representations of Unix process system calls. This approach facilitated the comprehension of the behavior of these system calls, aiding in the learning of the Unix operating system. By visualizing the relationships between different system calls, clustering methods could be applied to identify patterns and group similar calls together. Another work proposed the collection of sequences of system functions from malware samples and map them to color heat maps [11]. To represent such a heat map, the author defined a system function on one axis, a process that calls this function, and the number of calls on the other. The problem with this way of mapping is that it maps the system functions of several processes and does not map just one malware sample, but the system functions called by many applications and their processes. This issue does not allow the reuse of the mapping technique for system-call grouping properly for later analysis with ML methods.
Another way to represent the actions of a malware that researchers have proposed is mentioned in [25]. The authors collected the dataset and visualized the functions’ actions using a tree map algorithm, which displays the information in defined rectangles for each group of records. With this mapping method, the more the malware calls a specific system function, the larger the rectangle for that call will be. In total, 120 different system functions were analyzed but, unfortunately, the authors did not specify how the image creation was performed [25]. As with the aforementioned heat mapping approach, there was also a loss of sequences.
The authors of another research paper decided to group Windows API functions according to their level of maliciousness, from non-malicious to very malicious [26]. For each level, the colors were indicated, and a bar was generated from the called system functions, in order to replace the entry of each function with a bar of a given, specified color. By generating bands of function sequences, the authors were able to preserve the order of the function sequences, unlike other representations of system functions discussed in other approaches. Knowing which function is followed by which function is essential, as it is likely that not only the called functions could be used to determine whether it is a malware, but also the order of the harmful functions. This is the most appropriate way to represent system-call sequences because, as mentioned before, the order is preserved, but there was a major problem with the representation: there was no indication of how the author had grouped or determined the riskiness of each function and its effectiveness. Also, when looking at the figures, it was difficult to determine whether the figure referred to a malware or a benign code, as the authors used too many different colors.
In summary, system-call grouping is a valuable technique that enables the categorization and analysis of system calls based on their characteristics and relationships. It has applications in various domains, including malware detection and anomaly-based detection systems. A comparison of reviewed methods is presented in Table 1. By grouping system calls together, researchers and practitioners can gain insights into their behavior and patterns, leading to more effective detection and classification algorithms. More importantly, the analysis of work where graphical representation is described could help to improve host-based intrusion-detection systems, as they can provide valuable information on how to cluster system calls by similar properties.
Moreover, the use of sequential system calls and API call sequences, as demonstrated by [27], enables the incremental detection of malware, addressing the need for continuous monitoring and detection in contemporary cybersecurity. These methods leverage the inherent characteristics of API calls and system calls to detect anomalies and malicious behaviors, aligning with the evolving threat landscape and the need for robust protection against malware, as discussed by [28].
An extensive range of machine learning methods has been employed for anomaly detection in the domains of malware and intrusion detection. Some commonly used machine learning methods are: naive Bayes (NB), support vector machine (SVM), K-nearest neighbor (KNN), artificial neural networks (ANN), DT, random forest (RF), hidden Markov model (HMM). Research studies have indicated that SVM and DT are among the most promising methods for anomaly detection. SVM and DT algorithms have been widely used in HIDSs due to their effectiveness in detecting and classifying intrusions [29,30,31]. In the context of HIDSs, SVM can learn the patterns and characteristics of known attacks and identify similar patterns in real-time system behavior, enabling the detection of unknown or novel attacks [29]. The advantages of SVM in HIDSs include its ability to handle high-dimensional data, its robustness against overfitting, and its effectiveness in handling both linear and non-linear classification problems. The advantages of DT in HIDSs include their interpretability, ease of understanding, and the ability to generate rules that can be used for further analysis and investigation of detected intrusions [29]. In our previous research, where different machine learning methods were evaluated, SVM showed promising intrusion-detection results in combination with the lowest training and classification times. The classification results were better than the DL LSTM model [32]. The same idea supports DT—this ML method also produced comparable classification results [33]. Additionally, DT showed the best results in classification time and comparable results in training-time experiments. The aforementioned results encouraged us to experiment with SVM and DT in the field of HIDSs, as they can provide better performance in terms of time used for the training and classification tasks.

2.2. Analysis of Applicable Datasets for Malware Intrusion Detection

For almost two decades, researchers working in the field of intrusion detection have been using a publicly available Linux-based KDD98 data set [34,35,36]. However, that database is from 1998 and has lost its completeness and quality. Furthermore, the nature of the data collected in the KDD98 dataset was more geared toward NIDSs than towards HIDSs [37]. To address those issues, another Linux dataset, ADFA-LD, was developed in 2014. ADFA-LD, was created by running selected malicious programs on the Ubuntu 11.03 Linux operating system, which also ran essential services such as web, database, secure shell (SSH) and FTP [38]. As the Windows operating system is much more popular than Linux, subsequently, the need arose to develop the ADFA-WD. The ADFA-WD dataset was built on a Windows XP SP2 operating system running applications such as a web-server, a database server, an FTP server, a streaming media server, a PDF reader, etc. A total of 12 different vulnerabilities were tested using Metasploit software, and a complement to the dataset, ADFA-WD:SAA, was created by using three different secret Windows operating system stealth attacks [38]. ADFA-WD:SAA is a stealth attack-oriented addition to the ADFA-WD suite [39]. Unfortunately, the ADFA-WD dataset does not provide a way to identify exactly which method was called from the DLL files.
There are also other HIDS-related datasets worth mentioning, but they all have issues that made them unusable in our research which is oriented towards Windows system-call analysis. A table with those datasets and notes about the data it contains is provided below (Table 2).
Slightly later, in 2018, a new dataset, AWSCTD, was created. This dataset provides a better training capability for HIDSs, as it not only provides more detailed malware system-call sequences, but also provides additional information on malware, such as modified files and other general information about actions [47]. AWSCTD is probably one of the newest Windows system-call datasets that is generated from the publicly available, VirusShare malware database. As the samples in VirusShare are not necessarily malicious, therefore, for the dataset, only samples with 15 or more positive detections by different antiviruses were selected [47]. The dataset contains over 10,276 samples. It should also be noted that the AWSCTD dataset has a significantly higher number of collected malware system function sequences than the older Windows dataset ADFA-IDS (Table 3). It is therefore expected that, due to the novelty and the size of the dataset, it will be possible to generate malware graphically with higher accuracy.
The AWSCTD dataset contains up to 540 unique system functions; it also contains 115 unique system functions that have never been called in clean code. Of these, up to 29 functions have been called more than 100 times by malicious code. There were 45 functions that were not called by the malware and only called by the clean code. Hence, as this dataset is newer and has a vast number of system-call records, it is more suitable for analyzing the sequences of different malware functions than the ADFA dataset. It is likely that the use of more recent data will lead to better results for this study, and for this reason the AWSCTD dataset will be used in this study, as it is intended to adapt the study to data that is more contemporary.
The unconverted AWSCTD was used in our previous experiments [7,32,33]. The results obtained were really good for the resource requiring deep-learning methods (dual-flow deep LSTM-FCN and GRU-FCN, single-flow CNN) and the accuracy metric was equal to 98.9, 98.8 and 99.3 percent, respectively [7]. The use of classical and relatively lightweight machine learning methods was not as good and the accuracy for SVM and DT was equal to TT and PP, respectively, [32,33] although it is worth mentioning that in the latter research no system-call grouping, or other optimization methods, were used.

3. The Proposed Risk-Based System-Call Sequence Grouping Method

This section describes the proposed risk-based system-call grouping method, the metrics used for its evaluation, as well as known method limitations and issues.

3.1. General Method Description

The method proposes a way of grouping system calls according to their riskiness. In order to explain the proposed risk score for sequence grouping, the four basic concepts of a risk score are defined:
  • Function risk ratio (FRR);
  • Database risk ratio (DRR);
  • Clustering risk ratio constant (CRR);
  • Average risk ratio (ARR);
  • The final risk value or riskiness of a function (system call) (RV).
The FRR is obtained by applying the risk ratio Equation (1) presented below: the number of calls made by the malware is divided by the number of calls made by the clean code.
FRR = k s ,
where FRR is the function risk ratio; k is the number of calls by the malware; s is the number of calls by the clean code. Range is from 0 (zero) to any positive number and depends on the number of unique system calls.
The DRR is the ratio between the number of malware sequences of system functions and the clean code sequences in the database. That is, all lines are scanned, and the number of clean and malicious code lines is counted, and finally one value is divided by the other. Functions with a risk ratio lower than the baseline risk ratio are classified as low risk because such functions are rarely called by malicious code.
DRR = k s ,
where DRR is the database risk ratio; k is the number of malware sequences; s is the number of clean code sequences. Range is from 0 (zero) to any positive number (if malware calls dominate the dataset).
The DRR is needed because if a risk score for a system function is determined without a baseline risk score, there is a problem if the dataset contains much more malware or clean code data (the database is imbalanced) that this data may distort the FRR for a given system function. For example, with a small dataset consisting of 4 malicious and 6 clean code entries, a system function could be called 10 times by the malware, while each clean code would call the same system function only 7 times. In this case, the malware would call the function 40 times in total, while the clean code would call it 42 times. Hence, after applying the risk ratio formula, at the first glance, it seems that this function is not malicious because, clean code calls are slightly more often than malicious code calls. This is not true, since there were simply fewer malicious code entries in the dataset.
The CRR is determined experimentally by the searching of a CRR value giving the best machine learning results. In our experiments, the range was from 1 to 3 with a step of 0.5.
The ARR is calculated by multiplying DRR by CRR (Equation (3)):
ARR = DRR   ×   CRR ,
The RV is a final number that indicates whether the system function has low, medium, or high risk. RV is determined according to the RV table (Table 4).
The proposed grouping method thus consists of the following seven main steps (Figure 1):
  • Reading the dataset and extracting unique system calls (functions).
  • Calculating the number of times the function has been called during the execution of benign applications and the malware. This can be achieved because in each AWSCTD dataset record, the last entry is the type of malware or an indication that it is not executed in a harmful application.
  • Calculating the riskiness ratio of the function (FRR).
  • Calculating the baseline riskiness from the dataset to set low-risk thresholds (DRR).
  • Finding the best CRR value. Before determining the riskiness of the functions, it is crucial to determine which clustering risk ratio constant should be applied to medium riskiness. The clustering risk ratio constant will be determined by classifying the dataset by applying a different value between 1.5 and 3.0, increasing the ratio by 0.5 increments (the margins were defined using empirical search; the size of the increment steps could in fact be smaller (e.g., 0.1), but smaller steps did not demonstrate the tendencies well and increased the number of experiments needed for the search). The clustering risk ratio constant must be chosen for the highest classification accuracy.
  • Applying clustering risk ratio constant (CRR) to the rules defined in Table 4.
  • The final risk value is determined from the RV table (system calls are replaced by values −1, 0 or 1).
  • Writing a new grouped dataset in CSV file format for later use. A CSV file is written in the same format as the dataset, except that at this point, each function is replaced by the numerical equivalent of the risk score.
After these steps are executed, each risk score for a function is determined by the risk ratio of the function relative to the number of clean and malicious records in the whole dataset. A sample method application is presented in Figure 2. For the final clustering result, at each location where function1 is specified in the dataset, each record is converted to its specified risk score.

3.2. Method Metrics

To ensure that the proposed way of grouping system functions is effective, it is necessary to evaluate the classification data accuracy of ML methods trained on the obtained dataset [48]. This research is mainly focused on the new system-call function grouping proposal. For that reason, only the two most popular machine learning methods (SVM and DT) identified in the review part are used.
The following standard metrics will be used to calculate the accuracy of these machine learning methods and corresponding proposed method efficiency: confusion matrix, accuracy, precision, recall, F-score, and error rate.
The confusion matrix (CM) is a size N matrix for evaluating a classification model’s performance, where N is the number of objects. It is a summarized table indicating the number of correct and incorrect predictions of the classifier [49].
Accuracy is the proportion of items that the model predicts correctly [49]. Accuracy is calculated using the following equation:
Accuracy = TP   +   TN TP   +   TN   +   FN   +   FP ,
Precision refers to the correct proportion of items that the model returns [50]. In other words, it refers to the probability that a model’s positive value will be correctly predicted. Precision is calculated using Equation (5):
Precision = TP TP   +   FP ,
Recall refers to how many of all items that should have been found were actually found [47]. The recall is calculated using the following equation:
Recall = TP FN   +   TP ,
The F-score refers to the overall weighted harmonic mean of precision and recall [50]. The F-score is calculated using the following equation:
F score = 2 ( Precision   ×   Recall ) Precision   ×   Recall ,
The error rate refers to the frequency with which the model makes an incorrect prediction [49]. The error rate is calculated using the following formula:
Error   rate = FP + FN TP + TN + FP + FN ,

3.3. Method Limitations

As with any method, the method proposed has some limitations. The risk calculation is simplified compared to classical risk calculation methods, leaving the impact untouched due to scope limitations. The method is not suitable for every dataset: if all the functions are called by malware and clean code a similar number of times, then each function would be assigned only a medium risk according to this algorithm. Thus, it is important to note that before applying this method to the chosen dataset, it is necessary to make sure that the dataset is sufficiently large and that there is a separation between the clean code and the number of functions called by the malware.
Another limitation of this clustering algorithm is that each feature contains more information than a simple risk score. Applying this clustering method could result in a significant loss of data in the dataset, as only three levels of risk scores are left from the many different system functions.

4. Results and Discussion

This section presents the results of the newly presented system-call grouping method. The results include the findings of the CRR value, evaluation of ML methods when the new grouping method is used and analysis of the system calls in the AWSCTD dataset.

4.1. Results of the CRR Determination for AWSCTD Dataset

In order to evaluate the effectiveness of the proposed method, the results obtained were compared against the initial AWSCTD dataset. Following the proposed method, the original AWSCTD dataset was converted to include riskiness values instead of numbers, corresponding to the system call (see Figure 3). Every dataset record has 1000 system calls.
In Figure 3, the left side conversion demonstrates the proposed dataset conversion according to the proposed method, while the right side uses the original dataset structure, where every system call is given a unique number.
Once the converted dataset was generated, the performance of the machine learning classifiers using different CRR values was evaluated (a sensitivity test was conducted). This process consisted of the following steps that were repeated for each different CRR:
  • Mixing and reading the rows of a dataset;
  • Five blocks of the dataset are created, where 80% of the data are isolated to determine the CRR, and the other isolated 20% are used to test the classification using machine learning;
  • Determining the ratio of malicious to clean code for each system function;
  • The records in dataset are iterated, and each function is replaced by the numerical equivalent of the risk score calculated;
  • Storing a grouped dataset in a CSV file;
  • Importing a CSV file into the Python environment and supplying data to the machine-learning classification algorithms.
In this process, it is essential to isolate the data before the risk score is determined, because if data isolation is not ensured at this stage, the risk score for each function would be determined from the entire dataset. This means that even if the classification process separates the 20% of the data tested and the other 80% trained, the result would not be correct, as the risk score itself would be determined from the whole dataset.
The process was carried out four times with different CRR constants ranging from 1.5 to 3. For each test, five blocks of the dataset were used with separate training and testing data. The first five steps of CRR estimation were implemented using the Java programming language, while the sixth step is implemented in Python (version 3.10) (training and classification). SVM and DT methods with default parameters (only gamma parameter auto for SVM was passed when creating the model) were implemented by using the scikit-learn (version 1.0.2) library. The results obtained are listed in the Table 4. Experiments were executed on the computer with Windows 10 operating system, Intel(R) Core(TM) i7-7500U CPU and 8 GB of RAM. The pseudocode depicting ML methods used can be seen in Figure 4.
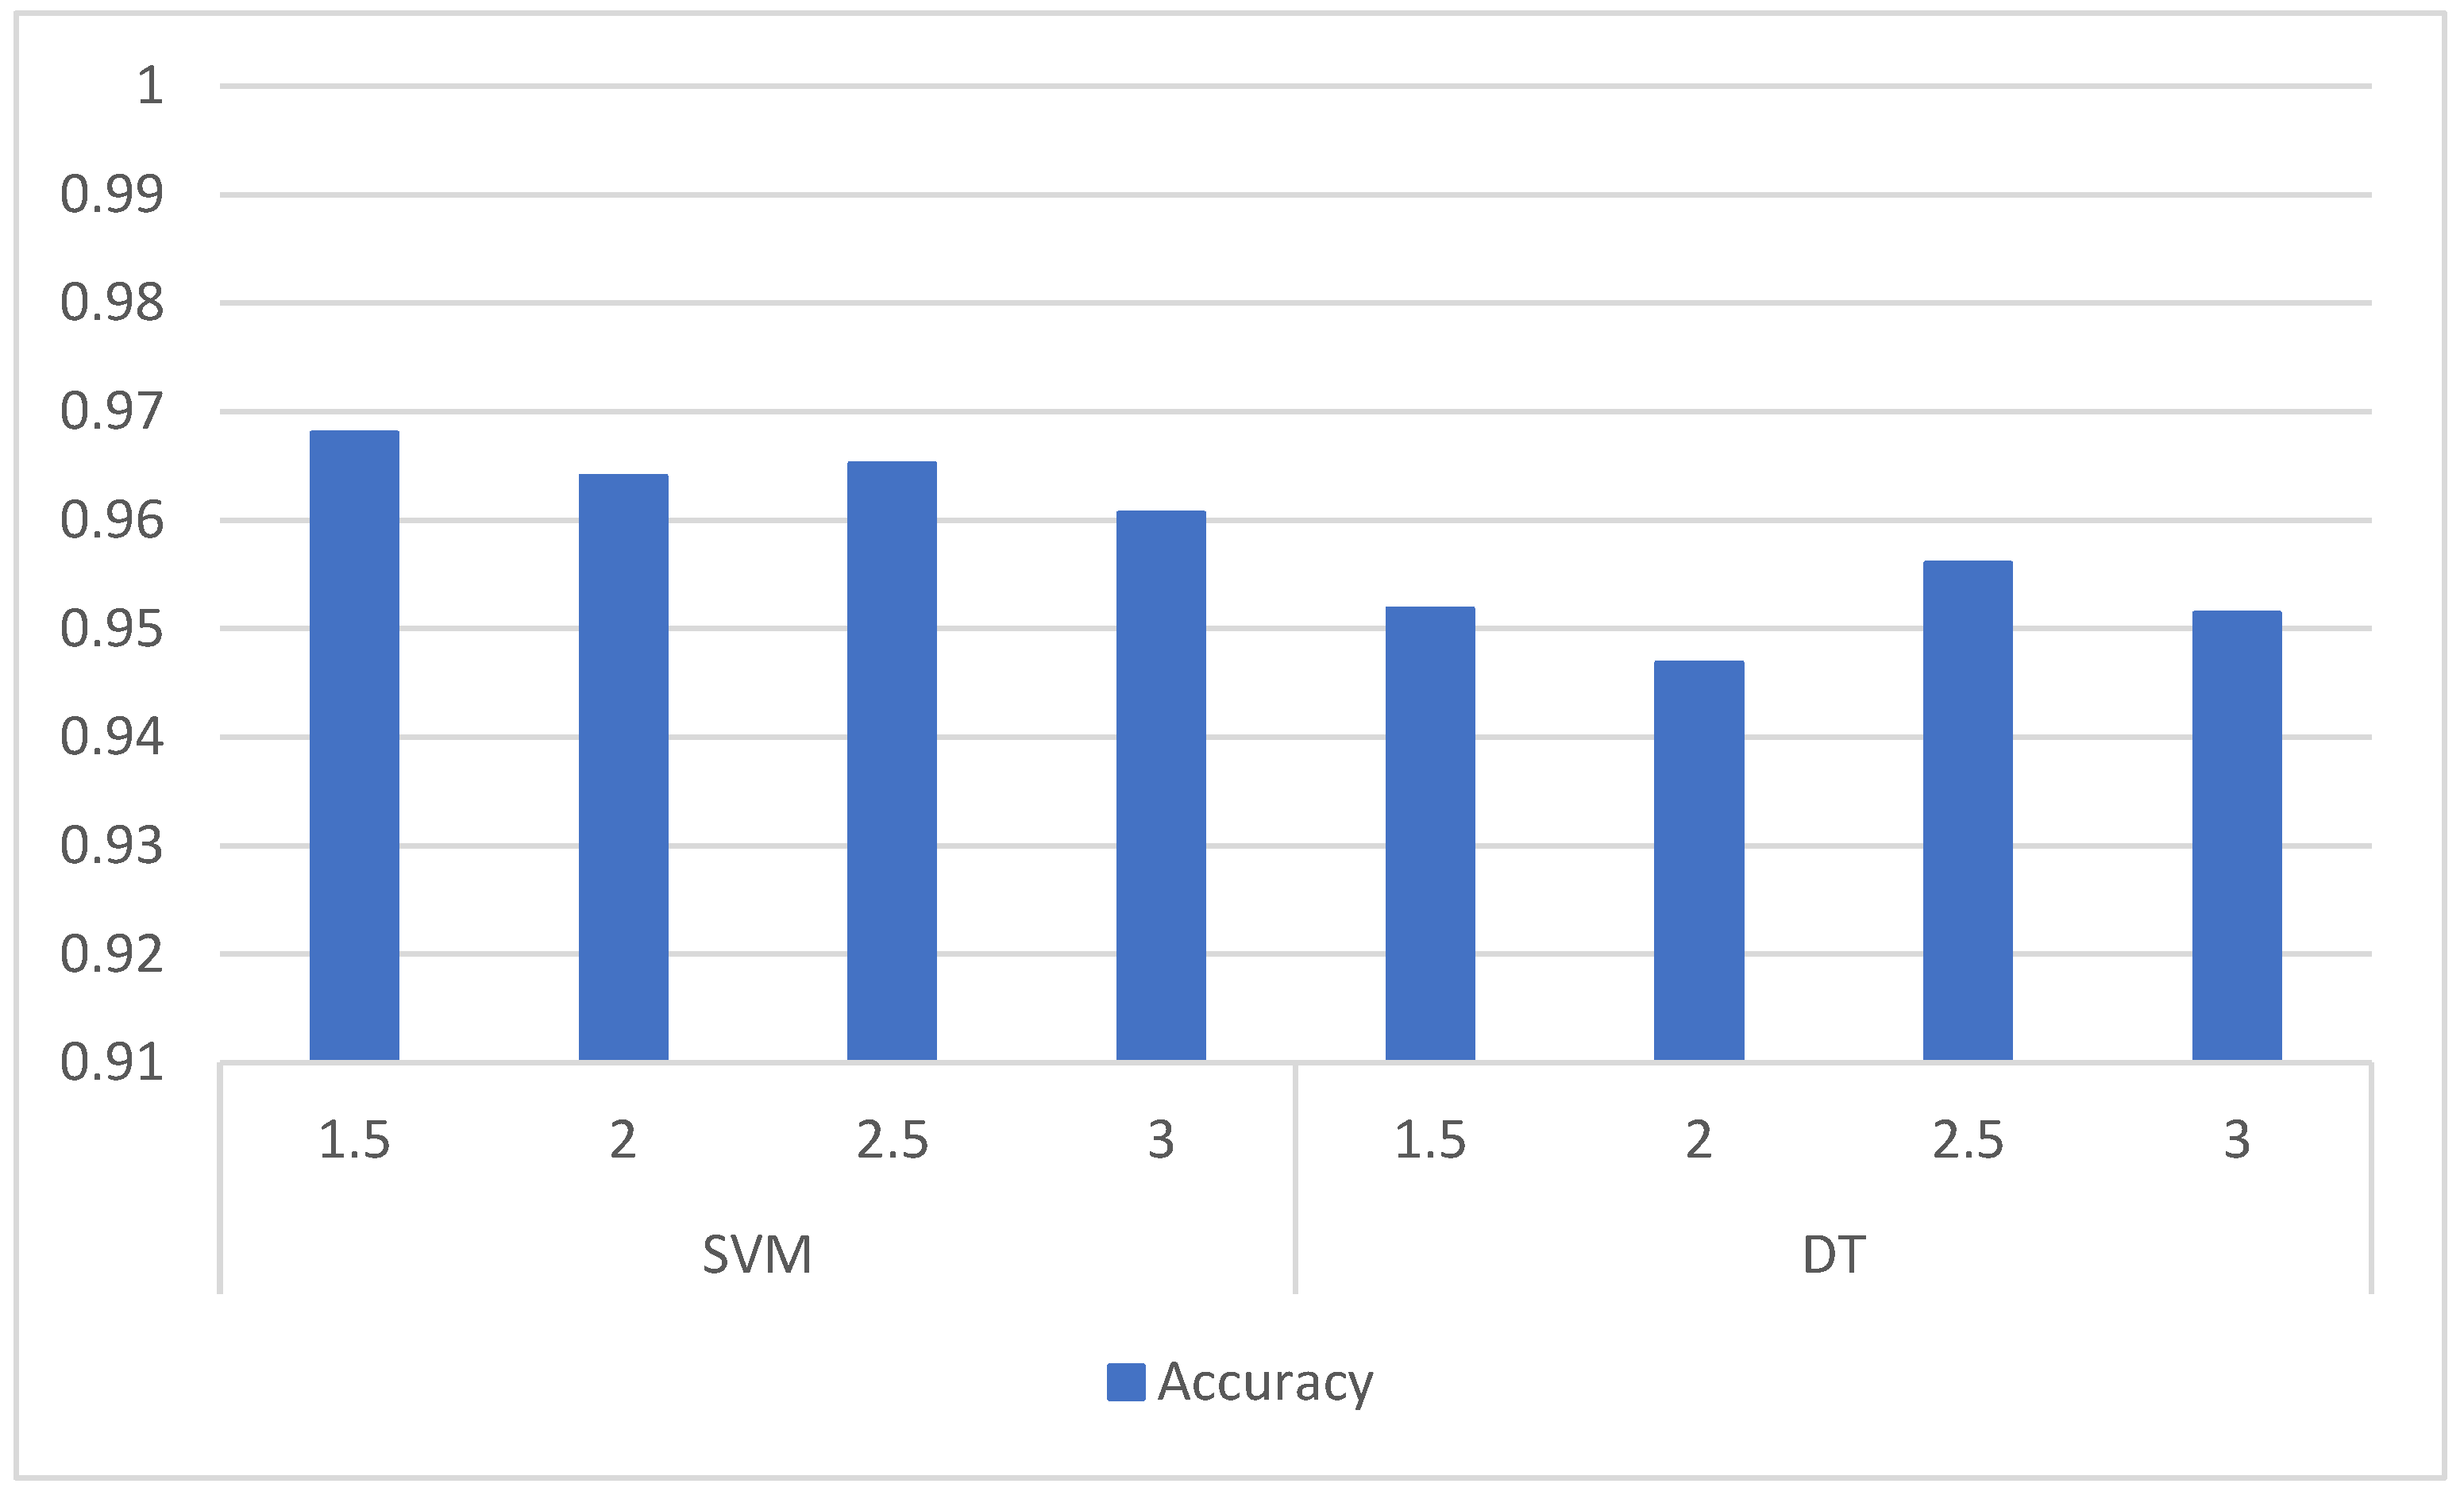
As shown in Table 5, the SVM classification algorithm was more efficient than the DT in this case, as the majority of the tests performed showed a lag of between one and four percent. No significant gap was observed between the same classification algorithms, with different CRRs, as the differences in the averages of all tests are only up to 2% accurate. Although the results are fairly homogeneous, the most efficient clustering method was found to be SVM with a CRR equal to 1.5.
Looking at the bar chart below (Figure 5), it can be seen that the classification accuracy of SVM decreased with the increase in the CRR to above 1.5 and was likely to decrease even further with an increase above 3.0. The tendencies for DT are not so clear, but this algorithm demonstrates worse results compared to SVM.
By filling in the confusion matrices of the SVM method for each CRR (Figure 6), it should be noted that the forecast errors increased with increasing CRR. For example, a dataset grouped with a CRR of 1.5 had the highest number of correct predictions that the sequence was clean, whereas the number of correct predictions decreased as the ratio increased.
With the most efficient CRR constant known, it was possible to fill in the risk score table according to the method proposed (see Table 6). In the completed table below, a base risk score of 4.25 was obtained because the AWSCTD dataset contained 4.25 times more malware than clean code function sequences. If the number of clean and malware entries were equal, the baseline riskiness would be 1. When the DRR is known, the proposed RV table is populated, where low-risk functions are those that are called by a clean code less than 4.25 times than the malware. As mentioned before, the ARR is determined by multiplying the DRR by the most efficient CRR, i.e., 4.25 multiplied by 1.5, and finally other system functions that are called more by malware have an FRR greater than the ARR and therefore are assigned with the high risk ratio.
Once the risk score table is populated, it is possible to perform grouping, i.e., to change the system functions according to the numerical equivalent of the risk score. The table below (Table 7) gives an example of how the system functions look for the risk score, calculating the required values. For example, for the system function NtQueryInformationFile.FileAllInformation, it was found that there were up to 1446 calls in the malware, but the clean code only called this system function 11 times. Therefore, dividing 1146 by 11 gives a frequency ratio of 104.18, which means that malware calls this system function 104.18 times more often. According to the risk scoring table, this system function has a high-risk score, as the system functions that are called 6.375 times more often by malware than by clean code are assigned a high-risk score. Similarly, medium, and low risk scores are determined for ratios less than 4.25 or between 4.25 and 6.375, respectively. If a system function is never called by clean code, it is set with a ratio of 1000, if it is never called by malicious code, the ratio is set to 0. These ratios are applied to the NtUserCountClipboardFormats and NtQueryDirectoryFile.FileDirectoryInformation functions, respectively. Examples are provided in Table 6.
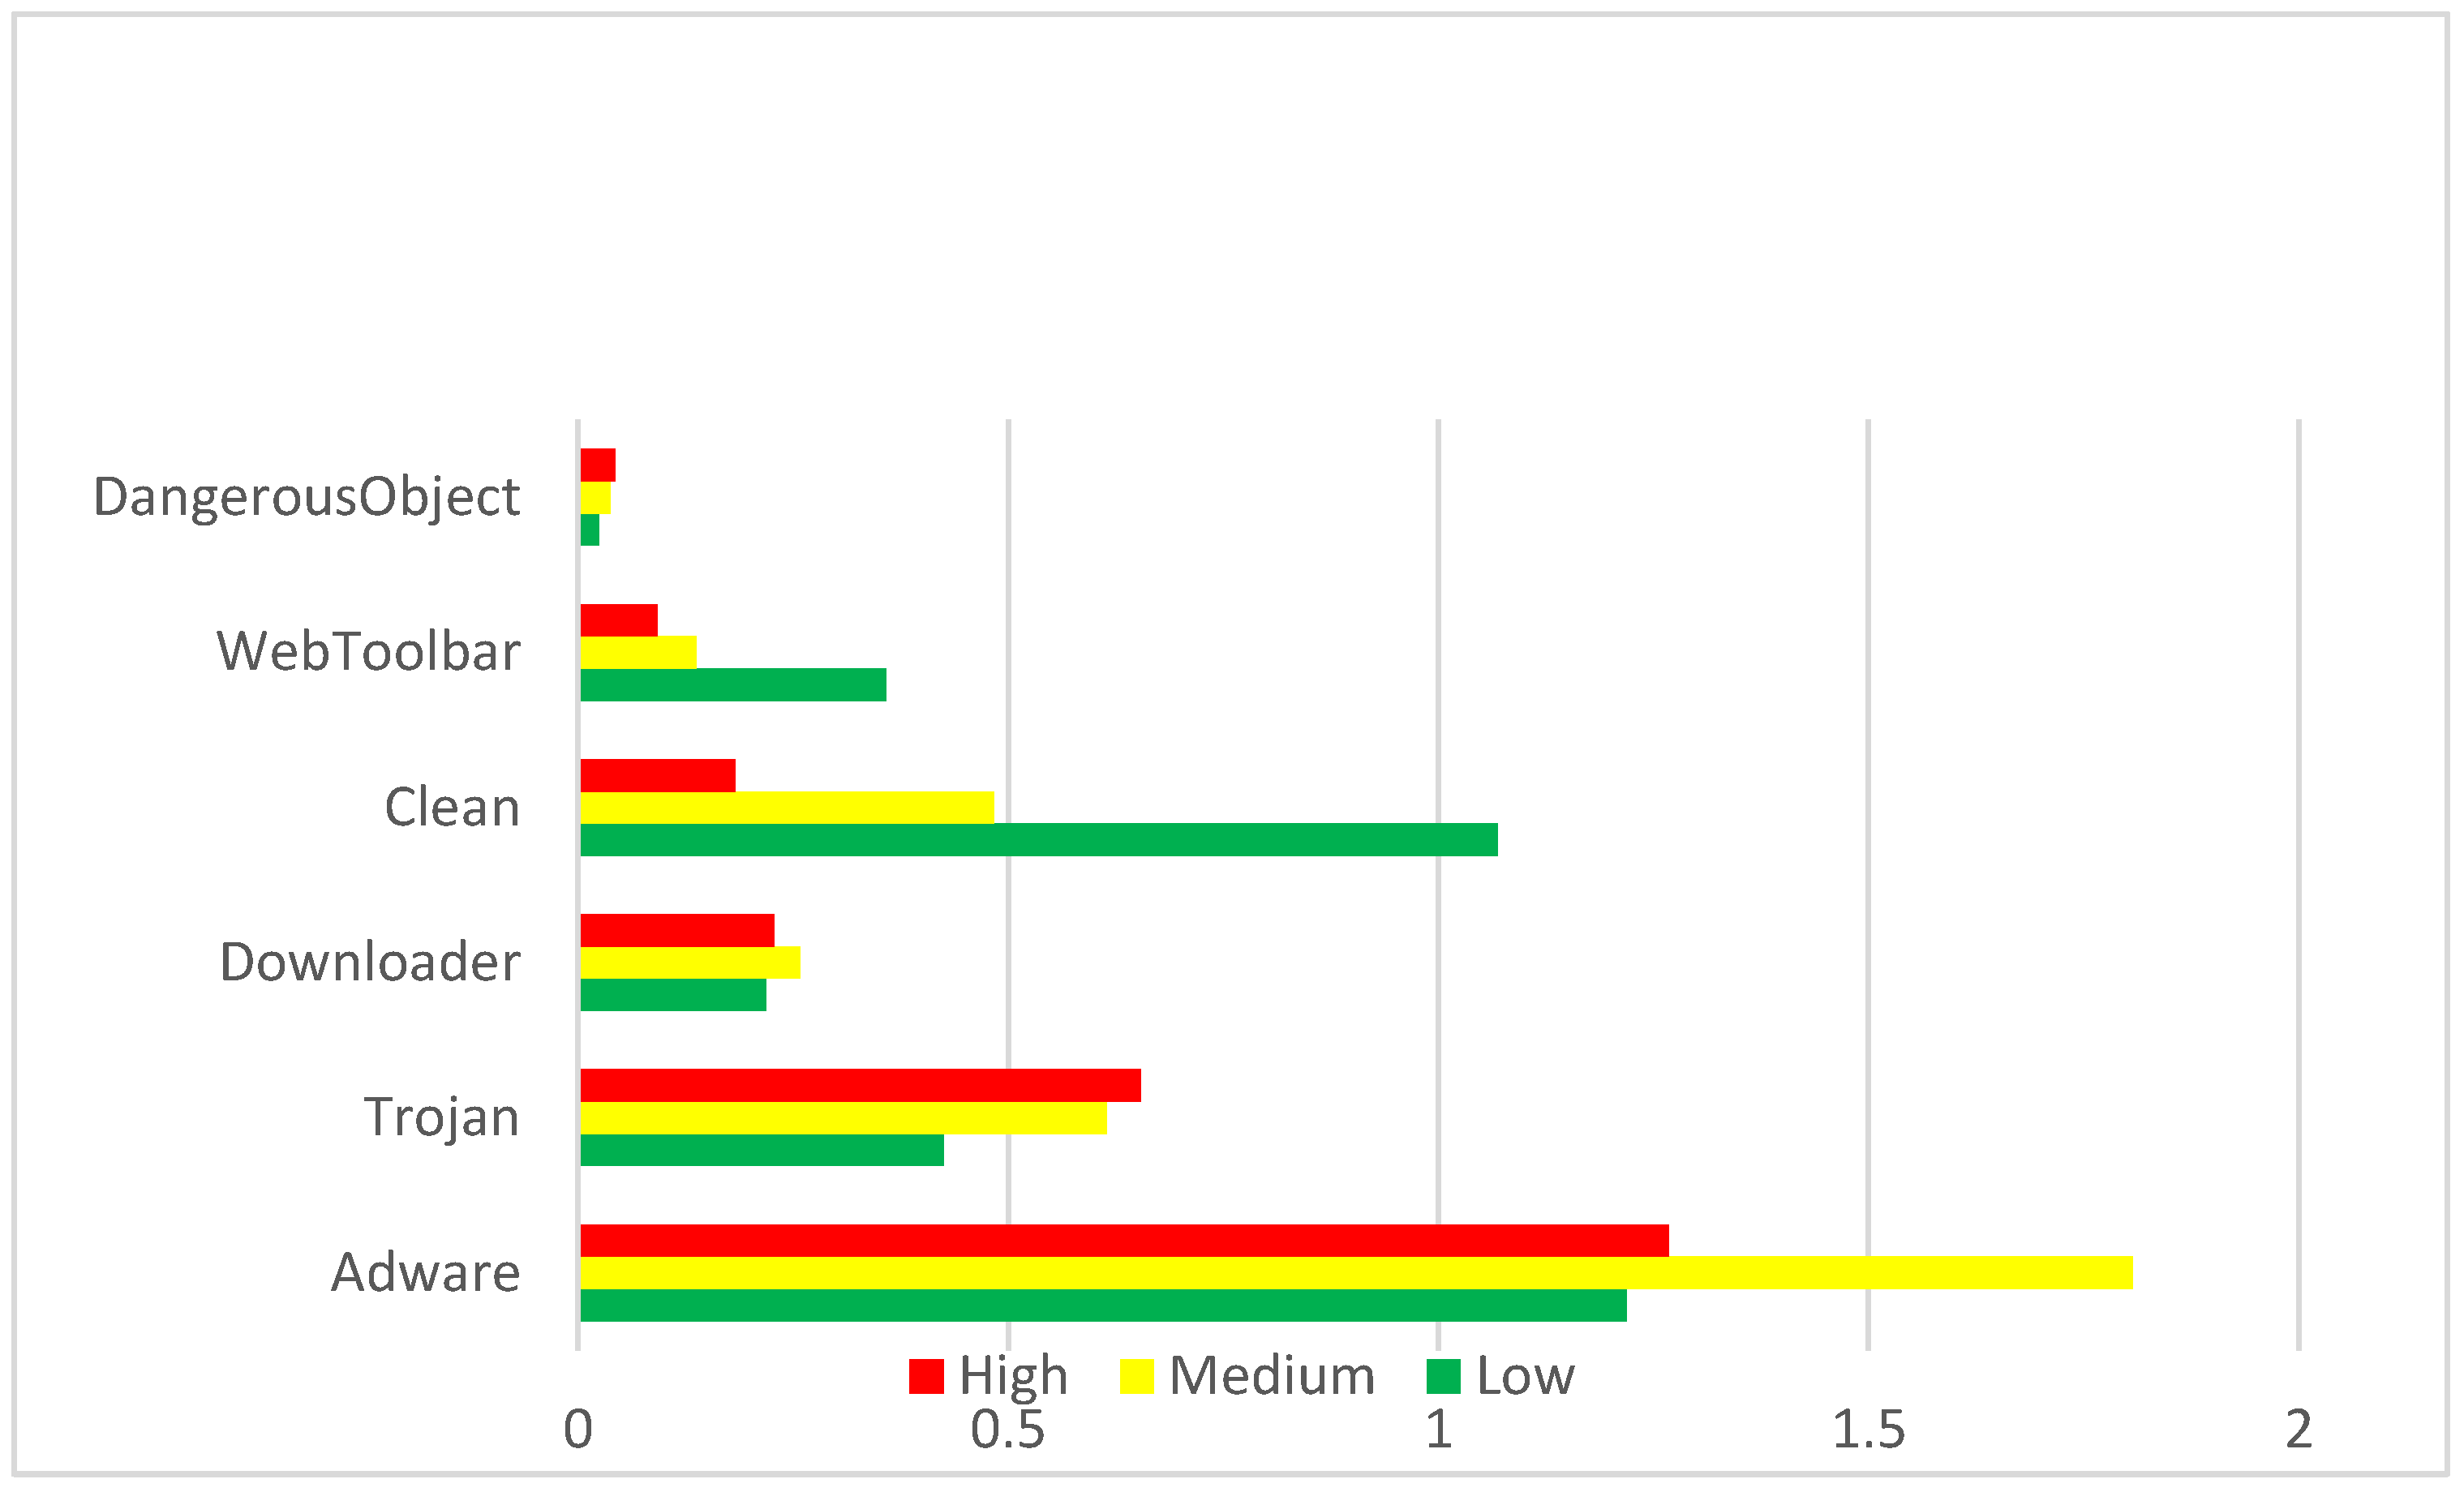
The risk score overview for different malware types is presented in Figure 7.
As can be seen from Figure 7, DangerousObject is the malware type that calls function sequences with the highest risk score (refer also to Table 8). It is 1.74 times more likely to call a high-risk function or 3.24 times more likely to call a medium- or high-risk function than a low-risk function. Trojan is the second most dangerous type of malware, and its resulting relationships are similar to those of DangerousObject. The clean code has a low-to-high-risk ratio of 0.17, which means that low-risk functions are 5.8 times more likely to call low-risk functions than high-risk functions. WebToolbar results are similar to the clean object, reflecting this malware type’s origin and relatively low impact. For more details on the resulting relationships between the indices and the total values, see the table below (Table 7).

4.2. Results of the Risk-Based Grouping on Malware Intrusion Detection by Machine Learning Methods

As the CRR constant of 1.5 was found to be the most efficient, its accuracy was compared to the efficiency of SVM and DT on the original dataset (Table 9). The data for the tests were acquired by the methods depicted in Figure 3; records from the original database were converted to the numerical values and converted by the method proposed with a CRR of 1.5.
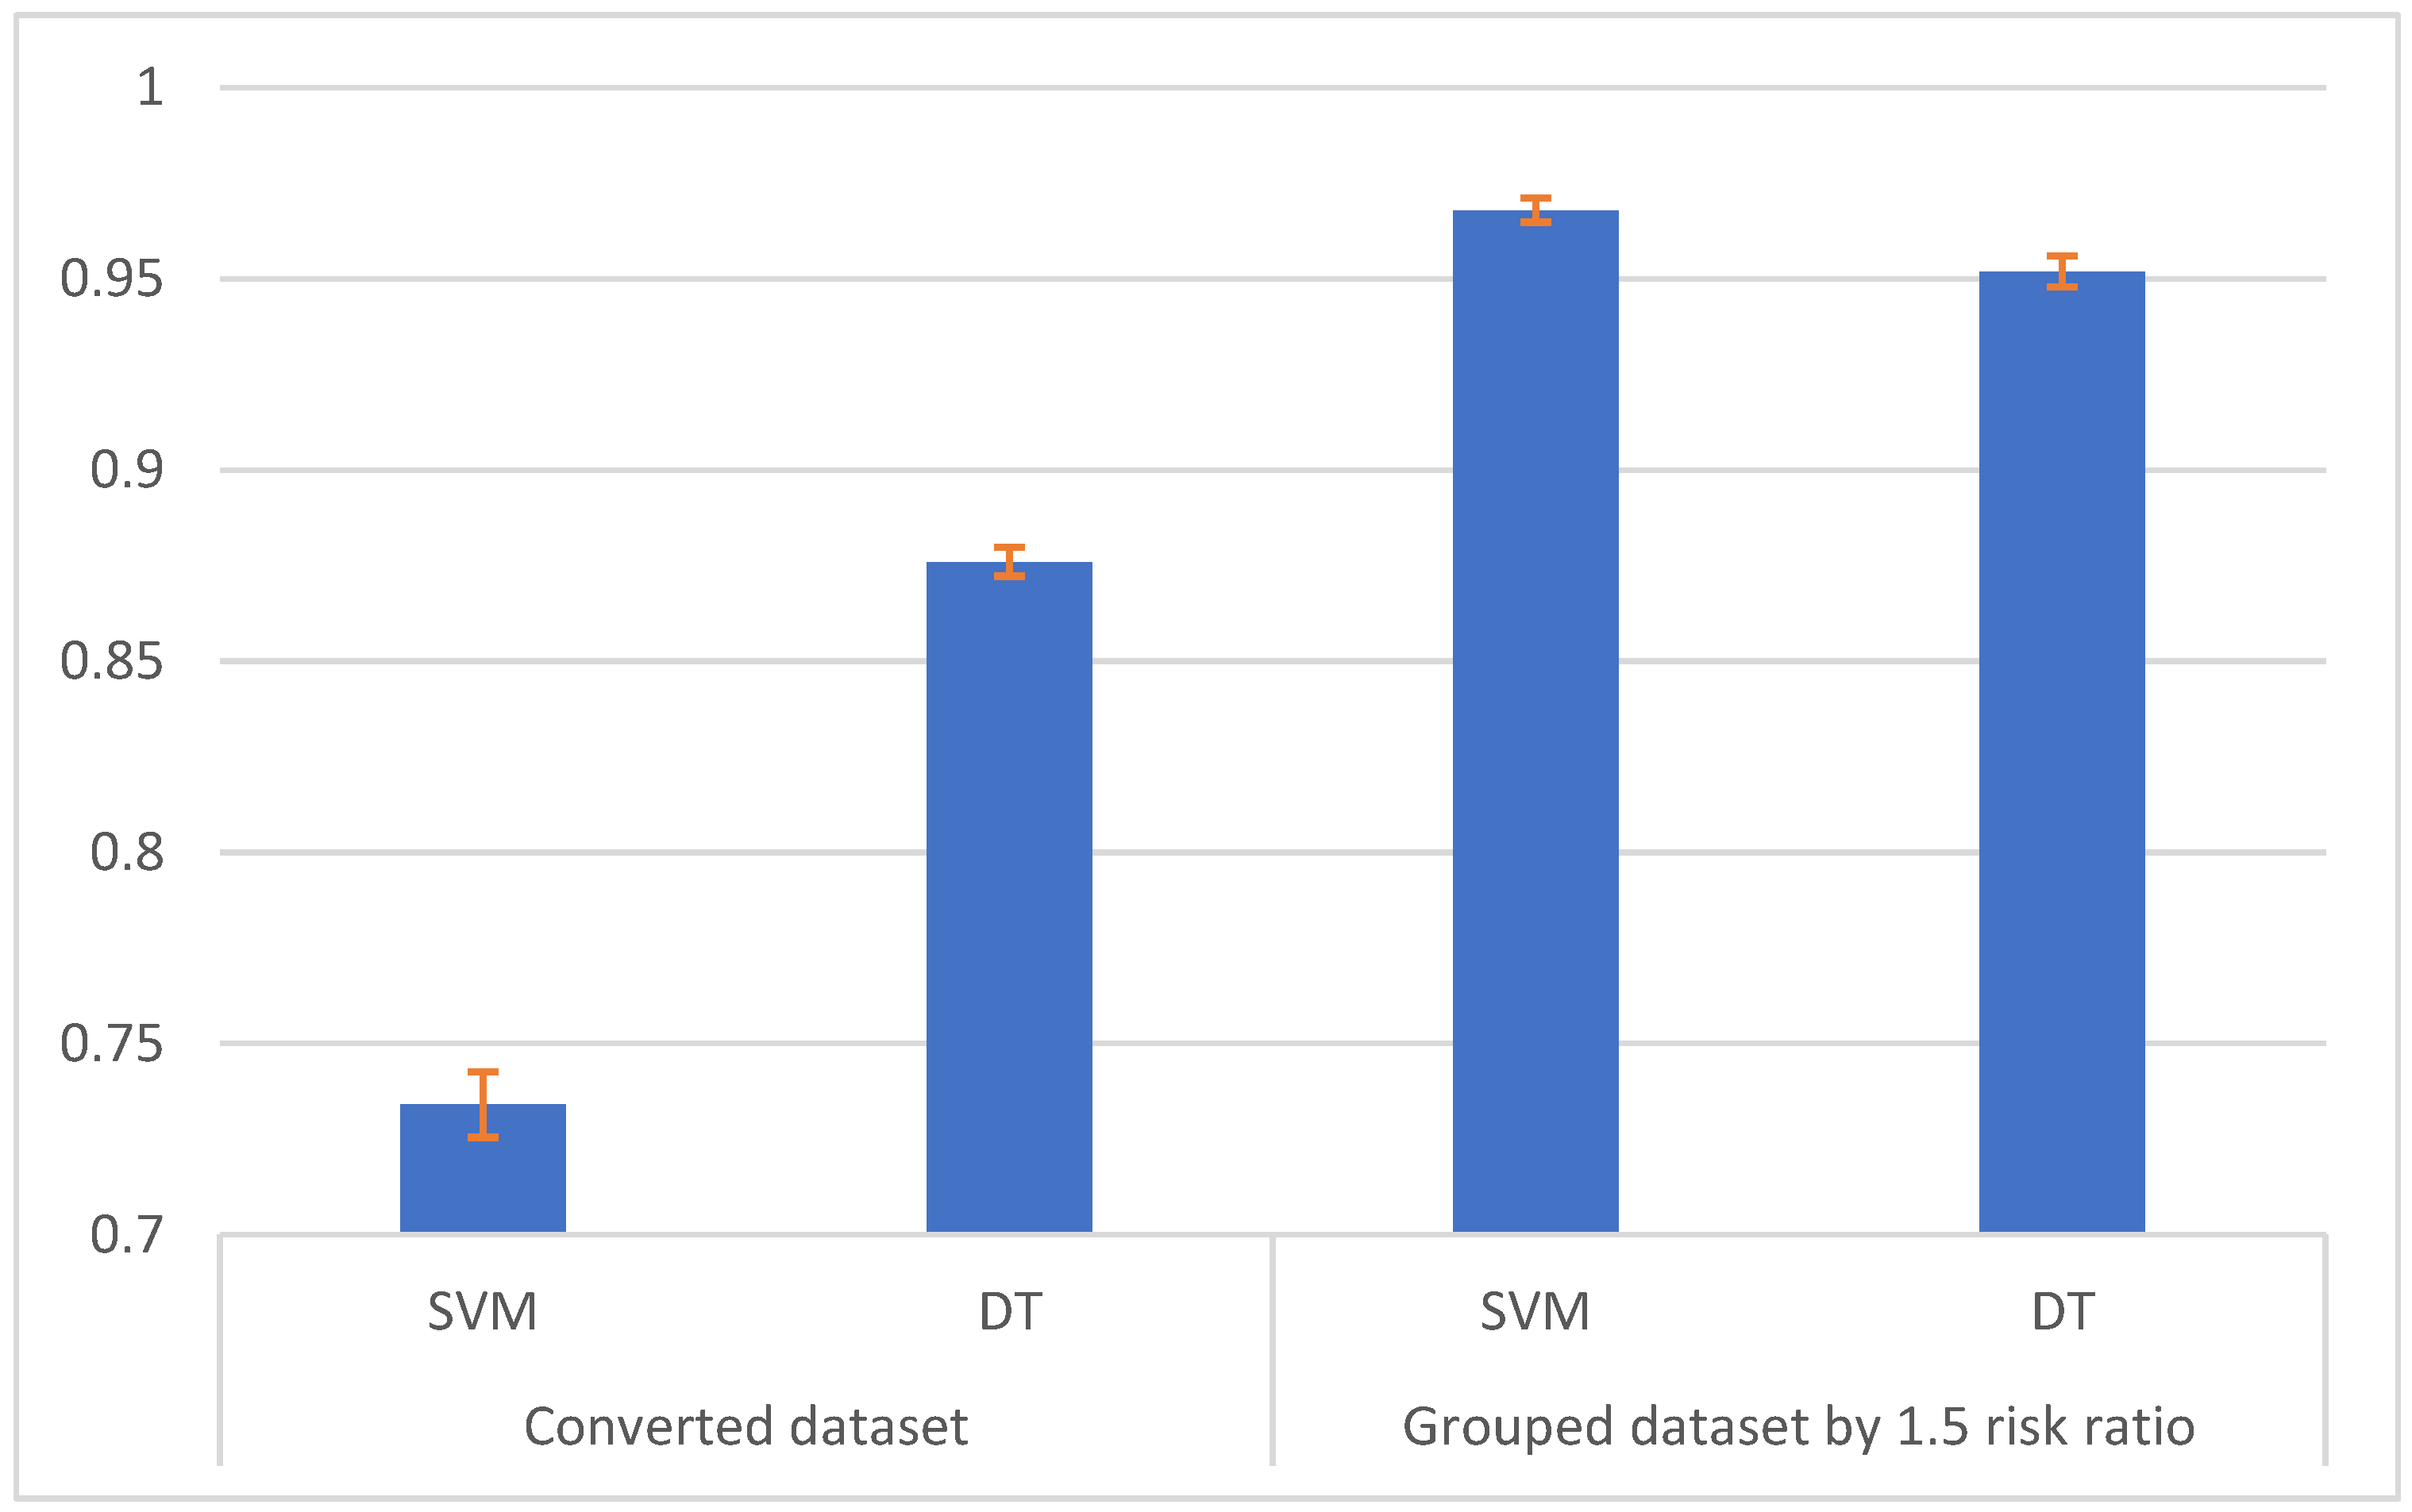
The comparison showed that the risk-based grouped dataset was classified with 23.4% higher accuracy by the SVM method and 7.6% higher accuracy by the DT method. That is, the dataset with risk values instead of just system-call names demonstrated drastically better results, especially for the SVM method, compared to the original dataset (Figure 8). The obtained values for SVM (96.8 percent) are relatively close to the DL method results (99.3 percent) that were achieved in our previous research [7].
Thus, the proposed risk-based system-call sequences grouping method can be seen as successful, ensuring use of lightweight machine learning methods for malware attack detection with accuracy comparable to deep learning methods.

5. Conclusions and Future Work

The analysis of the current situation in malware and intrusion detection has led to the proposal of a novel method for system-call grouping by function risk value. The method proposed should achieve promising results when simple ML methods are used. The following conclusions may be drawn:
  • The analysis performed demonstrates the continued need for malware intrusion detection at the host level using anomaly-based approaches, that are currently mainly based on training machine learning methods using system-call sequences. It was also noted that it is necessary to increase malware detection accuracy as well as to find ways for using lightweight ML methods for practical applications. The literature review showed that sequence-call grouping may be seen as a prospective method for this task. It was also decided to use AWSCTD in combination with SVM and DT methods as the most prospective for further experiments.
  • The risk-based system-call sequence grouping method was proposed, that assigns riskiness values from low to high to all functions, based on the function risk value (FRR) and database risk value (DRR), calculated based on the function call statistics for malicious and benign software. The clustering risk ratio constant (CRR) equal to 1.5 was experimentally determined.
  • Application of the proposed method to the AWSCTD dataset resulted in classification accuracies of 96.8% (SVM) and 87.6% (DT), while the original dataset was classified with an accuracy of 87.6% (SVM) and 73.4% (DT). Hence, the application of the newly proposed clustering method improved the classification accuracy by 23.4% and 7.6% of the SVM and DT methods, respectively. The results obtained recommend the use of lightweight machine learning methods for malware attack detection with an accuracy comparable to DL methods.
  • The findings of this research show promising results and encourage us to apply them to even more sophisticated machine learning models. Future work will be to combine the proposed grouping method with DL models. Furthermore, malware image-generation methods for graphical pattern analysis could also benefit from our findings on system-call grouping.

Author Contributions

Conceptualization, D.Č. and T.V.; methodology, D.Č.; software, T.V.; validation, D.Č., N.G. and A.Č.; formal analysis, N.G.; investigation, T.V.; resources, D.Č.; data curation, D.Č.; writing—original draft preparation, D.Č.; writing—review and editing, N.G.; visualization, T.V.; supervision, A.Č. All authors have read and agreed to the published version of the manuscript.

Funding

This research received no external funding.

Data Availability Statement

The data presented in this study are openly available and can be found here: https://github.com/DjPasco/AWSCTD (accessed on 29 December 2023).

Conflicts of Interest

The authors declare no conflicts of interest.

References

  1. Serinelli, B.M.; Collen, A.; Nijdam, N.A. Training Guidance with KDD Cup 1999 and NSL-KDD Data Sets of ANIDINR: Anomaly-Based Network Intrusion Detection System. Procedia Comput. Sci. 2020, 175, 560–565. [Google Scholar] [CrossRef]
  2. Hay, A.; Cid, D.; Bary, R.; Northcutt, S. System Integrity Check and Rootkit Detection. In OSSEC Host-Based Intrusion Detection Guide; Elsevier: Amsterdam, The Netherlands, 2008; pp. 149–174. ISBN 9781597492409. [Google Scholar]
  3. Efe, A.; Abaci, İ.N. Comparison of the Host Based Intrusion Detection Systems and Network Based Intrusion Detection Systems. Celal Bayar Üniversitesi Fen Bilim. Derg. 2022, 18, 23–32. [Google Scholar] [CrossRef]
  4. Patil, A.S.; Patil, D.R. Post-Attack Intrusion Detection Using Log Files Analysis. Int. J. Comput. Appl. 2015, 127, 19–21. [Google Scholar] [CrossRef]
  5. García-Teodoro, P.; Díaz-Verdejo, J.; Maciá-Fernández, G.; Vázquez, E.; Garcia-Teodoro, P.; Diaz-Verdejo, J.; Macia-Fernandez, G.; Vazquez, E. Anomaly-Based Network Intrusion Detection: Techniques, Systems and Challenges. Comput. Secur. 2009, 28, 18–28. [Google Scholar] [CrossRef]
  6. Le, T.T.H.; Kim, Y.; Kim, H. Network Intrusion Detection Based on Novel Feature Selection Model and Various Recurrent Neural Networks. Appl. Sci. 2019, 9, 1392. [Google Scholar] [CrossRef]
  7. Čeponis, D.; Goranin, N. Investigation of Dual-Flow Deep Learning Models LSTM-FCN and GRU-FCN Efficiency against Single-Flow CNN Models for the Host-Based Intrusion and Malware Detection Task on Univariate Times Series Data. Appl. Sci. 2020, 10, 2373. [Google Scholar] [CrossRef]
  8. Pailoor, S.; Wang, X.; Shacham, H.; Dillig, I. Automated Policy Synthesis for System Call Sandboxing. Proc. ACM Program. Lang. 2020, 4, 135. [Google Scholar] [CrossRef]
  9. Peddoju, S.K.; Upadhyay, H.; Soni, J.; Prabakar, N. Natural Language Processing Based Anomalous System Call Sequences Detection with Virtual Memory Introspection. Int. J. Adv. Comput. Sci. Appl. 2020, 11, 455–460. [Google Scholar] [CrossRef]
  10. Hu, Z.; Liu, L.; Yu, H.; Yu, X. Using Graph Representation in Host-Based Intrusion Detection. Secur. Commun. Netw. 2021, 2021, 6291276. [Google Scholar] [CrossRef]
  11. Van Mieghem, V. Detecting Malicious Behaviour Using System Calls. Master’s Thesis, Delft University, Delft, The Netherlands, 2016. [Google Scholar]
  12. Yosifovich, P. Windows 10 System Programming, Part 1; Independently: Wroclaw, Poland, 2019; ISBN 979-8634170381. [Google Scholar]
  13. Mora-Gimeno, F.J.; Mora-Mora, H.; Volckaert, B.; Atrey, A. Intrusion Detection System Based on Integrated System Calls Graph and Neural Networks. IEEE Access 2021, 9, 9822–9833. [Google Scholar] [CrossRef]
  14. Statcounter. GlobalStats Desktop Operating System Market Share Worldwide. Available online: https://gs.statcounter.com/os-market-share (accessed on 15 September 2023).
  15. Jain, J.K.; Waoo, A.A. An Artificial Neural Network Technique for Prediction of Cyber-Attack Using Intrusion Detection System. J. Artif. Intell. Mach. Learn. Neural Netw. 2023, 3, 33–42. [Google Scholar] [CrossRef]
  16. Lopez-Martin, M.; Carro, B.; Sanchez-Esguevillas, A.; Lloret, J. Conditional Variational Autoencoder for Prediction and Feature Recovery Applied to Intrusion Detection in IoT. Sensors 2017, 17, 1967. [Google Scholar] [CrossRef] [PubMed]
  17. Lodhi, M.B.; Richhariya, V.; Parmar, M. A Survey on Data Mining Based Intrusion Detection Systems. Int. J. Comput. Netw. Commun. Secur. 2014, 2, 485–490. [Google Scholar] [CrossRef]
  18. Maleh, Y.; Ezzati, A.; Qasmaoui, Y.; Mbida, M. A Global Hybrid Intrusion Detection System for Wireless Sensor Networks. Procedia Comput. Sci. 2015, 52, 1047–1052. [Google Scholar] [CrossRef]
  19. Zhang, H.; Luo, S.; Zhang, Y.; Pan, L. An Efficient Android Malware Detection System Based on Method-Level Behavioral Semantic Analysis. IEEE Access 2019, 7, 69246–69256. [Google Scholar] [CrossRef]
  20. Kim, J.; Ban, Y.; Ko, E.; Cho, H.; Yi, J.H. MAPAS: A Practical Deep Learning-Based Android Malware Detection System. Int. J. Inf. Secur. 2022, 21, 725–738. [Google Scholar] [CrossRef]
  21. Demirkıran, F.; Çayır, A.; Ünal, U.; Dağ, H. An Ensemble of Pre-Trained Transformer Models for Imbalanced Multiclass Malware Classification. Comput. Secur. 2022, 121, 102846. [Google Scholar] [CrossRef]
  22. Dounavi, H.M.; Mpanti, A.; Nikolopoulos, S.D.; Polenakis, I. A Graph-Based Framework for Malicious Software Detection and Classification Utilizing Temporal-Graphs. J. Comput. Secur. 2021, 29, 651–688. [Google Scholar] [CrossRef]
  23. Amamra, A.; Robert, J.M.; Abraham, A.; Talhi, C. Generative versus Discriminative Classifiers for Android Anomaly-Based Detection System Using System Calls Filtering and Abstraction Process. Secur. Commun. Netw. 2016, 9, 3483–3495. [Google Scholar] [CrossRef]
  24. Riesco, M.; Fondón, M.D.; Álvarez, D. Using Graphviz as a Low-Cost Option to Facilitate the Understanding of Unix Process System Calls. Electron. Notes Theor. Comput. Sci. 2009, 224, 89–95. [Google Scholar] [CrossRef]
  25. Trinius, P.; Holz, T.; Göbel, J.; Freiling, F.C. Visual Analysis of Malware Behavior Using Treemaps and Thread Graphs. In Proceedings of the 2009 6th International Workshop on Visualization for Cyber Security, VizSec 2009—Proceedings, Atlantic City, NJ, USA, 11 October 2009. [Google Scholar]
  26. Shaid, S.Z.M.; Maarof, M.A. Malware Behaviour Visualization. J. Teknol. 2014, 70, 25–33. [Google Scholar] [CrossRef]
  27. Kishore, P.; Barisal, S.K.; Mohapatra, D.P. An Incremental Malware Detection Model for Meta-Feature API and System Call Sequence. In Proceedings of the 2020 15th Conference on Computer Science and Information Systems, FedCSIS, Sofia, Bulgaria, 6–9 September 2020. [Google Scholar]
  28. Gaurav, A.; Gupta, B.B.; Panigrahi, P.K. A Comprehensive Survey on Machine Learning Approaches for Malware Detection in IoT-Based Enterprise Information System. Enterp. Inf. Syst. 2023, 17, 2023764. [Google Scholar] [CrossRef]
  29. Khraisat, A.; Gondal, I.; Vamplew, P.; Kamruzzaman, J.; Alazab, A. Hybrid Intrusion Detection System Based on the Stacking Ensemble of C5 Decision Tree Classifier and One Class Support Vector Machine. Electronics 2020, 9, 173. [Google Scholar] [CrossRef]
  30. Ajayi, O.; Gangopadhyay, A.; Erbacher, R.F.; Bursat, C. Developing Cross-Domain Host-Based Intrusion Detection. Electronics 2022, 11, 3631. [Google Scholar] [CrossRef]
  31. Ajayi, O.; Gangopadhyay, A. DAHID: Domain Adaptive Host-Based Intrusion Detection. In Proceedings of the Proceedings of the 2021 IEEE International Conference on Cyber Security and Resilience, CSR 2021, Rhodes, Greece, 26–28 July 2021. [Google Scholar]
  32. Čeponis, D.; Goranin, N. Evaluation of Deep Learning Methods Efficiency for Malicious and Benign System Calls Classification on the AWSCTD. Secur. Commun. Netw. 2019, 2019, 2317976. [Google Scholar] [CrossRef]
  33. Goranin, N.; Čeponis, D. Investigation of AWSCTD Dataset Applicability for Malware Type Classification. Int. Sci. J. Secur. Future 2018, 2, 186–189. [Google Scholar]
  34. Brugger, T. KDD Cup’99 Dataset (Network Intrusion) Considered Harmful. Available online: https://www.kdnuggets.com/news/2007/n18/4i.html (accessed on 15 September 2023).
  35. Lippmann, R.P.; Fried, D.J.; Graf, I.; Haines, J.W.; Kendall, K.R.; McClung, D.; Weber, D.; Webster, S.E.; Wyschogrod, D.; Cunningham, R.K.; et al. Evaluating Intrusion Detection Systems without Attacking Your Friends: The 1998 DARPA Intrusion Detection Evaluation. In Proceedings of the DARPA Information Survivability Conference and Exposition. DISCEX ’00, Hilton Head, SC, USA, 25–27 January 2000; Volume 2, pp. 12–26. [Google Scholar] [CrossRef]
  36. Ajayi, O. Developing Cross-Domain Intrusion Detection Systems. Doctoral Dissertation, University of Maryland, Baltimore, MD, USA, 2022. [Google Scholar]
  37. Liu, H.; Lang, B. Machine Learning and Deep Learning Methods for Intrusion Detection Systems: A Survey. Appl. Sci. 2019, 9, 4396. [Google Scholar] [CrossRef]
  38. Creech, G.; Hu, J. A Semantic Approach to Host-Based Intrusion Detection Systems Using Contiguous and Discontiguous System Call Patterns. IEEE Trans. Comput. 2014, 63, 807–819. [Google Scholar] [CrossRef]
  39. Haider, W.; Creech, G.; Xie, Y.; Hu, J. Windows Based Data Sets for Evaluation of Robustness of Host Based Intrusion Detection Systems (IDS) to Zero-Day and Stealth Attacks. Future Internet 2016, 8, 29. [Google Scholar] [CrossRef]
  40. Murtaza, S.S.; Khreich, W.; Hamou-Lhadj, A.; Couture, M. A Host-Based Anomaly Detection Approach by Representing System Calls as States of Kernel Modules. In Proceedings of the 2013 IEEE 24th International Symposium on Software Reliability Engineering (ISSRE), Pasadena, CA, USA, 4–7 November 2013; IEEE: Piscataway, NJ, USA, 2013; pp. 431–440. [Google Scholar]
  41. Berlin, K.; Slater, D.; Saxe, J. Malicious Behavior Detection Using Windows Audit Logs. In Proceedings of the 8th ACM Workshop on Artificial Intelligence and Security—AISec ’15, Denver, CO, USA, 16 October 2015; pp. 35–44. [Google Scholar] [CrossRef]
  42. Ronen, R.; Feuerstein, C. Microsoft Malware Classification Challenge (BIG 2015)|Kaggle. Available online: https://www.kaggle.com/c/malware-classification/overview (accessed on 4 June 2020).
  43. Kolosnjaji, B.; Zarras, A.; Webster, G.; Eckert, C. Deep Learning for Classification of Malware System Call Sequences. In Lecture Notes in Computer Science (Including Subseries Lecture Notes in Artificial Intelligence and Lecture Notes in Bioinformatics); LNAI; Springer: Cham, Switzerland, 2016; Volume 9992, pp. 137–149. ISBN 9783319501260. [Google Scholar]
  44. Haider, W.; Hu, J.; Slay, J.; Turnbull, B.P.; Xie, Y. Generating Realistic Intrusion Detection System Dataset Based on Fuzzy Qualitative Modeling. J. Netw. Comput. Appl. 2017, 87, 185–192. [Google Scholar] [CrossRef]
  45. Sharafaldin, I.; Lashkari, A.H.; Ghorbani, A.A. Toward Generating a New Intrusion Detection Dataset and Intrusion Traffic Characterization. In Proceedings of the 4th International Conference on Information Systems Security and Privacy—ICISSP 2018, Funchal, Portugal, 22–24 January 2018; pp. 108–116. [Google Scholar] [CrossRef]
  46. Catak, F.O.; Yazı, A.F. A Benchmark API Call Dataset for Windows PE Malware Classification. arXiv 2019, arXiv:1905.01999. [Google Scholar]
  47. Čeponis, D.; Goranin, N. Towards a Robust Method of Dataset Generation of Malicious Activity for Anomaly-Based HIDS Training and Presentation of AWSCTD Dataset. Balt. J. Mod. Comput. 2018, 6, 217–234. [Google Scholar] [CrossRef]
  48. Zhang, Y. New Advances in Machine Learning; IntechOpen: London, UK, 2012. [Google Scholar]
  49. Fawcett, T. An Introduction to ROC Analysis. IRBM 2005, 35, 299–309. [Google Scholar] [CrossRef]
  50. Derczynski, L. Complementarity, F-Score, and NLP Evaluation. In Proceedings of the 10th International Conference on Language Resources and Evaluation, LREC 2016, Portorož, Slovenia, 1 May 2016. [Google Scholar]
Figure 1. Activity diagram of proposed system-call grouping method.
Electronics 13 00206 g001
Figure 2. Sample of method application.
Electronics 13 00206 g002
Figure 3. Process for converting grouped data to converted data comparison.
Electronics 13 00206 g003
Figure 4. Pseudocode for ML methods.
Electronics 13 00206 g004
Figure 5. Accuracy of classification of different CRRs (sensitivity analysis).
Electronics 13 00206 g005
Figure 6. Confusion matrices for different risk ratios with SVM method.
Electronics 13 00206 g006
Figure 7. Distribution of risk scores for function sequence types.
Electronics 13 00206 g007
Figure 8. Accuracy results for converted dataset and grouped dataset by 1.5 CRR.
Electronics 13 00206 g008
Table 1. Comparison of the system-call grouping methods.
MethodDescription Limitations
Temporal graphs [22]Discusses the utilization of temporal graphs of system-call group relations for malicious software detection and classification.Only model presented without any experimental results.
Graphical representation of system calls [24]Method uses visualization of the relationships between different system calls.More suitable for representing application workflow.
Color map for system calls [11]Proposed to collect sequences of system functions from malware samples and map them to color heat maps.Method maps the system functions of several processes and does not map just one malware sample, but the system functions called by many applications and their processes.
Tree map algorithm [25]The authors collected the dataset and visualized the functions’ actions using a tree map algorithm.The authors did not specify how the image creation was performed (actual grouping algorithm).
Grouping by maliciousness [26]The authors proposed to group Windows API functions according to their level of maliciousness, from non-malicious to very malicious.There is no indication of how the author has grouped or determined the riskiness of each function and its effectiveness.
Table 2. HIDS-related datasets that are not suitable for our research.
DatasetYearOperating SystemNotes
FirefoxDS [40]2013LinuxSystem calls of Firefox application under attack are collected.
Berlin et al. [41]2015WindowsWindows audit log from malware was collected. No system-call information. System calls not mentioned directly in the research and collected dataset is not public.
Big 2015 [42]2015WindowsCollected static Windows PE executables information.
Kolosnjaji et al. [43]2016WindowsCollected system calls of malware samples. Dataset is private and contained only system calls without additional data (e.g., parameters and return values)
NGIDS-DS [44]2017LinuxSynthetically created dataset. Contains HIDS- and NIDS-related data. HIDS data contains only Linux machine information.
CSE-CICIDS2018 [45]2018Linux and WindowsMain scope of dataset—network-related data. Host-based data only presented, but not used in any experiments.
Mal-API-2019 [46]2019WindowsDataset contains malware-generated API calls. Collected system calls have no information about passed parameters and return values.
Table 3. Comparison of the ADFA-IDS dataset with AWSCTD [47].
DatasetNumber of Malware Samples ExecutedNumber of Accumulated System-Call Records
ADFA-IDS156636
AWSCTD10,276112.56 million
Table 4. RV table for determining the risk score for a system call.
RV Determination MarginsRisk Score (Low, Medium, High)Numerical Equivalent of the Risk Score
FRR equal to or lower than the DRRLow−1
FRR more than DRR and less than or equal to ARR.Medium0
Risk ratio above the ARRHigh1
Table 5. RV table for determining the risk score for a system call. The best results of classification are marked by a green background (darker green represents better results).
CRR1.52.02.53.0
ModelSVMDTSVMDTSVMDTSVMDT
Accuracy0.9680.95180.9640.94680.96520.9560.96060.9514
Precision0.9770.9690.9750.9660.9720.9720.9680.970
Recall0.9830.9670.9830.9670.9840.9710.9830.970
F score0.9840.9690.9790.9670.9780.9710.9760.970
Error rate0.0310.0490.0330.0520.0340.0450.0380.046
Table 6. RV table for determined risk score margins.
RV Determination MarginsRisk ScoreNumerical Equivalent of the Risk Score
FRR up to or equal to 4.25Low−1
FRR more than 4.25 and less than or equal to 6.375Medium0
FRR more than 6.375High1
Table 7. Example of riskiness of system functions.
System FunctionNumber of Calls in MalwareNumber of Calls in Benign ApplicationsFrequency RatioIdentified Riskiness (High, Medium, Low)
NtUserCountClipboardFormats101000High
NtQueryInformationFile.FileAllInformation114611104.18High
NtUserBeginPaint111186.16Medium
NtClose887,425145,6926.09Medium
NtUserGetKeyboardLayoutList7571804.2Low
NtQueryDirectoryFile.FileDirectoryInformation0750Low
Table 8. Risk score ratios for function sequence types. The color grading explanation (from theworst to better results): dark red, light red, orange, yellow, light green, dark green.
Ratio between the Number of High and Low Risk Score FunctionsRatio between the Number of High, Medium and Low Risk Score Functions
All ValuesPeak Values in Each IndexAll ValuesPeak Values in Each Index
Adware1.041.862.523.75
Trojan1.542.642.983.62
Downloader1.042.572.233.22
Clean0.170.030.620.03
WebToolbar0.260.320.640.49
DangerousObject1.742.523.273.53
Table 9. Comparison of the accuracy of the original and grouped datasets. The color grading explanation (from worst results to better): red, yellow, light green, dark green.
Original DatasetGrouped Dataset with 1.5 CRR
AlgorithmSVMDTSVMDT
Test 10.7290.8730.9740.956
Test 20.7280.8720.9670.956
Test 30.7350.8750.9650.947
Test 40.7300.8820.9660.947
Test 50.7510.8790.9680.953
Average0.7340.8760.9680.952
Disclaimer/Publisher’s Note: The statements, opinions and data contained in all publications are solely those of the individual author(s) and contributor(s) and not of MDPI and/or the editor(s). MDPI and/or the editor(s) disclaim responsibility for any injury to people or property resulting from any ideas, methods, instructions or products referred to in the content.