Abstract
A short-circuit fault in the gas discharge tube (GDT) is one of the latent hazards of electrical equipment. It may cause the ignition of electrical equipment. Therefore, based on the existing GDT, an improved external open-circuit failure gas discharge tube (EOFGDT) which can remove short-circuit (SC) failure is presented in this paper, and its structure and working mechanisms are introduced. This EOFGDT can utilize the combustion and heat transfer of continuous arcs due to SC failures to increase the temperature of its end electrode, so as to induce a solder joint failure, by which the elastic sheet on the solder joint becomes disconnected from the end electrode, forming an external gap that reduces the rising speed and amplitude of the recovery voltage across the arc gap, and eventually forms an open circuit (OC) within the structure. The EOFGDT SC condition was simulated and a test of the EOFGDT ability to remove SC faults by using an 8/20 µs impulse current generator coupled with a power-frequency power supply test bed was conducted. The experimental results show that the magnitude of the SC follow currents, power-frequency voltages, and the impulse currents are positively correlated to the OC response time, which is greatly affected by the power-frequency follow currents. When the SC current reaches 30 A, the EOFGDT OC response time is about 350 ms. The experimental waveform is consistent with the screen result of the OC response time of the EOFGDT, which proves the effectiveness of EOFGDTs for the inhibition of SC follow-current failures.
1. Introduction
GDT, as a kind of widely used gap lightning arrester, is commonly used for the lightning protection of communication systems or used in power transmission systems between the middle line and the protective ground line. It normally functions in the first stage of the signal multistage line protection, discharging the lightning transient over-currents and limiting overvoltages. By offering high insulation resistance and very low parasitic capacitance, it shows a superior performance in the lightning protection of high-frequency signal lines [1,2,3,4,5]. But it should also be noted that the response time of switching components may have long response times in the case of low-frequency (slow-front) transient overvoltages [6,7].
A GDT works through the gas-filled spark gap discharge. When a certain voltage is applied across the poles of a GDT, an in-between uneven electric field is generated. Affected by this electric field, the gas in the tube begins to disperse. When the applied voltage increases to the extent that the field strength of the interpolar field exceeds the insulation strength of the gas, the gap will be broken down by a discharge and shift from an insulated state to a conductive state, before the conduction of the discharge arcs renders the interpolar voltage into a very low residual voltage, so as to free the electronic equipment in parallel with the GDT from overvoltage damage. A typical GDT consists of a packaging shell of glass or ceramics, and two or three electrodes that are separated by a spark gap permeated with stable inert gas, such as argon and nitrogen [8,9,10,11,12,13,14,15].
The main deficiency of GDTs in terms of protective effects is their considerable discharge delay and unsatisfactory response sensitivity, which makes it difficult to cope with large lightning surges of wave head rising steepness. There is a follow-current problem in the lightning protection of the power supply system [16,17,18]. According to IEC61643-311, if a supply GDT creates power-frequency follow currents, it is advised that it is extinguished at the 30-phase angle once the first power-frequency current passes zero and that there be no breakdown [19,20,21]. The biggest defect of a GDT, as a switching device, is that it will form an SC bridge at both ends of the connecting line when discharging the lightning current. When a voltage exists between the ends of the connecting line, the SC bridge will cause the formation of an SC between the lines or to the ground. Zhen and colleagues conducted an experimental investigation into the effects of working power, duty cycle, and pressure on the thermal parameters of dielectric barrier discharge plasma actuation. There was a substantial danger of equipment fire when the discharge mode at a low voltage was diffusive glow discharge and the high-temperature area was primarily on the electrode’s surface [22]. Furthermore, the arc voltage from the GDT breakdown and the system’s operating voltage essentially control the follow current production in a GDT. Follow currents are produced when the arc voltage drop is smaller than the system’s operating voltage. So, arc voltage is also a crucial evaluation factor in the selection of GDT products. However, their inevitable flaw lies in the fact that the arc voltage will continue to decrease as the discharge times increase [23,24,25]. Cheng et al. conducted an experimental study on the failure mechanism of the cumulative discharge of GDTs, and the results showed that the insulation resistance decreased after certain times of discharges, and there was a risk of SC fault, which was mainly caused by cumulative discharge [26]. Xiang et al. studied the follow-current disruption and protective measures of GDTs, and the results showed that the GDT will form an SC at the power-frequency follow currents. GDTs can be serially connected to varistors, which have a voltage lower than their DC breakdown voltage, to effectively restrain the occurrence of follow currents and decrease the residual voltage [27]. As shown in the above research results, one key disadvantage of GDTs is that they are used on low-power circuits because the follow-current-extinguishing capability is minimal. Switching type devices with considerable extinguishing capabilities are also available in the surge protection industry [28]. One key advantage is that switching type components provide a low I2t stress to the equipment under protection [29].
In addition, scholars have conducted testing and research on different types of gas discharge tubes produced by different manufacturers. Živanović et al. studied the breakdown voltage stability and reliability of gas-filled surge arresters produced by CITEL, Litteluse, and EPCOS, and also investigated the impact of gamma radiation on the breakdown voltage of gas-filled surge arresters [30]. Loncar et al. used a type of inert gas, pressure in the gas chamber, electrode gap value, electrode material, and electrode surface treatment methods as variable parameters to explore the effects of gamma rays and X-ray radiation on the characteristics of inflatable lightning arresters [31].
The main contributions and innovations of this paper are as follows:
(1) Based on the existing discharge tube that can cause fault combustion, an EOFGDT which can remove SC faults quickly was developed in this study.
(2) The EOFGDT SC condition was simulated and EOFGDT’s ability to remove SC faults was tested using an 8/20 µs impulse current generator coupled with a power-frequency power supply test bed.
2. The Structure, Working Mechanism, and Sample Preparation
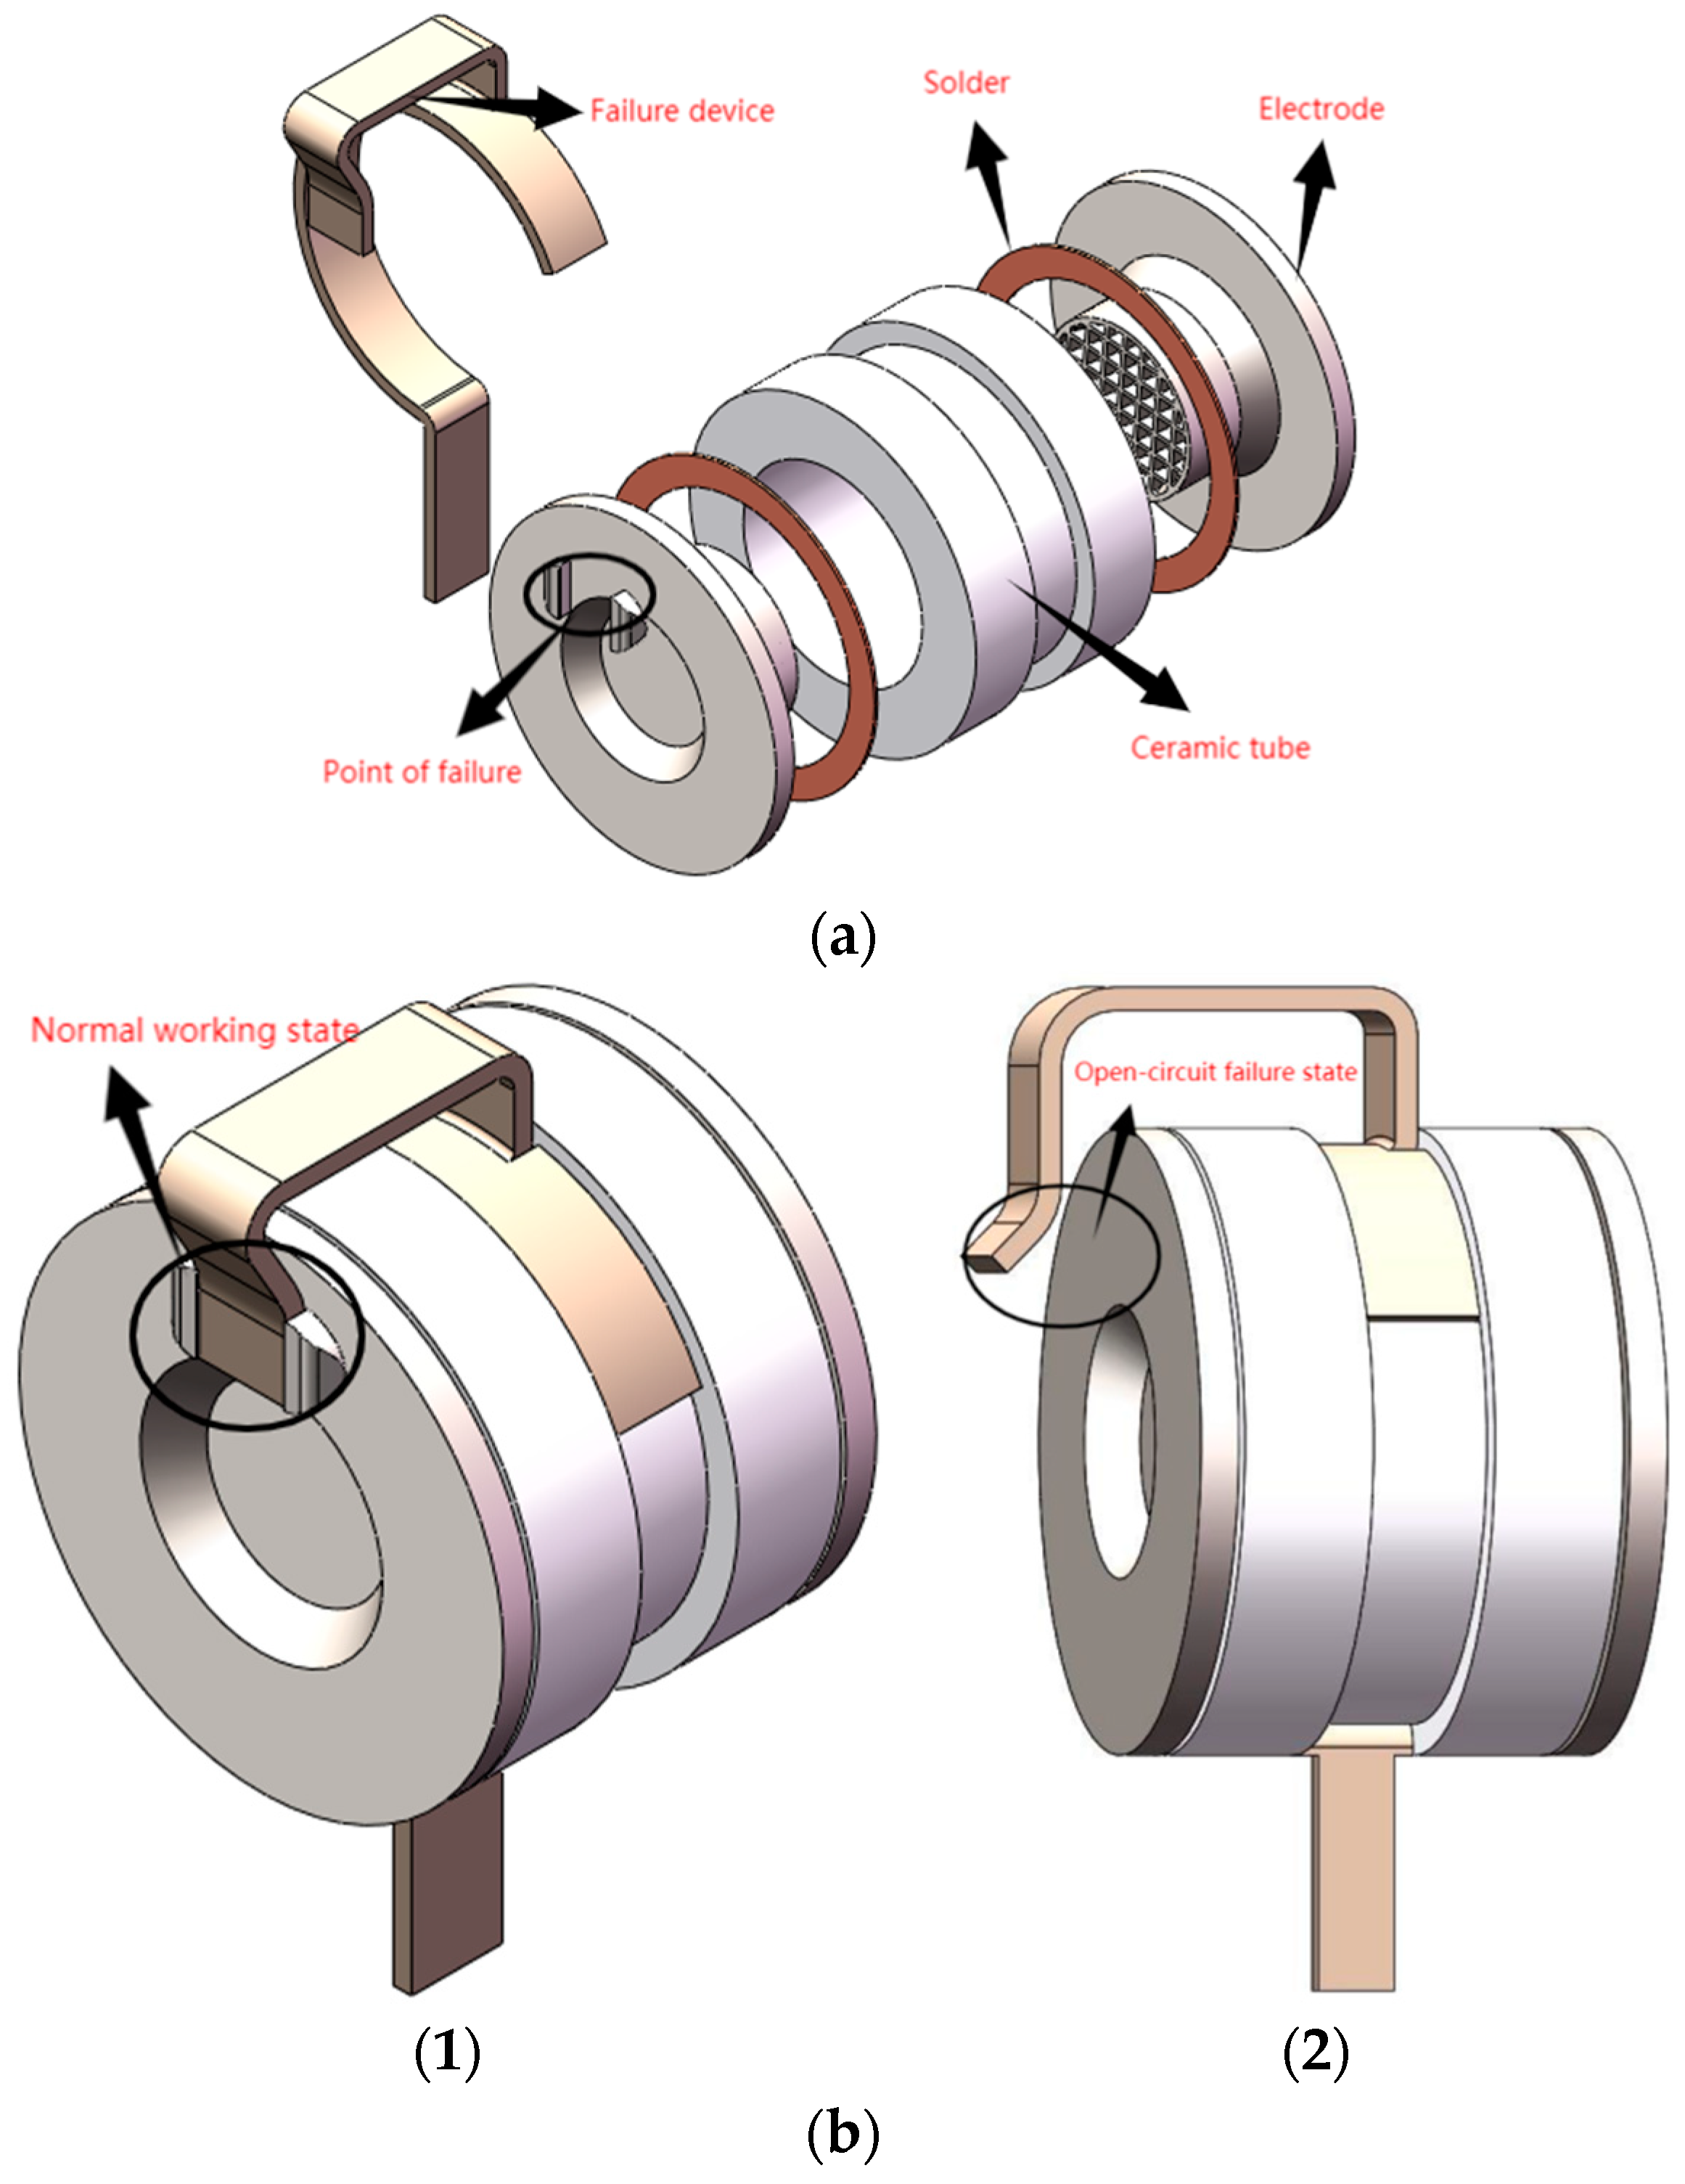
The conventional GDTs have a narrow application scope in the protection of power supply systems due to their weak capability of SC damage prevention. To improve line protection when overcurrent faults of GDTs occur and avoid ignition of GDTs under an SC condition, we explored the relevant studies on EOFGDTs and developed a new type of EOFGDT based on the thermal properties of discharge plasma actuation. The structure of this new type of EOFGDT is shown in Figure 1a. This EOFGDT was formed from a ceramic tube, of which ports were closed through both ends, two-end electrodes that were welded to the tube via solder joints in the form of pads, and an external failure device limited to the outer surface of the tube. The inner surface of the two-end electrodes formed a discharge gap inside the tube, while an elastic sheet extended from the end electrode on the side of the failure device to the outer surface of another-end electrode and was connected to the surface by the solder, which in a normal state is presented in Figure 1b(1). When the SC follow currents run through the tube, the generated arcs will increase the electrode temperature due to continuous combustion and heat transfer, resulting in the failure of the solder. The elastic sheet was thus disconnected from the end electrode to form an external gap, which reduced the rising speed and amplitude of the recovery voltage across the arc gap so that an OC was formed in the EOFGDT structure, as shown in Figure 1b(2). The failure device was provided with a pin that formed two discharge electrodes with the end electrode at the opposite end. In this study, the OC failure mode was applied to the tube to seek a solution to the existing ignition risks when GDT faults occur.
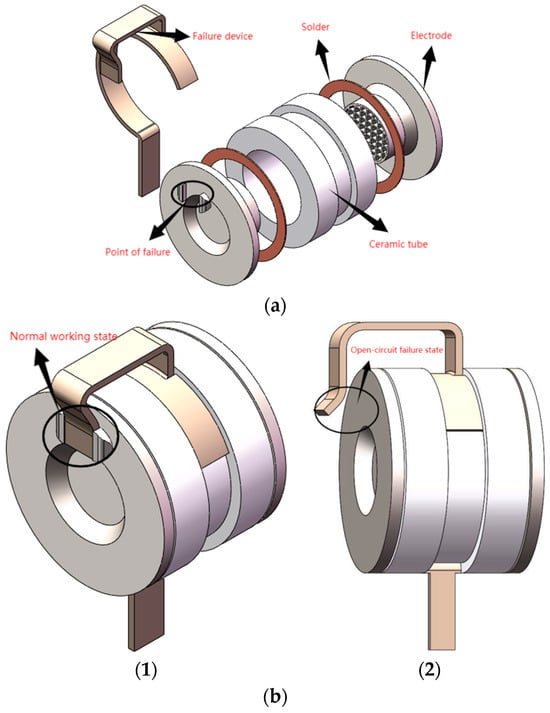
Figure 1.
Schematic diagram of the EOFGDT structure. (a) Schematic diagram of the EOFGDT topology, (b) overall structure of an EOFGDT; (1) EOFGDT in normal working state, and (2) EOFGDT in OC failure state.
The process of producing the experimental sample was as follows:
(1) Material preparation: the electrodes, failure device, solder joint, and ceramic tube were prepared. The discharge surface of the electrode within the tube was coated with electron-emission materials, which consisted of sodium carbonate, barium carbonate, titanium powder, and medical-grade pure water with a ratio of 2 (g):1 (g):3 (g):10 (mL). Its function was that the electron powder would quickly emit electrons under the action of an electric field and form electron collapse to break down the gas so that the gas between the two electrodes would break down and form gas discharge. The solder joint was produced by melting copper–silver alloy at 1140 K [32]. The soldering joint of the EOFGDT needed to meet two conditions: one is that it was reliable enough to not be damaged under normal circumstances, and the other was that when the EOFGDT was subjected to power-frequency follow currents for more than a certain period of time, the solder could quickly melt. So, when selecting materials, we needed to consider the elastic modulus, rebound rate, toughness, and bending strength of the elastic sheet, as well as the melting point of the solder.
(2) Assembly: the two electrodes were respectively fixated to an end of the ceramic tube by a solder joint. At the same time, the failure device was embedded in the middle of the outer surface of the ceramic tube, and the elastic sheet of the failure device was fixed to one of the electrodes.
(3) Welding: the inflation temperature was set to 960 K, and the inflation pressure was set to 130 Kpa in an environment consisting of 90% nitrogen and 10% argon. Once the joint component had melted, the matching electrode and ceramic tube were connected using a welding furnace.
3. The Experimental Circuit and Scheme
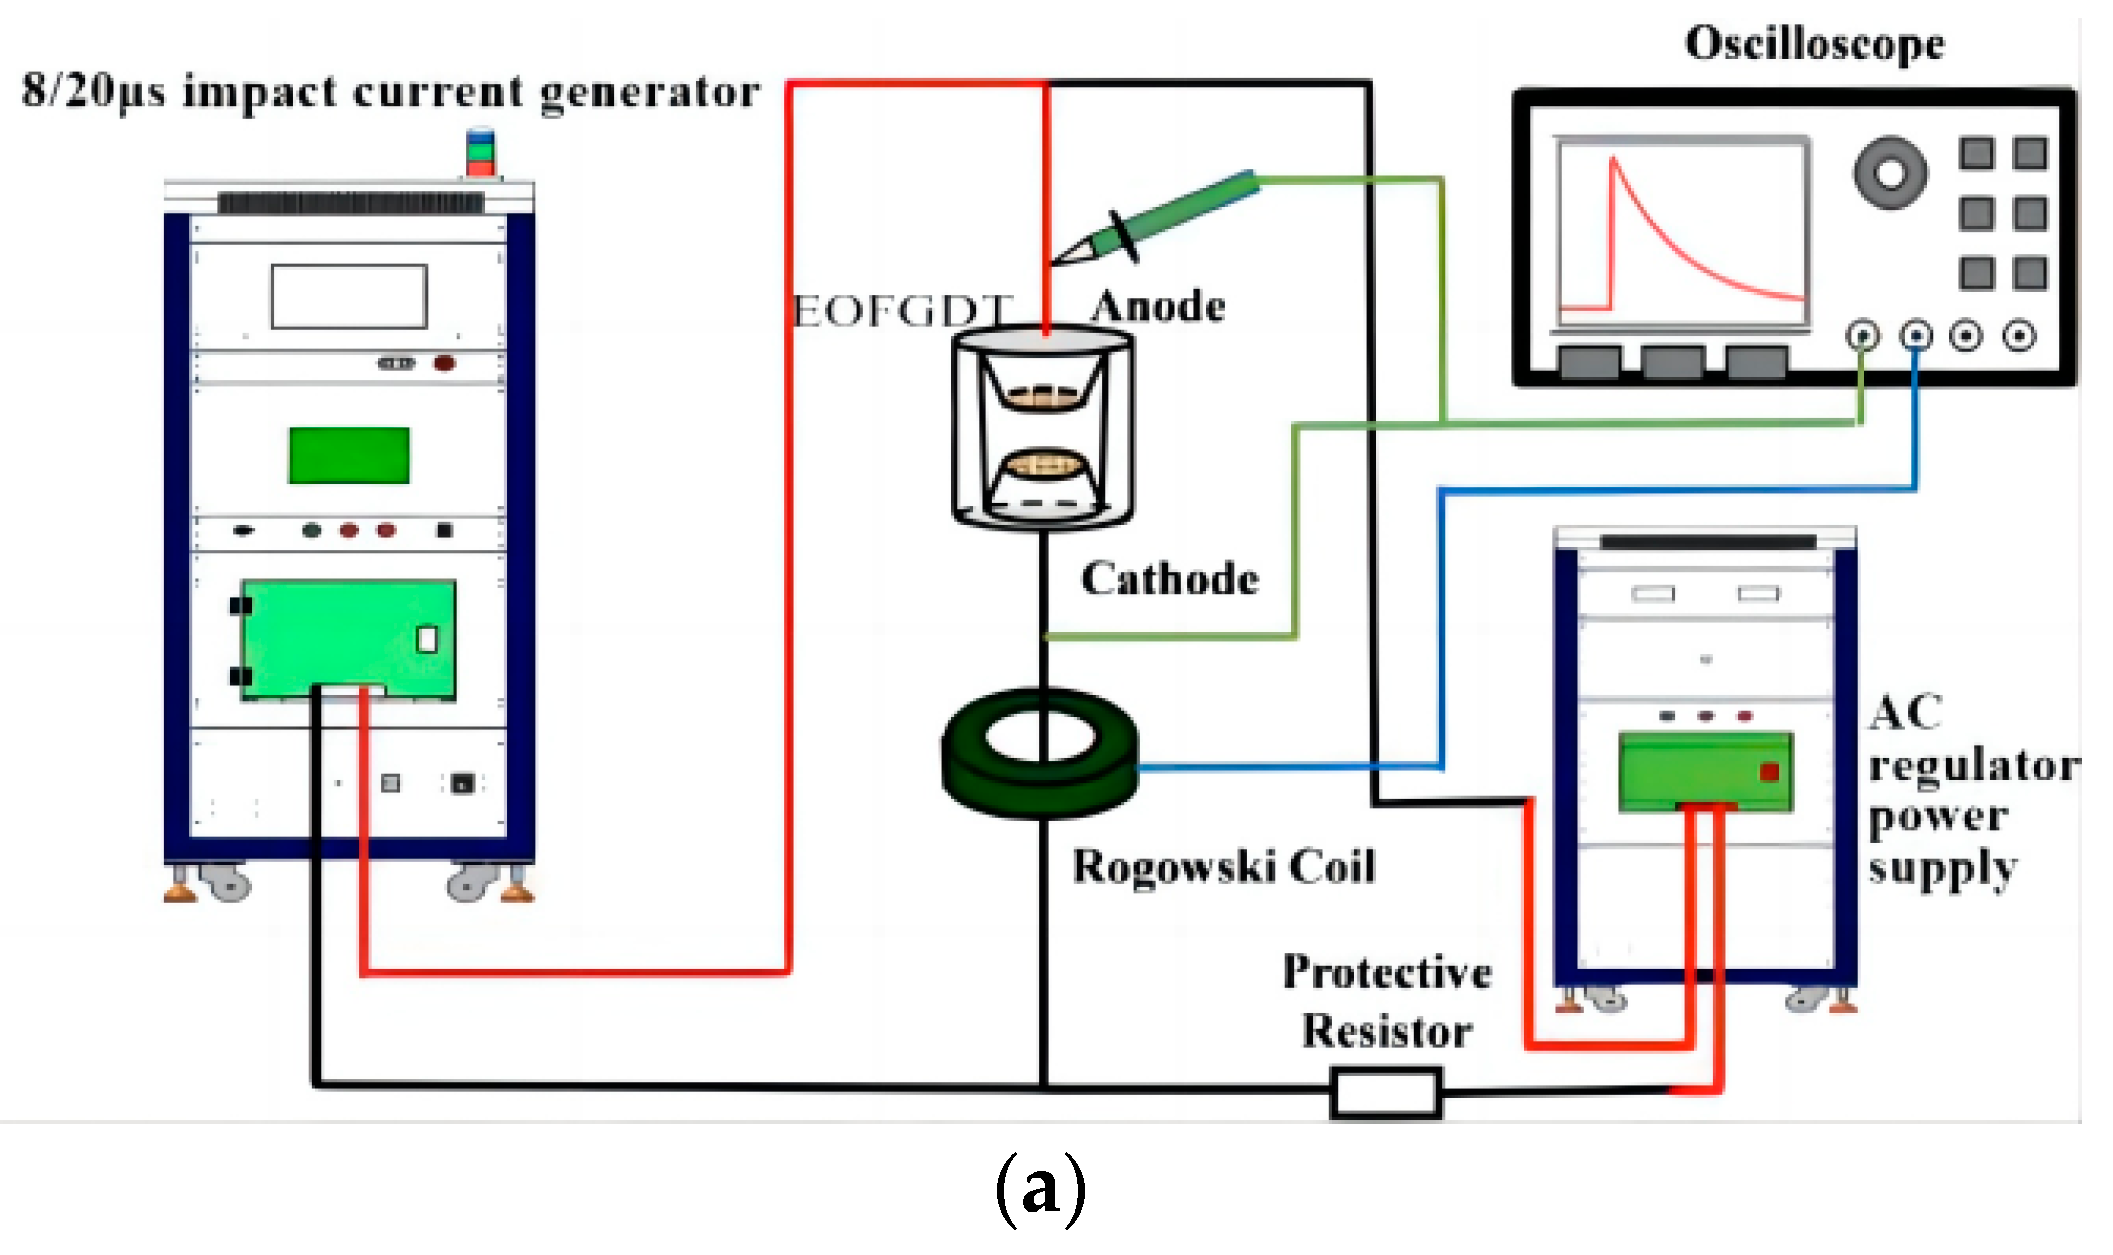
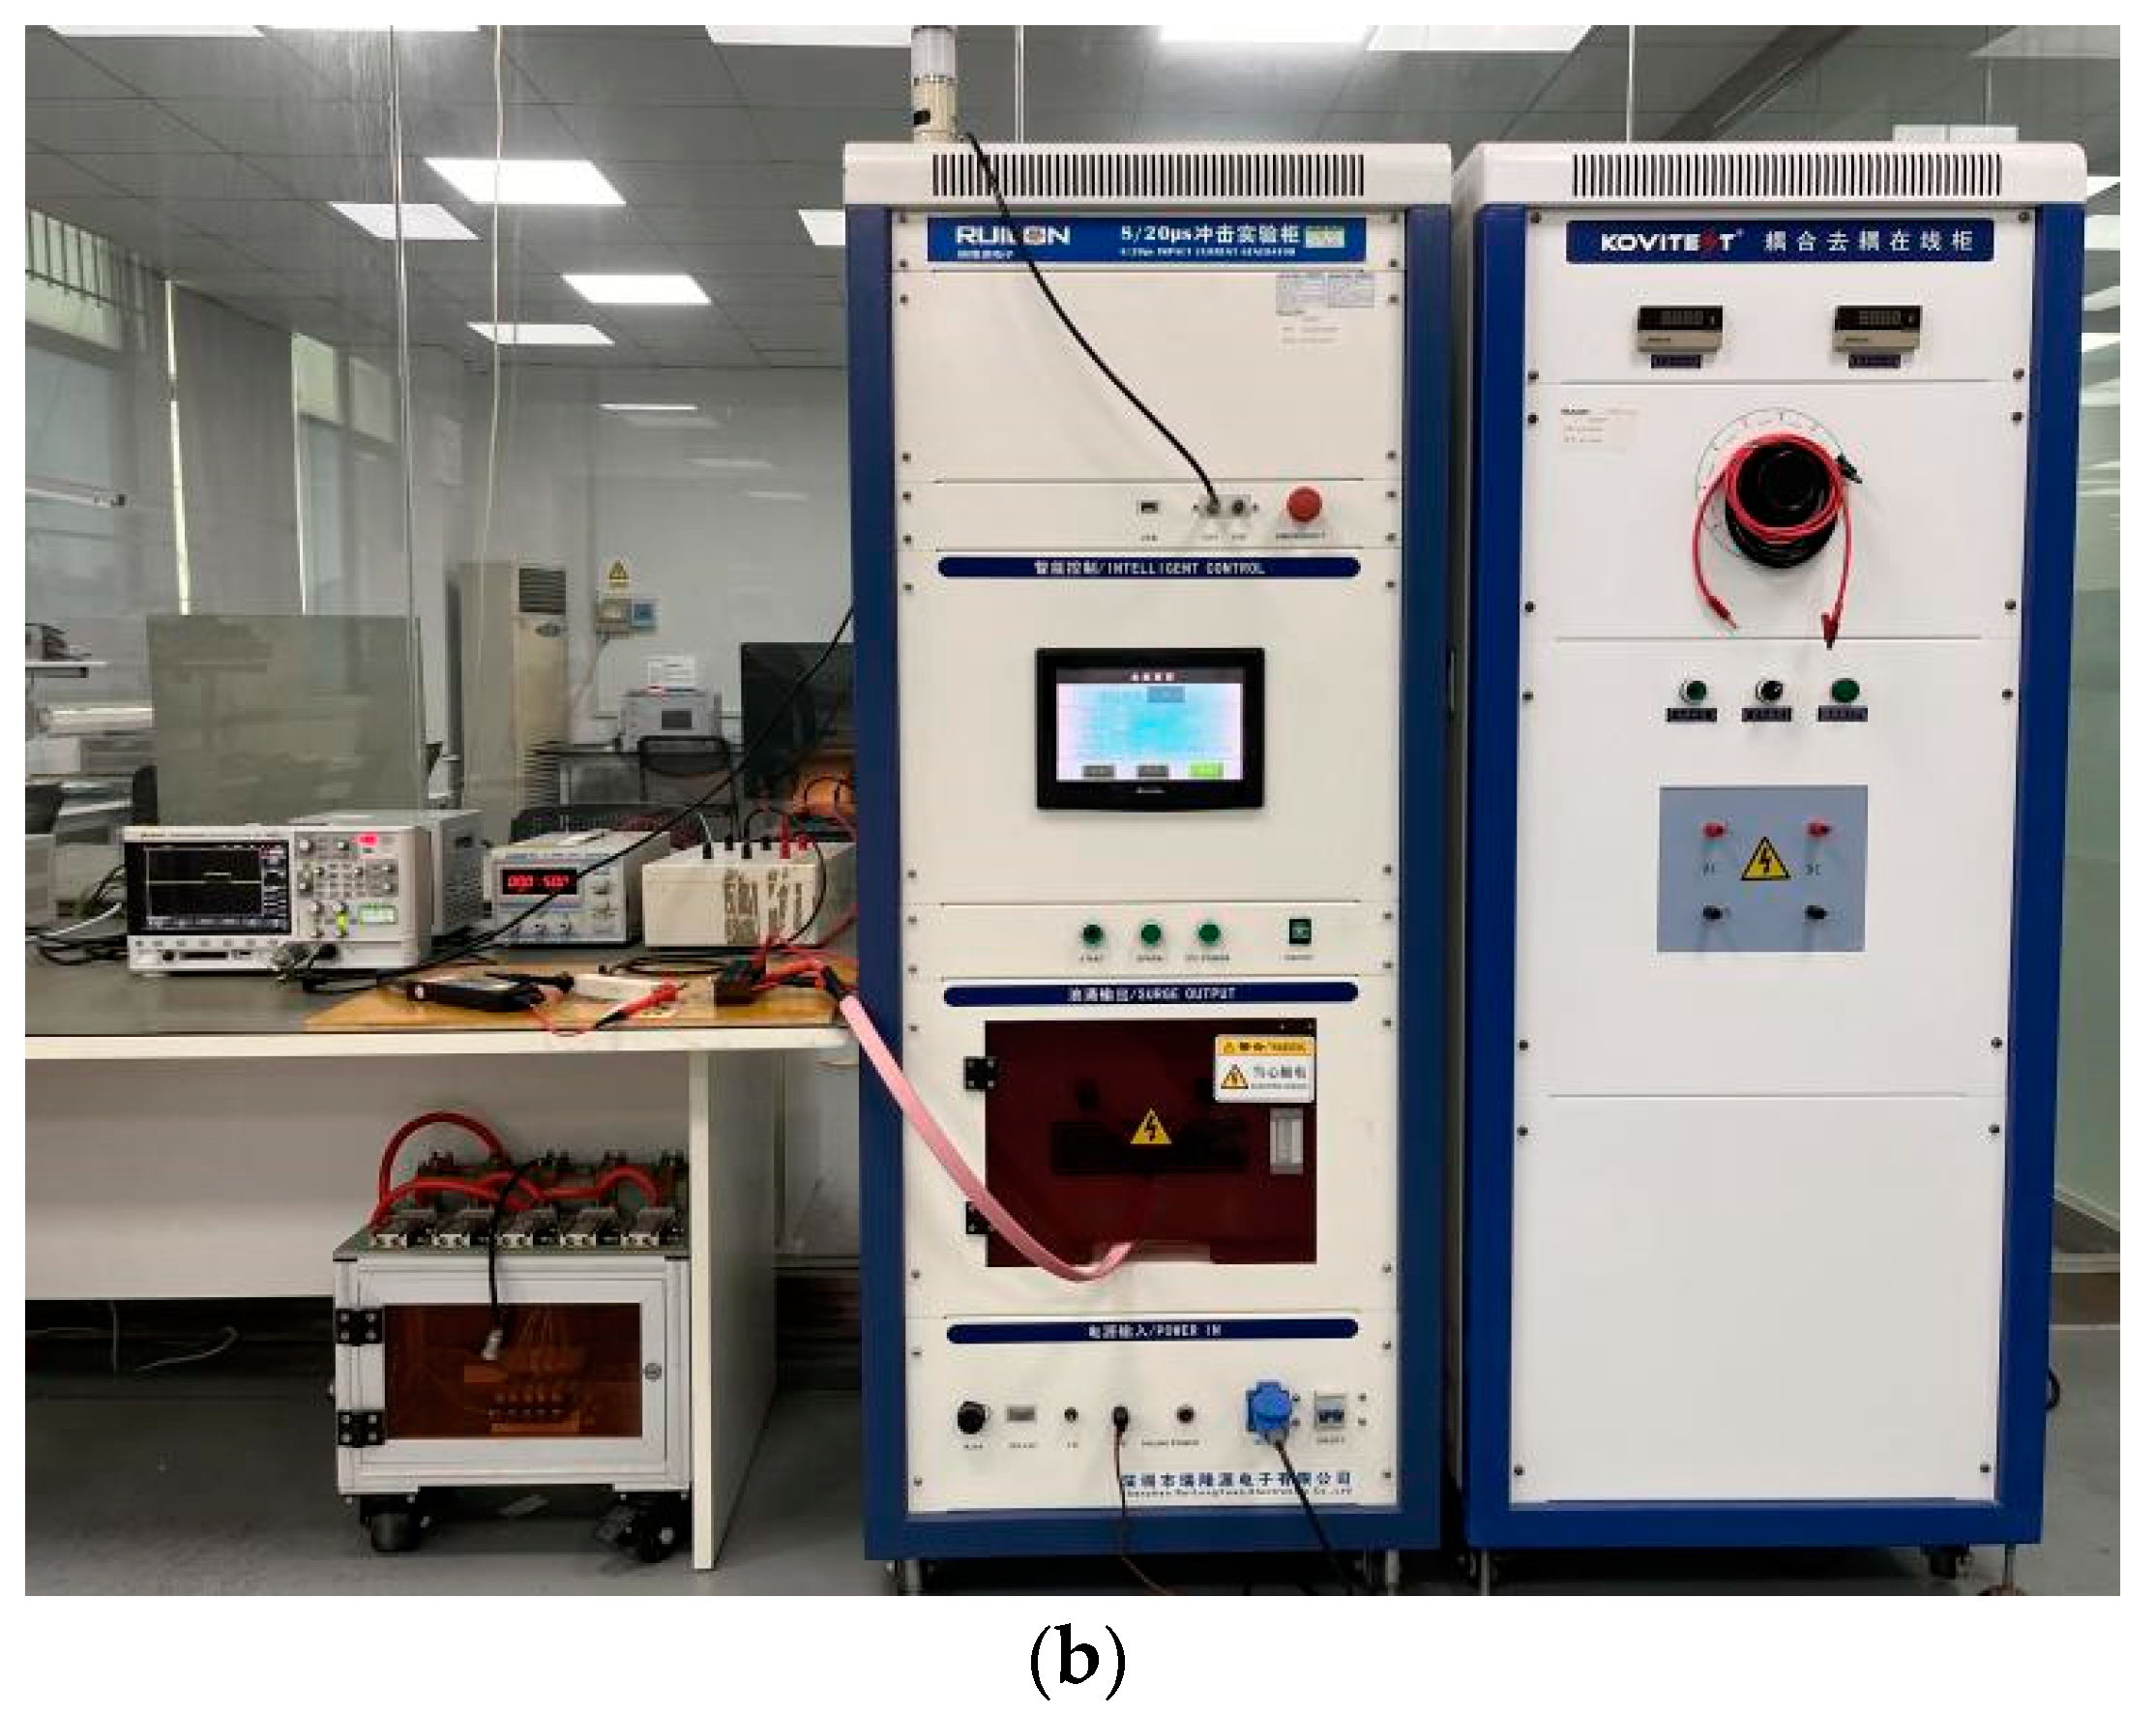
The prepared EOFGDT sample was chosen as the target of the following experiment to understand its current interruption characteristics, while impulse currents were applied to both ends of the EOFGDT to simulate the real working scenario. The theoretical scheme and physical environment of the EOFGDT OC response (also, failure response) experiment under power-frequency SC follow currents are shown in Figure 2. The EOFGDT we developed classified as a Class II surge protective device, so we selected an 8/20 µs impulse current that met the IEC 61643-11 standard to conduct experiments on the EOFGDT. The experimental circuit was mainly composed of an 8/20 µs impulse current generator, an AC power supply, a GDT, an oscilloscope, a Rogowski coil, a high-voltage differential probe, and a protective resistor (1 Ω/1000 W). The protective resistor also served as the sampling resistance. The EOFGDT had a DC breakdown voltage of 600 V and an arc voltage of 30 V, the size of the device was Φ 8 × 9, and the area of the failure point was 4 mm2. The 8/20 µs impulse current generator had an output voltage of 0–20 kV and an output current of 0–10 kA. Due to experimental and equipment limitations, we chose an AC power supply with adjustable output voltage and current, ranging from 0–480 V and 0–30 A, respectively.
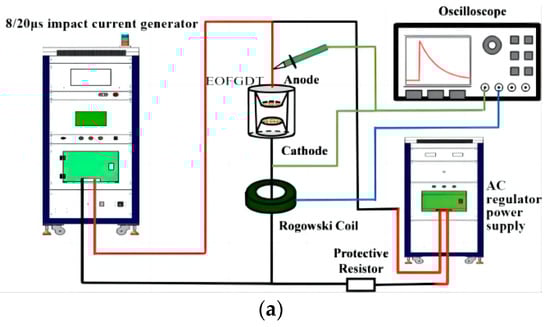

Figure 2.
Illustrations for the EOFGDT OC response experiment under power-frequency follow currents. (a) Experimental scheme; (b) Real test environment.
4. Analysis of the Experimental Results
4.1. Effect of SC Follow Currents on the EOFGDT OC Response Time
When an EOFGDT broke down and generated follow currents, a series loop path between the protective resistor and the EOFGDT was formed. The voltage of the protective resistance then mutated into a spike due to the perturbation of the instantaneous pulse currents of the 8/20 µs impulse current generator. When the impulse currents were released, at this time, only the SC current acted on the circuit. So, the voltage rapidly dropped to equal the voltage across the protective resistor. Due to the solder joint melting of the arcs, the failure device was suddenly disconnected to form the external gap, but the supply voltage could not maintain the breakdown of the external gap to make the arcs extinguished. The series circuit between the sampling resistance and the EOFGDT formed an OC, and the voltage of the protective resistance instantly became 0 V. Therefore, the time difference between the voltage rise and the voltage drop to 0 V was the OC response time of the EOFGDT.
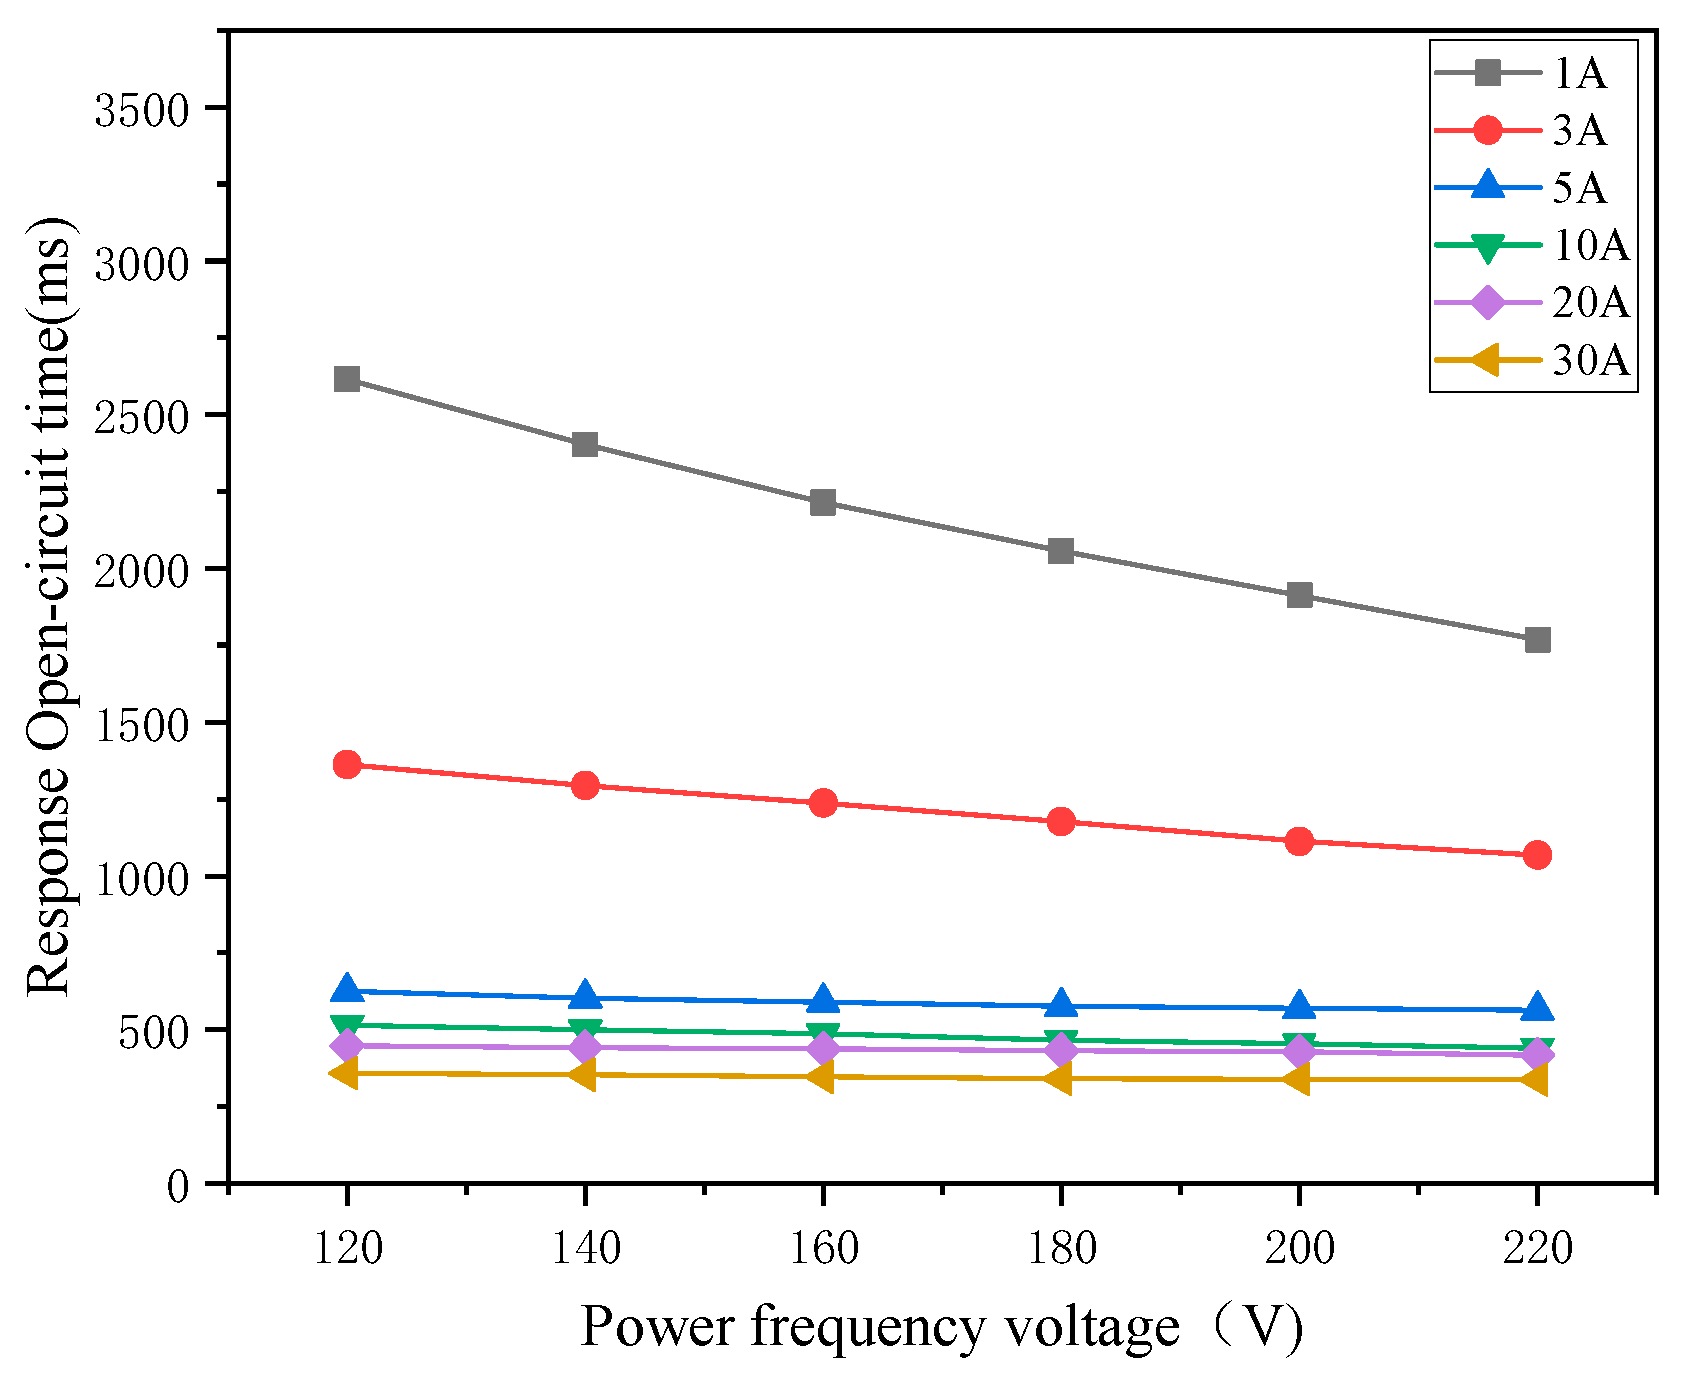
In order to present the OC response characteristics of the EOFGDT for different SC follow currents and avoid the influence of impulse voltages, impulse currents, and power-frequency voltages on the experimental results, the output voltage of 8/20 µs was set to 4 kV and the output current was set to 2 kA and remained unchanged. The internal resistance of the power supply was adjusted to maintain a power-frequency voltage when the output power-frequency voltage was variable. After the impulse currents were through, the waveform of the voltage between the two ends of the protective resistance was collected with an oscilloscope. Twenty EOFGDTs of the same model were tested under different SC follow currents, and the SC follow currents were 1 A, 3 A, 5 A, 10 A, 20 A, and 30 A, respectively. Figure 3 displays the OC reaction time results under various SC follow currents. The findings indicated that a higher SC follow current value resulted in a faster OC response time. This was because a larger SC follow current produced more heat from the arc, which sped up the melting process of solder joints and caused the failure device to bounce to open more quickly.
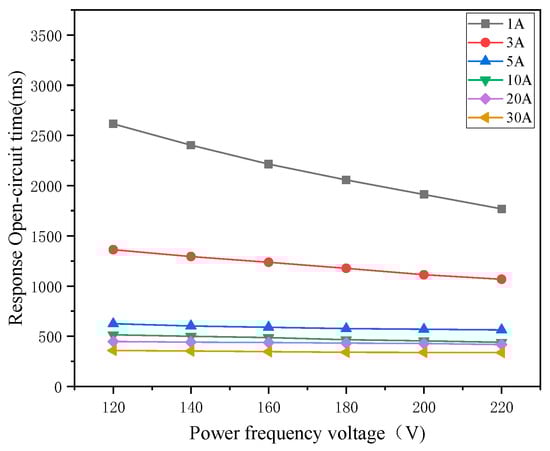
Figure 3.
Fitting curves of the EOFGDT OC response time under different power-frequency voltages and different power-frequency follow currents.
When the SC current was less than 3 A, the OC response time was more than 1000 ms. When the SC current was larger than 5 A, the EOFGDT OC response time was about 600 ms. The rate of change of OC response time was less between the different voltages. This was because the heat transfer of the electrode reached a limit when the power-frequency current reached a certain value, and the heat was enough to make the failure device function. When the SC current was greater than 30 A, the EOFGDT OC response time was about 300 ms. Therefore, we recommend the EOFGDT for application in scenarios where the SC current is large.
4.2. Effect of Power-Frequency Voltages on the EOFGDT OC Response Time
In order to characterize the generated follow currents in EOFGDTs and the OC responses of EOFGDTs when the follow currents inevitably occur, so as to seek solutions to the further influence of impulse voltages, impulse currents, and SC currents on the experimental results, the output voltage of the 8/20 µs generator was set to 4 kV and its output current remained 2 kA. The internal resistance of the power supply kept the output current unchanged when the power-frequency voltage was variable. After the impulse currents were through, the voltage and current waveforms of the EOFGDT were acquired with a Rogowski coil and an oscilloscope. Twenty EOFGDTs of the same model were also tested under different power-frequency voltages, while the trigger angle of the power-frequency power supply and the impulse wave was 210°. For negative lightning pulses, a trigger angle of 210 degrees was not directly equivalent to the 30-degree test but roughly equivalent, which was representative, so we chose this value. The EOFGDT we designed was mainly suitable for voltage levels below 120 V, so we selected voltage values of 90, 100, 110, and 120 for experiments.
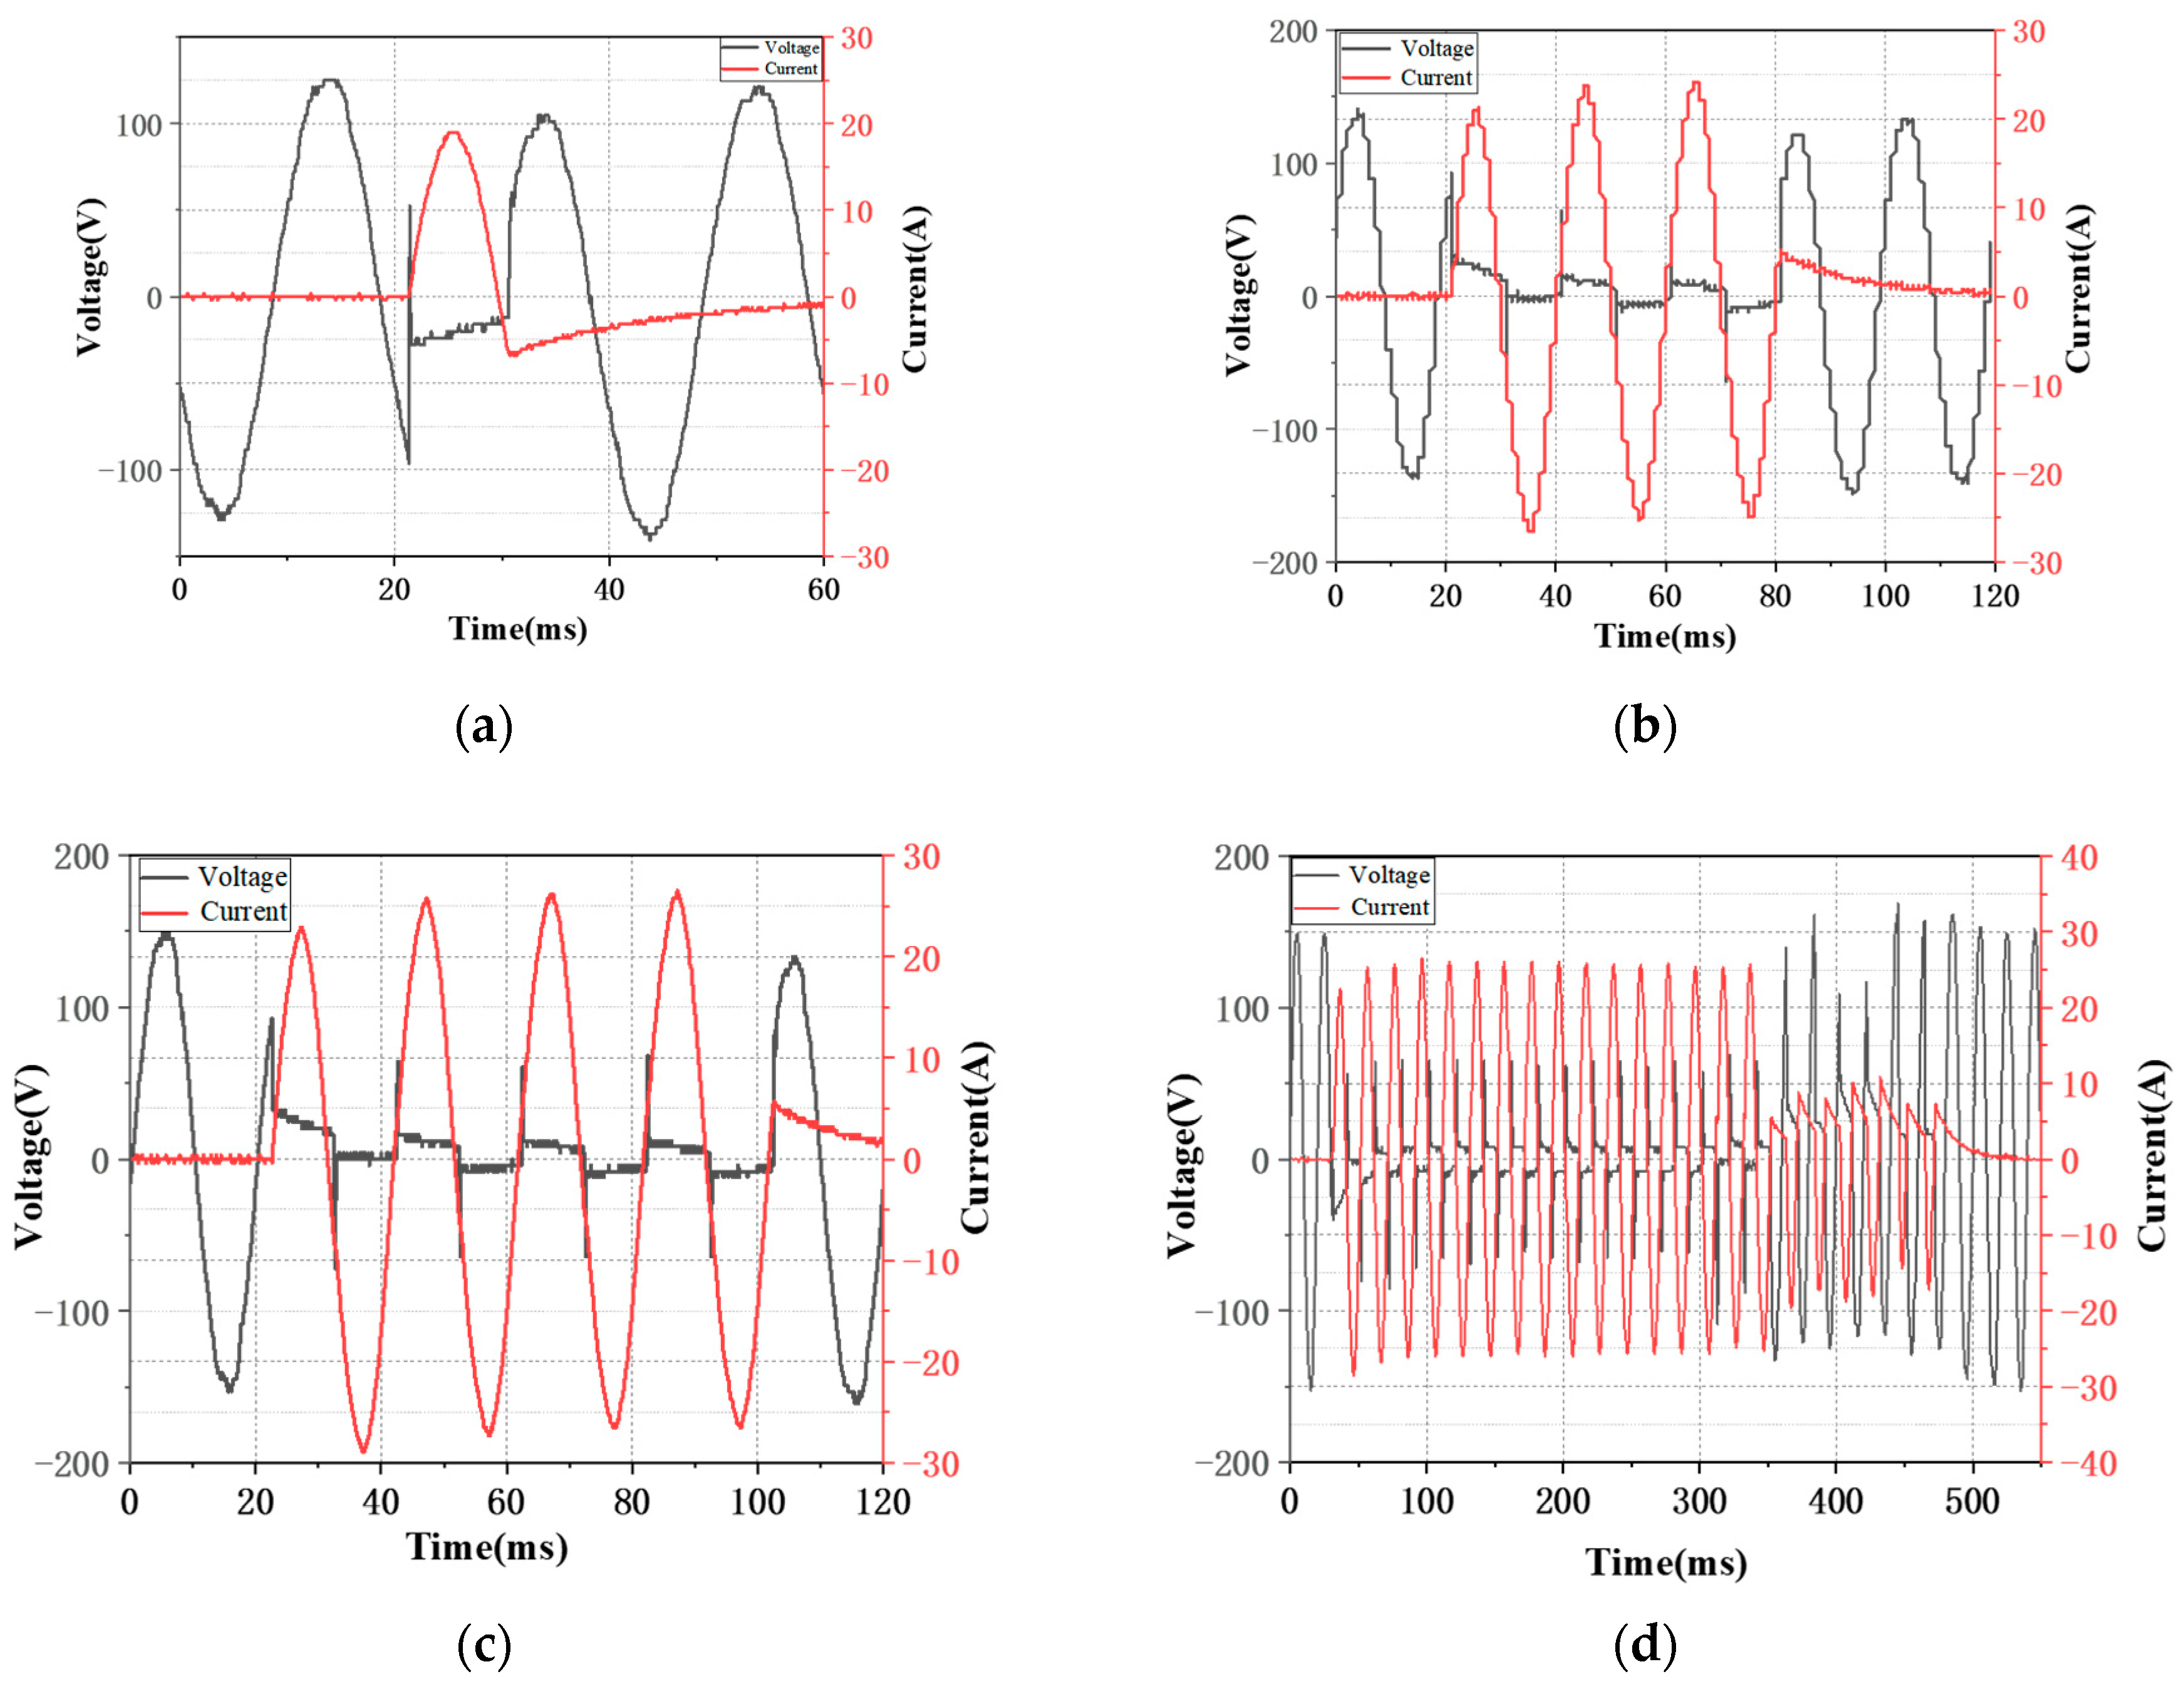
As shown in Figure 4a, when the power-frequency voltage was no more than 90 V, the voltage return of the experimental target in channel one lagged behind. The two-terminal voltage of the EOFGDT quickly recovered to the level of the previous power-frequency voltage at around 6 ms, without the generation of follow currents. During the first cycle, the voltage peak increased due to the small disturbance of the impulse voltages but did not exceed 20% of the rated voltage.
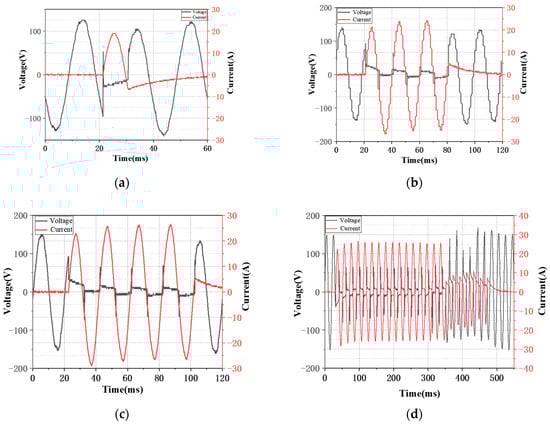
Figure 4.
Voltage-current relationship and diagram of the EOFGDT time to open-circuit failure mode under different power-frequency voltages. (a) The power-frequency voltage was 90 V; (b) The power-frequency voltage was 100 V; (c) The power-frequency voltage was 110 V; (d) The power-frequency voltage was 120 V.
As shown in Figure 4b, when the power-frequency voltage reached 100 V, the glow discharges and follow currents were both generated due to the EOFGDT discharge. The voltage between the test ends dropped to a low value due to the arc column resistance, while the peak current following through the experimental target in channel two was about 10 A. In the first half of the wave cycle with power frequency, the power-frequency follow current was cut off, and no arc was subsequently rekindled. The cut-off of the follow current occurred at about 60 ms.
As shown in Figure 4c, when the power-frequency voltage climbed to 110 V, the phenomenon of follow current was obvious. When the rising rate of the initial voltage reached saturation, the follow current interruption duration sharply rose, and the follow current was cut off at about 80 ms.
Contrary to the open-circuit response time, with an increase in power-frequency voltage, the follow current interruption duration rapidly increased. This was because the extinction of power-frequency current occurred after the open-circuit response. The higher the power-frequency voltage, the harder it was to extinguish the arc, so the extinction time was longer. As shown in Figure 4d, when the voltage jumped to 120 V, the follow currents of the EOFGDT could not be interrupted if no devices like the failure device of EOFGDT were present. During the process of current formation, the voltage across the ends of the experimental target suddenly decreased but did not reach zero. This phenomenon was due to the existence of arc column resistance which maintained the voltage at a low value of about 30 V under power-frequency follow currents. The maximum changing rate of the currents was observed at around 300 ms, which was caused by the solder joint failure when the elastic sheet was disconnected from the end electrode. By this disconnection, an external gap was formed to reduce the rise speed and amplitude of the recovery voltage across the arc gap. The current dropped to zero at around 400 ms, and no arc was subsequently rekindled.
The results of the EOFGDT time to open-circuit failure mode under different power-frequency voltages and different power-frequency follow currents are shown in Figure 4. The experimental results showed that the larger the power-frequency voltage, the higher the initial voltage rising rate and the faster the generation of the follow currents, and the larger the arc energy, the shorter the OC response time. According to the effect of power-frequency voltages on the EFOGDT time to open-circuit failure mode, as shown in Figure 3 and Figure 4, when the SC current exceeded 5 A and the power-frequency voltage reached 120 V, the influence of the increase of power-frequency voltages on the EOFGDT time to open-circuit failure mode gradually decreased. This was because when the power-frequency voltage was larger than the arc voltage, the power-frequency voltage could maintain the generation of power-frequency currents in the EOFGDTs. The EOFGDT relied on the continuation of power-frequency currents to utilize arc heat transfer so that the failure device could form an OC. Thus, it could be concluded that the EOFGDT time to open-circuit failure mode was greatly affected by the power-frequency follow currents. When the power-frequency current was small (1 and 3 A), the open-circuit response time was greatly affected by the power-frequency voltage. This was because the temperature of the arc was low when the power-frequency current was small. As is shown in Figure 4, the higher the power-frequency voltage, the easier it was for the GDT to generate follow current, and the time of the follow current was short, so the time to the open-circuit failure mode of the EFOGDT was less. On the other hand, the higher the power-frequency voltage, the greater the power of the discharge, and the higher the electrode temperature, the less the time to the open-circuit failure mode of the EFOGDT. Therefore, when the SC current was small, the time to the open-circuit failure mode of the EOFGDT was greatly affected by the power-frequency voltage, and also, when the SC current was small, the time to the open-circuit failure mode of the EOFGDT was less affected by the power-frequency voltage.
4.3. Effect of Impulse Currents on the EOFGDT OC Response Time
When the EOFGDT was subjected to a pulsed current, under the electric field, the electrons within were accelerated to gain kinetic energy and thus give rise to the temperature within the EOFGDT. The accelerated electrons and neutral molecules frequently collided with each other, thereby strengthening the oscillatory motion of the molecules, which also gave rise to the temperature. The temperature rise could also be partially attributed to the collision between the accelerated electrons and the excited atoms due to their increased number of impacts. Although ions were also accelerated, they were not an important contributing factor in the temperature. During the formation of gas discharge, the particle temperature of electrons, excited atoms, and molecules were different, with the electrons being the highest.
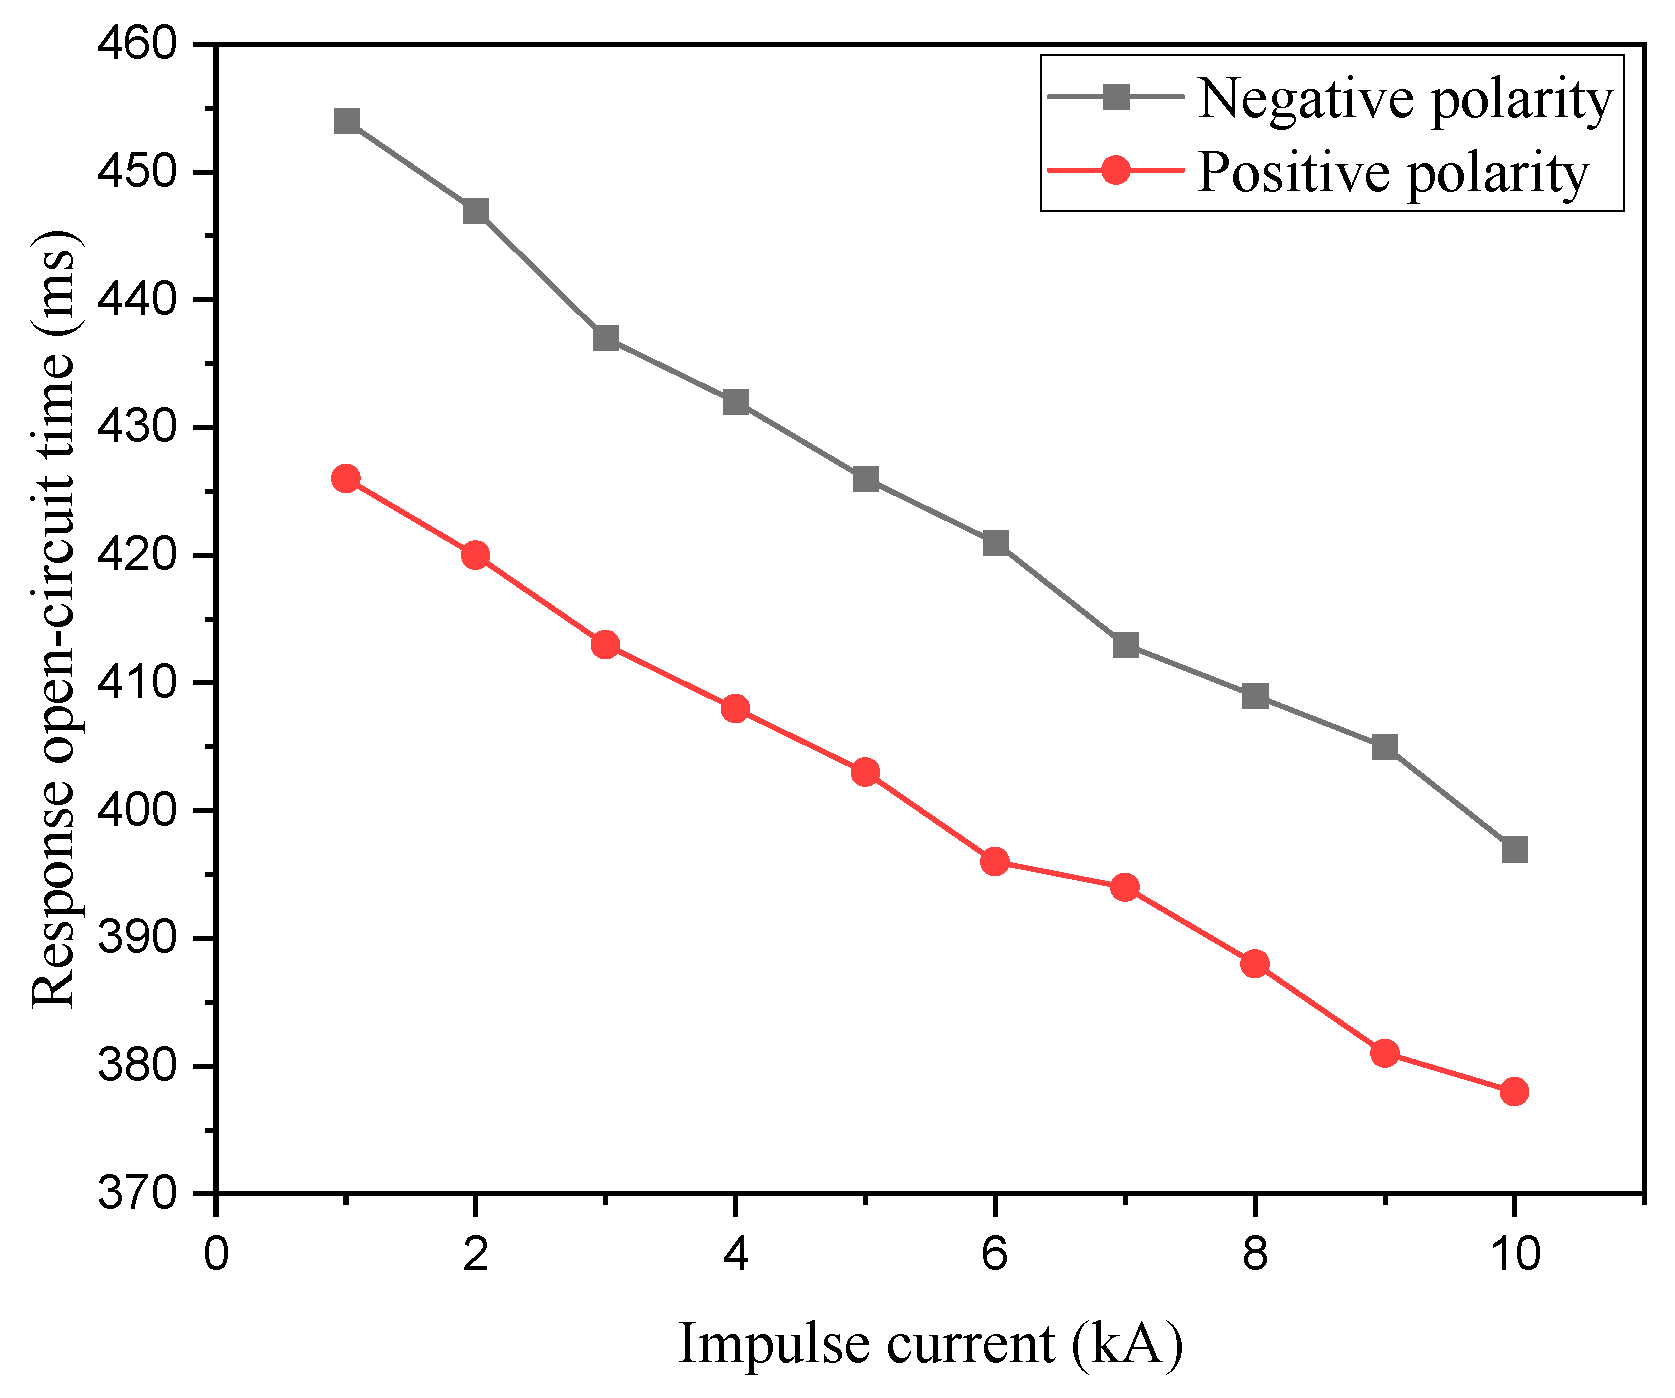
Figure 5 presents the curves of the EOFGDT time to open-circuit failure mode when impulse currents of different sizes and different polarities were through, the positively polarized power-frequency voltage had an effective value of 120 V, and the SC current was set to 20 A. When the impulse current acted on the EOFGDT, the pulse arc acted on the electrode and transmitted the energy to the electrode. The larger the impulse current, the shorter the time to open-circuit failure mode. When the pulse current reached 10 kA, the time to open-circuit failure mode was about 450 ms. This was because the larger the impulse current, the more the heat generated by the arc, the shorter the melting time of the solder joint, and the timelier the failure device would be disconnected. However, the decreasing rate of the time to the open-circuit failure mode was not large. This was because the short impulse-current discharge time led to a slow heat conduction speed and the rapid increase in the temperature of the electrode surface. The impulse arc energy was far less than that of the power-frequency arc. This was due to the shorter existing time required for the simulation of lightning impulses (at the microsecond level) compared to the generated power follow currents (at the millisecond level). Therefore, the discharge process of the impulse currents could be regarded as heating the electrode using the currents as the transient heat source.
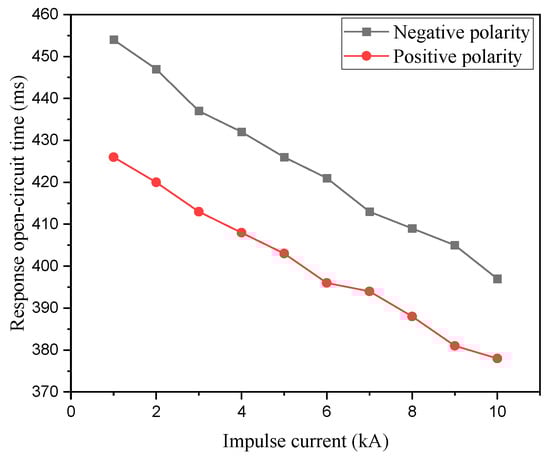
Figure 5.
Curves of the EOFGDT OC response time under impulse currents with different polarities and different sizes (the power-frequency voltage was 120 V, and the SC current was 20 A).
The greater the amplitude of the impulse current, the faster the impulse voltage would rise. The electric field between the two electrodes of the EOFGDT rapidly strengthened, such that the in-between free electrons were given adequate energy to facilitate movement toward the anode. In this process, they interacted with neutral molecules through collisions, resulting in an electron collapse in which drastically raising the electron quantity induced the emission of glow discharge. Meanwhile, the EOFGDT broke down, and the current in the circuit rapidly surged. The shorter the breakdown response time, the faster the power-frequency follow generation and the faster the initiation of the heat transfer of the power-frequency arcs. Therefore, the breakdown response time of the EOFGDT was also an important factor that affected the time to open-circuit failure mode. A larger impulse current and its accompanying larger energy would more likely lead to deformation and damage at the junction of the failure device and the solder joint, making the failure device bounce open to form an OC.
The EOFGDT time to open-circuit failure mode was less with a negatively polarized 8/20 µs impulse wave than with a positively polarized wave. When a simulated positive lightning pulse was applied with a power-frequency trigger angle of 210°, which meant that both ends of the EOFGDT experienced a positive half-wave power-frequency voltage following the positive pulse, the electrons between the EOFGDT electrodes moved to the anode within a strong electric field and continued to speed up in the original direction, creating more collision ionization. The number of electrons thus quickly increased to generate glow discharges. The direction was the same as that in which the lightning pulse would quickly appear. Subsequently, due to the existence of the power-frequency voltage, the arc discharge occurred and had the same polarity that the power-frequency voltage did. Therefore, the pulse of positive polarity and the power-frequency trigger voltage of positive polarity could facilitate the generation of power-frequency follow currents. When a simulated negative lightning pulse was applied with a power-frequency trigger angle of 210°, which meant that both ends of the EOFGDT experienced a positive half-wave power-frequency voltage after a negative pulse, the interpolar electrons were subjected to the electric field, the direction of which was opposite to the initial pulse, leading to inadequate energy for the moving electrons, and generating arc discharges with the same polarity as the power-frequency voltage. The pulse of negative polarity and the power-frequency trigger voltage of positive polarity could not facilitate the generation of power-frequency follow currents.
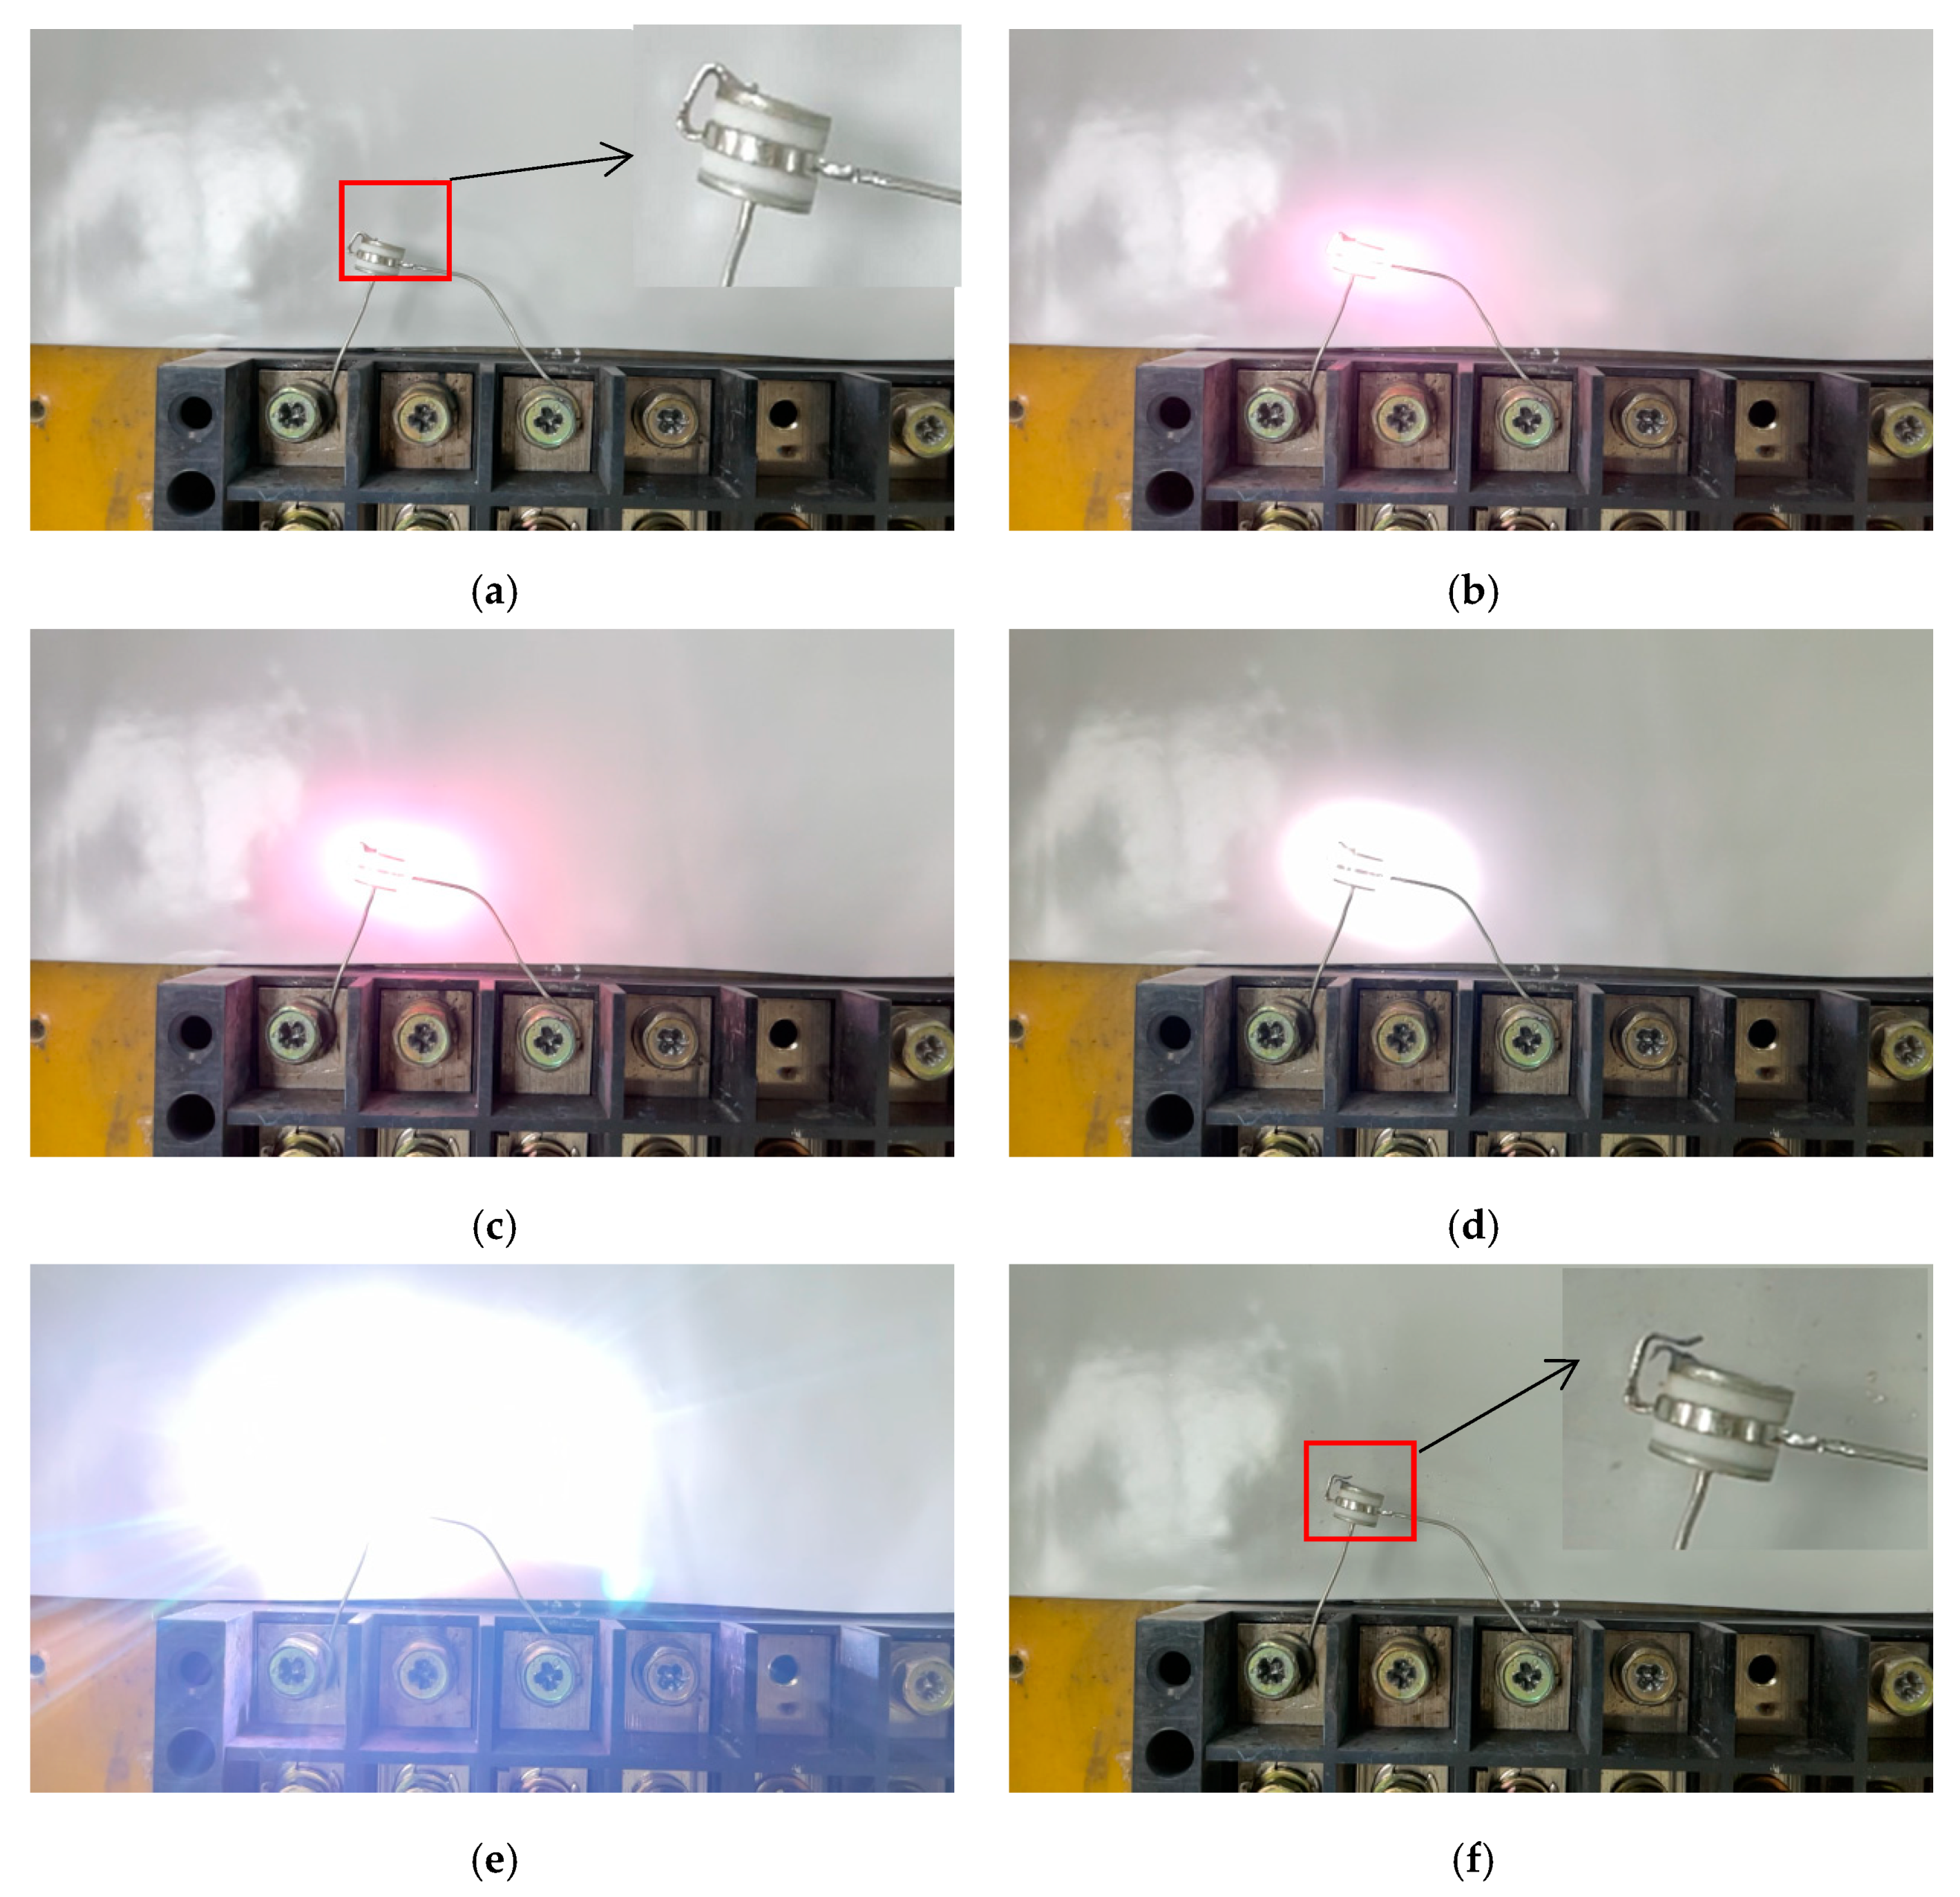
In order to verify the performance of arc extinguishment of EOFGDTs and its effectiveness, the impulse-coupling SC test was conducted by connecting the discharge tube and the protective resistor in a series. The experimental equipment was an 8/20 µs impulse current generator coupled to a 120 V/20 A AC power supply. The action pictures of the EOFGDT under the SC currents captured by the high-speed camera are shown in Figure 6. Figure 6a shows that at t = 0 ms, the EOFGDT suffered from an 8/20 µs impulse surge. Figure 6b shows that the EOFGDT emitted dazzling light, and the EOFGDT was broken through. Figure 6c,e show the formation of the external gap. Since the power supply voltage was larger than the arc voltage of the EOFGDT, the EOFGDT produced the follow currents, and the SC current reached 10 A. The charged particles in the discharge path were accelerated and collided with the surface of the electrode. The kinetic energy was transformed into pulsed force and then into thermal energy that heated the intended part on the surface of the electrode so that the alloy of the solder joint was immediately melted or gasified, leading to the disconnection of the failure device and the formation of the external gap. Figure 6f shows that due to the short action duration, the solder material sputtered when strong reverse momentum was generated and the arc was extinguished, and the EOFGDT was completely removed. Therefore, the power-frequency SC follow currents of the EOFGDT were cut off at about 450 ms. This was consistent with the waveform results obtained with our test at a power-frequency voltage of 120 V and an SC current of 20 A.
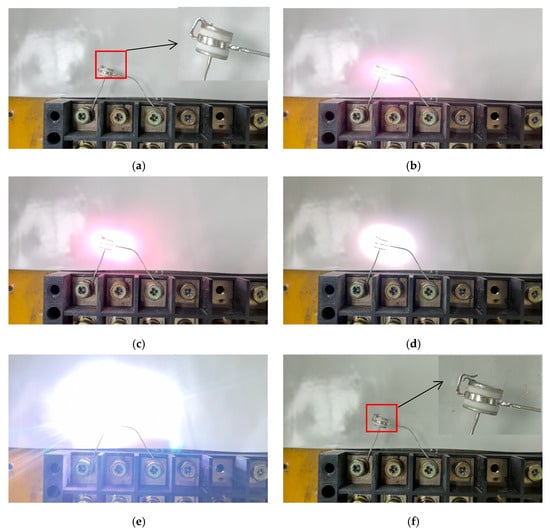
Figure 6.
Photos of the OC failure and the arc extinguishment of the EOFGDT. (a) t = 0 ms; (b) t = 50 ms; (c) t = 100 ms; (d) t = 200 ms; (e) t = 300 ms; (f) t = 450 ms.
5. Conclusions
We developed a new EOFGDT to solve persistent arc burning, which reactively produced OC failures to block SC currents and prevent deep arcs from being rekindled, thereby avoiding the SC failure combustion mode of the EOFGDT. It will be applicable to typical DC systems in telecommunication circuits after the technology matures.
The experimental results showed that the SC follow currents, the power-frequency voltages, and the impulse currents were positively correlated to the EOFGDT OC response time. The larger the SC follow current, the shorter the OC response time will be, because a larger SC follow current will generate arcs that can bring more heat. The larger the impulse current, the more heat is generated and the faster the melting of the solder joint. Therefore, the higher the rising rate of the impulse voltage, the shorter the EOFGDT breakdown response time, because the faster the initiation of the heat transfer of the power-frequency arcs. The EOFGDT OC response time under the condition of positive lightning pulses was less than that of negative lightning pulses because the pulse of positive polarity and the power-frequency trigger voltage of positive polarity could facilitate the generation of power-frequency follow currents. The larger the power-frequency voltage, the higher the energy, the higher the rate of voltage rise, and the shorter the OC response time. The EOFGDT OC response time was greatly affected by power-frequency follow currents.
When the SC current exceeded 5 A, the EOFGDT OC response time was about 600 ms and the changing rate of OC response time became less. When the SC current reached 30 A, the EOFGDT OC response time was about 350 ms. When the SC current exceeded 5 A and the power-frequency voltage reached 120 V, the influence of the increase of power-frequency voltages on the EOFGDT OC response time gradually decreased. Although the EOFGDT OC response time under the condition of positive lightning pulses was less than that of the negative lightning pulses, the polarity of lightning in nature is random. Therefore, we recommend the EOFGDT for application when the power-frequency voltage reaches 120 V in the case of high SC currents. Moreover, the research results provided practical insights into the selection of the EOFGDT products. However, this article does not consider the influence of the selection of elastic sheet material and solder material on the discharge tube, and this type of discharge tube cannot extinguish the power-frequency current multiple times. Subsequent work will involve corresponding research on the selection of elastic sheet material and solder material, as well as the durability of the products.
Author Contributions
Methodology, H.L. (Hao Lu) and H.L. (Hongchang Li); Formal analysis, C.Z.; Investigation, H.L. (Hao Lu), Y.C. and H.H.; Data curation, C.Z.; Writing—original draft, H.L. (Hao Lu) and C.Z.; Funding acquisition, H.L. (Hongchang Li). All authors have read and agreed to the published version of the manuscript.
Funding
The authors appreciate the Major Project of the National Social Science Foundation of China (No. 21&ZD133), the National Natural Science Foundation of China (No. 52266017), the financial supports provided by National Oversea High-level Talents Program of China. It is also supported by the Xinjiang Natural Science Fund for Distinguished Young Scholars (No. 2021D01E08), the Xinjiang Major Science and Technology Special Project (No. 2022401002-2, 2022A01007-1, 2022A01007-4), the Xinjiang Key Research and development Project (No. 2022B03028-2, No. 2022B01033-2, No. 2022B01022-1, No. 2022B01020-4), the Central Guidance on Local Science and Technology Development Project (No. ZYYD2022C16), the Xinjiang Regional Coordination Special Project-International Science and Technology Cooperation Program (No. 2022E01026), the Innovation Team Project of Xinjiang University (500122006021) and High-level Talents Project of Xinjiang University (No. 100521001).
Data Availability Statement
Data is contained within the article.
Conflicts of Interest
The authors declare no conflict of interest.
References
- Rosen, R.; Simendinger, W.; Debbault, C.; Shimoda, H.; Fleming, L.; Stoner, B.; Zhou, O. Application of carbon nanotubes as electrodes in gas discharge tubes. Appl. Phys. Lett. 2000, 76, 1668–1670. [Google Scholar] [CrossRef]
- Žumer, M.; Zajec, B.; Rozman, R.; Nemanič, V. Breakdown voltage reliability improvement in gas-discharge tube surge protectors employing graphite field emitters. J. Appl. Phys. 2012, 111, 083301. [Google Scholar] [CrossRef]
- Standler, R.B. Protection of Electronic Circuits from Overvoltages; Wiley: Hoboken, NJ, USA, 1989. [Google Scholar]
- Bizjak, M.; Bekovic, M.; Hamler, A. Spark Breakdown in Gas-Discharge-Tube Surge Arrester at Voltage Pulse. IEEE Trans. Power Deliv. 2015, 30, 1552–1560. [Google Scholar] [CrossRef]
- Tien, C.-Y.; Chang, L.-B.; Kuei, P.-Y.; Chih, C.-F. Enhance the protection capability of intentional electromagnetic interference with Zinc Oxide sintered gas discharge tube. In Proceedings of the 2015 Asia-Pacific Symposium on Electromagnetic Compatibility (APEMC), Taipei, Taiwan, 26–29 May 2015; pp. 467–469. [Google Scholar]
- CIGRE Working Group C4.408. Lightning Protection of Low-Voltage Networks; Technical Brochure 550; August 2013; Available online: https://hdl.handle.net/11585/192063 (accessed on 19 December 2023).
- Gektidis, K.M.; Ioannidis, A.I.; Tsovilis, T.E. Response time of surge protective devices employing spark gap technology. In Proceedings of the IEEE IAS Annual Meeting, Detroit, MI, USA, 9–14 October 2022. [Google Scholar]
- Rozman, R.; Stagoj, A. Operation of GDT with metal body desigend for high current surges. In Proceedings of the 2010 30th International Conference on Lightning Protection (ICLP), Cagliari, Italy, 13–17 September 2010. [Google Scholar]
- Ribic, J.; Vorsic, J.; Pihler, J. Mathematical Model of a Gas Discharge Arrester Based on Physical Parameters. IEEE Trans. Power Deliv. 2014, 29, 985–992. [Google Scholar] [CrossRef]
- Chen, J.; Hu, S.; Yao, X. Periodic oscillatory damping pulse current conditioning of gas discharge tube. In Proceedings of the 2009 IEEE 9th International Conference on the Properties and Applications of Dielectric Materials, Harbin, China, 19–23 July 2009; pp. 602–605. [Google Scholar]
- Pejović, M.M.; Pejović, M.M.; Stanković, K. Experimental Investigation of Breakdown Voltage and Electrical Breakdown Time Delay of Commercial Gas Discharge Tubes. Jpn. J. Appl. Phys. 2011, 50, 086001. [Google Scholar] [CrossRef]
- Zola, J.G. Gas Discharge Tube Modeling with PSpice. IEEE Trans. Electromagn. Compat. 2008, 50, 1022–1025. [Google Scholar] [CrossRef]
- An, M.; Lu, H.; Zhao, W.; Zheng, C.; Wang, Y.; Hu, Y. An Experimental Study on Novel Gas Discharge Tubes with Graphene as Electron Emission Material. IEEE Trans. Electron Devices 2023, 70, 1942–1949. [Google Scholar] [CrossRef]
- Zheng, C.; Lu, H.; Xu, Y.; Wang, Y. Study on the performance of open-circuit failure gas discharge tube under the context of DC short-circuit. Electr. Power Syst. Res. 2022, 213, 108777. [Google Scholar] [CrossRef]
- Živanović, E.N.; Maluckov, Č.A. Investigation of statistical behaviour of electrical breakdown voltage distribution for nitrogen-filled diode at 13.3 mbar pressure. Contrib. Plasma Phys. 2018, 58, 293–301. [Google Scholar] [CrossRef]
- Zheng, C.; Lu, H.; Hu, H.; Zhao, W.; Yuan, Y.; Xu, Y.; Wang, Y.; Hu, Y. Research on printed circuit board external open-circuit failure gas discharge tube under short-circuit failure. Electr. Power Syst. Res. 2023, 220, 109337. [Google Scholar] [CrossRef]
- Zhong, S.; Qin, F.; Gao, Y.; Yan, Z. Response Characteristics of Gas Discharge Tube to High-Power Microwave. IEEE Access 2021, 9, 111486–111492. [Google Scholar] [CrossRef]
- Maluckov, C.A.; Radovic, M.K.; Radivojevic, D.D. Experimental investigations of time delay distributions inside a commercial gas tube. IEEE Trans. Dielectr. Electr. Insul. 2015, 22, 752–758. [Google Scholar] [CrossRef]
- International Electrotechnical Commission. Components for Low-Voltage Surge Protective Devices-Part 311: Performance Requirements and Test Circuits for Gas Discharge Tubes (GDT); Document 61643-311-2013; International Electrotechnical Commission: Geneva, Switzerland, 2013. [Google Scholar]
- Zhou, Q.; Zhao, Y.; Liu, F.; Zhang, J. Comparative study of the newly-published IEC 61643-311 and-312 for lightning protective component GDT. In Proceedings of the 2014 International Conference on Lightning Protection (ICLP), Shanghai, China, 11–18 October 2014; pp. 854–856. [Google Scholar]
- Standard C62.36-2014; IEEE Standard Test Methods for Surge Protectors Used in Low-Voltage Data, Communications and Signaling Circuits. The Institute of Electrical and Electronics Engineers, Inc.: New York, NY, USA, 2014.
- Zhen, Y.; Huimin, S.; Weilong, W.; Min, J.; Di, J. Thermal characterisation of dielectric barrier discharge plasma actuation driven by radio frequency voltage at low pressure. High Volt. 2018, 3, 154–160. [Google Scholar] [CrossRef]
- Gannac, Y.; Leduc, G.; Pham, C.D.; Crevenat, V. 8/20 and 10/350 surges behaviour of a Gas Discharge Tube according to gas pressure. Electr. Power Syst. Res. 2021, 197, 107302. [Google Scholar] [CrossRef]
- Guo, Z.Y.; Zhao, W.H. Arc and Thermal Plasma; Science Press: Beijing, China, 1986; p. 268. [Google Scholar]
- Cheng, L.; Xiang, N.; Li, K.; Chen, W.; Bian, K.; Yang, J.; Xu, Z.; Han, C.; Gu, H.; Yang, C. Reliability improvement of gas discharge tube by suppressing the formation of short-circuit pathways. Plasma Sci. Technol. 2022, 24, 035501. [Google Scholar] [CrossRef]
- Cheng, L.; Chen, W.; Xiang, N.; Li, K.; Bian, K.; Yang, J.; Xu, Z.; Han, C.; Zhang, W.; Wan, Y. Experimental Study on the Short-Circuit Failure Mechanism of Cumulative Discharge in Gas Discharge Tube. IEEE Trans. Plasma Sci. 2020, 49, 2831–2838. [Google Scholar] [CrossRef]
- Xiang, N.; Gu, H.; Li, K.; Cheng, L.; Yang, J.; Zhang, W.; Han, C.; Yang, C. Research on follow-current interruption characteristics of gas discharge tube and protective measures. Energy Rep. 2022, 8, 1224–1230. [Google Scholar] [CrossRef]
- Rozman, R. Gas Discharge Tube Assemblies. U.S. Patent 10,685,805, 21 May 2020. [Google Scholar]
- Tsovilis, T.E. Critical insight into performance requirements and test methods for surge protective devices connected to low-voltage power systems. IEEE Trans. Power Deliv. 2021, 36, 3055–3064. [Google Scholar] [CrossRef]
- Živanović, E.; Živković, M.; Veljković, S. Study of Breakdown Voltage Stability of Gas-Filled Surge Arresters in the Presence of Gamma Radiation. Electronics 2022, 11, 2447. [Google Scholar] [CrossRef]
- Loncar, B.; Osmokrovic, P.; Vasic, A.; Stankovic, S. Influence of gamma and X radiation on gas-filled surge arrester characteristics. IEEE Trans. Plasma Sci. 2006, 34, 1561–1565. [Google Scholar] [CrossRef]
- Vrhunc, J.; Kamenšek, S.; Knez, T.; Juričev, I.; Tsovilis, T. Surge Protective Device Modules Including Integral Thermal Disconnect Mechanisms and Methods Including Same. U.S. Patent 10,340,110, 2 July 2019. [Google Scholar]
Disclaimer/Publisher’s Note: The statements, opinions and data contained in all publications are solely those of the individual author(s) and contributor(s) and not of MDPI and/or the editor(s). MDPI and/or the editor(s) disclaim responsibility for any injury to people or property resulting from any ideas, methods, instructions or products referred to in the content. |
© 2023 by the authors. Licensee MDPI, Basel, Switzerland. This article is an open access article distributed under the terms and conditions of the Creative Commons Attribution (CC BY) license (https://creativecommons.org/licenses/by/4.0/).