Article

MFM: A Multiple-Features Model for Leisure Event Recommendation in Geotagged Social Networks

1
Faculty of Information, Beijing University of Technology, Beijing 100124, China
2
Tourism College, Beijing Union University, Beijing 100101, China
3
State Key Laboratory of Resources and Environmental Information System, Institute of Geographic Sciences and Natural Resources Research, Chinese Academy of Sciences, Beijing 100101, China
4
Beijing Key Laboratory of Urban Spatial Information Engineering, Beijing 100045, China
5
College of Applied Arts and Science, Beijing Union University, Beijing 100191, China
*
Author to whom correspondence should be addressed.
Electronics 2024, 13(1), 112; https://doi.org/10.3390/electronics13010112
Submission received: 6 August 2023 / Revised: 14 December 2023 / Accepted: 22 December 2023 / Published: 27 December 2023

Abstract

:
Event-based social networks (EBSNs) are rich in information about users and leisure events. The willingness of users to participate in leisure events is influenced by many factors such as event time, location, content, organizer, and social relationship factors of users. Event recommendation systems in EBSNs can help leisure event organizers to accurately find users who want to participate in events. However, to address the existing cold-start problems and improve the accuracy of event recommendations, we propose a multiple-feature-based leisure event recommendation model (MFM). We introduce the user’s social contacts into the user preference features and construct a user feature space by integrating the features of the user preferences for events and organizers and preferences of the user’s closest friends. Moreover, considering the behavioral differences between active and inactive users, we extracted the respective features and trained the feature weight models. Finally, the experimental results showed that in comparison with the baseline models, the precision of the MFM is higher by at least 7.9%.

1. Introduction

Leisure events play a crucial role in promoting urban health and boosting the economy. Activities like socializing with friends, engaging in sports, and going on vacations have been shown to have significant positive effects on our mental well-being [1,2,3], physical health [2,4], and overall life satisfaction [5]. Furthermore, leisure events have a positive impact on urban economies. Event organizers not only generate substantial revenue by offering leisure activities, but the presence of leisure facilities also attracts people and new businesses, leading to increased property values in the area.
To stimulate local leisure consumption, it is essential to understand the diverse leisure preferences of individuals. This understanding enables accurate matching of leisure products with user needs and facilitates personalized marketing. Users’ willingness to participate in leisure events is influenced by various factors, including event timing, location, content, organizers, and social relationships. Event-based social networks (EBSNs) provide a platform to effectively comprehend user needs and deliver precise recommendations for leisure events. EBSNs are social networks that facilitate the publication and sharing of local leisure events [6], such as Meetups, Plancasts, and Douban Events. Organizers create and promote events online, while users provide feedback such as expressing interest or indicating their intention to participate in events that catch their attention.
Given the large number of events published daily on EBSNs, it becomes challenging for users to identify events that align with their interests. Therefore, the development of an event recommendation system becomes crucial to provide users with timely and accurate recommendations for suitable events.
By leveraging the power of event recommendation systems within EBSNs, users can discover and engage in leisure events that align with their preferences, leading to enhanced participation and enjoyment. This, in turn, contributes to the overall well-being of individuals and fosters the growth in local leisure economies. Consequently, the research and development of event recommendation systems play a vital role in promoting personalized leisure experiences, facilitating community engagement, and driving economic growth in urban areas.
Previous research has indicated that various factors, including event attributes such as title, description, and tags [7,8], contextual information like spatial location and time [9,10,11], and users’ social relationships [12,13], significantly influence users’ decision-making when it comes to event participation. To address this, we propose an event recommendation system that leverages users’ historical event participation to infer their preferences and recommend upcoming events accordingly. However, it is important to note that events have relatively short lifecycles [14], resulting in limited user feedback immediately after their publication. Furthermore, there are users who have never participated in any event, posing challenges in obtaining precise user preferences. Consequently, recommendation systems within event-based social networks (EBSNs) face more pronounced cold-start problems compared to other recommendation systems [15].
Within social networks, the behaviors of users with varying levels of activity exhibit significant differences [15]. Active users tend to participate in a larger number of events, making it easier to infer their preferences based on their event history. However, accurately extracting preferences from a substantial number of inactive users becomes challenging due to their limited event participation [15,16]. Unfortunately, most existing studies have overlooked these behavioral differences between active and inactive users [17,18], opting to build a unified recommendation model for both groups [6,19]. As a result, the accuracy of event recommendations is compromised. Another important aspect to consider is that a user’s interests often align with those of their friends within the social network [13,20]. By leveraging this social influence, we can speculate a user’s preferences based on the preferences of their friends. However, current research has not fully explored the impact of users’ social relationships on their event participation. Furthermore, a user’s interest in events is subject to change over time [17,21]. However, existing research has not adequately addressed this dynamic nature when extracting user preferences for events.
To improve the accuracy of event recommendation systems within event-based social networks (EBSNs), it is essential to consider the behavioral disparities between active and inactive users, incorporate the influence of users’ social relationships, and account for the temporal evolution of user interests. By addressing these challenges, we propose a multi-features model (MFM) for leisure event recommendation. The main contributions of this study are as follows:
Firstly, the proposed multiple-feature-based leisure event recommendation (MFM) method constructs a user feature space by considering three dimensions: user preferences for events, user preferences for organizers, and preferences of the users’ closest friends for an event. This comprehensive approach captures various aspects of user preferences and social relationships, leading to a more thorough modeling of user preferences. Secondly, to address the cold-start problem, this study introduces a method to obtain users’ event preferences based on their social relationships with event organizers and other users. This approach leverages social connections to infer event preferences, enabling recommendations even for new or inactive users. Lastly, this study introduces a nonlinear forgetting function to capture the temporal aspect of user preferences, accurately representing users’ recent interests in events. This enhances the precision of event recommendations by considering the evolving nature of user preferences over time.

2. Literature Review

2.1. Event-Based Recommendation Methods

The event recommendation system extracts the user preference features from historical events in which users have participated, and estimates the preference of the user for the target event by calculating the similarity between the user preference and the target event [22]. A recommendation algorithm is the core part of the recommendation process. An appropriate recommendation method can determine the user interests and accurately recommend events to users. EBSN recommendation systems mainly include memory-based, factorization-machine-based, and graph-based recommendation models.
The memory-based recommendation model recommends events based on the historical preferences of the users. Many studies have extracted user features from the content and context of historical events in which the users have participated. Zhang et al. [23] used the latent Dirichlet allocation (LDA) model to obtain the theme distribution from the content text of historical events participated by users. Wang et al. [24] embedded the event text and context into the feature space of an event, trained the user profile vector via the user’s historical behavior, and finally recommended the top-N events closest to their preferences. Considering that users’ interests change over time, Wu et al. [21] introduced a long- and short-term interest model to calculate the weights of user behaviors at different times in the past. Owing to the increasing number of features considered, machine learning algorithms such as gradient-boosted decision trees [25] and random forest (RF) are used to calculate the weight of the features.
Factorization-based recommendation models mainly incorporate Bayesian personalized ranking [26], matrix factorization (MF) [27], collective matrix factorization (CMF) [28], and singular value decomposition [29]. Many researchers have extracted features from the semantics, the spatial–temporal information of events, and online social networks of users, integrated the user profiles and their social networks through factorization models, and finally prepared a list of users who are most likely to participate in the events [17,30]. Li et al. [31] combined the features and social relations of users to calculate the similarity between users and events and integrated the MF and neighborhood-based methods to recommend events.
Furthermore, researchers have proposed content-based methods for event recommendation. For example, Minkov et al. [32] developed a hybrid approach that combines content-based and collaborative filtering techniques to recommend academic activities based on an analysis of seminar event datasets. Some studies have utilized LDA topic models to calculate similarity and facilitate event recommendations [33,34]. Li et al. [35] analyzed the abundant information in the Douban Event network and proposed a hybrid model that integrates LDA topic modeling with social influence prediction. To address the challenge of cold-starts in local event recommendations, Zhang and Wang [15] considered activity content, user relationships, location, and organizers, and introduced a novel collective Bayesian–Poisson factorization method. Ogundele et al. investigated personalized event recommendation in EBSNs and introduced a framework called SoCaST [36]. They considered four factors that influence user preferences: spatial, temporal, thematic, and social types, and employed a multi-criteria decision-making approach to recommend the most suitable events to users.
In recent years, research on graph-based event recommendation has increased gradually. The graph-based recommendation model regards entities, for example, users, organizers, and events, as nodes constituting a graph, and the recommendation problem as a query of adjacent nodes. Common methods for evaluating the similarity among the nodes include random walk [37], random walk with restart [38], and Markov chain models. Liu et al. [20] constructed a graph of the explicit relations between the users and events and the implicit relationship among the event attributes. They estimated the similarity between the events and users using random walk. Pham et al. [37] built a heterogeneous graph comprising users, events, and groups, and used Markov chains to recommend events.

2.2. Solution to Cold-Start Problems in EBSNs

In EBSNs, most users participate in a few events, which makes it difficult to obtain accurate user profiles. Hence, a cold start must be considered in event recommendations. The approach of applying the users’ social relationships to alleviate the cold-start problem is being actively researched.
Jamali and Ester [39] proposed a model-based social network recommendation model that utilized the matrix decomposition technique and incorporated the mechanism of trust propagation, thus effectively improving the recommendation accuracy for cold-start users. Ma et al. [40] proposed a social event recommendation method based on social relations and self-attention, which trained the attention model to obtain the trust weights between users and the friends followed by the users and integrated the information of interest groups as well as events into the module during the training. Li et al. [41] proposed a spatiotemporal theme model for cold starts based on the interactions among event content, time, location, and organizer, which influences the user’s decision-making regarding event attendance. In addition, the implicit use of group preferences extracted from the user or group member feedback on events can also be used to solve the cold-start problem [41].

3. Research Datasets

3.1. Data Acquisition and Preprocessing

Douban Events is the largest and most comprehensive offline activity community in China. It focuses on urban leisure activities within a city, such as parties, tourism, concerts, drama, lectures, films, and exhibitions. We used Python and the API provided by the Douban website to crawl the event data, user participation in events, and user participation in interest groups from 10 July 2020 to 20 August 2021, in Beijing (Figure 1). We first removed the data without user participation and with missing field attributes, and finally received 162,469 leisure events, 299 interest groups, and 118,393 users. Each user participated in an average of four events, with a maximum of three hundred and seventy-one events. Among them, 30% of the users joined specific interest groups, with an average of three and a maximum of thirty-nine interest groups.

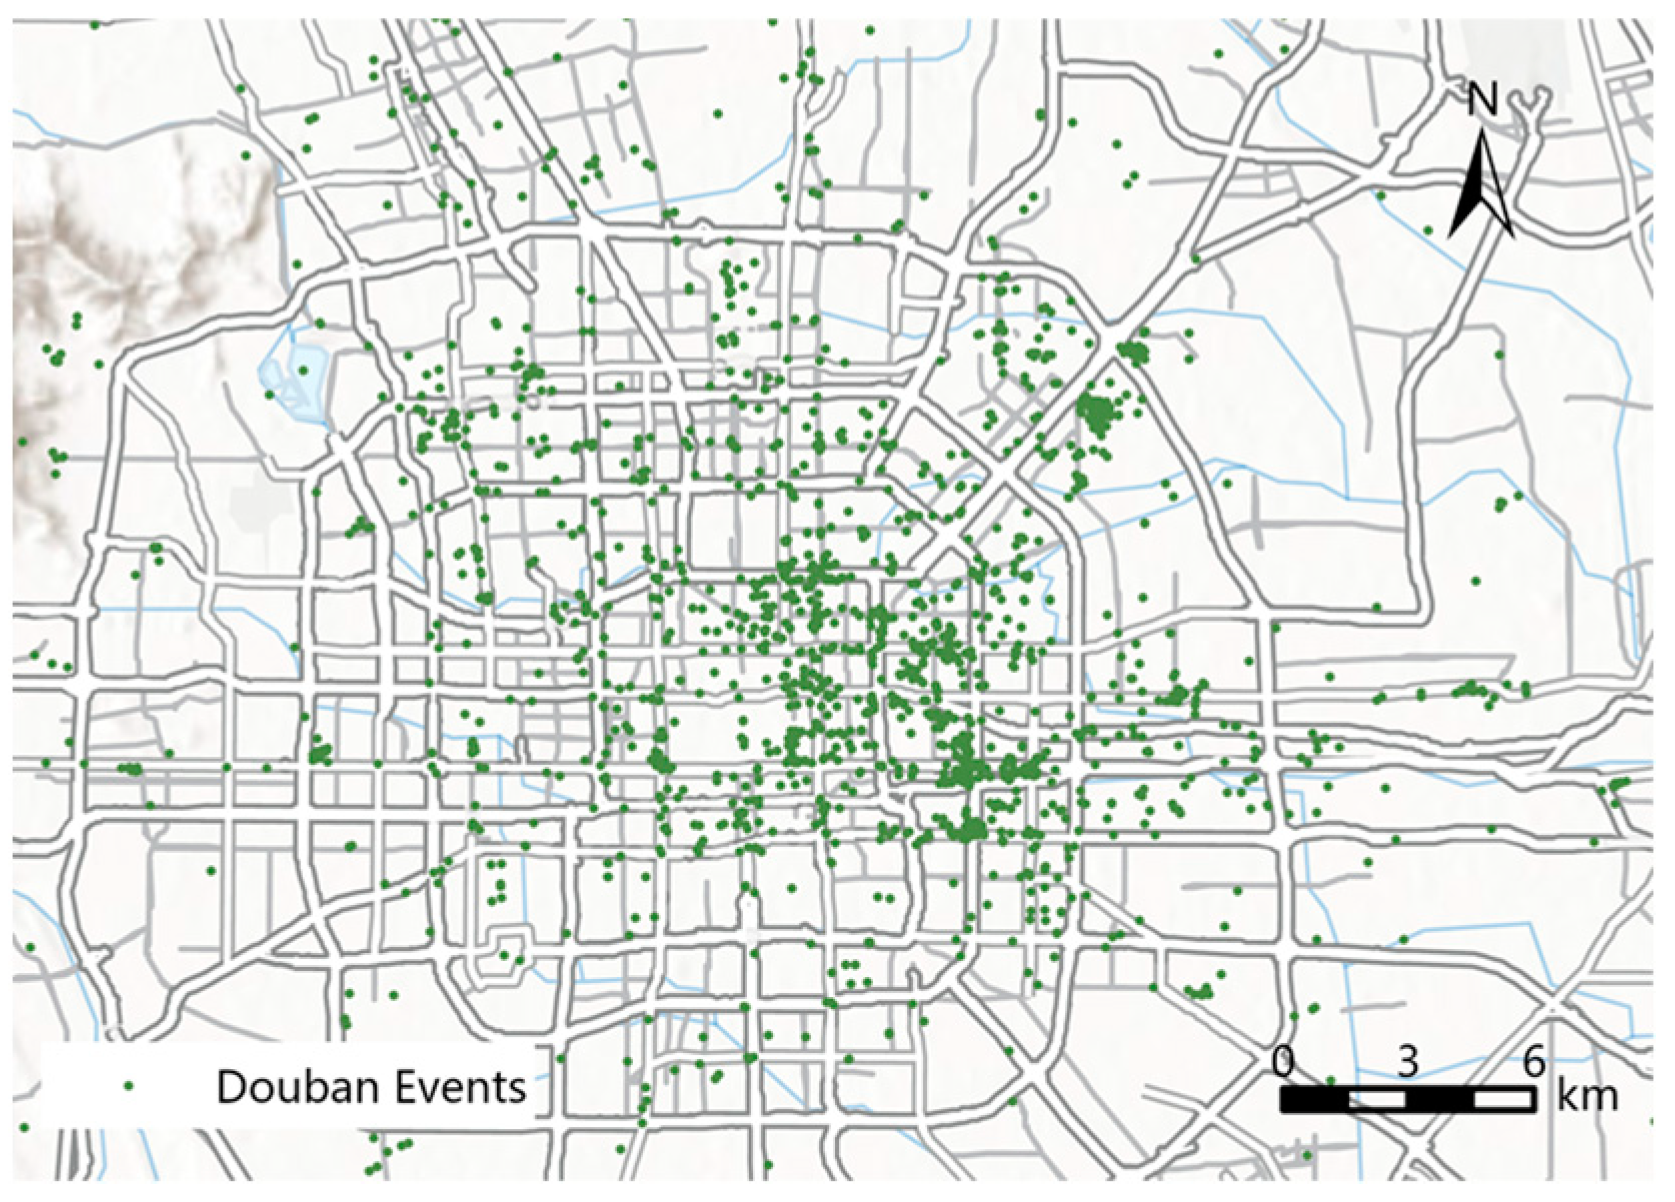
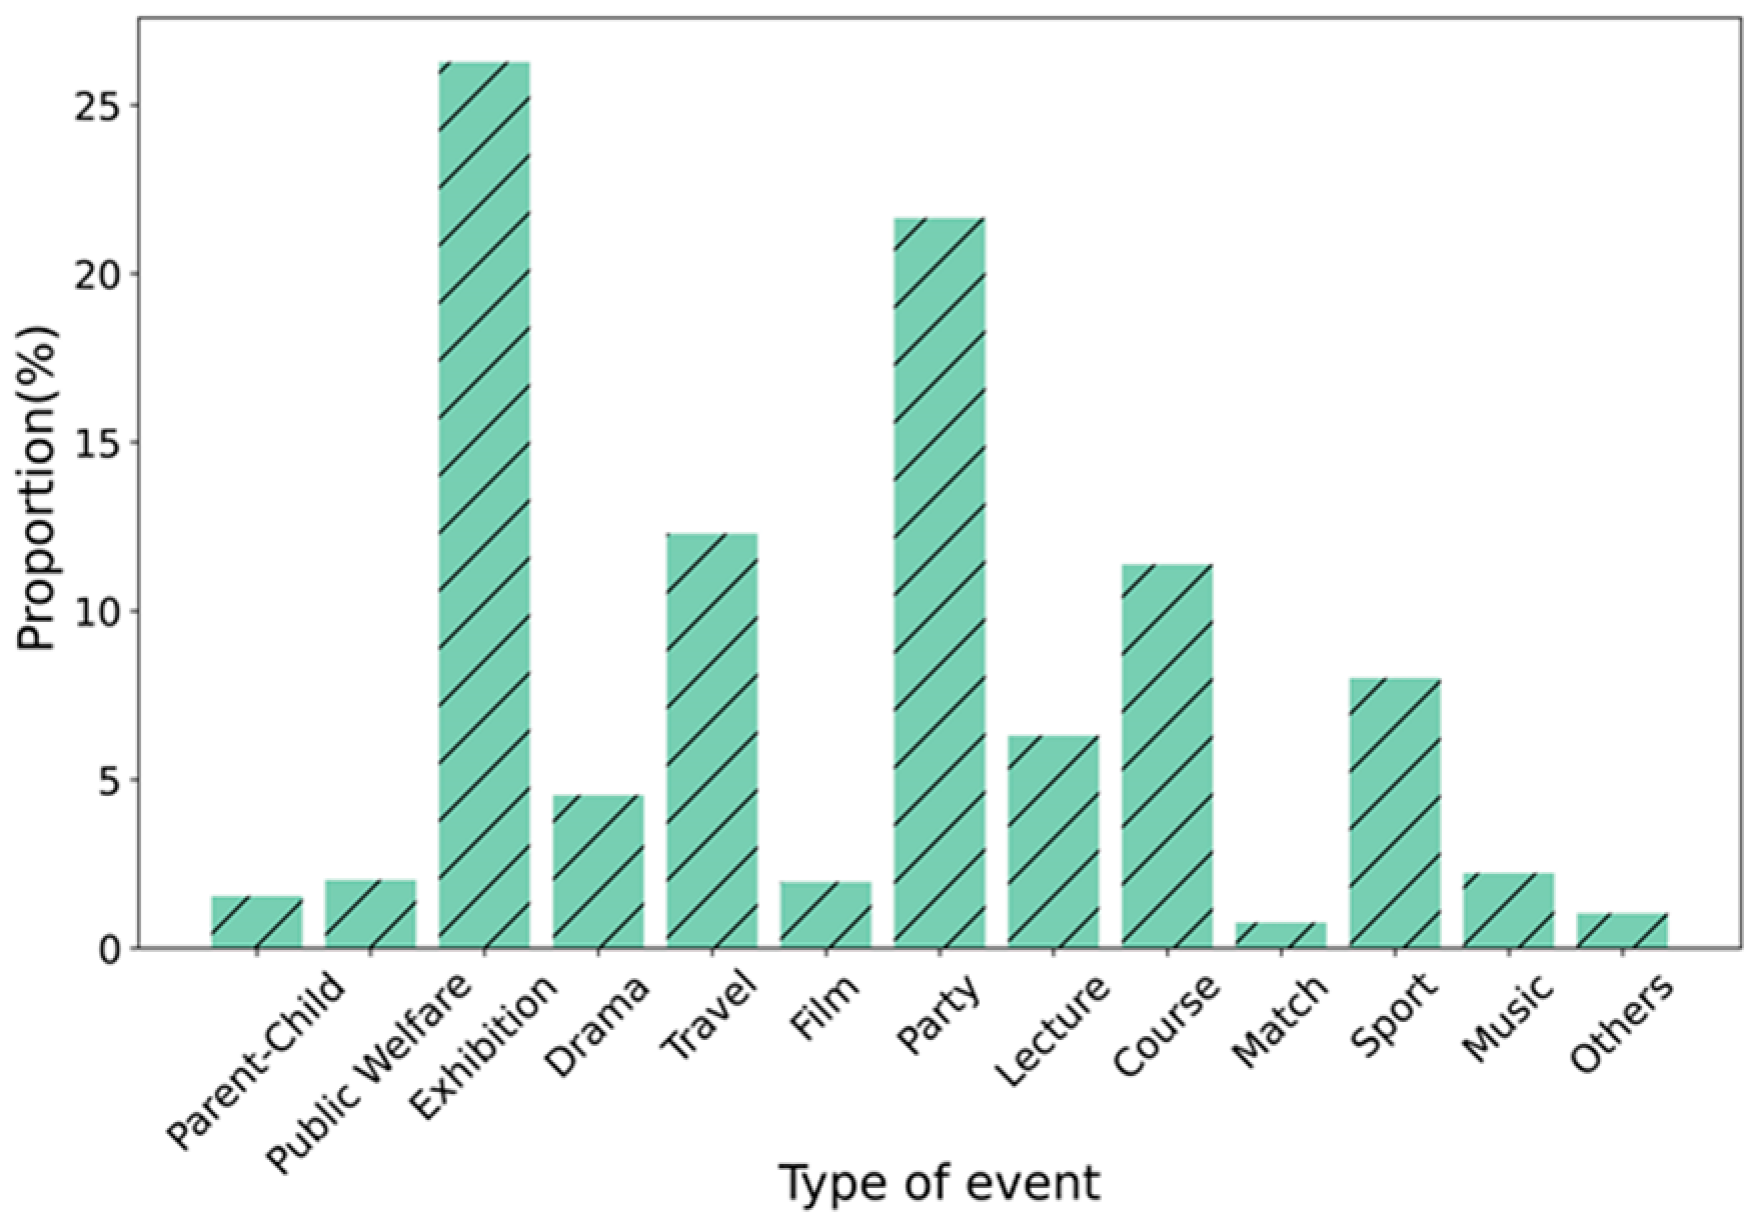
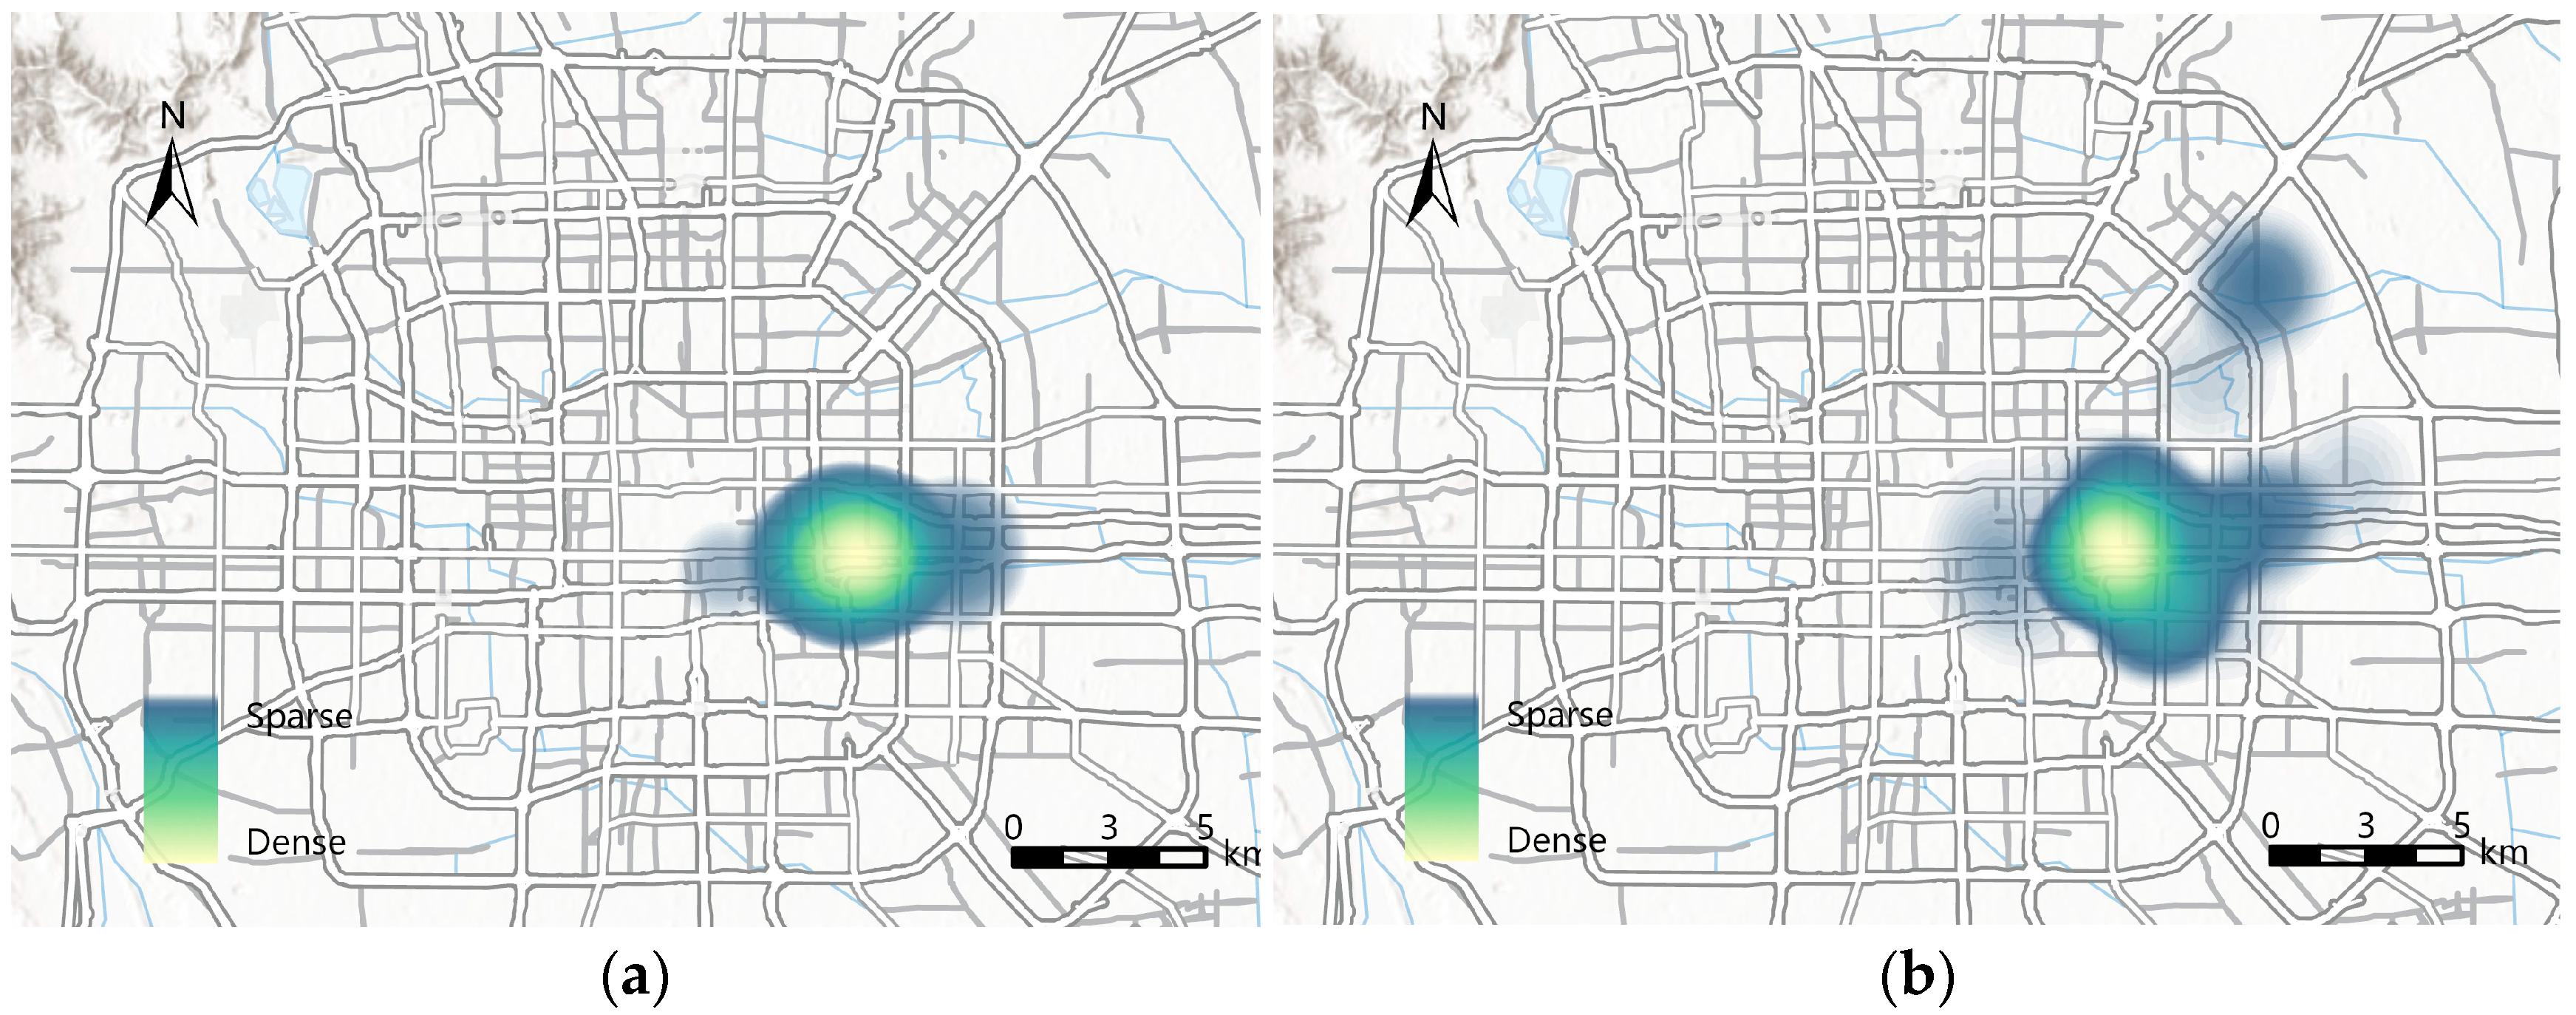
3.2. Data Characteristics

Figure 2 shows the locations of all events in our dataset. Multiple events were held at the same location. We used the DBSCAN algorithm to cluster the event locations and found that leisure activities were mostly held in business districts and scenic spots (Figure 3).
Exhibition and party events accounted for the largest share of all Douban Events, which was more than 20%, followed by those of travel and courses, which accounted for more than 10% of all events (Figure 4).
The timing of the events exhibited an apparent rhythm. Events were most frequently held on Saturdays and Sundays, accounting for more than 19% of all events; in contrast, events held on Mondays were the least frequent, accounting for 10.64% of all events (Figure 5). Moreover, the start time of the events showed similar rhythms on weekends and weekdays (Figure 6). On weekends and weekdays, the number of events that started at 10:00 was the highest, followed by those starting at 14:00, 7:00, and 19:00. There was a small gap between the number of events held at 7:00 and 14:00. Therefore, the timing of an event is a necessary factor that must be considered in an event recommendation system.
To determine the location of an event, we applied ArcGIS Pro to draw heat maps of the locations of the historical events in which a user had participated (Figure 7). As shown in Figure 7, the spatial locations of the events that a user has decided to attend appears to have obvious agglomeration characteristics and are usually concentrated in one or two central areas [17,42]. Although we do not know the user’s place of residence, we can infer that a user probably prefers to attend events close to their place of residence (Figure 7a), as well as those near their place of work or shopping (Figure 7b). Thus, spatial location is also a factor that must be considered when recommending events.

4. Methodology

4.1. Problem Definition

Definition 1.
Event: A leisure event in an EBSN is defined as a tuple e = (title, type, description, tag, time, location, cost, U). The components in e can be divided into three categories: content, context, and user set U. Content comprises title, type, description, and tag. Context comprises time, location, and cost. U is the collection of users who provide feedback that they want to participate in or are interested in the event.
Definition 2.
Social relationships of users: EBSNs contain multiple social relationships, which can mainly be divided into two classes: relationships between users and event organizers and the relationships among users. As shown in Figure 8, the relationships between users and organizers include   R p r e f e r , where the user prefers the organizer, and   R f o l l o w , where the user follows the organizer. If a user has participated in an event hosted by an organizer, it is considered that the user prefers the organizer, while   R f o l l o w represents the user’s following relationship with the organizer in EBSNs. The relationships among users include the online relationship   R g r o u p , which is among users who have joined the same interest group, as well as the offline relationship   R e v e n t , which is among users who have participated in or are interested in the same events. These relationships are shown in Figure 8, and the gray line represents the user’s participation in an event or the organizer’s organization of an event.
Definition 3.
Cold-start problem: If a user has participated in fewer than five events in the past, he/she is called an inactive user with a cold-start problem, denoted as   u i n a c t i v e . The recommendation of a newly released event can also be regarded as a cold-start problem because the event receives little feedback at the beginning of its release.

4.2. Model Overview

Based on the above definitions, the event recommendation problem can be formally described as follows: given a recently published event e and the user set U, we excavate the top-K users from U who are most likely to participate in e. To achieve the target user group for every new event, we propose an MFM for event recommendation, which includes three stages (Figure 9): user preference modelling, model training, and prediction. For the selection of hyperparameters during the model training process, we determined the optimal choices by experimenting and observing the effects.
First, we established a user preference model that includes not only the user’s event preferences but also those of their like-minded friends. We learned the user’s preferences for content and context from the historical events to which they responded as “want to participate in” or “are interested in”, and learned their friends’ preferences from their various social networks. Further, to precisely predict the users’ preferences, we introduced a nonlinear forgetting function to accommodate the changes in the users’ event preference behavior over time.
Second, considering the cold-start problem of inactive users and newly released events, we adopted the gradient-boosted regression tree (GBRT) algorithm to train the user preference models for active and inactive users, and then calculated the ‘user–event’ scoring matrices.
Finally, we constructed an event recommendation model to predict the top-K users who are most likely to participate in the event, based on the ‘user–event’ scoring matrices. Because the ‘user–event’ scoring matrices are sparse matrices, which have the majority of elements equal to zero, we employed the latent factor model (LFM) to calculate the implicit vector behind each ‘user–event’ element.

4.3. User Preference Modelling

4.3.1. User Preference for Event

  • Content
The content of an event is the key factor that influences a user’s decision to participate in it. The event content consists of the title, tag, type, and description, all of which are text data. The title, tag, and description are described by the event organizer, but the event type is selected from the 13 predefined types provided by Douban Events. Each event can have only one type.
Generally, users’ interests change over time; thus, the recent events that users participated in best reflect their current interests and preferences. To calculate the users’ current preference for an event content more precisely, we introduced a nonlinear forgetting function [43]. In this paper, the user’s forgetting coefficient of a historical event e is defined as:
h t e = α × t e t m i n t m a x t m i n 2 + 1 α .  
h t e is the coefficient of a user’s forgetting of the historical event e ;   t e is the start time of the event e ; t m i n and t m a x represent the earliest and latest times of all historical events attended by the user, respectively; and α is the parameter representing the user’s forgetting speed. α = 1 indicates complete forgetting; α = 0 indicates no forgetting, and 0 < α < 1 indicates partial forgetting. The larger the value of α , the faster the user forgets. In this study, α was taken as an empirical value of 0.6 [43].
(1)
Type features
We adopted one-hot encoding to represent the event type and calculated the similarity between the target event and historical events using cosine similarity. Moreover, we introduced the forgetting function as the weight of the cosine similarity. The closer the historical event is held, the greater is the weight. The user preference for the type of target event i is defined as follows:
f 1 = e E h ( t e ) × c o s ( T e , T i ) e U p h t e
where E is a set of historical events a user has participated in; t e is the start time of the historical event e ; h ( t e ) is the forgetting coefficient of the historical event e ; and T e and T i represent the type codes of the historical event e and target event i .
(2)
Text features
Because the title, tag, and description of an event are all text formats, we combined the three parts above into one document, from which we extracted the text topics using the LDA topic model [44]. Considering that the quality of text topic extraction largely depends on the number of topics, we explored the optimal number of text topics. As shown in Figure 10, when the number of topics is 90, the perplexity is the lowest, which means that the topic model achieves the best performance. Hence, the number of text topics was set to 90 in this study. After extracting the text topics from each event, we used the Jensen–Shannon (JS) divergence to calculate the text similarity between the target event and historical event by introducing the forgetting function as the weight of the JS divergence. The user preference for the text of the target event i is defined as follows:
f 2 = e E h ( t e ) × ( 1 J S ( θ e , θ i ) ) e U p h t e
where θ e and θ i represent the text topic vectors of the historical event e and target event i , respectively.
2.
Context
The event context is the external factor that affects a user’s decision-making regarding an event, which mainly incorporates three parts: time, spatial location, and cost of an event. We extracted the user preferences for the event context from the historical events attended by the user. Because the time of events shows an obvious rhythm over a week (Figure 5) and a day (Figure 6), we subdivided the event time characteristics into weekday and day–hour features.
(1)
Weekday feature
Because an event (e.g., an exhibition) may last for several days, spanning weekdays and weekends, we defined the weekday feature as the number of days an event is held on weekdays (from Monday to Friday) and weekends (Saturday and Sunday), which is expressed as a tuple D e . We then calculated the weekday feature similarity between the target event and historical event using cosine similarity. The user’s weekday preference for the target event i is defined as:
f 3 = e E cos D e , D i E ,
where E represents the number of historical events in which the user has participated; and D i is the tuple of the weekday feature of the target event i .
(2)
Day-hour feature
We adopted a Gaussian function to calculate the similarity of the day–hour features between the target event and historical event. The user’s day–hour preference for a target event i is defined as:
f 4 = e E e ¯ ( B e B i ) 2 2 E ,
where e ¯ is the base of the natural logarithm; and B i is the day–hour feature of the target event i .
(3)
Spatial location features
We also used a Gaussian function to calculate the spatial similarity between the target and historical events. The user’s location preference for the target event i is defined as follows:
f 5 = e E e ¯ d 2 ( L i , L e ) 2 E ,
where L i and L e indicate the spatial locations of the target and historical event, respectively; and d L i , L e denotes the Euclidean distance between L i and L e .
(4)
Cost features
In general, the price of an event affects the users’ willingness to participate in it. Kernel density estimation was used to calculate the cost similarity between the target and historical events. The user cost preference for target event i can be defined as follows:
f 6 = e U p K C i , C e U p ,
where C i and C e represent the prices of the target and historical events, respectively; and K C i , C e denotes the estimated kernel density values of C i and C e .

4.3.2. User Preference for Organizer

Users and organizers have the following relationships and preference relationships (as shown in Figure 8). If a user follows an organizer, it is likely that the user has a continuous interest in the events held by the organizer. Thus, we define the following relationship between a user and the target event organizer: when a user follows the target event organizer, the user’s follow feature f 7 = 1 ; otherwise, f 7 = 0 . If a user does not follow a certain organizer but has previously participated in the events held by the organizer, then it can be speculated that the user is likely to participate in the next event organized by the organizer. The greater the user participation in the events held by the organizer, the greater is their preference for the organizer. Hence, we defined the preference relationship between a user and the target event organizer as the number of events held by the target event organizer in which the user has participated, denoted by f 8 .

4.3.3. Event Preferences of the User’s Closest Friends

Users’ decision-making regarding events will be affected by those of their friends. We suggest that if two users join the same interest group and have participated in (or been interested in) the same event or are presently interested in the same event (as shown in Figure 8), then there may be a potential friendship between them. We also assumed that the preferences of the users’ friends are similar to those of the users. We can extract a user’s friends’ preferences for an object event from the user’s relationships through the following three steps:
① Calculate the relationship weight between the users. The relationship weight between users i and j is denoted by W i j . If users i and j join a common interest group, n u m i j represents the number of events that both users i and j have participated in (or been interested in), and g r o u p i j represents the number of interest groups that users i and j have joined:
W i j =       n u m i j ,       i f   g r o u p i j > 0           0 ,       i f   g r o u p i j = 0
② By regarding each user as a node, we establish a graph of the user’s social relationships (Figure 11) and generate the random walk sequence for each user via the random walk with a restart algorithm [45]. The random walk process is as follows:
R k =                   p r e f e r e n c e u i , e ,         i f   k = 0 1 d R 0 + d W R k 1 ,             i f   k 1
Assuming that the starting node of the random walk is the user node u i , p r e f e r e n c e u , e represents the user u ’s preference for the content and context of the target event e , which consists of f 1 ~ f 6 . R k is the vector of the node reached in step k of the random walk. W is a matrix composed of W i j , that is, the relationship weight between two users calculated using Equation (8). d is a parameter with a domain of 0–1 [38], representing the probability of taking the next step, whereas 1 d represents the probability of returning to the starting node. We adopted an empirical value of 0.85 for d [46], created a random walk sequence for each node, and then coded it.
③ The degree of intimacy between users is defined as the similarity between the code of the nodes corresponding to the users. We calculated the cosine similarity between the code of the user node u i and the code of each of the other nodes, and then selected the top five nodes with the highest similarity to user u i , representing the top five friends with the most similar preferences. According to our statistics on the Douban dataset, for over 87.6% of users, the similarity with their sixth-ranked user drops below 0.1. Therefore, we consider the top five nodes for similarity calculation. Finally, we calculated the average preference of these five friends for the target event, which served as the user’s social feature:
f s = u U u i p r e f e r e n c e ( u , e ) 5 ,
where U u i represents the collection of the five closest friends of the user u i ; and p r e f e r e n c e u , e i represents each friend’s preference for the target event e , including the content and context preference features f 1 ~ f 6 .

4.4. Model Training

The behaviors of active users differ significantly from those of inactive users. In addition, inactive users face the cold-start problem because of their limited participation in events. Therefore, to improve the event prediction accuracy of inactive users, we grouped the users into active and inactive ones. We used the events held from 1 July 2020 to 30 June 2021 as the training dataset, and trained these two types of users using the GBRT algorithm to determine the weight of each feature defined in the user preference model.
As shown in the training algorithm (Algorithm 1), the input to the algorithm comprises the user–event pair D ( u i , e i ) , event set E , organizer set O , target event e , user set U , and active user set U a c t i v e or inactive user set U i n a c t i v e . U is the union between U a c t i v e and U i n a c t i v e , and u i is from U a c t i v e or U i n a c t i v e . First, we extracted all the historical events that had received the feedback “I want to participate in” or ”I am interested in” from each user before the start of the target event, denoted by E u i . Then, we extracted the label l indicating whether a user will participate in the target event. If the user’s response to the target event is “I want to participate in” or “I am interested in”, then l is set to 1; otherwise, when the user provides no feedback, l is set to 0. Second, we modelled each user’s preference feature space from his/her historical events E u i , which included three groups of features: user preference features for the target event, user preference features for the target event organizer, and the preferences of the user’s closest friends for the target event. A user’s preference features for the target event, denoted by F e , consist of content features f 1 ~ f 2 and context features f 3 ~ f 6 . The target event’s organizer is selected from the organizer set denoted by o i . User preference features for the target event organizer, denoted by F o , include the follow feature f 7 and preference feature f 8 . In addition, the user’s closest friends’ preferences for the target event, denoted by F s , is the average value of the preference for the target event of the user’s five closest friends, extracted from his/her friend set F u i . Finally, we integrated the three groups of features F e ,   F o , F s , and label l into the training dataset, used the GBRT algorithm to train the user preference features, and obtained the user feature weight model as the output of the algorithm.
Algorithm 1. Training algorithm.
Input:  D ( u i , e i ) ,   E ,   O ,   e ,   U ,   U a c t i v e   o r   U i n a c t i v e
Output:   M o d e l G B R T
Foreach (   u i , e i ) in D ( u i , e i )  Do    //Please refer to the text above for the meaning of each variable.
       Extract ( E u i , l ) from E
        Foreach   e i   in E u i   Do
              F e = f 1 ~ f 6
        End Foreach
        Extract   o i   from O
              F o = f 7 ~ f 8
        Extract   F u i   from   U
        Foreach   u j   in   U u i   Do
              f f = sum ( p r e f e r e n c e u j , e i )
        End Foreach
              F s = f f /5
        Add ( F e ,   F o ,   F s ,   l ) to D G B R T
End Foreach

4.5. Prediction

The prediction algorithm recommends a list of users that are most likely to participate in the target event (Algorithm 2). The inputs to the algorithm comprise the user set U , the dataset of the newly released events E n e w , the dataset of the organizers of new events O n e w , and M o d e l G B R T , which is the output of the training algorithm. For a newly released event e i , we first modeled each user’s preference for e i , including the user’s preference features for the content and context of this event, denoted by F e e i ; the user’s preference features for the organizer of this event, denoted by F o e i ; and the user’s closest friends’ preferences for the event, denoted by F s e i . Secondly, based on M o d e l G B R T , the user feature weight model obtained by training, we calculated each user’s preference value v j for e i , which comprised the ‘event-user’ rating matrix M e i , v j . Considering that most users have not participated in too many events, a large number of events may receive only a small number of user feedbacks, leading to the problems of data sparsity and data skewness, as observed for the ‘event-user’ rating matrix. We introduced the LFM [47] to decompose the rating matrix and used the stochastic gradient descent method to optimize the matrix decomposition results; the user preference score matrix for new events, denoted by M p e i , u j , was then calculated. Finally, the algorithm outputs a list of top-K users who are most likely to participate in the new event e i according to the ranking of the user’s preference score for the event [48].
Algorithm 2. Prediction algorithm.
Input:  U ,   E n e w ,     O n e w ,   M o d e l G B R T
Output:  U t o p K
Foreach  e i    in  E n e w  Do    //Please refer to the text above for the meaning of each variable.
        Foreach   u j  in   Electronics 13 00112 i001  Do
                F e e i = f 1 ~ f 6
                Extract   o e i   from   O n e w
                F o e i = f 7 ~ f 8
               Extract F u i from  U
                Foreach   f k   in   F u i   Do
                      f f = sum ( p r e f e r e n c e f k , e i )
                End Foreach
                F s e i = f f /5
                v j = M o d e l G B R T ( F e e i , F o e i , F s e i )
                Add   v j  to   M ( e i , v j )
        End Foreach
End Foreach
M p ( e i , v j ) = LFM ( M ( e i , v j ) )
Foreach  e i  in  E n e w  Do
             U t o p K = topK ( M p ( e i , v j ) )
End Foreach

5. Experimental Evaluation and Discussion

5.1. Evaluation Metric

We collected the events between 1 July 2021 and 20 August 2021 as the test dataset to evaluate the performance of the MFM. The common evaluation indicators for dichotomous problems include precision, recall, and F1-score. Precision is the probability of actual participants among the recommended participants. Recall refers to the proportion of users who are recommended to participate in the event among users who actually participate in the event. Ideally, the higher the precision and recall, the better the performance is of the recommendation system. However, precision and recall are generally negatively correlated, that is, if precision is high, recall is low, and vice versa. To balance precision and recall, the F1-score, which is a harmonic mean of the precision and recall, is often used as a comprehensive indicator. However, precision, recall, and F1-score cannot be used to evaluate the accuracy of an ordered user list. Therefore, we also introduced the mean average precision (MAP) [49] and normalized discounted cumulative gain (NDCG) [50], which are commonly used in recommendation systems to evaluate the sorting precision of the recommendation list. MAP considers both the prediction precision of whether a user participates in an event and the accuracy of the ranking of the user in the recommended list. NDCG is an index used to measure the ranking correlation between the recommended list and actual list. The larger the MAP and NDCG, the better the performance of the recommendation system:
M A P @ K = i = 1 E n e w A P i E n e w , A P i = j = 1 U i 1 R j U i ,
where K is the number of users in the recommended list; E n e w is the collection of newly published events; E n e w is the number of newly published events; A P i is the average accuracy of all users in the recommended list for the i th new event; U i is the number of users in the recommendation list who actually participated in the i th event; and R j is the position of a user in the sorted recommended list in U i :
N D C G @ K = e E n e w N D C G e @ K E n e w ,
where N D C G e @ K is the discounted cumulative gain of the target event e .
In addition, we introduced two other indicators, the mean squared error (MSE) and R-square ( R 2 ) , to evaluate the fitting degree of the training model to the user’s actual preference. MSE reflects the deviation between the predicted and actual user features. The larger the MSE, the worse is the model performance. R 2 is the coefficient of determination that reflects the accuracy of the model for data fitting. Generally, R 2 ranges from 0 to 1, and a larger value of R 2 indicates a better model fitting:
M S E = 1 n i = 1 n y i y ^ i 2 ,
where y i is a real value indicating whether a user participated in an event; y ^ i is the predicted value of whether the user would participate in the event; and n is the number of training samples, that is, user–event pairs D ( u i , e i ) :
R 2 = 1 i = 1 n y i y ^ i 2 i = 1 n y i y ¯ 2 ,
The definitions of y i and n in this formula are the same as those in Equation (13). y ¯ is the average of y i .

5.2. Performance Evaluation

To verify the effectiveness of the MFM, we compared it with several state-of-the-art recommendation algorithms.
  • MP: The MP algorithm is a baseline model that evaluates user activity based on the number of events attended by a user. It considers this as an indicator of user activity and recommends the most recently active users to the target event. By prioritizing users who have recently attended many events, the MP algorithm aims to recommend users who are actively engaged in the system.
  • LBTM: The location-based topic model [51] extracts the users’ content and spatial and temporal preference features from their historical events to search for historical events similar to the target event. It then calculates the preference scores of users who participated in these historical events for the target event based on the time similarity between the historical events and the target event. Finally, it recommends the users with the highest score for the target event.
  • COBM: The context- and organizer-based model [31] is designed to solve the cold-start problem of new published events. It extracts the users’ content interest and geographical preference from the events the user has participated in and combines the influence of the event organizer for generating the recommendation.
We applied the MFM and the above three algorithms to the same Douban dataset and compared their performances. When the value of top-K changes, the precision decreases (Figure 12a) but the recall increases (Figure 12b) gradually with the increase in the value of top-K. However, regardless of the value of top-K, the precision and F1-score of the MFM are always higher than those of the other models (Figure 12c). When the top-K is 10, the recall of COBM is slightly higher than that of the MFM; even for other values of top-K, the recall of MFM is better than those of the other algorithms. It can be seen that the recommendation performance of the MFM is better than those of the other three models, which shows that integrating multiple features, introducing social relationships, and distinguishing inactive users from active users can effectively improve the performance of the event recommendation system.
Furthermore, we evaluated the correlation between the recommended user sequence and actual user list obtained using the MAP and NDCG. Regardless of the value of top-K, the MAP and NDCG of the MFM were always greater than those of the other models, indicating that the precision of the recommended user list of the MFM is better than those of the other models. With increase in top-K, the MAP of the MFM decreased gradually (Figure 12d). When top-K was greater than 30, the MAPs of the MFM and LBTM were close. However, the NDCG of the MFM (Figure 12e) was significantly higher than that of the other models, indicating that the association between the user list recommended by the MFM and the actual participants was stronger. This shows that multiple user relationships can enrich the user features, making the recommended user sequence more optimal. In contrast, LBTM depends on the content and context features for recommendations and does not consider the user relationships. COBM considers only the relationship between users and organizers, but ignores the relationship among users with the same hobby. Thus, the introduction of multiple social relationships among users can alleviate the cold-start problem of inactive users.

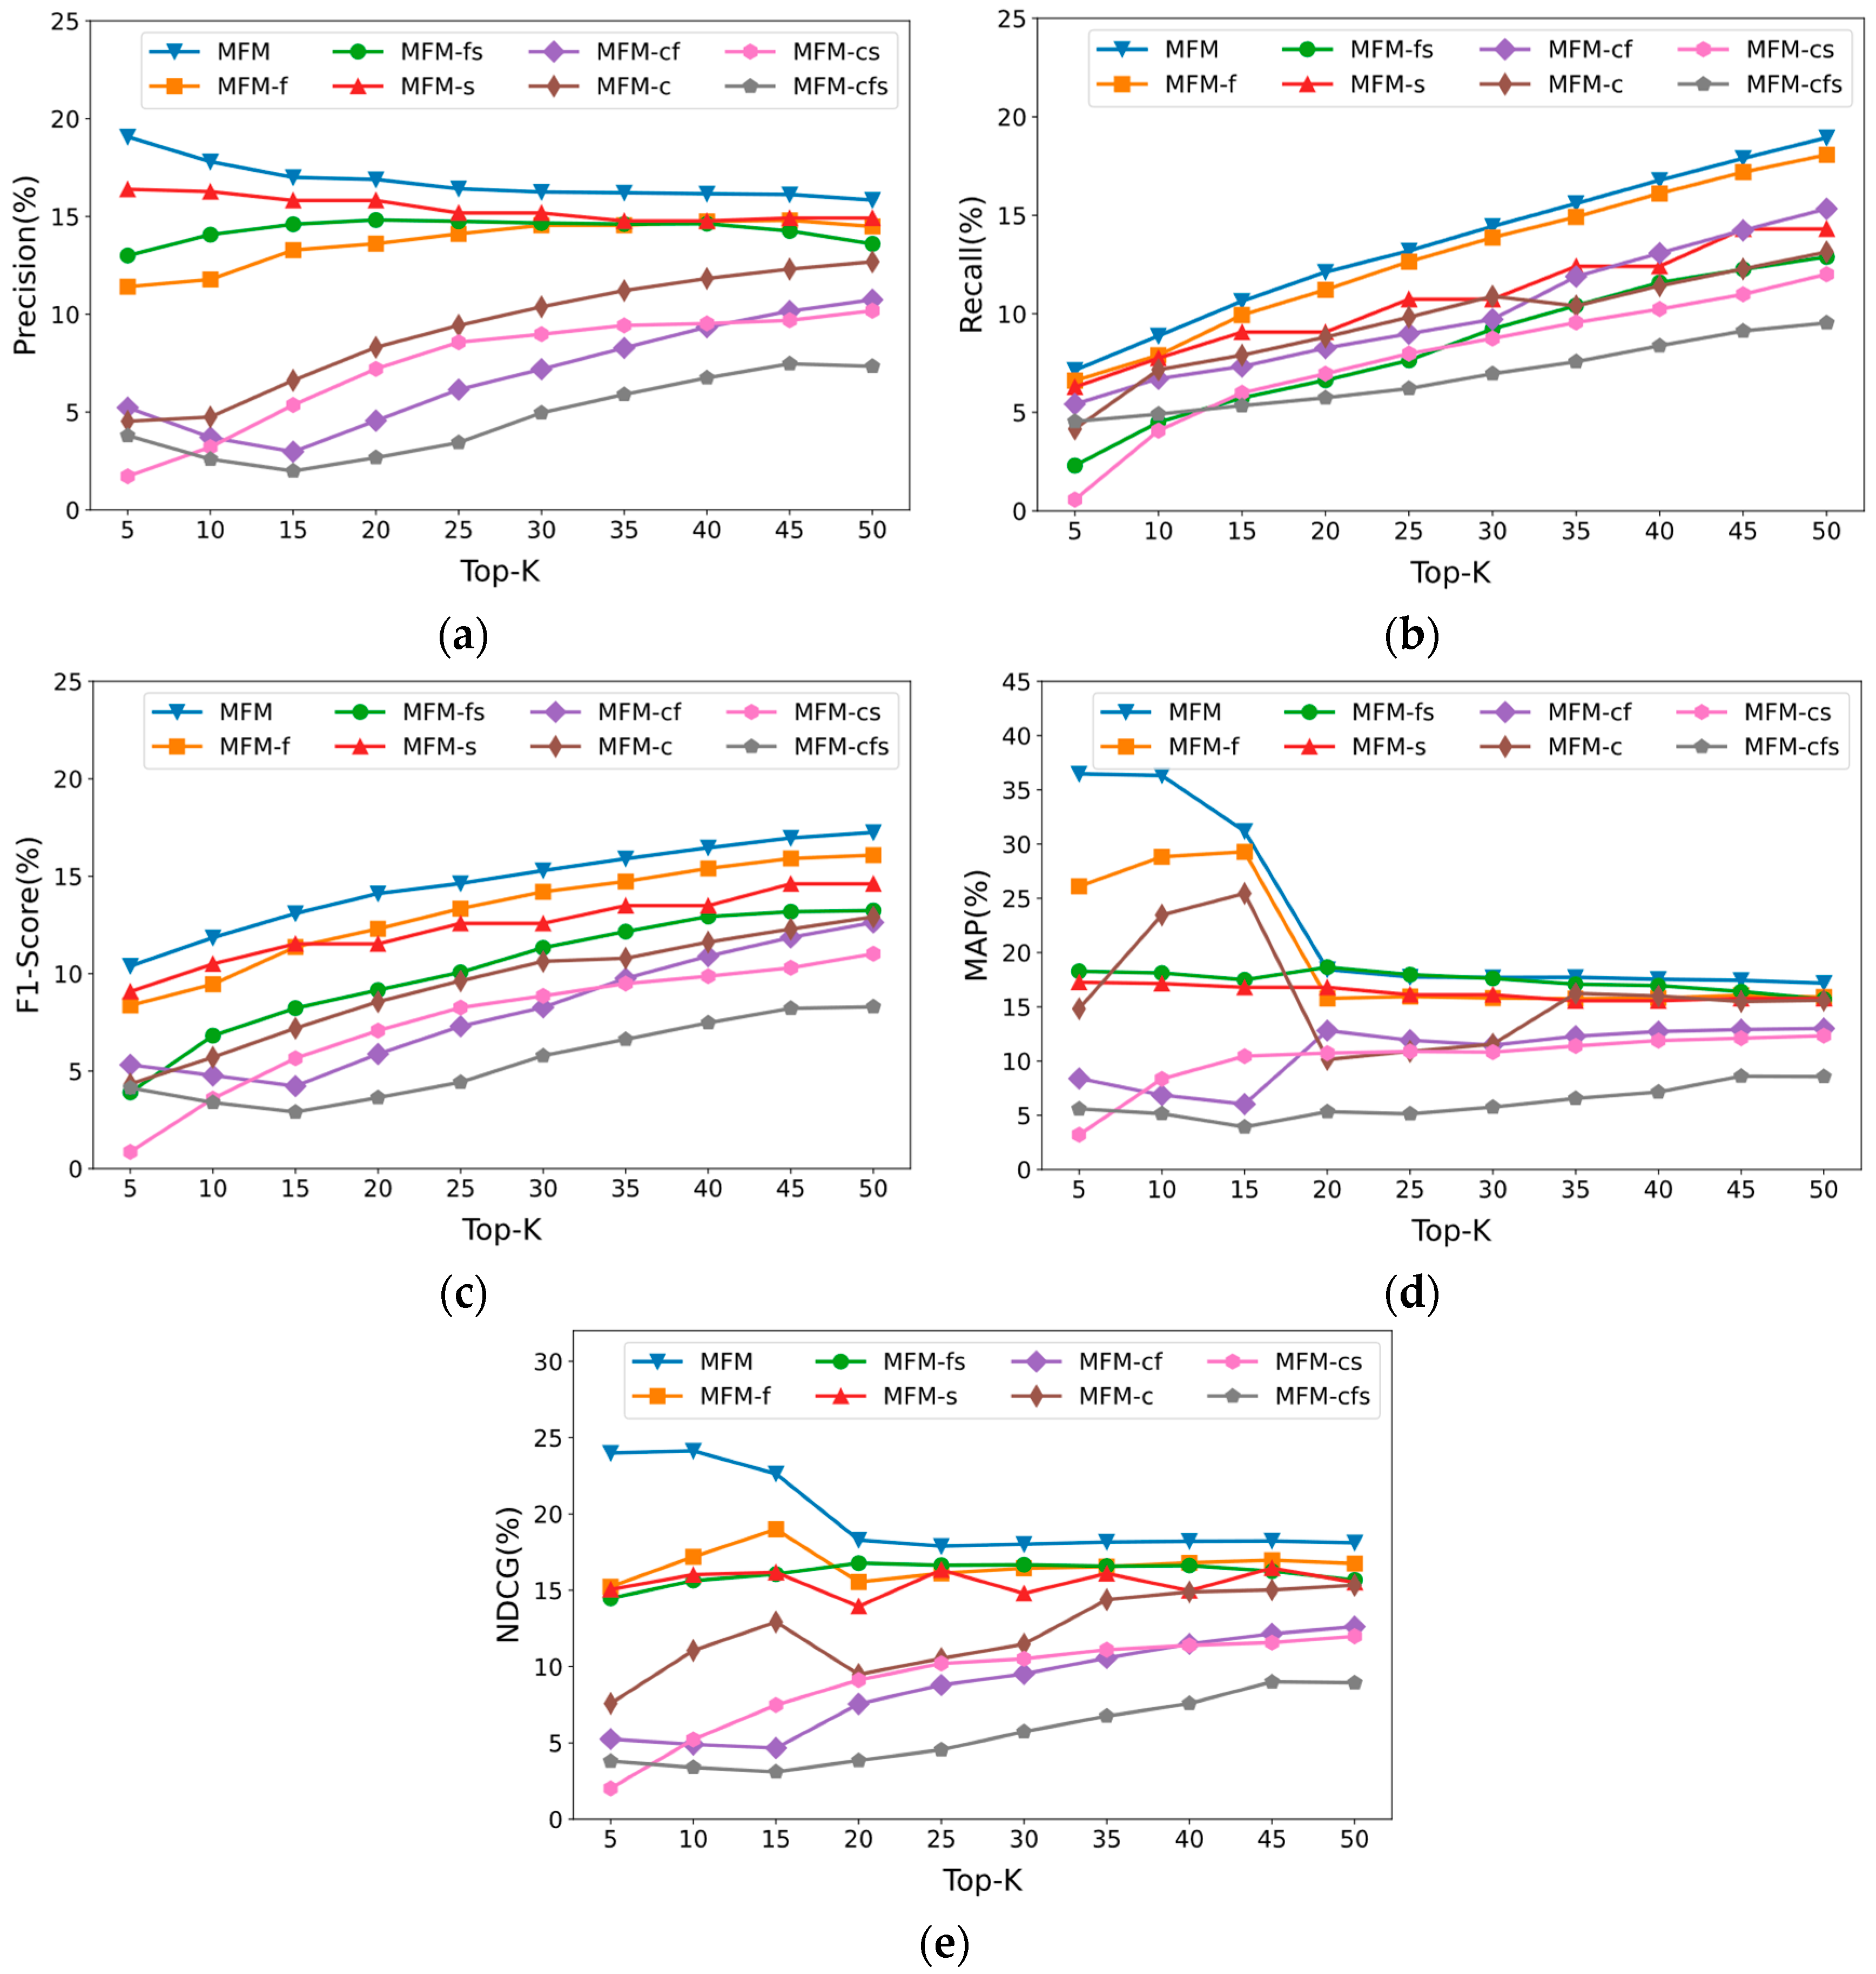
5.3. Feature Experiments

To verify the necessity of the key features introduced in this paper, that is, user activity classification, user social relationships, and changes in user preferences over time, we discarded one or more of the above features in seven experiments, as follows: ① MFM-c ignores the user activity classification; ② MFM-s ignores the user social relationships; ③ MFM-f ignores the temporal changes in the user interest; ④ MFM-cf ignores the user activity classification and change in interest; ⑤ MFM-cs ignores the user activity classification and social relationships; ⑥ MFM-fs ignores the change in user interest and social relationships; ⑦ MFM-cfs ignores all key features, that is, user activity classification, social relationships, and change in interest. We used the precision, recall, F1-score, MAP, and NDCG to compare the experimental models with MFM.
In contrast to the experimental models lacking one or more key factors, the MFM had the highest precision, recall, F1-score, MAP, and NDCG, which indicates that the introduction of key factors, that is, user activity classification, user social relationships, and user preference that change over time, can effectively improve the performance of the event recommendation system. As shown in Figure 13, the precision, recall, and F1-score of MFM-c were lower than those of MFM-s and MFM-f, and the precision of MFM-fs was higher than those of MFM-cf and MFM-cs, indicating that user activity is the most important factor in improving the accuracy of the recommendation system. We further confirmed the more important of the two factors of user social relationships and changes in interest. When top-K was less than 10, the precision of MFM-cf was higher than that of MFM-cs, whereas when top-K was between 10 and 40, the precision of MFM-cs was larger than that of MFM-cf (Figure 13a). Thus, it can be seen that when the number of recommended users is small, the users’ social relationships are more significant than the changes in their interests. When the number of recommended users is large, the changes in the users’ interests are more significant than the users’ social relationships. With the increase in top-K, the recall and F1-score of most models increases. When top-K is between 15 and 35, the models are sorted as MFM, MFM-f, MFM-s, MFM-fs, MFM-c, MFM-cs, MFM-cf, and MFM-cfs according to the decreasing order of their F1-scores (Figure 13c). It is therefore clear that the greater the number of key features that are missing, the lower is the F1-score of the model. This further verifies that introducing the user activity classification, user social relationships, and change in interest of the user can effectively improve the performance of the event recommendation system, and that user activity classification has the greatest effect on promoting the F1-score.
With the increase in top-K, the MAP and NDCG values of each model presented similar trends. When top-K was less than 20, the MAP and NDCG of the MFM were significantly higher than those of the other models (Figure 13d,e). Moreover, regardless of top-K, the NDCG of the MFM was always greater than those of the other models that ignored the key factors—user activity classification, user social relationships, and changes in user interest—that play a significant role in optimizing the recommended user list. The MAP of MFM-s was lower than those of MFM-c and MFM-f, indicating that social factors are more important than the other two factors in optimizing the order of users in the recommended list. When top-K was greater than 20, the gaps between the MAP and NDCG values of the MFM and those of the other models reduced, indicating that when the number of recommended users is relatively large, these key factors have a minor influence on the ranking accuracy of the recommended list.

5.4. Comparison of Training Methods

We employed the GBRT as the algorithm for the training model in this study. To verify the performance of the algorithm applied to the training model, we compared it with three popular supervised learning algorithms—logical regression (LR), support vector regression (SVR), and RF—and used the MSE and R 2 to evaluate the performances of the four algorithms when applied to the datasets of all users, active users, and inactive users.
As shown in Figure 14, the MSE of the four algorithms for the dataset of active users were significantly lower than those for inactive users. R 2 for active users was significantly higher than that for inactive users. Further, the MSE and R 2 for the datasets of all users were between those of active users and inactive users, indicating that the fitting effect of each algorithm on the feature model of active users was obviously better than that of inactive users, which may have been caused by the sparsity of the inactive user dataset. By comprehensively evaluating the performances of the four algorithms on the three datasets, we found that GBRT had the largest R 2 and the smallest MSE, thus showing the best performance. LR had the smallest R 2 and largest MSE, thus showing the worst performance. R 2 of RF was worse than that of GBRT but better than that of SVR. The results of ensemble learning, applied to GBRT and RF, are a combination of several weak classifiers, which show good stability; therefore, GBRT and RF are superior to LR and SVR. All decision trees of RF have the same weight, and the final result is obtained by majority voting. However, the weak classifiers of GBRT have different weights; hence, its final result can be calculated using the weighted method of the results of all weak classifiers. Thus, GBRT had a higher goodness of fit than RF.

6. Conclusions

This paper presents a novel method called multiple-feature-based leisure event recommendation (MFM) that aims to enhance event suggestions in event-based social networks. The MFM method incorporates multiple features, including user preferences, friends’ preferences, and the distinction between active and inactive users. Through experimental evaluations, MFM demonstrates a significant improvement in recommendation precision, achieving a minimum increase of 7.9% compared to baseline models. This approach effectively addresses cold-start issues and enhances the accuracy of event recommendations.
In summary, the key contributions of this study include resolving the cold-start problem by training preference models for both active and inactive users, incorporating multiple social relationships to comprehensively model user preferences, and introducing a forgetting function to preferences accurately capture users’ recent event. These contributions enhance the precision, NDCG, and MAP metrics of the event recommendation system, demonstrating the effectiveness of the proposed MFM method.
The theoretical significance of this work lies in the development of an advanced recommendation method that leverages multiple features to enhance the quality of event suggestions. By considering user preferences, friends’ preferences, and user activity levels, MFM provides a more comprehensive and personalized recommendation system for leisure events. This theoretical contribution contributes to the field of event-based social networks and expands the understanding of recommendation algorithms.
In practical terms, the proposed MFM method offers valuable implications for event-based social networks and related applications. By improving the precision of event recommendations, it enhances user experience and engagement within these networks. The consideration of user preferences and social connections helps address the cold-start problem, where new or inactive users often face limited recommendations. This method can be applied in various domains, such as event planning platforms, social networking applications, and personalized leisure activity recommendations, to provide users with more accurate and relevant event suggestions.
One limitation of the proposed event recommendation method in this study is that it relies solely on offline event data. The system does not take into account real-time user interactions or feedback. By not considering users’ online behavior and feedback, the system may miss out on valuable information that could enhance the accuracy and relevance of event recommendations. Incorporating online user activity and feedback would provide a more dynamic and personalized experience for users, allowing the system to adapt and improve over time based on their preferences and interactions. Future research should explore methods to integrate online user behavior and feedback into the event recommendation system to overcome this limitation and enhance its performance.
In addition, there are several further directions for improvement in this work. Firstly, considering that multiple events often occur simultaneously, users can only choose one event to attend at a given time. This implies that the event a user selects reflects their genuine interest when multiple events coincide. In future research, we can identify conflicting event pairs from historical events and optimize the feature weights of active users to more accurately determine their preferences for leisure events. Secondly, incorporating new similarity methods [52,53] can enhance the calculation of similarity between heterogeneous event sequences. These methods can provide more robust and accurate measures of similarity, leading to improved event recommendations. Lastly, the application of deep learning techniques in recommendation systems has shown promising results. Our plan is to leverage graph neural networks to optimize the communication of interests among users, capture intricate user relationships, obtain more precise user preferences, and effectively address the cold-start problem. By utilizing deep learning, we aim to enhance the performance and personalization of the event recommendation system.

Author Contributions

Y.W.: methodology, programming, investigation, and writing original draft; X.P.: conceptualization, methodology, software, investigation, writing original draft, and supervision; Y.N. and Z.G.: validation, resources, review and editing. All authors have read and agreed to the published version of the manuscript.

Funding

This work was supported by a grant from State Key Laboratory of Resources and Environmental Information System; Beijing Key Laboratory of Urban Spatial Information Engineering (NO. 20230106); the Academic Research Projects of Beijing Union University (No. ZK70202002).

Data Availability Statement

The data that support the findings of this study are not openly available due to sensitivity but are available from the corresponding author upon reasonable request.

Conflicts of Interest

The authors declare no conflicts of interest.

References

  1. Park, S.; Choi, B.; Choi, C.; Kang, J.M.; Lee, J. Relationship between education, leisure activities, and cognitive functions in older adults. Aging Ment Health 2019, 23, 1651–1660. [Google Scholar] [CrossRef] [PubMed]
  2. Pressman, S.D.; Matthews, K.A.; Cohen, S.; Martire, L.M.; Scheier, M.; Baum, A.; Schulz, R. Association of enjoyable leisure activities with psychological and physical well-being. Psychosom. Med. 2009, 71, 725. [Google Scholar] [CrossRef] [PubMed]
  3. Zhang, J.; Zheng, Y. How do academic stress and leisure activities influence college students’ emotional well-being? A daily diary investigation. J. Adolesc. 2017, 60, 114–118. [Google Scholar] [CrossRef] [PubMed]
  4. Fancourt, D.; Aughterson, H.; Finn, S.; Walker, E.; Steptoe, A. How leisure activities affect health: A narrative review and multi-level theoretical framework of mechanisms of action. Lancet Psychiatry 2021, 8, 329–339. [Google Scholar] [CrossRef] [PubMed]
  5. Wendel-Vos, G.W.; Schuit, A.J.; Tijhuis, M.A.R.; Kromhout, D. Leisure time physical activity and health-related quality of life: Cross-sectional and longitudinal associations. Qual Life Res. 2004, 13, 667–677. [Google Scholar] [CrossRef] [PubMed]
  6. Liu, X.; He, Q.; Tian, Y.; Lee, W.C.; McPherson, J.; Han, J. Event-based social networks: Linking the online and offline social worlds. In Proceedings of the 18th ACM SIGKDD International Conference on Knowledge Discovery and Data Mining, Beijing, China, 12–16 August 2012. [Google Scholar]
  7. Yu, Z.; Du, R.; Guo, B.; Xu, H.; Gu, T.; Wang, Z.; Zhang, D. Who should I invite for my party? Combining user preference and influence maximization for social events. In Proceedings of the 2015 ACM International Joint Conference on Pervasive and Ubiquitous Computing (UbiComp ‘15), Osaka, Japan, 7–11 September 2015. [Google Scholar]
  8. Zhang, X.; Zhao, J.; Cao, G. Who will attend?—Predicting event attendance in event-based social network. In Proceedings of the 16th IEEE International Conference on Mobile Data Management, Pittsburgh, PA, USA, 15–18 June 2015. [Google Scholar]
  9. Xu, M.; Liu, S. Semantic-enhanced and context-aware hybrid collaborative filtering for event recommendation in event-based social networks. IEEE Access 2019, 7, 17493–17502. [Google Scholar] [CrossRef]
  10. Wang, Z.; He, P.; Shou, L.; Chen, K.; Wu, S.; Chen, G. Toward the new item problem: Context-enhanced event recommendation in event-based social networks. In Proceedings of the 37th European Conference on Information Retrieval (ECIR 2015), Vienna, Austria, 29 March–2 April 2015. [Google Scholar]
  11. Wang, Z.; Zhang, Y.; Li, Y.; Wang, Q.; Xia, F. Exploiting social influence for context-aware event recommendation in event-based social networks. In Proceedings of the IEEE Conference on Computer Communications (IEEE INFOCOM 2017), Atlanta, GA, USA, 1–4 May 2017. [Google Scholar]
  12. Chin, A.; Tian, J.; Han, J.; Niu, J. A study of offline events and its influence on online social connections in douban. In Proceedings of the 2013 IEEE International Conference on Green Computing and Communications and IEEE Internet of Things and IEEE Cyber, Physical and Social Computing, Beijing, China, 20–23 August 2013. [Google Scholar]
  13. Liao, Y.; Lam, W.; Bing, L.; Shen, X. Joint modeling of participant influence and latent topics for recommendation in event-based social networks. ACM Trans. Inf. Syst. 2018, 36, 1–31. [Google Scholar] [CrossRef]
  14. Liu, C.Y.; Zhou, C.; Wu, J.; Xie, H.; Hu, Y.; Guo, L. Cpmf: A collective pairwise matrix factorization model for upcoming event recommendation. In Proceedings of the 2017 International Joint Conference on Neural Networks (IJCNN), Anchorage, AK, USA, 14–19 May 2017. [Google Scholar]
  15. Zhang, W.; Wang, J. A collective bayesian poisson factorization model for cold-start local event recommendation. In Proceedings of the 21th ACM SIGKDD International Conference on Knowledge Discovery and Data Mining (KDD ‘15), Sydney, Australia, 10–13 August 2015. [Google Scholar]
  16. Zhu, Y.; Zhong, E.; Pan, S.J.; Wang, X.; Zhou, M.; Yang, Q. Predicting user activity level in social networks. In Proceedings of the 22nd ACM International Conference on Information & Knowledge Management (CIKM ‘13), New York, NY, USA, 27 October 2013–1 November 2013. [Google Scholar]
  17. Du, R.; Yu, Z.; Mei, T.; Wang, Z.; Wang, Z.; Guo, B. Predicting activity attendance in event-based social networks: Content, context and social influence. In Proceedings of the 2014 ACM International Joint Conference on Pervasive and Ubiquitous Computing (UbiComp 2014), Seattle, WA, USA, 13–17 September 2014. [Google Scholar]
  18. Xu, T.; Zhong, H.; Zhu, H.; Xiong, H.; Chen, E.; Liu, G. Exploring the impact of dynamic mutual influence on social event participation. In Proceedings of the 2015 SIAM International Conference on Data Mining (SDM15), Vancouver, BC, Canada, 30 April 2015–2 May 2015. [Google Scholar]
  19. Li, M.; Huang, D.; Wei, B.; Wang, C.D. Event recommendation via collective matrix factorization with event-user neighborhood. In Proceedings of the International Conference on Intelligent Science and Big Data Engineering (IScIDE 2017), Dalian, China, 22–23 September 2017. [Google Scholar]
  20. Liu, S.; Wang, B.; Xu, M. Event recommendation based on graph random walking and history preference reranking. In Proceedings of the 40th International ACM SIGIR Conference on Research and Development in Information Retrieval (SIGIR ‘17), New York, NY, USA, 7–11 August 2017. [Google Scholar]
  21. Wu, C.; Wang, J.; Liu, J.; Liu, W. Recurrent neural network based recommendation for time heterogeneous feedback. Knowl.-Based Syst. 2016, 109, 90–103. [Google Scholar] [CrossRef]
  22. Cornelis, C.; Guo, X.; Lu, J.; Zhang, G. A Fuzzy Relational Approach to Event Recommendation. In Proceedings of the 2nd Indian International Conference on Artificial Intelligence (IICAI-05), Pune, India, 20–22 December 2005. [Google Scholar]
  23. Zhang, Y.; Wu, H.; Panangadan, A.; Prasanna, V.K. Integration of heterogeneous web services for event-based social networks. In Proceedings of the 2015 IEEE International Conference on Information Reuse and Integration (IRI ‘15), Washington, DC, USA, 13–15 August 2015. [Google Scholar]
  24. Wang, Y.; Tang, J. Event2Vec: Learning event representations using spatial-temporal information for recommendation. In Proceedings of the 23rd Pacific-Asia Conference on Knowledge Discovery and Data Mining (PAKDD 2019), Macau, China, 14–17 April 2019. [Google Scholar]
  25. Ma, T.; Chen, R.; Zhou, F.; Wang, S.; Wang, X. Context based multi-source feature aware event recommendation algorithm. In Proceedings of the 2020 5th International Conference on Mechanical, Control and Computer Engineering (ICMCCE), Harbin, China, 25–27 December 2020. [Google Scholar]
  26. Rendle, S.; Freudenthaler, C.; Gantner, Z.; Lars, S.T. Bpr: Bayesian personalized ranking from implicit feedback. In Proceedings of the 25th Conference on Uncertainty in Artificial Intelligence (UAI ‘09), Montreal, QC, Canada, 18–21 June 2009. [Google Scholar]
  27. Koren, Y.; Bell, R.; Volinsky, C. Matrix factorization techniques for recommender systems. Computer 2009, 42, 30–37. [Google Scholar] [CrossRef]
  28. Singh, A.P.; Gordon, G.J. Relational learning via collective matrix factorization. In Proceedings of the 14th ACM SIGKDD International Conference on Knowledge Discovery and Data Mining (KDD ‘08), Las Vegas, NV, USA, 24–27 August 2008. [Google Scholar]
  29. Koren, Y. Factorization meets the neighborhood: A multifaceted collaborative filtering model. In Proceedings of the 14th ACM SIGKDD International Conference on Knowledge Discovery and Data Mining (KDD ‘08), Las Vegas, NV, USA, 24–27 August 2008. [Google Scholar]
  30. Jiang, J.Y.; Li, C.T. Analyzing social event participants for a single organizer. In Proceedings of the 10th International AAAI Conference on Web and Social Media (ICWSM-16), Cologne, Germany, 17–20 May 2016. [Google Scholar]
  31. Li, S.; Cheng, X.; Su, S.; Sun, H. Exploiting organizer influence and geographical preference for new event recommendation. Expert Syst. 2017, 34, e12190. [Google Scholar] [CrossRef]
  32. Minkov, E.; Charrow, B.; Ledlie, J.; Teller, S.; Jaakkola, T. Collaborative future event recommendation. In Proceedings of the 19th ACM International Conference on Information and Knowledge Management-CIKM’10; ACM Press: New York, NY, USA, 2010; p. 819. [Google Scholar]
  33. Hoang, D.T.; Tran, V.C.; Dosam, H.B. Social network-based event recommendation. In Lecture Notes in Computer Science; Springer International Publishing: Cham, Switzerland, 2017; Volume 10448. [Google Scholar]
  34. Zhang, Y.; Wu, H.; Sorathia, V.; Prasanna, V.K. Event recommendation in social networks with linked data enablement. In Proceedings of the 15th International Conference on Enterprise Information Systems-Volume 2: ICElS, Angers, France, 4–7 July 2013; pp. 371–379. [Google Scholar]
  35. Li, X.; Cheng, X.; Su, S.; Li, S.; Yang, J. A hybrid collaborative fi ltering model for social in fluence prediction in event-based social networks. Neurocomputing 2016, 230, 197–209. [Google Scholar] [CrossRef]
  36. Ogundele, T.J.; Member, S. SoCaST: Personalized Event Recommendations for Event-Based Social Networks: A Multi-Criteria Decision Making Approach. IEEE Access 2018, 6, 27579–27592. [Google Scholar] [CrossRef]
  37. Pham, T.A.N.; Li, X.; Cong, G.; Zhang, Z. A general graph-based model for recommendation in event-based social networks. In Proceedings of the 2015 IEEE 31st International Conference on Data Engineering (ICDE), Seoul, Republic of Korea, 13–17 April 2015. [Google Scholar]
  38. Li, B.; Wang, B.; Mo, Y.; Yang, L.T. A novel random walk and scale control method for event recommendation. In Proceedings of the 2016 Intl IEEE Conferences on Ubiquitous Intelligence & Computing, Advanced and Trusted Computing, Scalable Computing and Communications, Cloud and Big Data Computing, Internet of People, and Smart World Congress (UIC/ATC/ScalCom/CBDCom/IoP/SmartWorld), Toulouse, France, 18–21 July 2016. [Google Scholar]
  39. Jamali, M.; Ester, M. A matrix factorization technique with trust propagation for recommendation in social networks. In Proceedings of the 4th ACM Conference on Recommender Systems (RecSys ‘10), Barcelona, Spain, 26–30 September 2010. [Google Scholar]
  40. Ma, T.; Chen, R.; Zhou, F.; Wang, S.; Wang, X. Social Event Recommendation Based on Social Relationship and Attention Mechanism. In Proceedings of the 2021 6th International Conference on Mathematics and Artificial Intelligence (ICMAI 2021), Chengdu, China, 19–21 March 2021. [Google Scholar]
  41. Li, R.; Lv, S.; Zhu, H.; Song, X. Spatial-Temporal Topic Model for Cold-Start Event Recommendation. IEEE Access 2020, 8, 214050–214060. [Google Scholar] [CrossRef]
  42. Daly, E.M.; Geyer, W. Effective event discovery: Using location and social information for scoping event recommendations. In Proceedings of the 5th ACM Conference on Recommender Systems (RecSys ‘11), Chicago, IL, USA, 23–27 October 2011. [Google Scholar]
  43. Liu, C.C. Search recommendation model based on user search behavior and gradual forgetting collaborative filtering strategy. J. China Univ. Posts Telecommun. 2010, 17, 110–117. [Google Scholar] [CrossRef]
  44. Blei, D.M.; Ng, A.Y.; Jordan, M.I. Latent dirichlet allocation. J. Mach. Learn. Res. 2003, 3, 993–1022. [Google Scholar]
  45. Jamali, M.; Ester, M. Trustwalker: A random walk model for combining trust-based and item-based recommendation. In Proceedings of the 15th ACM SIsGKDD International Conference on Knowledge Discovery and Data Mining (KDD ‘09), Paris, France, 28 June 2009–1 July 2009. [Google Scholar]
  46. Zhang, S.; Lv, Q. Hybrid EGU-based group event participation prediction in event-based social networks. Knowl.-Based Syst. 2018, 143, 19–29. [Google Scholar] [CrossRef]
  47. Lancichinetti, A.; Fortunato, S.; Kertész, J. Detecting the overlapping and hierarchical community structure in complex networks. New J. Phys. 2009, 11, 033015. [Google Scholar] [CrossRef]
  48. Jiang, J.Y.; Li, C.T. Who should I invite: Predicting event participants for a host user. Knowl. Inf. Syst. 2019, 59, 629–650. [Google Scholar] [CrossRef]
  49. Hannon, J.; Bennett, M.; Smyth, B. Recommending twitter users to follow using content and collaborative filtering approaches. In Proceedings of the 4th ACM Conference on Recommender Systems (RecSys ‘10), Barcelona, Spain, 26–30 September 2010. [Google Scholar]
  50. Järvelin, K.; Kekäläinen, J. Cumulated gain-based evaluation of IR techniques. ACM Trans. Inf. Syst. 2002, 20, 422–446. [Google Scholar] [CrossRef]
  51. Trinh, T.; Nguyen, N.T.; Wu, D.; Huang, J.Z.; Emara, T.Z. A new location-based topic model for event attendees recommendation. In Proceedings of the 2019 IEEE-RIVF International Conference on Computing and Communication Technologies (RIVF), Danang, Vietnam, 20–22 March 2019. [Google Scholar]
  52. Cauteruccio, F.; Stamile, C.; Terracina, G.; Ursino, D.; Sappey-Mariniery, D. An automated string-based approach to White Matter fiber-bundles clustering. In Proceedings of the 2015 International Joint Conference on Neural Networks (IJCNN), Killarney, Ireland, 12–17 July 2015; pp. 1–8. [Google Scholar]
  53. Cauteruccio, F.; Stamile, C.; Terracina, G.; Ursino, D.; Sappey-Mariniery, D. An automated string-based approach to extracting and characterizing White Matter fiber-bundles. Compt. Biol. Med. 2016, 77, 64–75. [Google Scholar] [CrossRef] [PubMed]
Figure 1. Relationships between users and events.
Electronics 13 00112 g001
Figure 2. Spatial distribution of events.
Electronics 13 00112 g002
Figure 3. Spatial aggregation of events.
Electronics 13 00112 g003
Figure 4. Types of events and their distribution.
Electronics 13 00112 g004
Figure 5. Day of events in a week and their distribution.
Electronics 13 00112 g005
Figure 6. Start time of events in a day and their distribution.
Electronics 13 00112 g006
Figure 7. Heat map of events attended by a user: (a) one hot spot; (b) two hot spots.
Electronics 13 00112 g007
Figure 8. User social graph.
Electronics 13 00112 g008
Figure 9. Relationship between users and events.
Electronics 13 00112 g009
Figure 10. Perplexity corresponding to the number of topics.
Electronics 13 00112 g010
Figure 11. Users’ social relationships: (a) graph of 50 users’ social relationships; (b) graph of 100 users’ social relationships; (c) graph of 150 users’ social relationships.
Electronics 13 00112 g011
Figure 12. Model performance evaluation. (a) Precision of models; (b) recall of models; (c) F1-score of models; (d) MAP of models; (e) NDCG of models.
Electronics 13 00112 g012
Figure 13. Comparative experiments of introducing different key features: (a) precision of models; (b) recall of models; (c) F1-score of models; (d) MAP of models; (e) NDCG of models.
Electronics 13 00112 g013
Figure 14. Comparison of different training algorithms. (a) MSE of training algorithms; (b) R 2 of training algorithms.
Electronics 13 00112 g014
Disclaimer/Publisher’s Note: The statements, opinions and data contained in all publications are solely those of the individual author(s) and contributor(s) and not of MDPI and/or the editor(s). MDPI and/or the editor(s) disclaim responsibility for any injury to people or property resulting from any ideas, methods, instructions or products referred to in the content.

