
Design of Vessel Data Lakehouse with Big Data and AI Analysis Technology for Vessel Monitoring System


Abstract
:1. Introduction
2. Related Work
2.1. Data Lakehouse
2.2. VMS and Vessel Applications
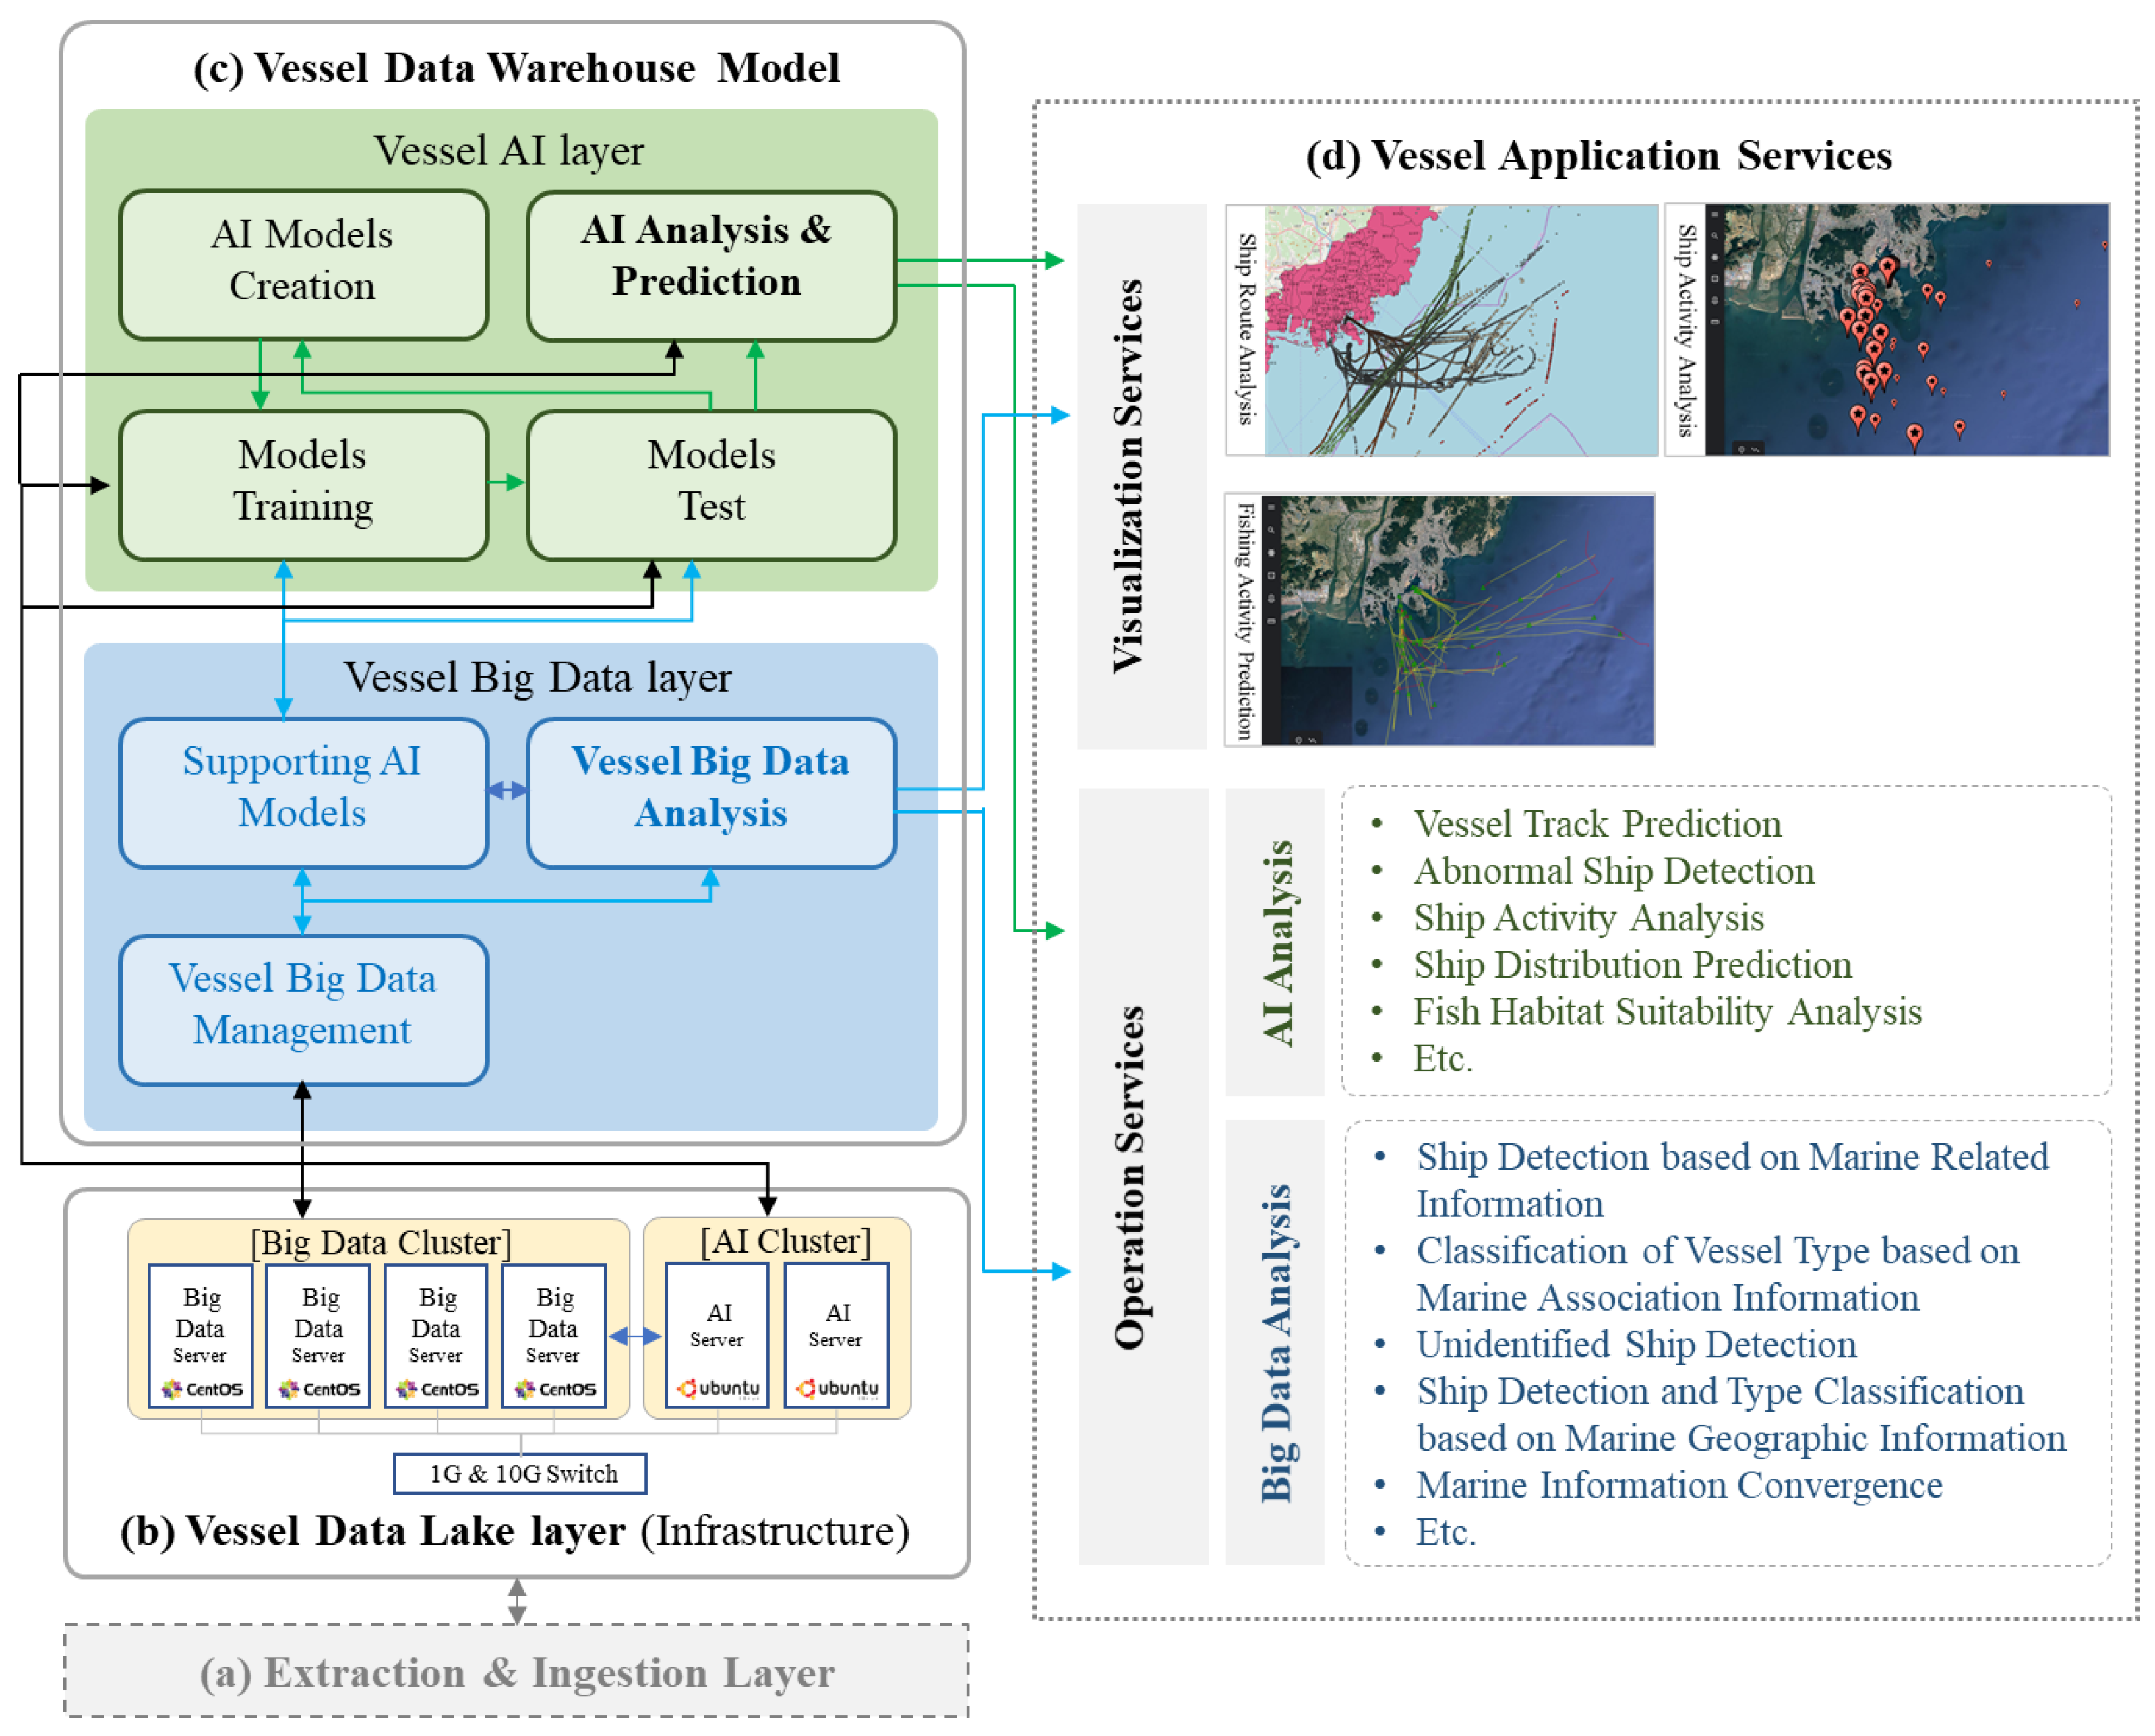
3. Vessel Data Lakehouse for Vessel Monitoring System
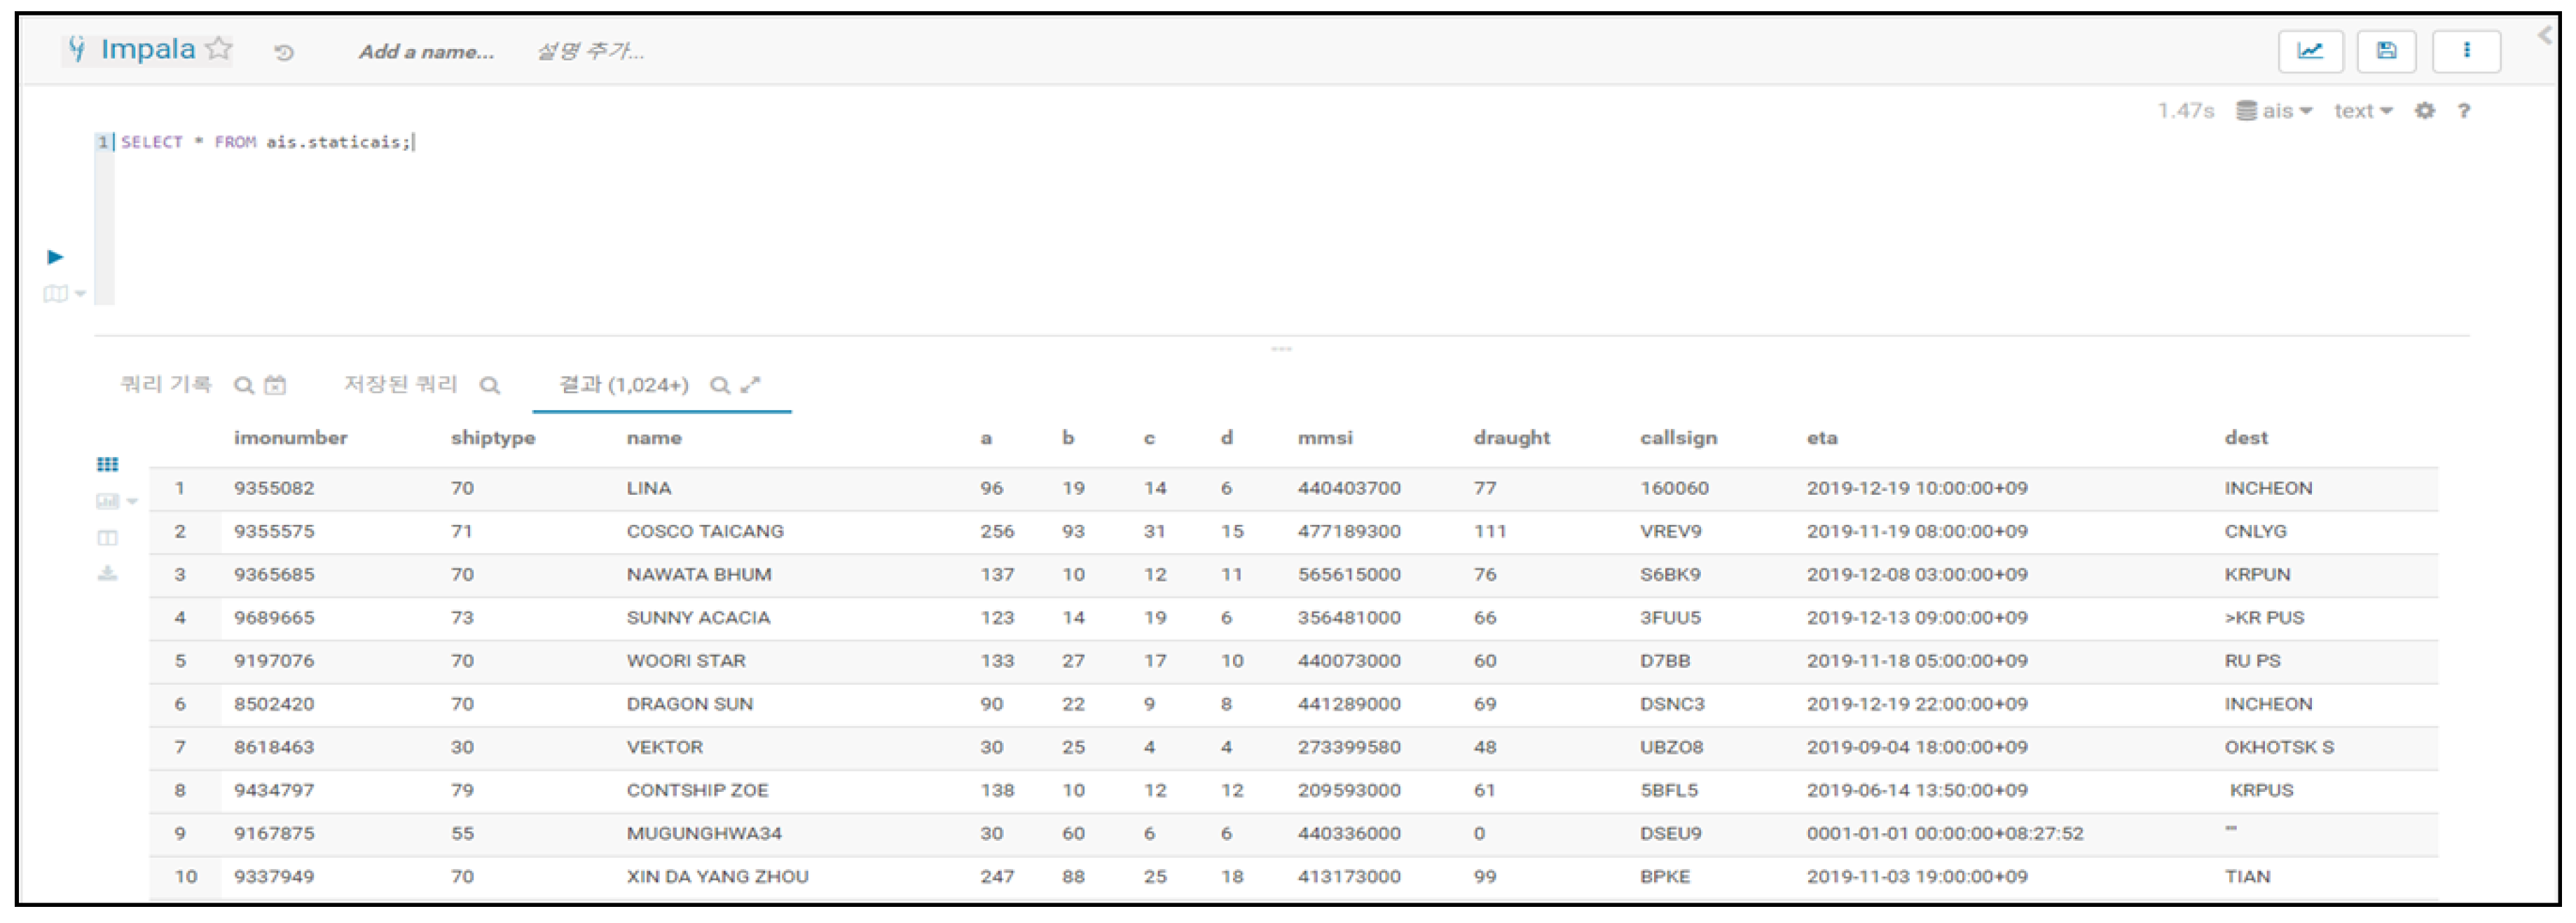
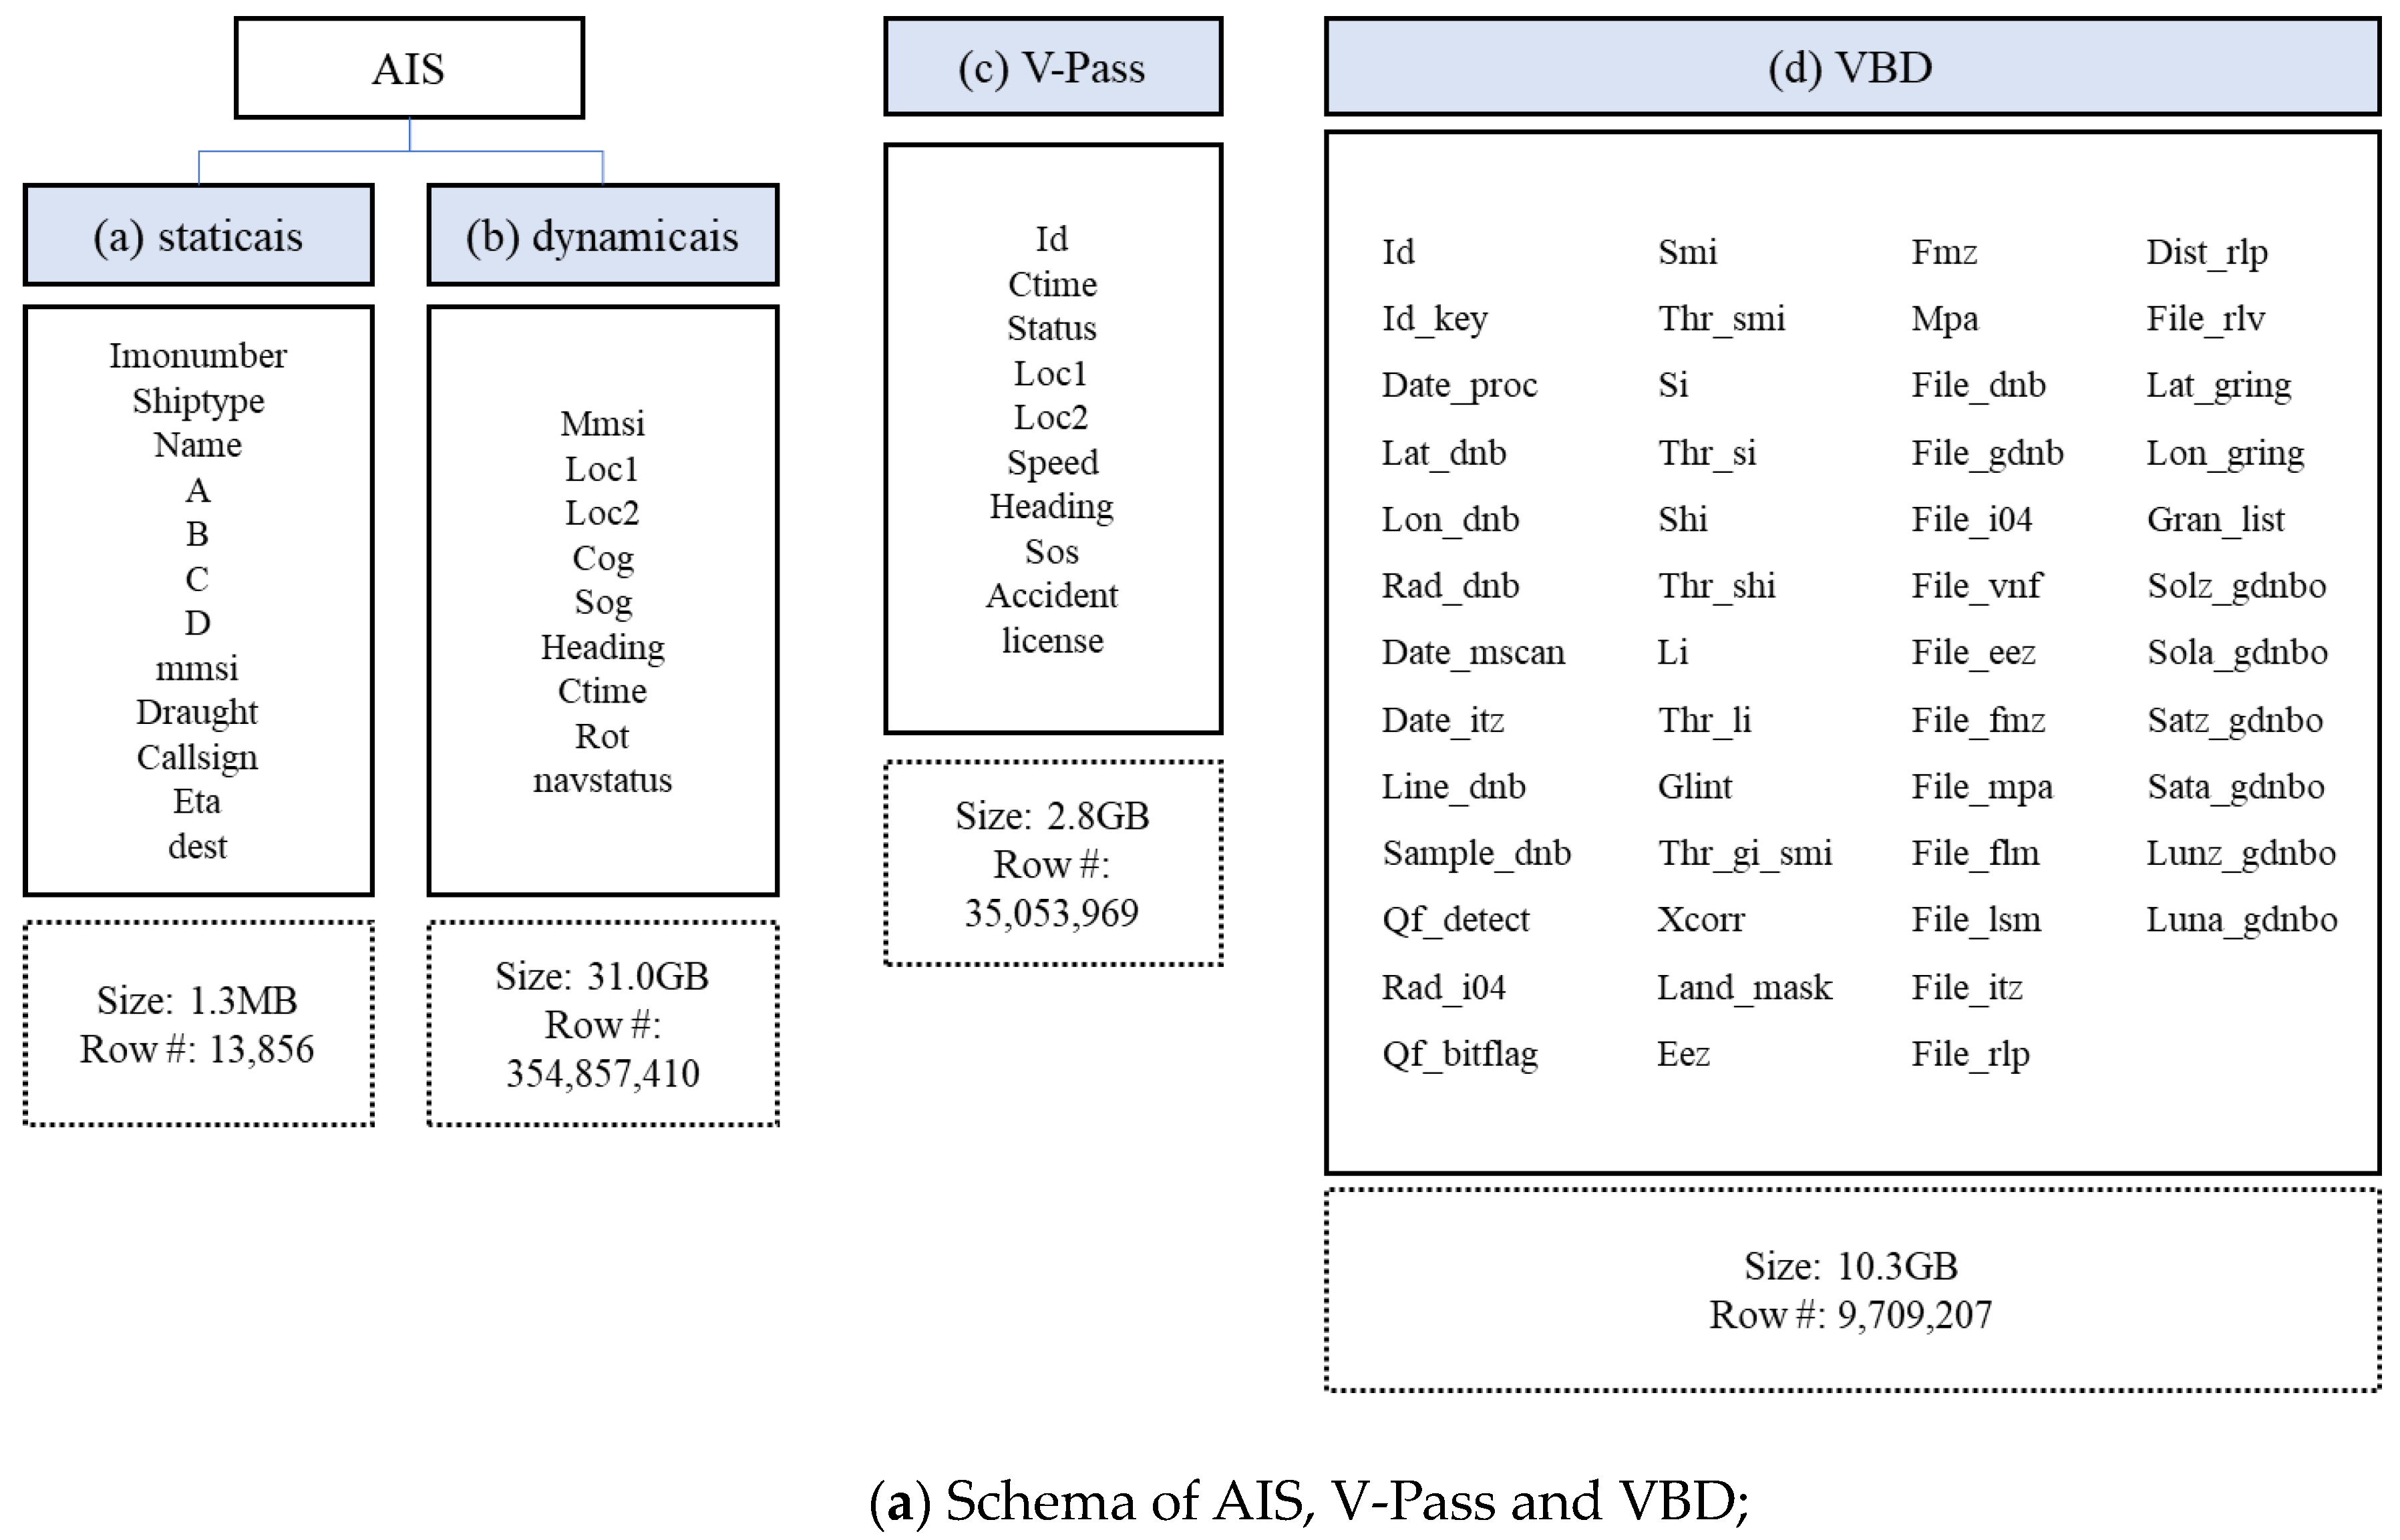
3.1. Extraction and Ingestion Layer
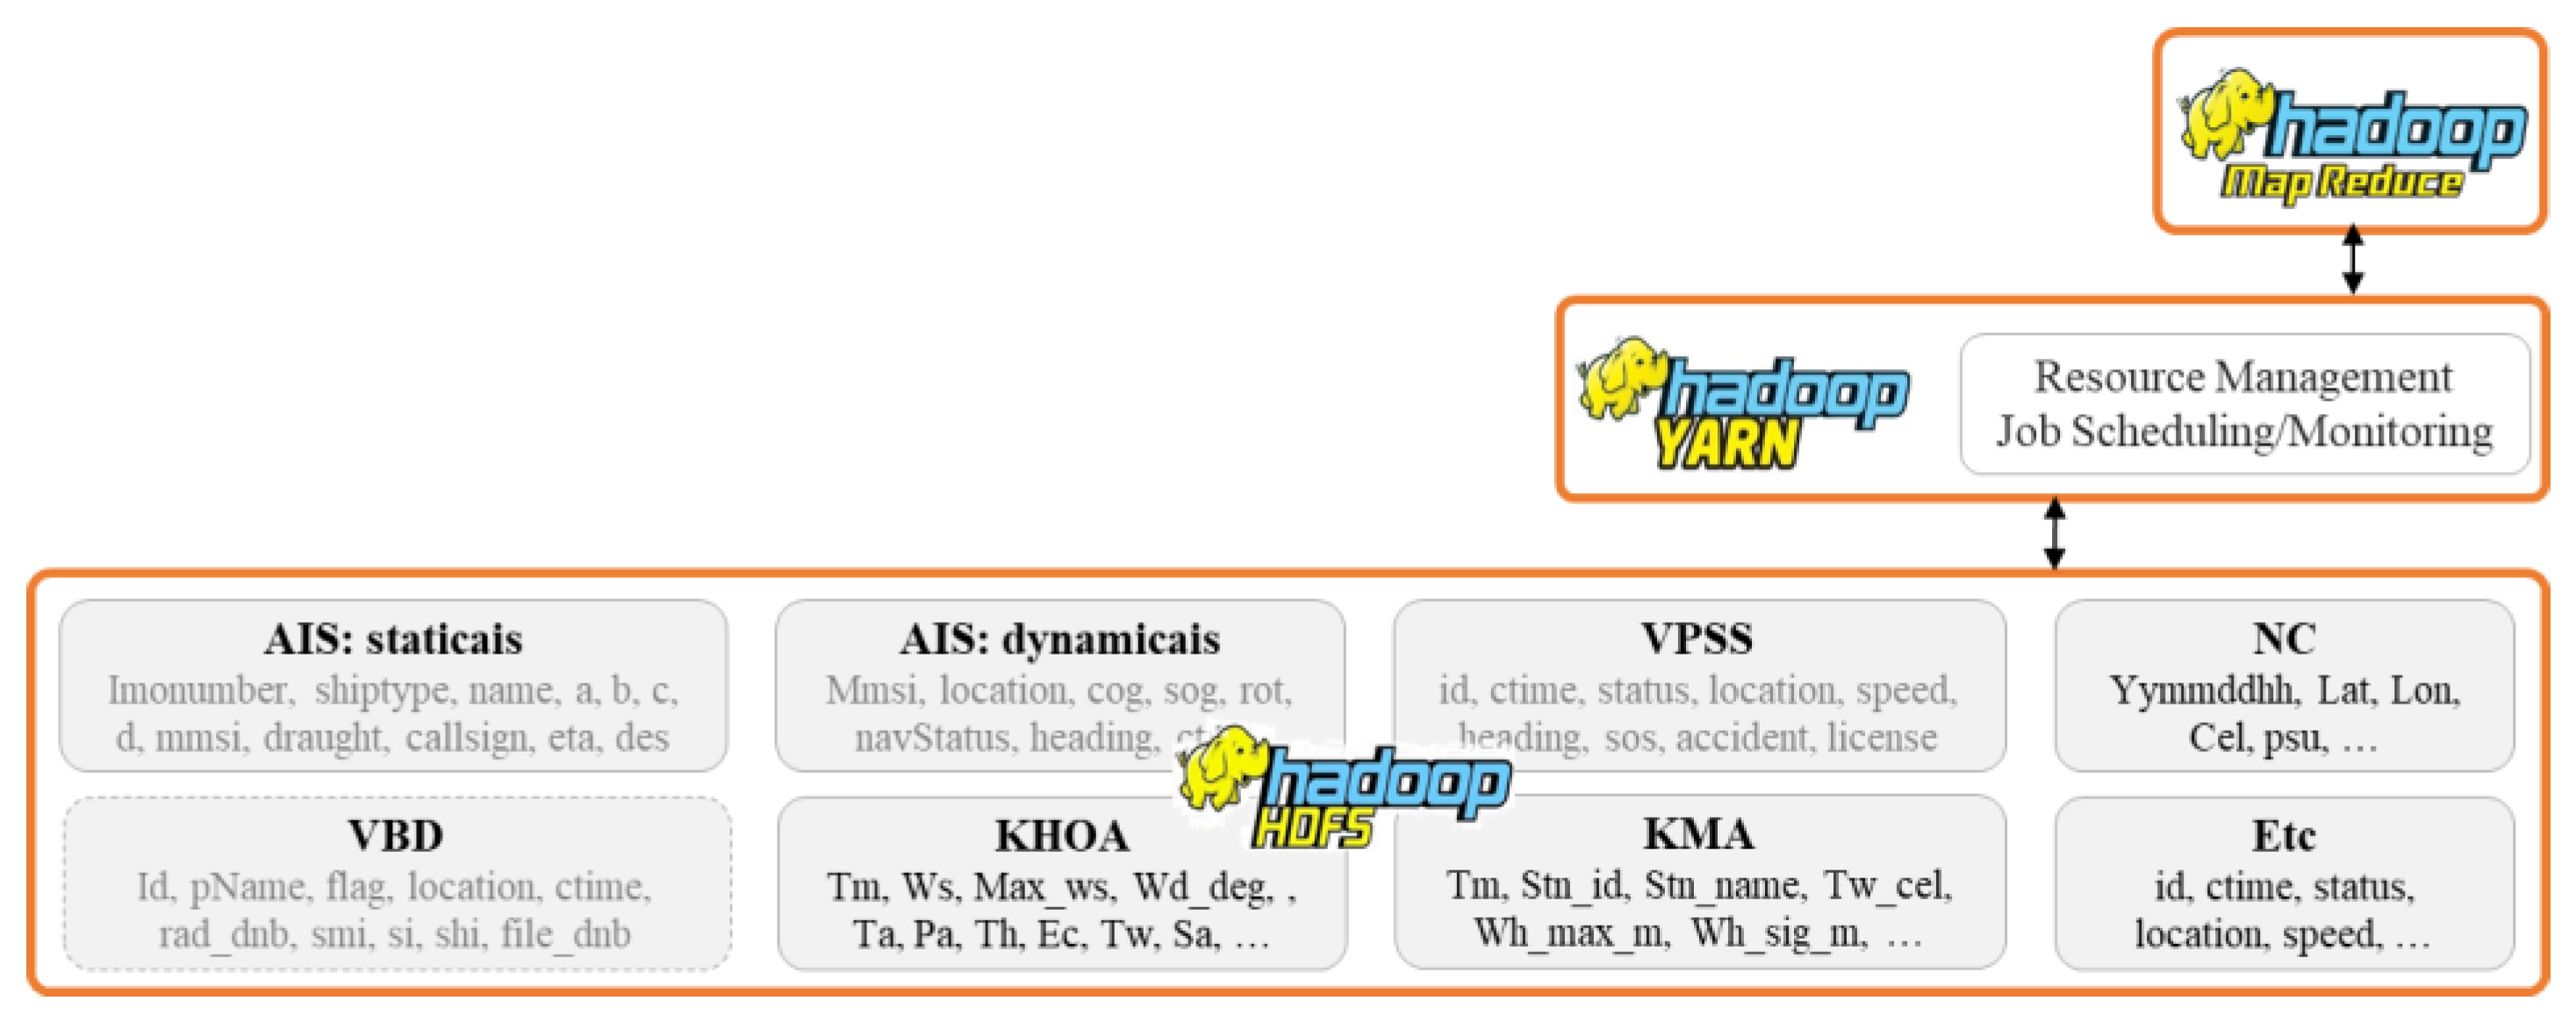
3.2. Vessel Data Lake Layer
3.3. Vessel Data Warehouse Model
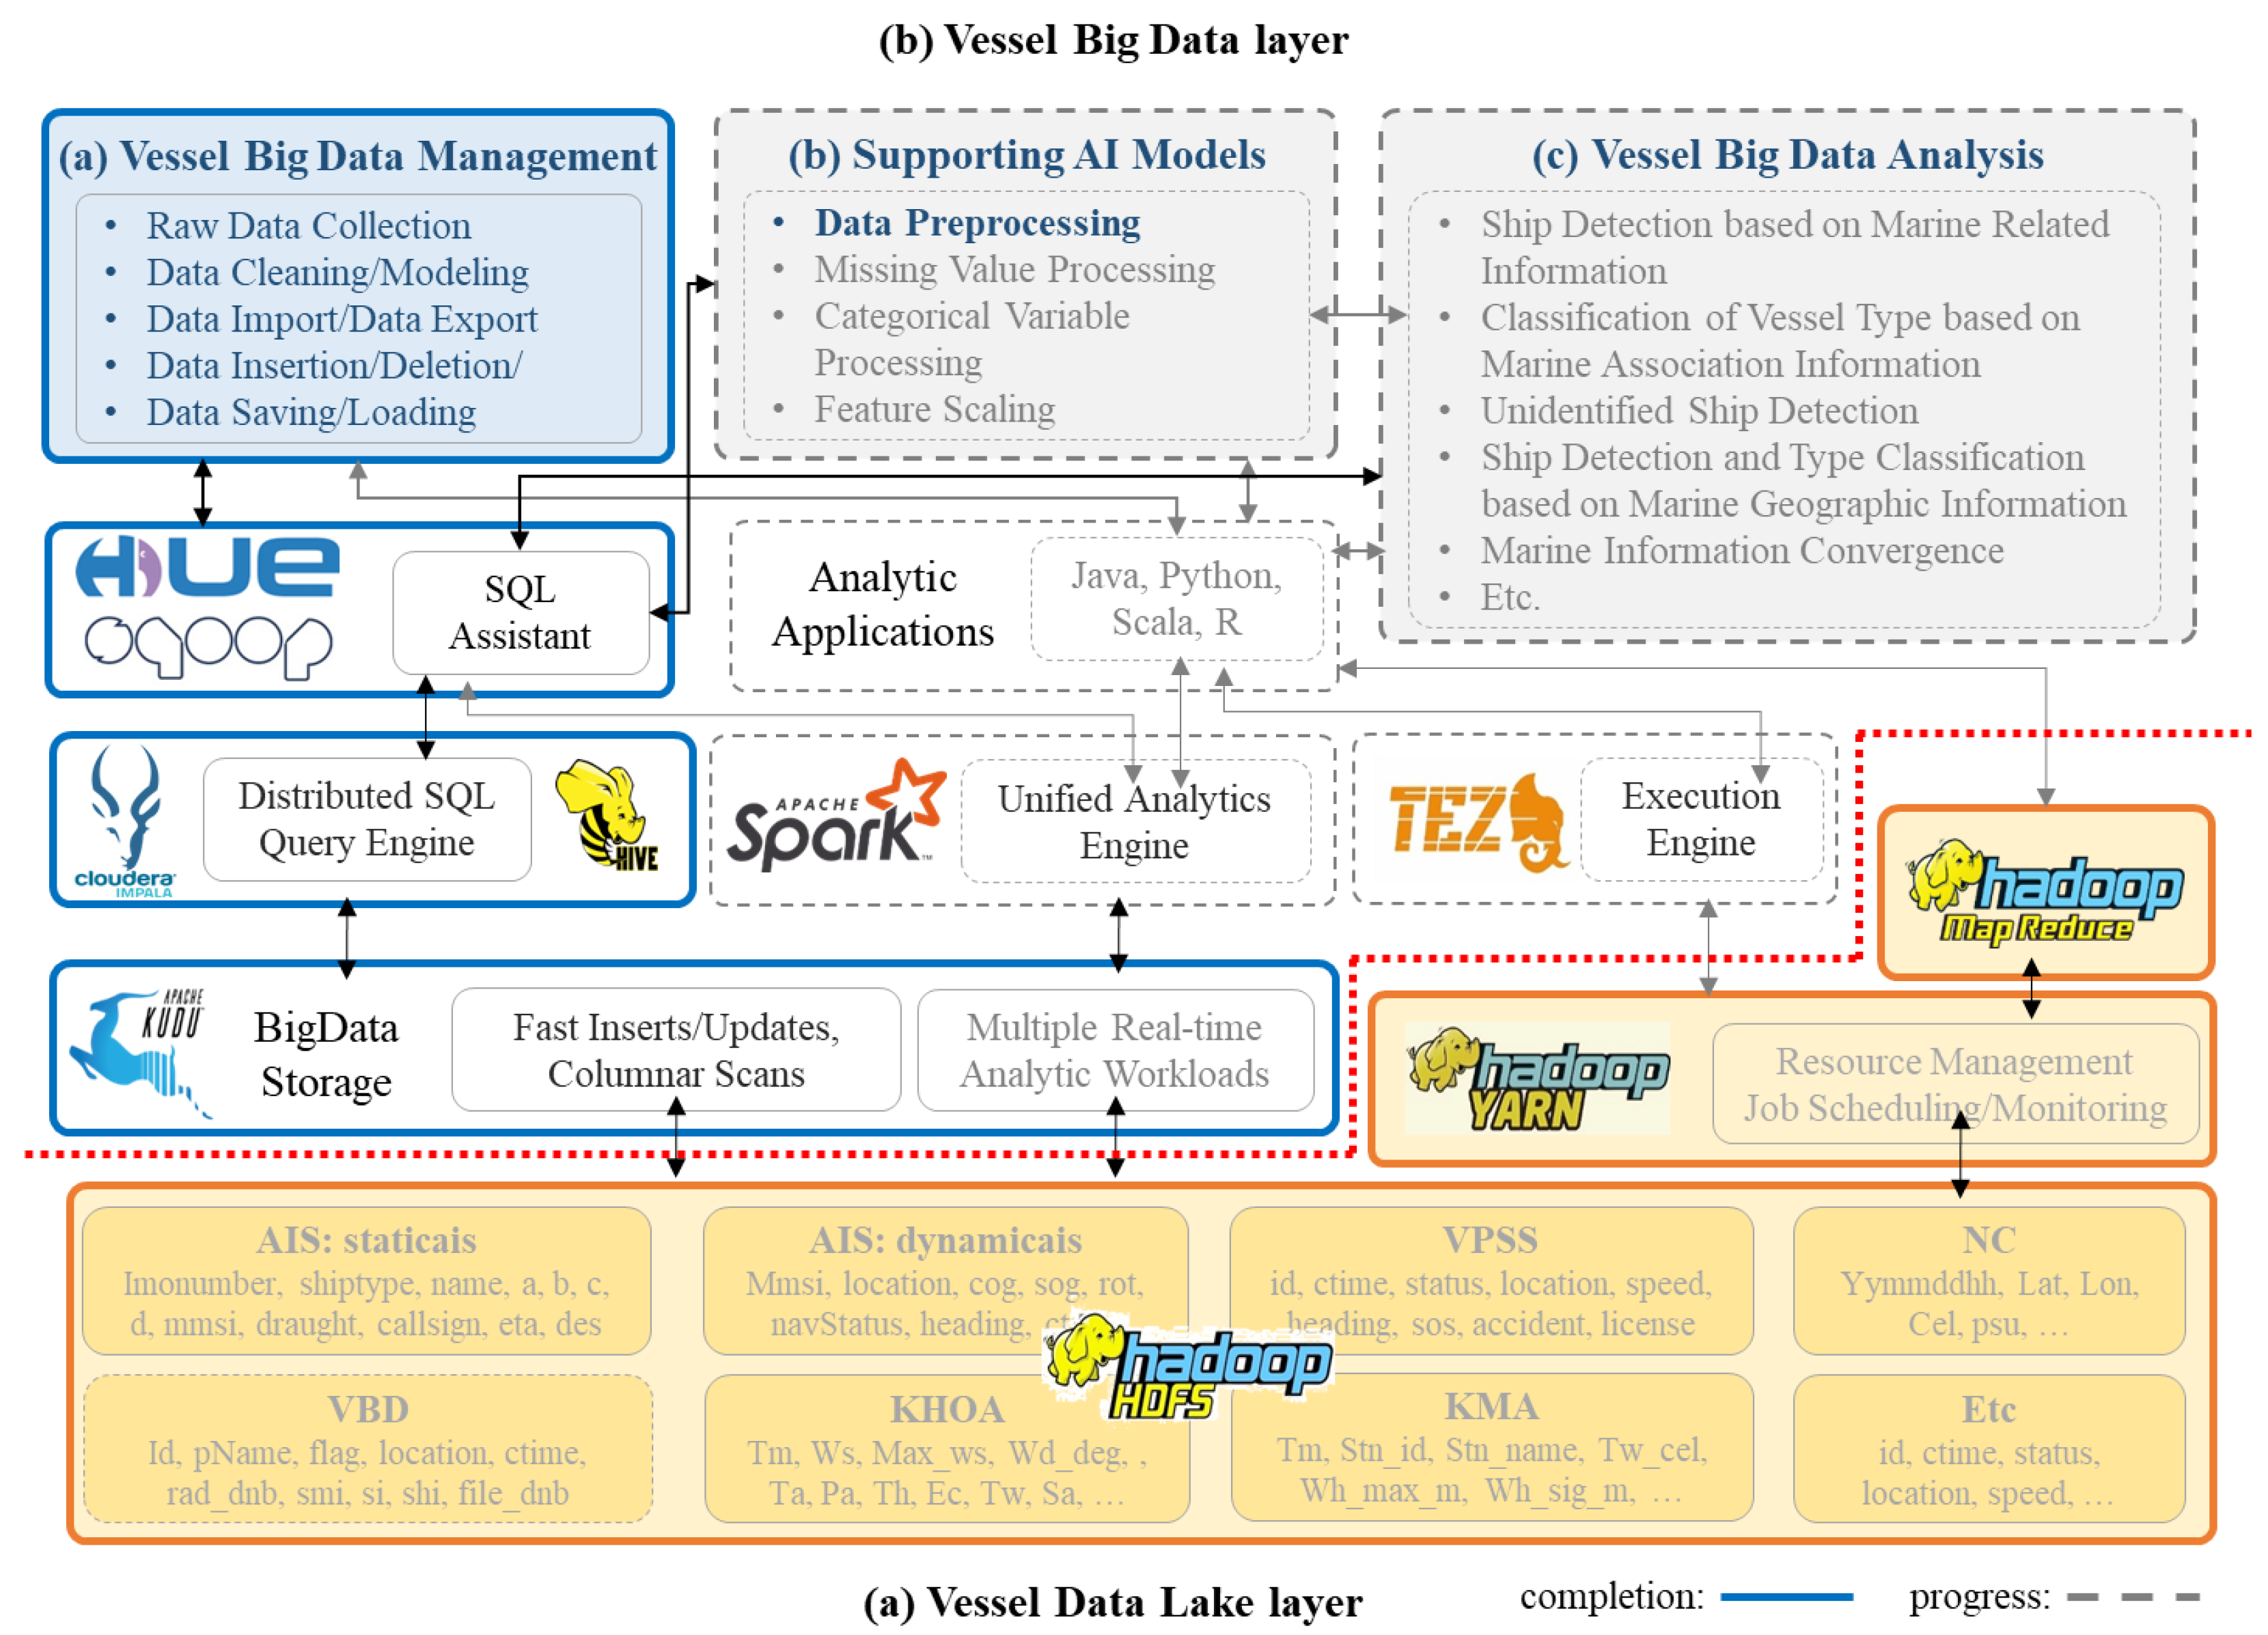
3.3.1. Vessel Big Data Layer
- Building a Vessel Data Lakehouse
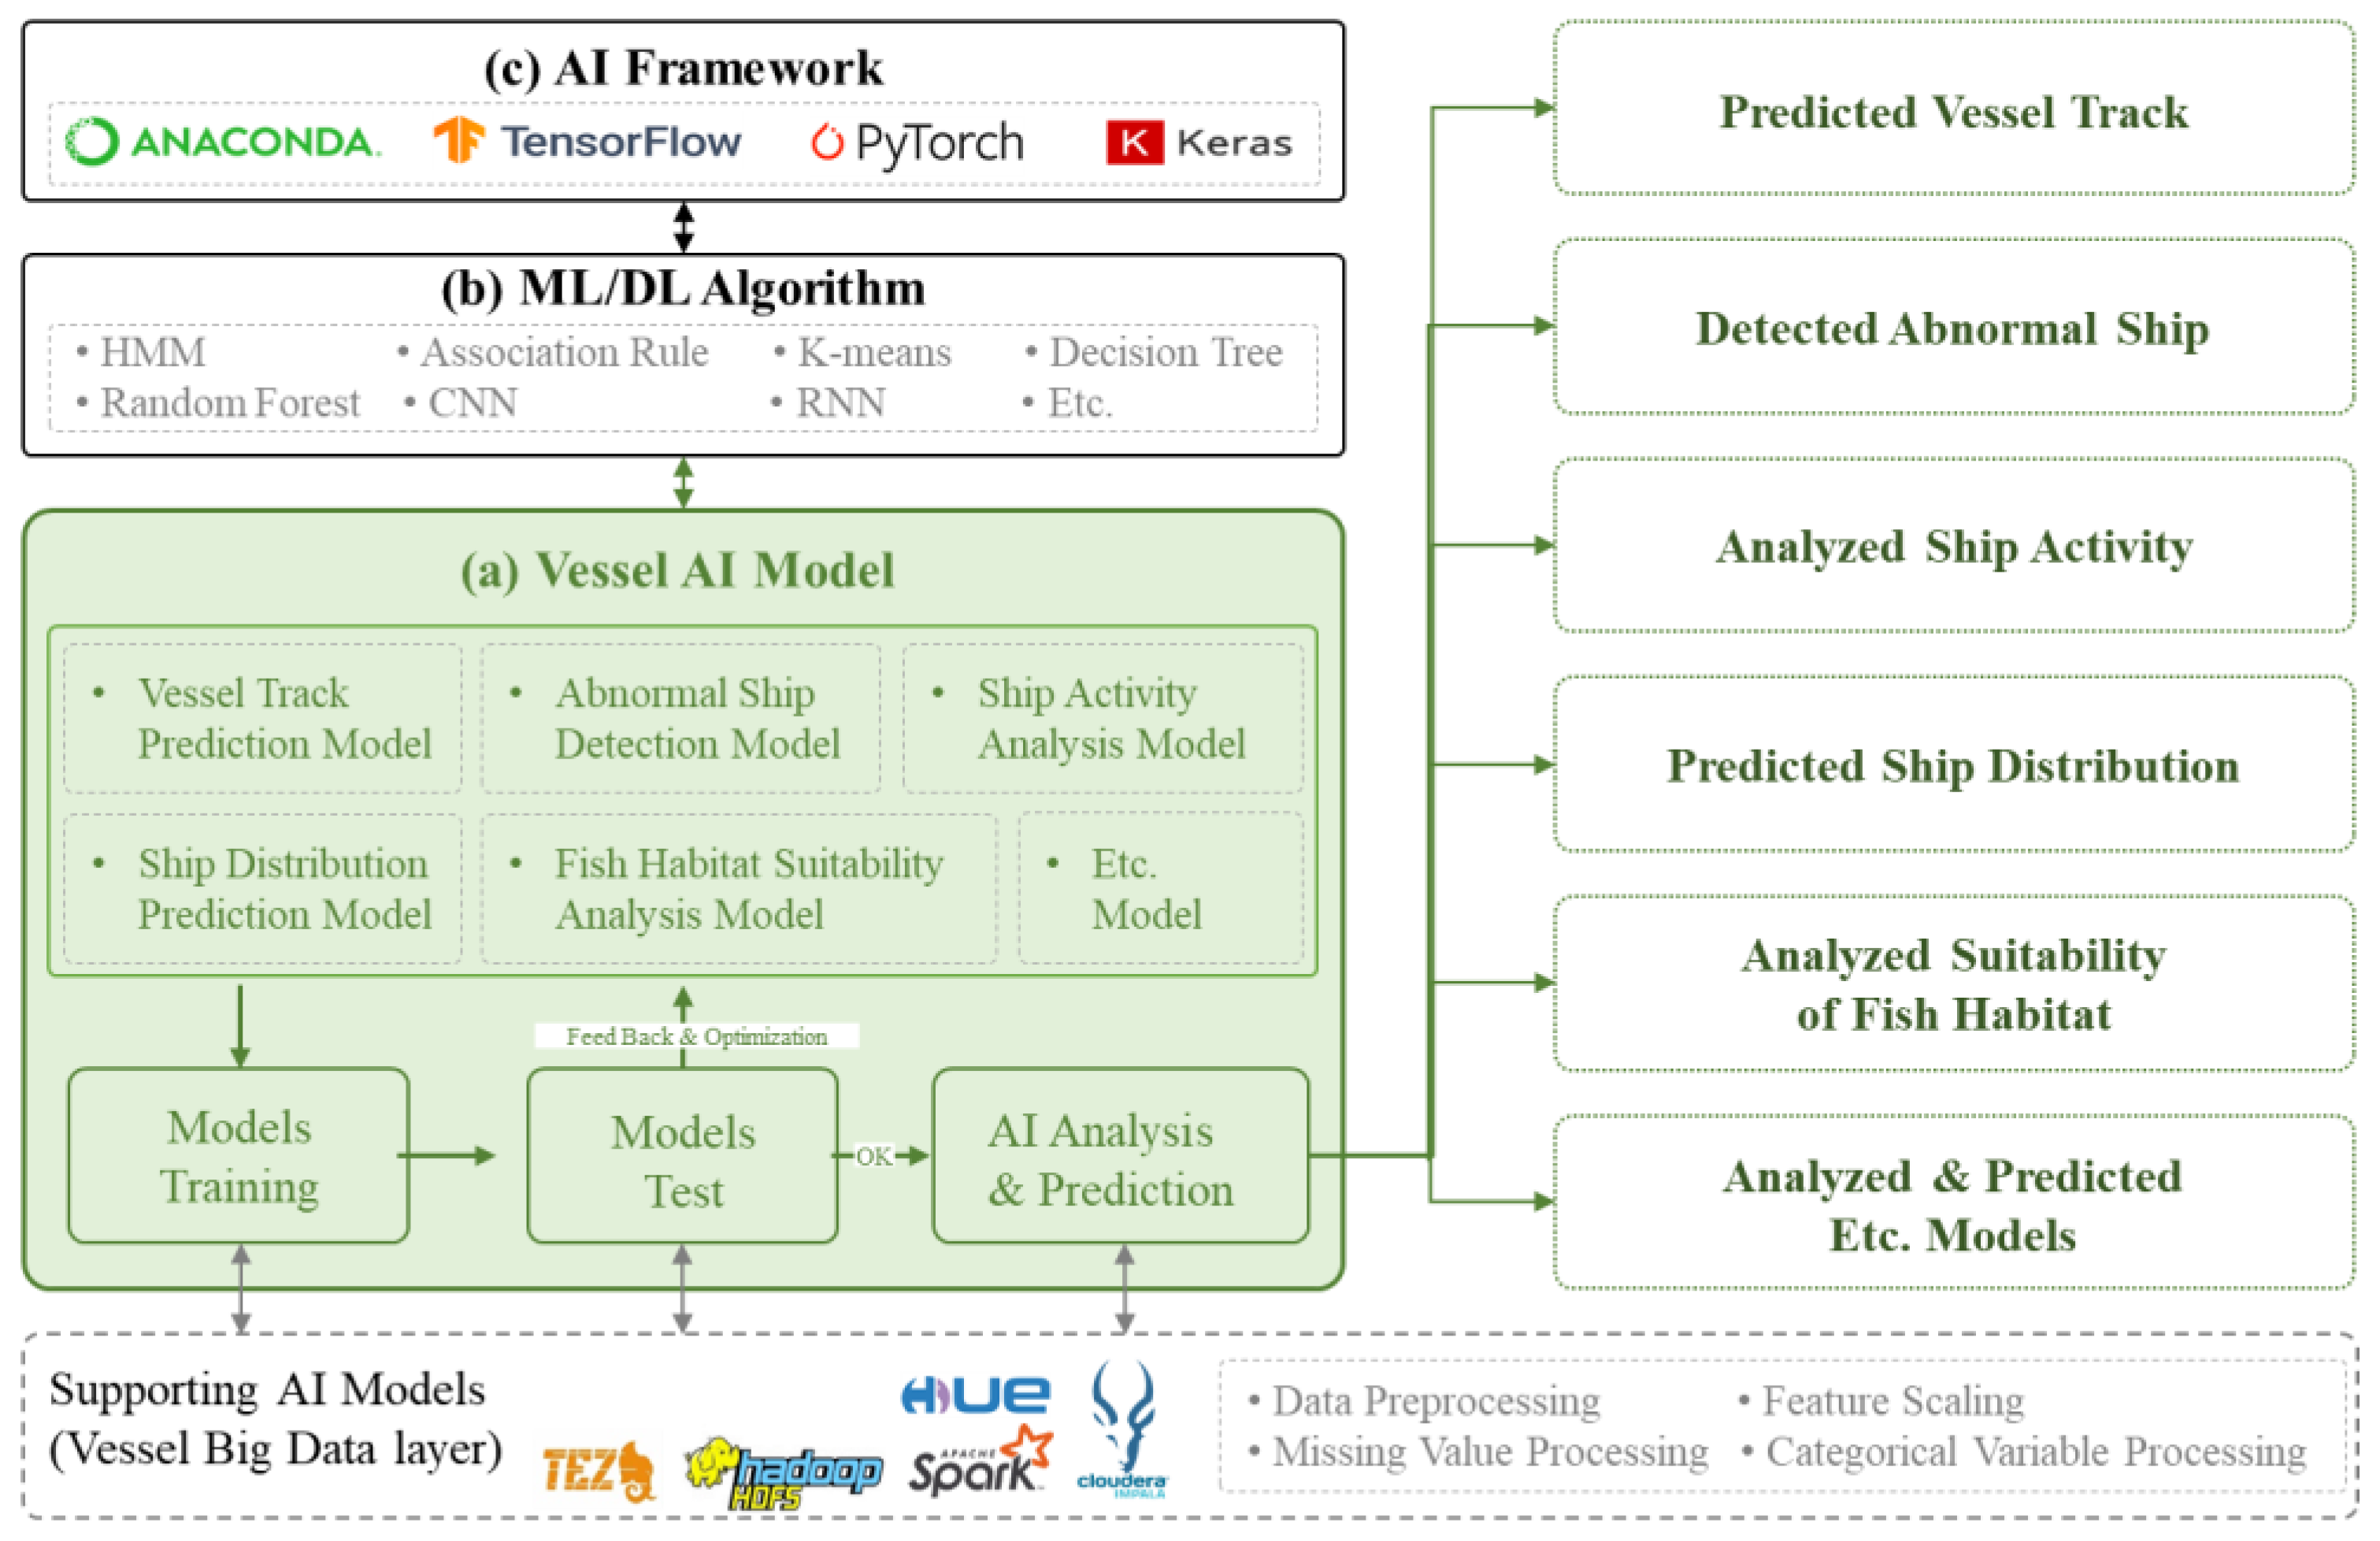
3.3.2. Vessel AI (Artificial Intelligence) Layer
3.4. Vessel Application Services
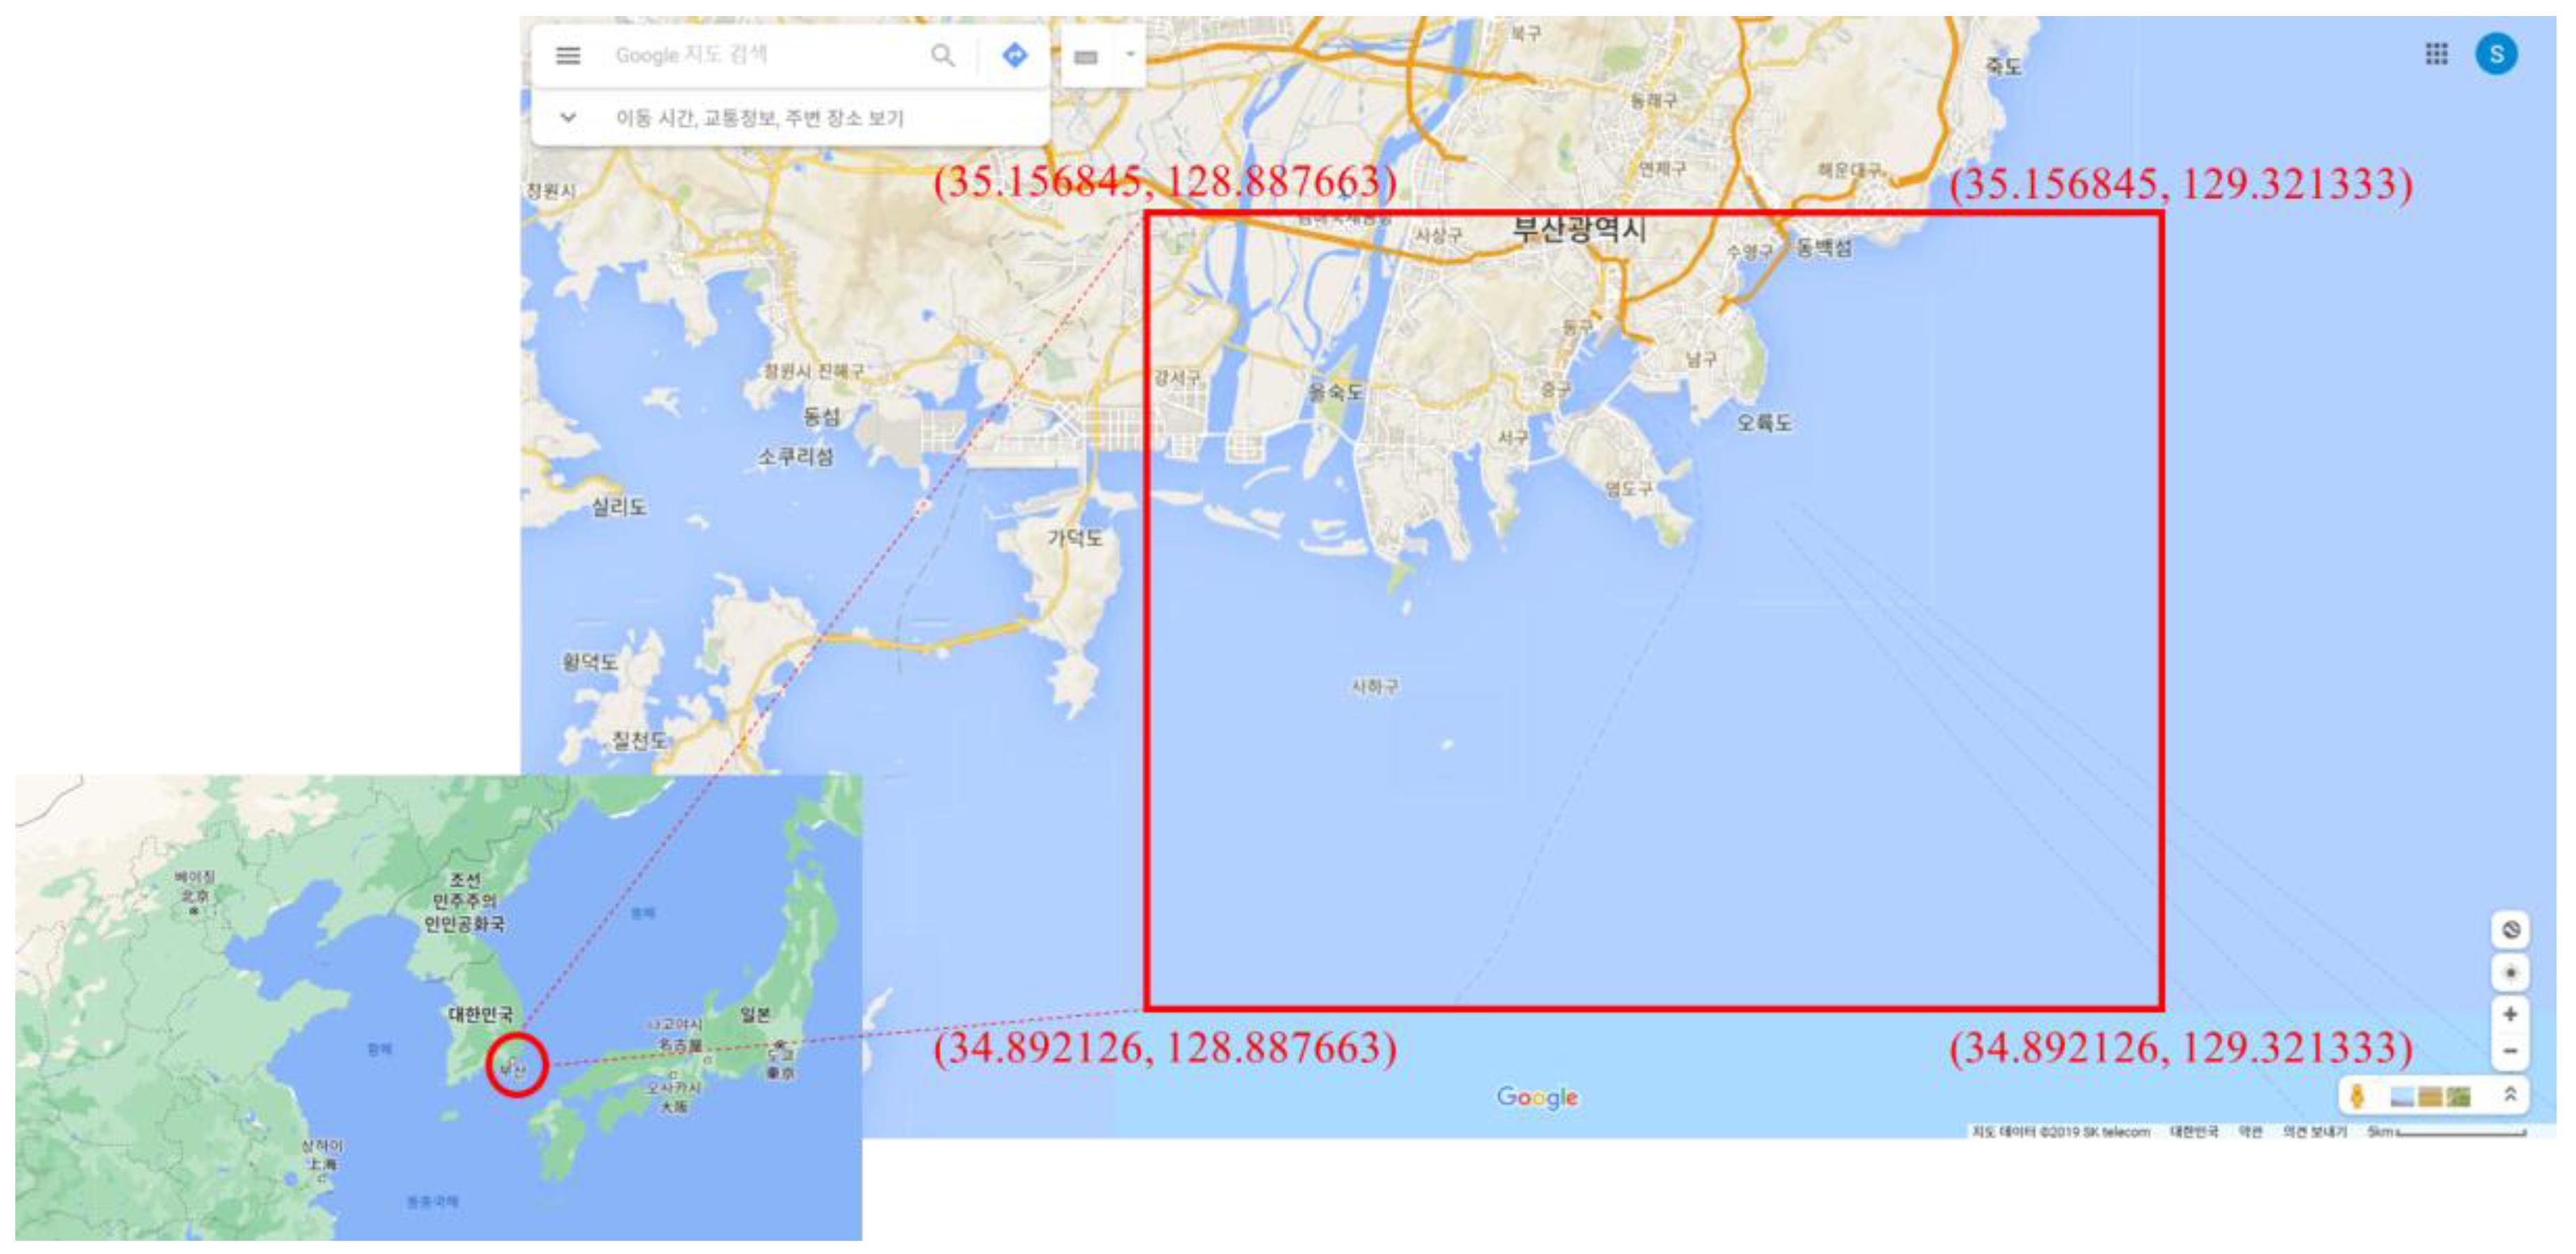
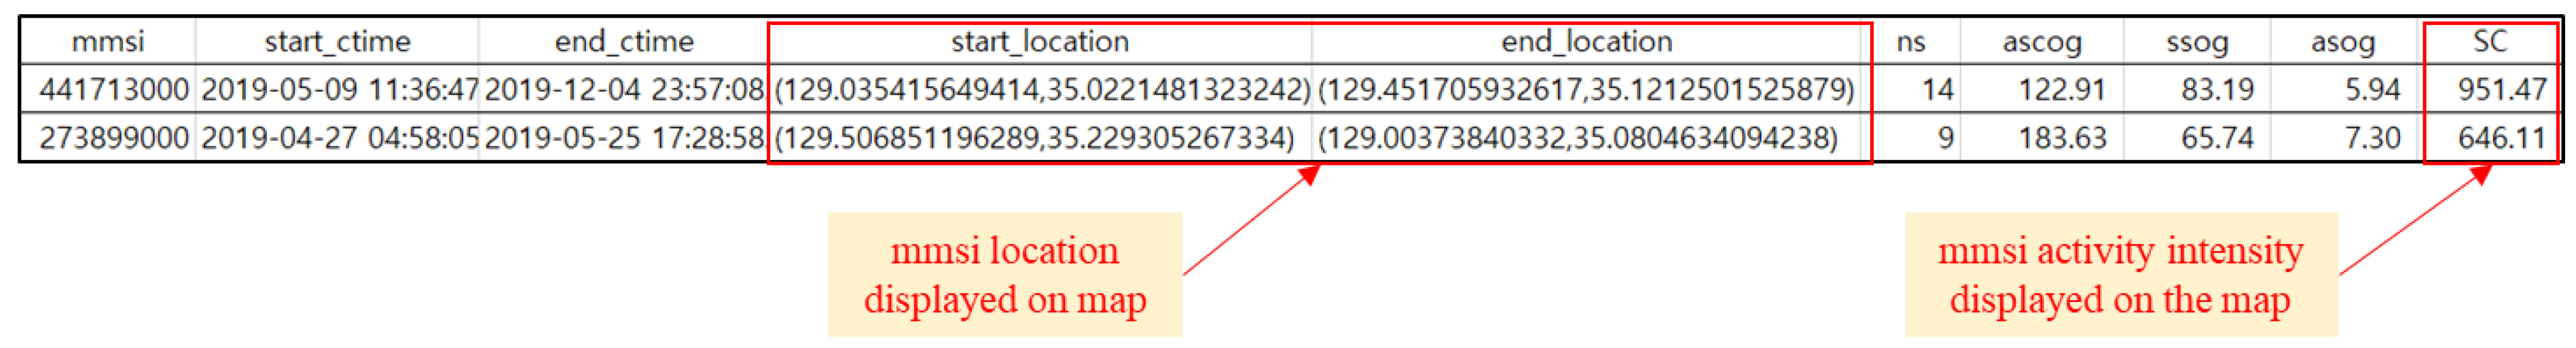
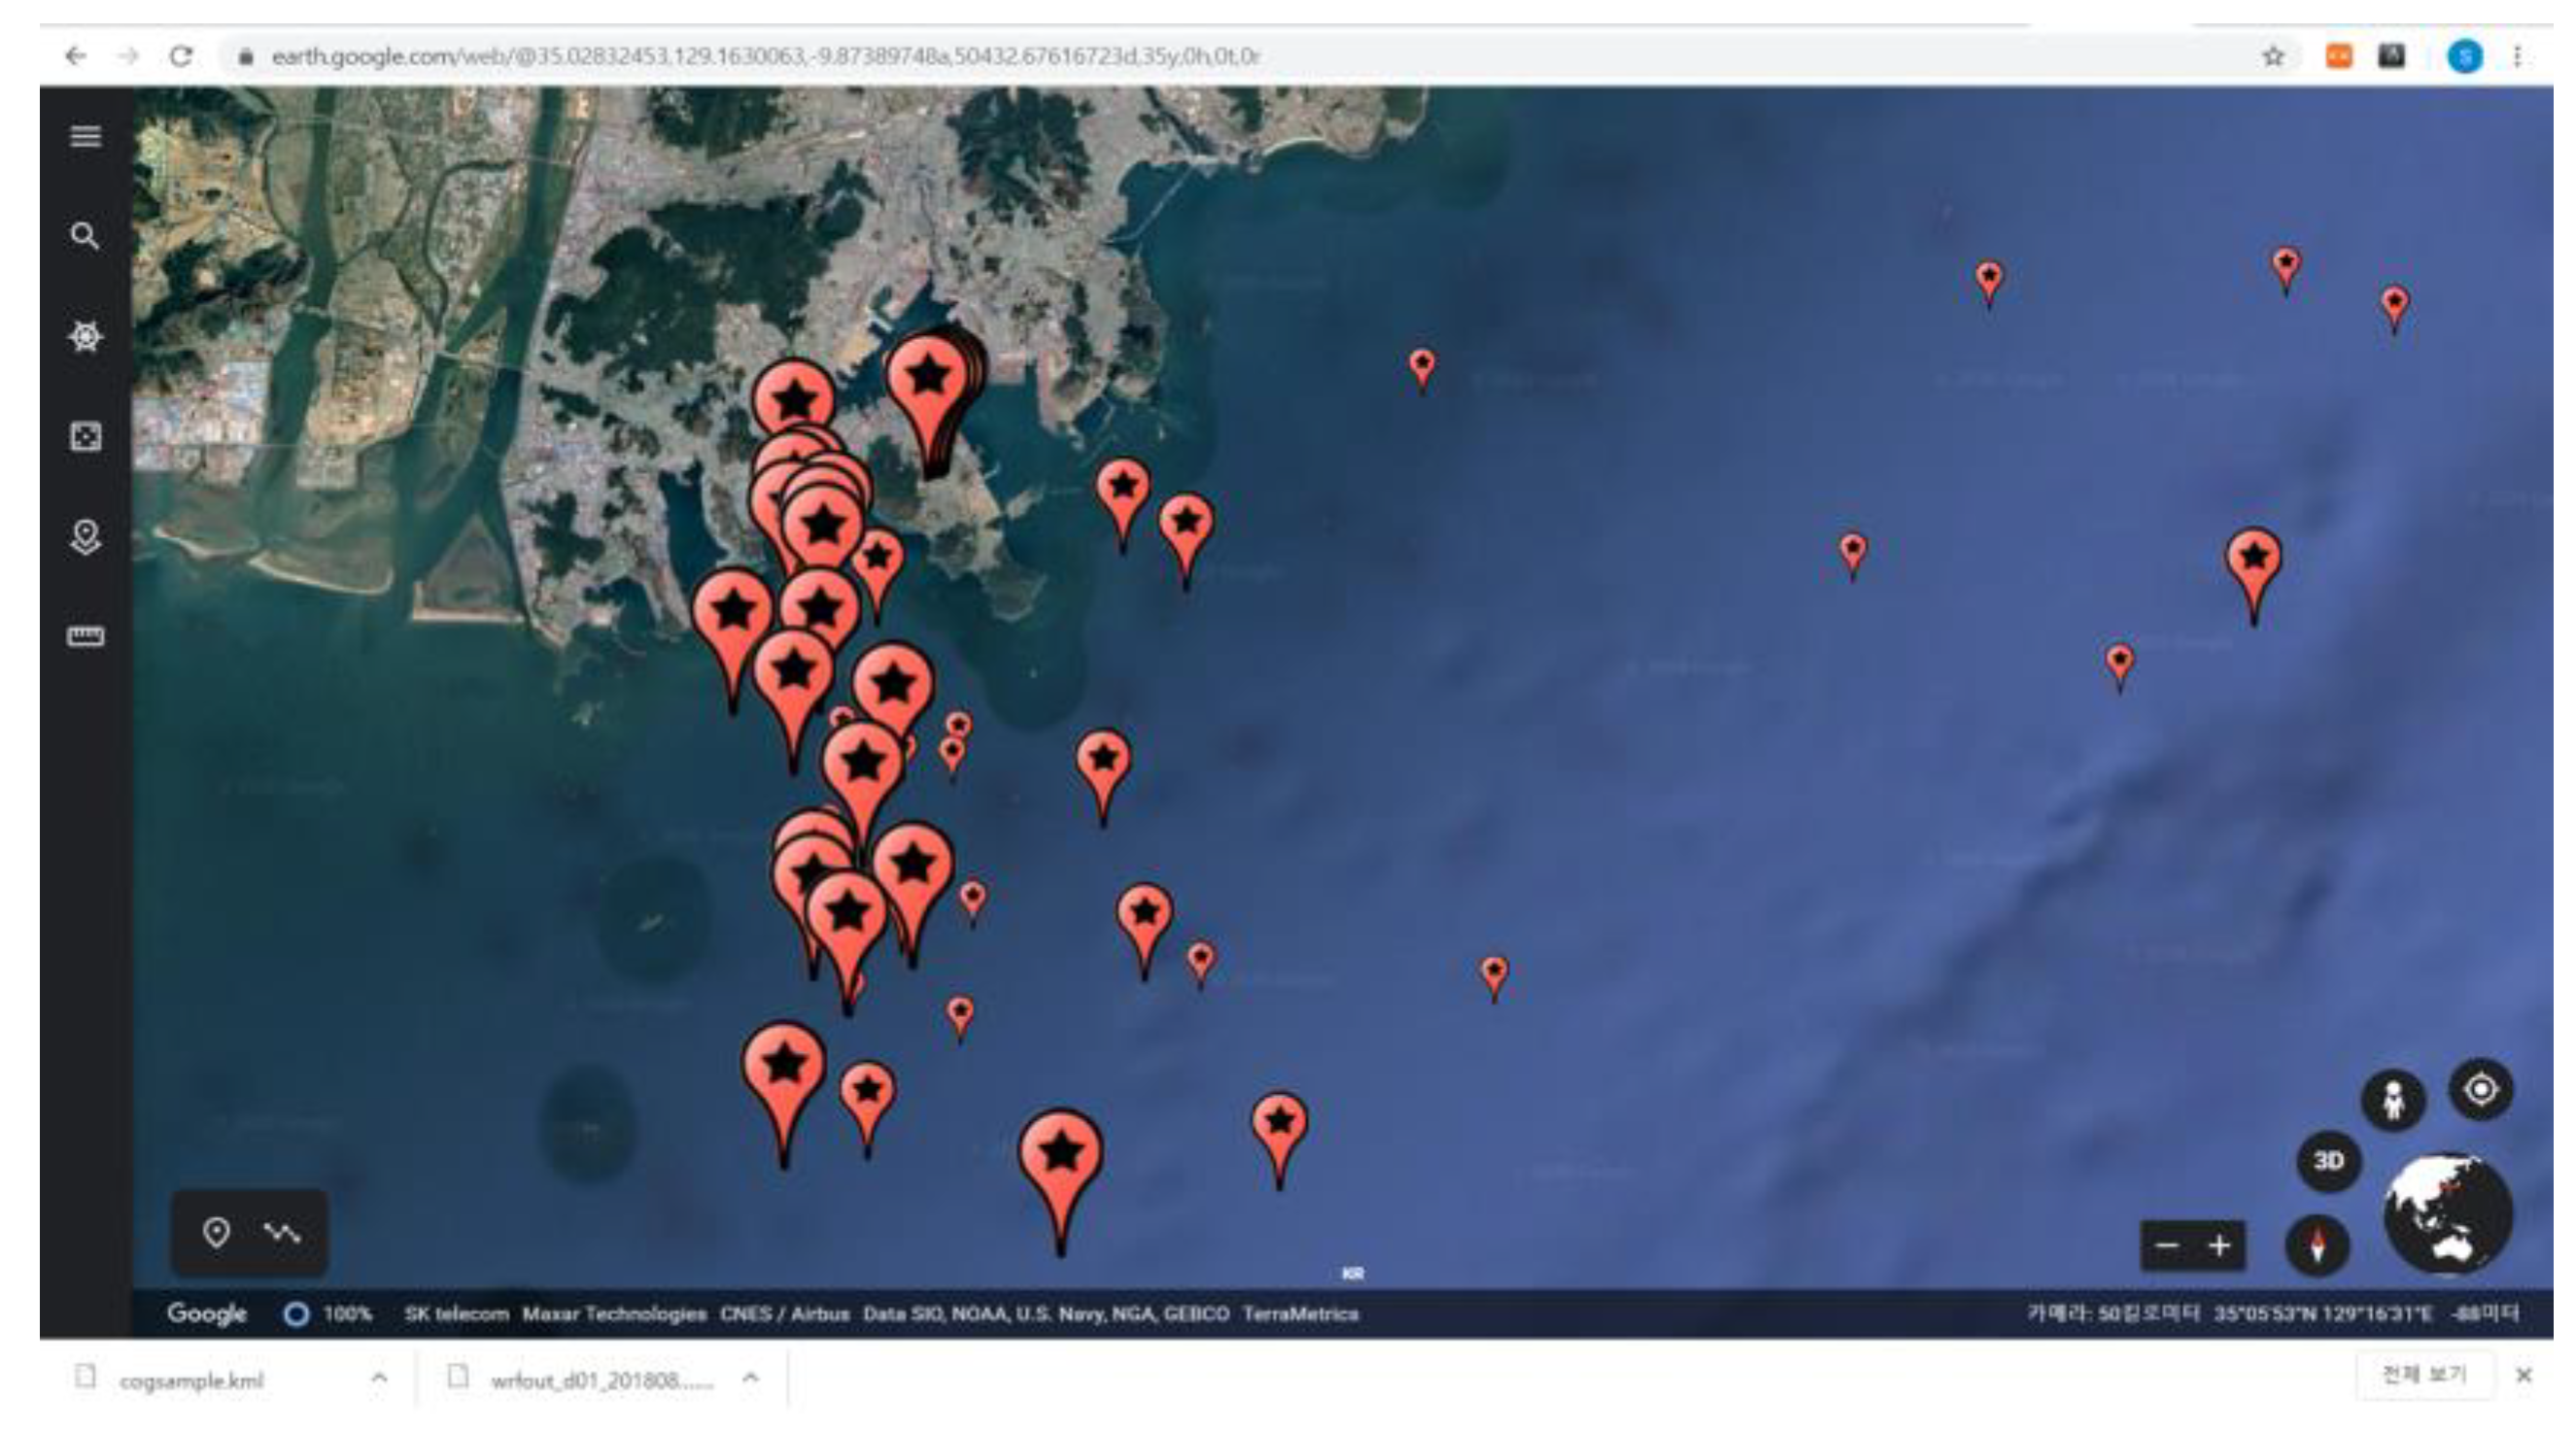
3.4.1. Identification of Distribution of Ship Types
| Algorithm 1. ShipActivity(A) |
| Input: the AIS data set A, cog in AIS is a course over ground, ns is a number of sampling of mmsi, SC is a strength of clusters, ascog is an average of sum of abs of cog, scog is a normalization of cog, and asog is an average of sog Output: the preprocessing data set T1, the calculated cluster strength data set T2 Method: 01: T1 ← Preprocessing(A); 02: T2 ← Clusterstrength(T1); 03: Visualization(T2); Preprocessing(A) 04: for i ← 1 to n do 05: if 33 <= Ai,latutude <= 38 and 124 <= Ai,longitude <= 132 06: then Temp1i ← Ai 07: end 08: Temp2j ← kmeans(Temp1i,mmis) 09: extract Temp2j ← 2-minute intervals Temp2j 10: extract Temp2j ← #10 sogs Temp2j 11: for j ← 1 to m do 12: Temp3j ← 13: end 14: for l ← 1 to p do 15: Temp4l ← classify(Temp3j,type) 16: end 17: Return Temp4l Clusterstrength(T1) 18: for i ← 1 to n do 19: Temp5i ← 20: end 21: Return Temp5i Visualization(T2) 22: for i ← 1 to n do 23: display(T2i,mmsi); 24: display(T2i,SC) 25: end |
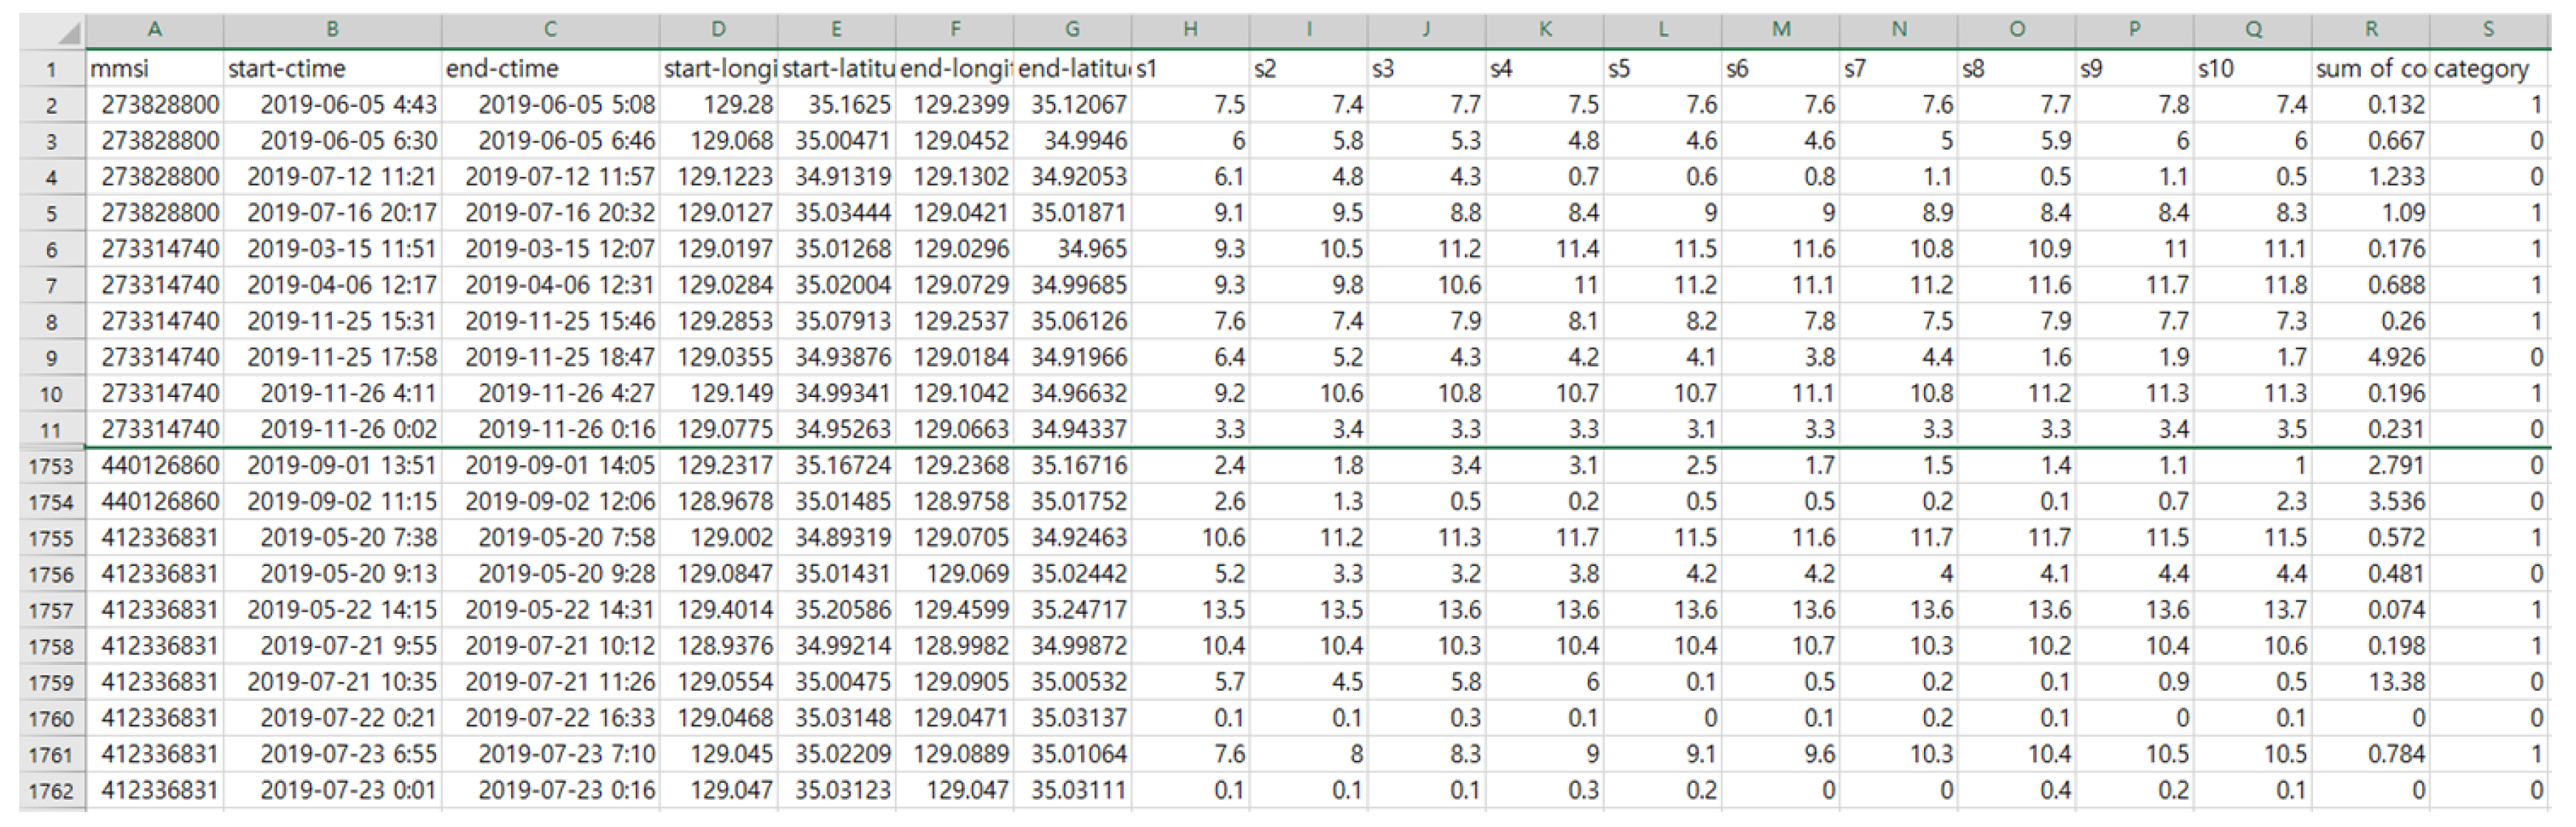
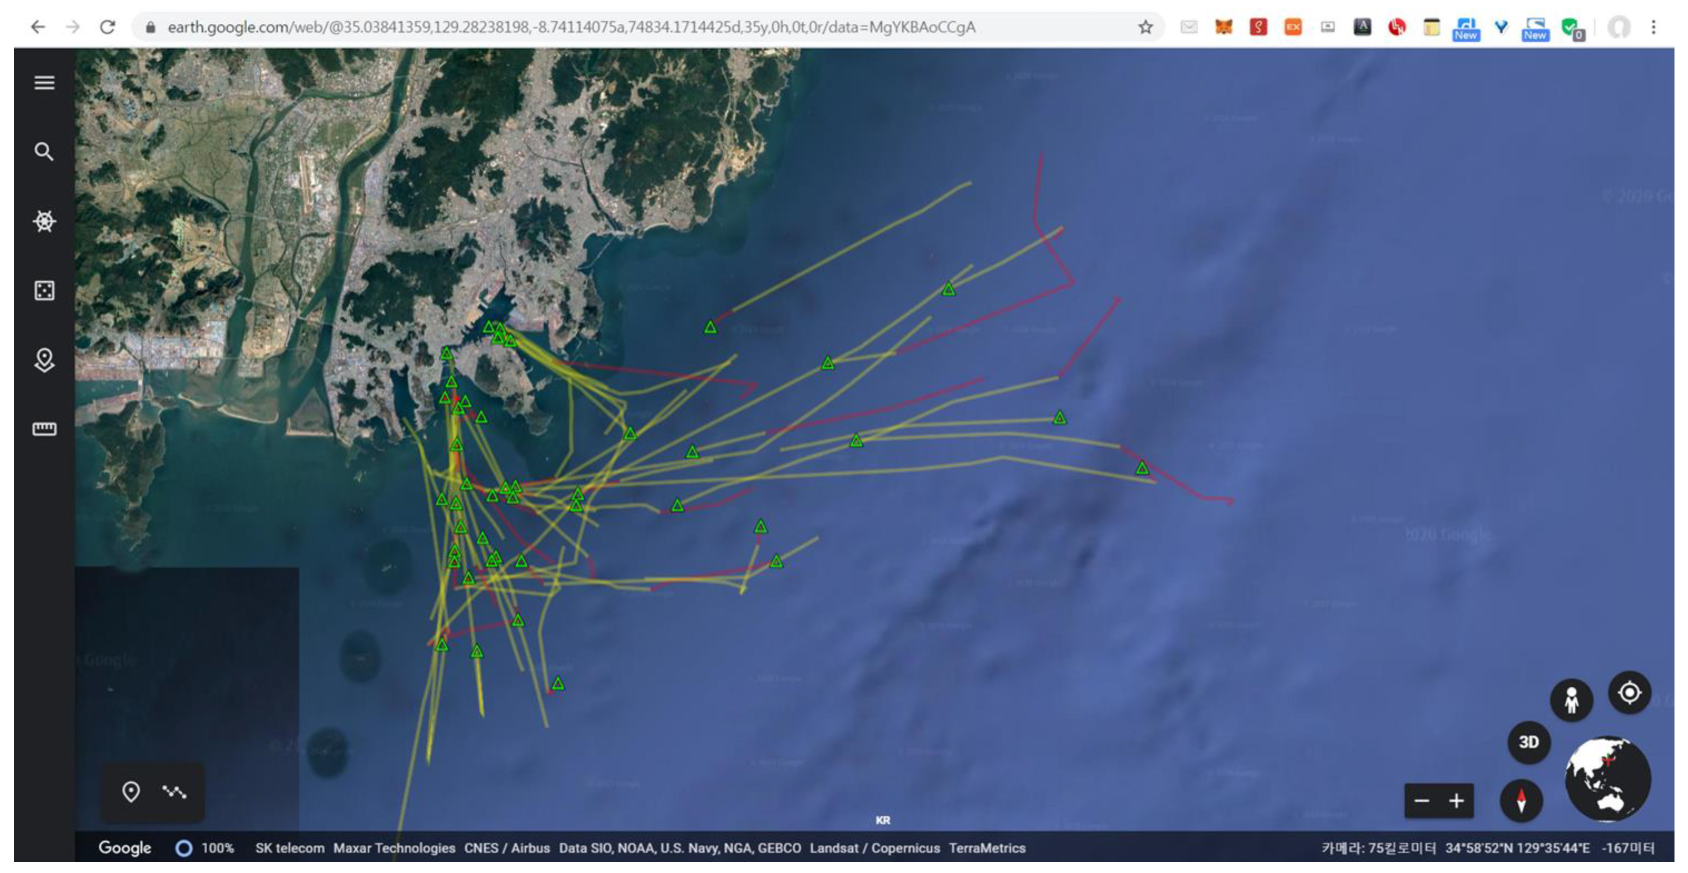
3.4.2. Predicting Fishing Activity
4. Experimental Results
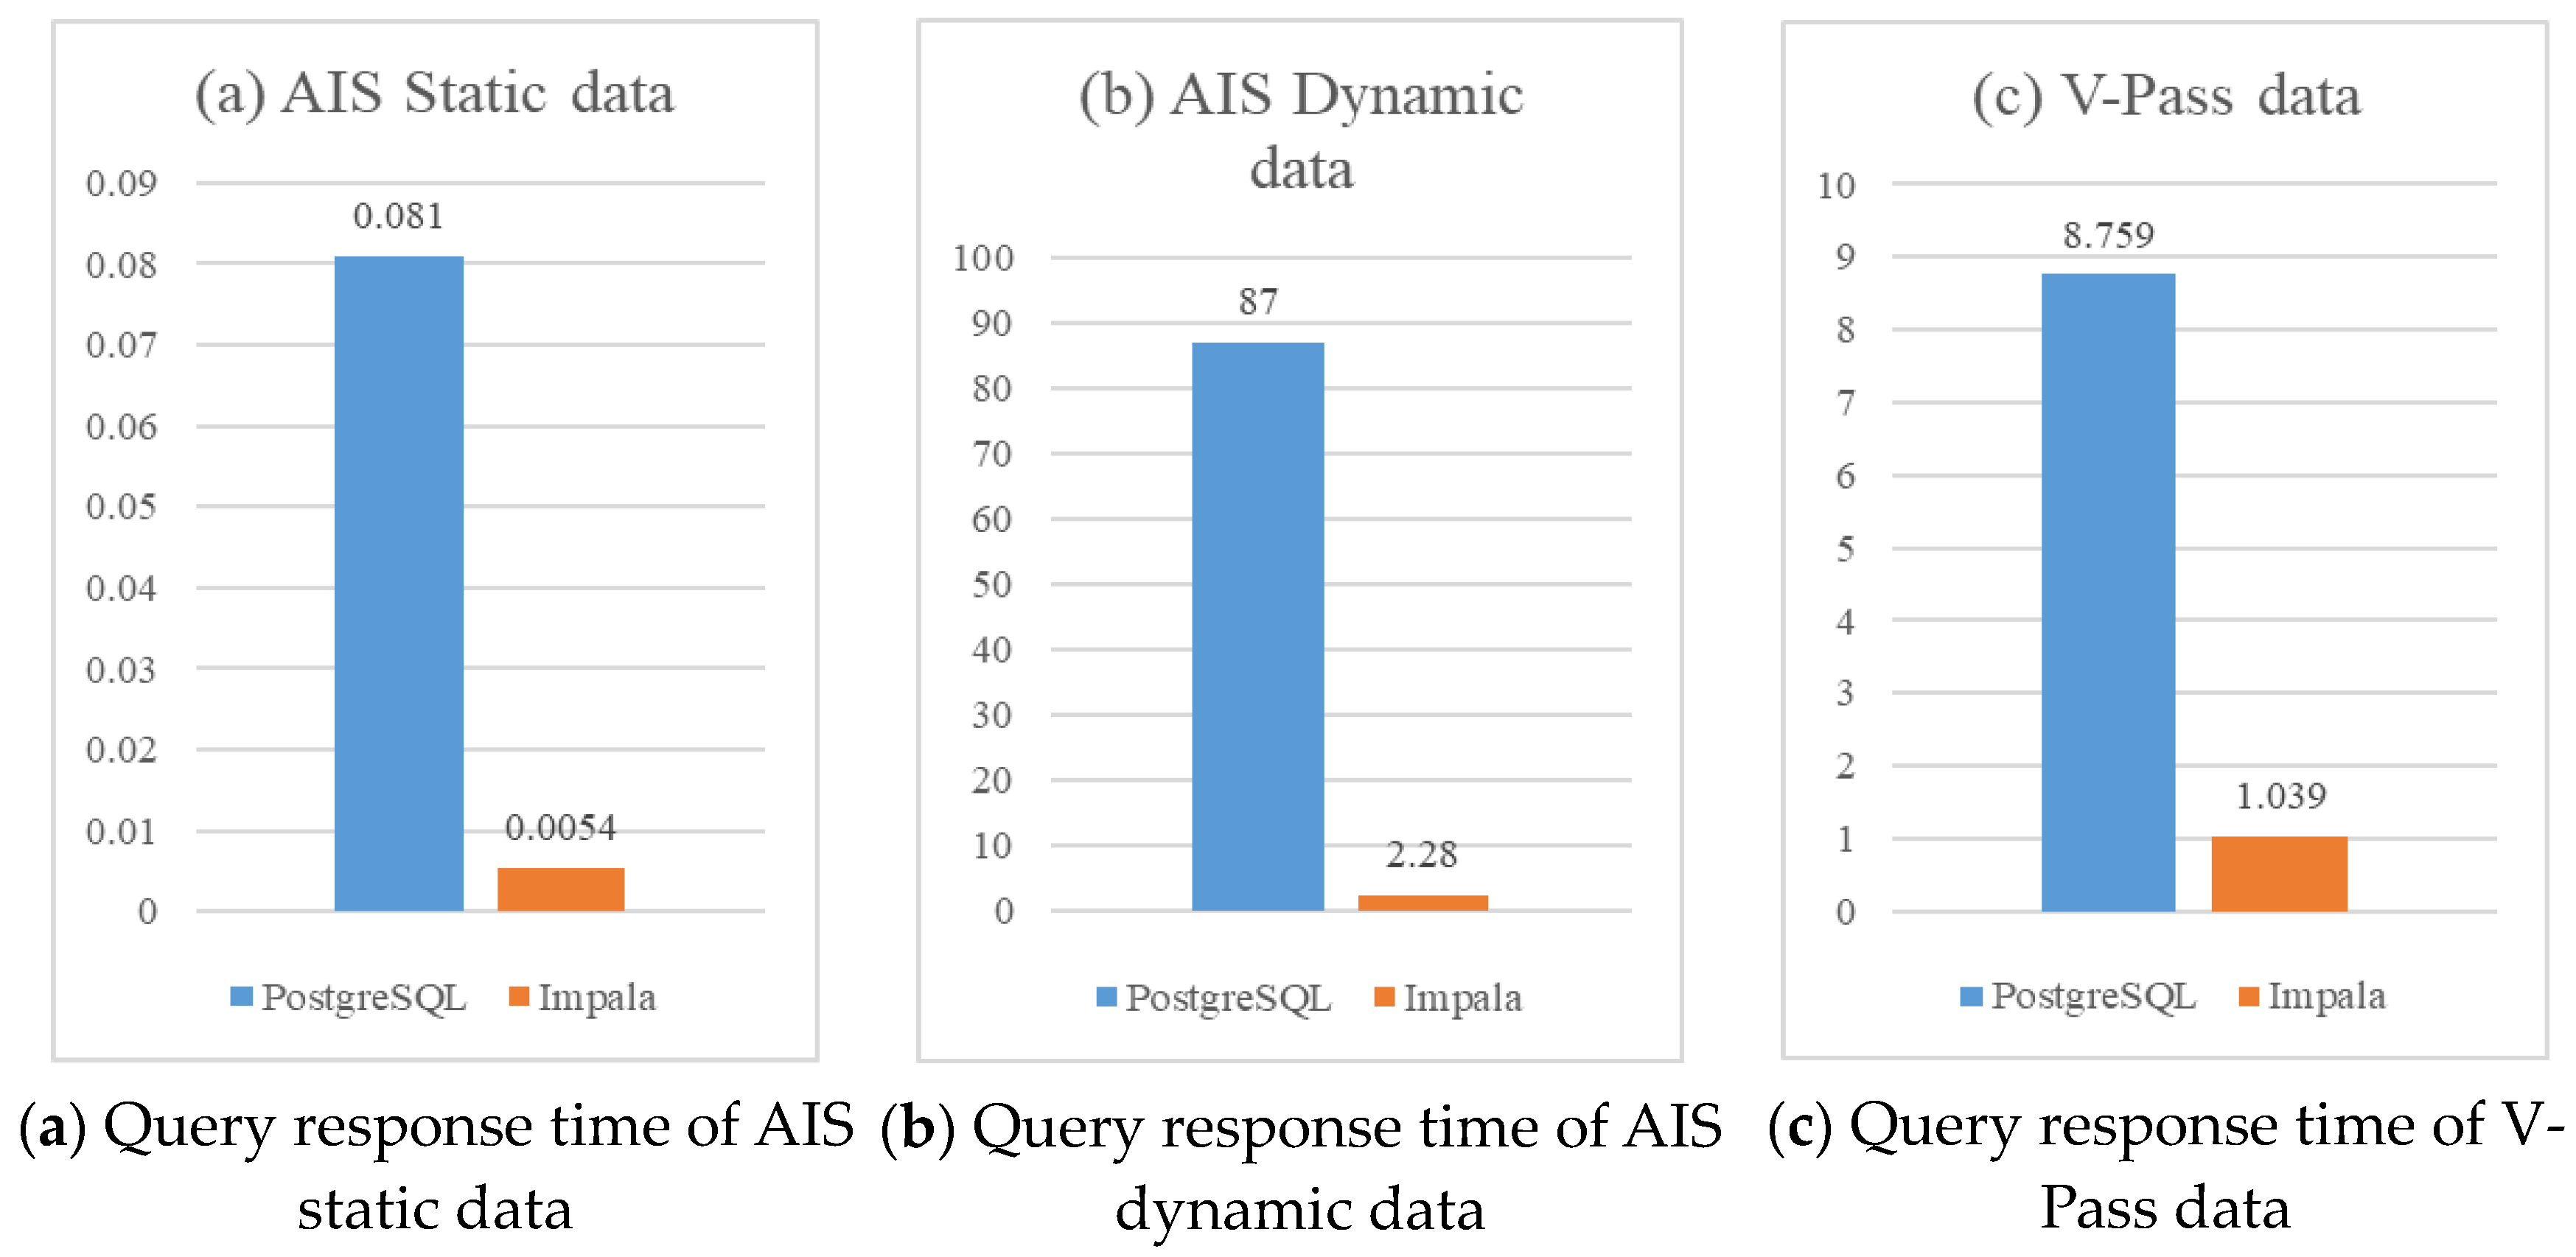
4.1. Data Lakehouse Performance Evaluation
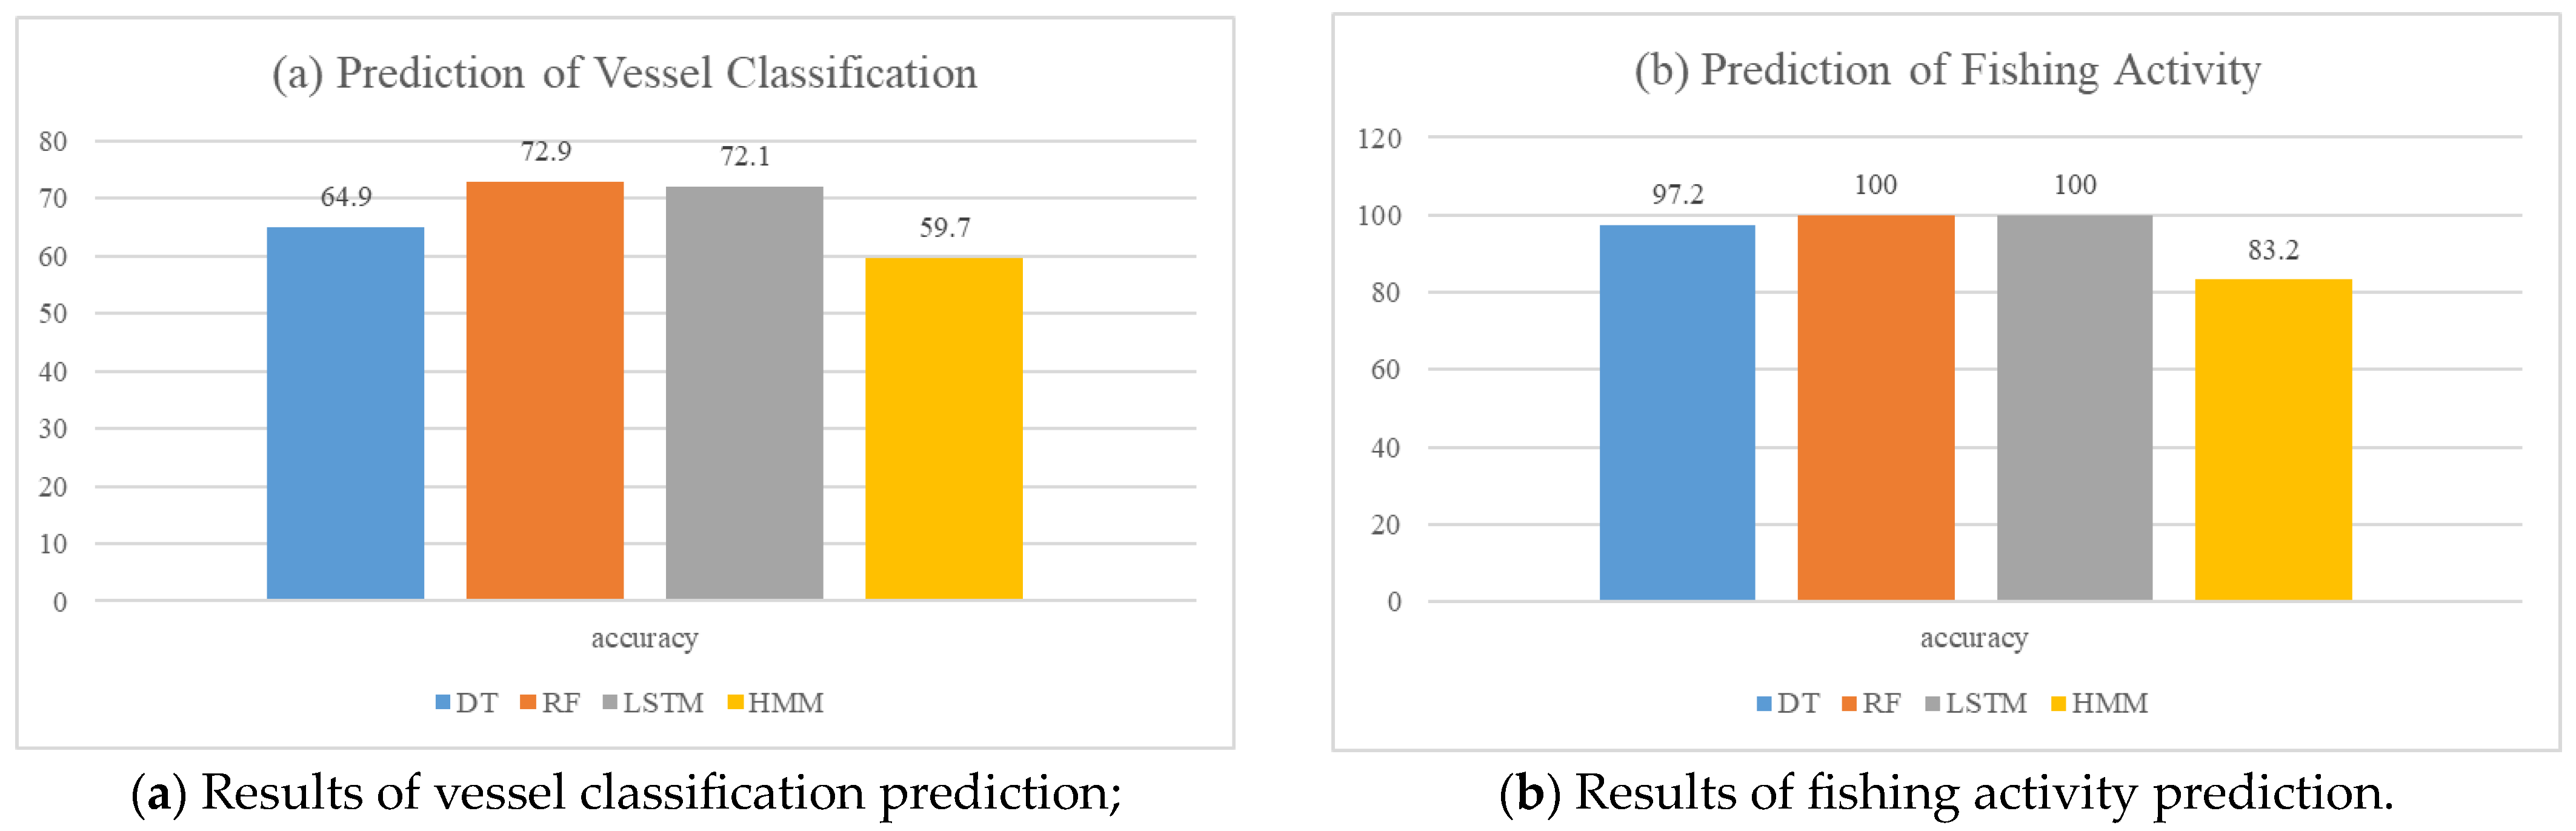
4.2. Marine Analysis Performance Evaluation
5. Conclusions
Author Contributions
Funding
Data Availability Statement
Conflicts of Interest
References
- Data Lakehouse. Available online: https://databricks.com/glossary/data-lakehouse (accessed on 11 January 2023).
- Orescanin, D.; Hlupic, T. Data Lakehouse—A Novel Step in Analytics Architecture. In Proceedings of the 44th International Convention on Information, Communication and Electronic Technology, Opatija, Croatia, 27 September 2021. [Google Scholar]
- Vessel Monitoring System. Available online: https://en.wikipedia.org/wiki/Vessel_monitoring_system (accessed on 11 January 2023).
- Lytra, I.; Vidal, M.E.; Orlandi, F.; Attard, J. A Big Data Architecture for Managing Oceans of Data and Maritime Applications. In Proceedings of the International Conference on Engineering, Technology and Innovation, Madeira, Portugal, 27 June 2017. [Google Scholar]
- Lin, B. Overview of High Performance Computing Power Building for the Big Data of Marine Forecasting. In Proceedings of the 2020 International Conference on Big Data and Informatization Education (ICBDIE), Zhangjiajie, China, 23 April 2020. [Google Scholar]
- Armbrust, M.; Ghodsi, A.; Xin, R.; Zaharia, M. Lakehouse: A New Generation of Open Platforms that Unify Data Warehousing and Advanced Analytics. In Proceedings of the 11th Annual Conference on Innovative Data System Research, Online, 11 January 2021. [Google Scholar]
- Begoli, E.; Goethert, I.; Knight, K. A Lakehouse Architecture for the Management and Analysis of Heterogeneous Data for Biomedical Research and Mega-biobanks. In Proceedings of the 2021 IEEE International Conference on Big Data, Online, 15 December 2021. [Google Scholar]
- Park, S.; Cha, B.R.; Kim, J.W. Designing Marine Data Lakehouse Architecture for Managing Maritime Analytics Application. In Proceedings of the 9th International Conference on Advanced Engineering and ICT-Convergence, Jeju Island, Republic of Korea, 13 July 2022. [Google Scholar]
- Harby, A.A.; Zulkernine, F. From Data Warehouse to Lakehouse: A Comprarative Review. In Proceedings of the 2022 IEEE International Conference on Big Data, Osaka, Japan, 17 January 2022. [Google Scholar]
- Kumar, D.; Li, S. Separating Storage and Compute with the Databricks Lakehouse Platform. In Proceedings of the 2022 IEEE 9th International Conference on Data Science and Advanced Analytics (DSAA), Shenzhen, China, 12 October 2022. [Google Scholar]
- Hery, H.; Lukas, S.; Yugopuspito, P.; Murwantara, I.M.; Krisnadi, D. Website Design for Locating Tuna Fishing Spot Using Naïve Bayes and SVM Based on VMS Data on Indonesian Sea. In Proceedings of the 3rd International Seminar on Research of Information Technology and Intelligent System, Yogyakarta, Indonesia, 10 December 2020. [Google Scholar]
- Zhao, Z.; Tian, Y.; Hong, F.; Huang, H.; Zhou, S. Trawler Fishing Track Interpolation using LSTM for Satellite-based VMS Traces. In Proceedings of the Global Oceans, U.S. Gulf Coast, Singapore, 5 October 2020. [Google Scholar]
- Ahmed, I.; Jun, M.; Ding, Y. A Spatio-Temporal Track Association Algorithm Based on Marine Vessel Automatic Identification System Data. IEEE Trans. Intell. Transp. Syst. 2022, 23, 20783–20797. [Google Scholar] [CrossRef]
- Beek, R.V.; Gaol, J.L.; Agus, S.B. Analysis of Fishing with Led Lights in and around MPA and No Take Zones at Natuna Indonesia through VMS and VIIRS Data. In Proceedings of the IEEE Asia-Pacific Conference on Geoscience, Electronics and Remote Sensing Technology, Jakarta, Indonesia, 7 December 2020. [Google Scholar]
- Huang, J.; Wan, J.; Yu, J.; Zhu, F.; Ren, Y. Edge Computing-Based Adaptable Trajectory Transmission Policy for Vessels Monitoring Systems of Marine Fishery. IEEE Access 2020, 7, 50684–50695. [Google Scholar] [CrossRef]
- Li, X.; Xia, Y.; Su, F.; Wu, W.; Zhou, L. AIS and VBD Data Fusion for Marine Fishing Intensity Mapping and Analysis in the Northern Part of the South China Sea. Int. J. Geo-Inf. 2021, 10, 277. [Google Scholar] [CrossRef]
- Souza, E.N.; Boerder, K.; Matwin, S.; Worm, B. Improving Fishing Pattern Detection from Satellite AIS Using Data Mining and Machine Learning. PLoS ONE 2016, 11, e0163760. [Google Scholar]
- Alba, J.M.M.; Dy, G.C.; Virina, N.I.M.; Samonte, M.J.C. Localized Monitoring Mobile Application for Automatic Identification System (AIS) for Sea Vessels. In Proceedings of the IEEE 7th International Conference on Industrial Engineering and Applications, Paris, France, 4 January 2020. [Google Scholar]
- Prasad, P.; Vatsal, V.; Chowdhury, R.R. Maritime Vessel Route Extraction and Automatic Information System (AIS) Spoofing Detection. In Proceedings of the 2021 International Conference on Advances in Electrical Computing, Communication and Sustainable Technologies (ICAECT), Bhilai, India, 19 February 2021. [Google Scholar]
- Evmides, N.; Odysseos, L.; Michaelides, M.P. An Intelligent Framework for Vessel Traffic Monitoring using AIS Data. In Proceedings of the 23rd IEEE International Conference on Mobile Data Management, Online, 6 June 2022. [Google Scholar]
- Liu, R.W.; Liang, M.; Nie, J.; Garg, S.; Zhang, Y.; Xiong, Z. Extraction of Hottest Shipping Routes: From Positioning Data to Intelligent Surveillance. In Proceedings of the IEEE 22nd International Conference on Information Reuse and Integration for Data Science, Las Vegas, NV, USA, 10 August 2021. [Google Scholar]
- Huang, H.; Cui, X.; Bi, X.; Liu, C.; Hong, F.; Guo, S. FVRD: Fishing Vessels Relationships Discovery System Through Vessel Trajectory. IEEE Access 2020, 8, 112530–112538. [Google Scholar] [CrossRef]
- Xiao, Z.; Fu, X.; Zhao, L.; Zhag, L.; Teo, T.K.; Li, N.; Zhang, W.; Qin, Z. Next-Generation Vessel Traffic Services Systems—From “Passive” to “Proactive”. IEEE Intell. Transp. Syst. Mag. 2022, 15, 363–377. [Google Scholar] [CrossRef]
- Tampakis, P.; Chondrodima, E.; Pikrakis, A.; Theodoridis, Y.; Pristouris, K.; Nakos, H.; Petra, E.; Dalamagas, T.; Kandiros, A.; Markakis, G. Sea Area Monitoring and Analysis of Fishing Vessels Activity: The i4sea Big Data Platform. In Proceedings of the 21st IEEE International Conference on Mobile Data Management, Versailles, France, 30 June 2020. [Google Scholar]
- Han, J.R.; KIM, T.H.; Choi, E.Y.; Choi, H.W. A Study on the Mapping of Fishing Activity using V-Pass Data—Focusing on the Southeast Sea of Korea. J. Korean Assoc. Geogr. Inf. Stud. 2021, 24, 112–125. [Google Scholar]
- Weather Data Open Portal. Available online: https://data.kma.go.kr/cmmn/main.do (accessed on 6 January 2023).
- Ocean Data in Grid Framework. Available online: http://www.khoa.go.kr/oceangrid/khoa/intro.do (accessed on 6 January 2023).
- Apache Hadoop. Available online: https://hadoop.apache.org/ (accessed on 9 January 2023).
- Hue. Available online: https://gethue.com/ (accessed on 9 January 2023).
- Apache Impala. Available online: https://impala.apache.org/ (accessed on 9 January 2023).
- Apache Kudu. Available online: https://kudu.apache.org/ (accessed on 9 January 2023).
- Apache Spark. Available online: https://spark.apache.org/ (accessed on 9 January 2023).
- Apache TEZ. Available online: https://tez.apache.org/ (accessed on 9 January 2023).
- TensorFlow. Available online: https://tensorflow.org/ (accessed on 9 April 2023).
- Keras. Available online: https://keras.io/ (accessed on 9 April 2023).
- Pandas. Available online: https://pandas.pydata.org/ (accessed on 9 April 2023).
- Delta Lake. Available online: https://delta.io/ (accessed on 29 March 2023).


| Type of Vessel-Related Data | Size | Number of Rows | |
|---|---|---|---|
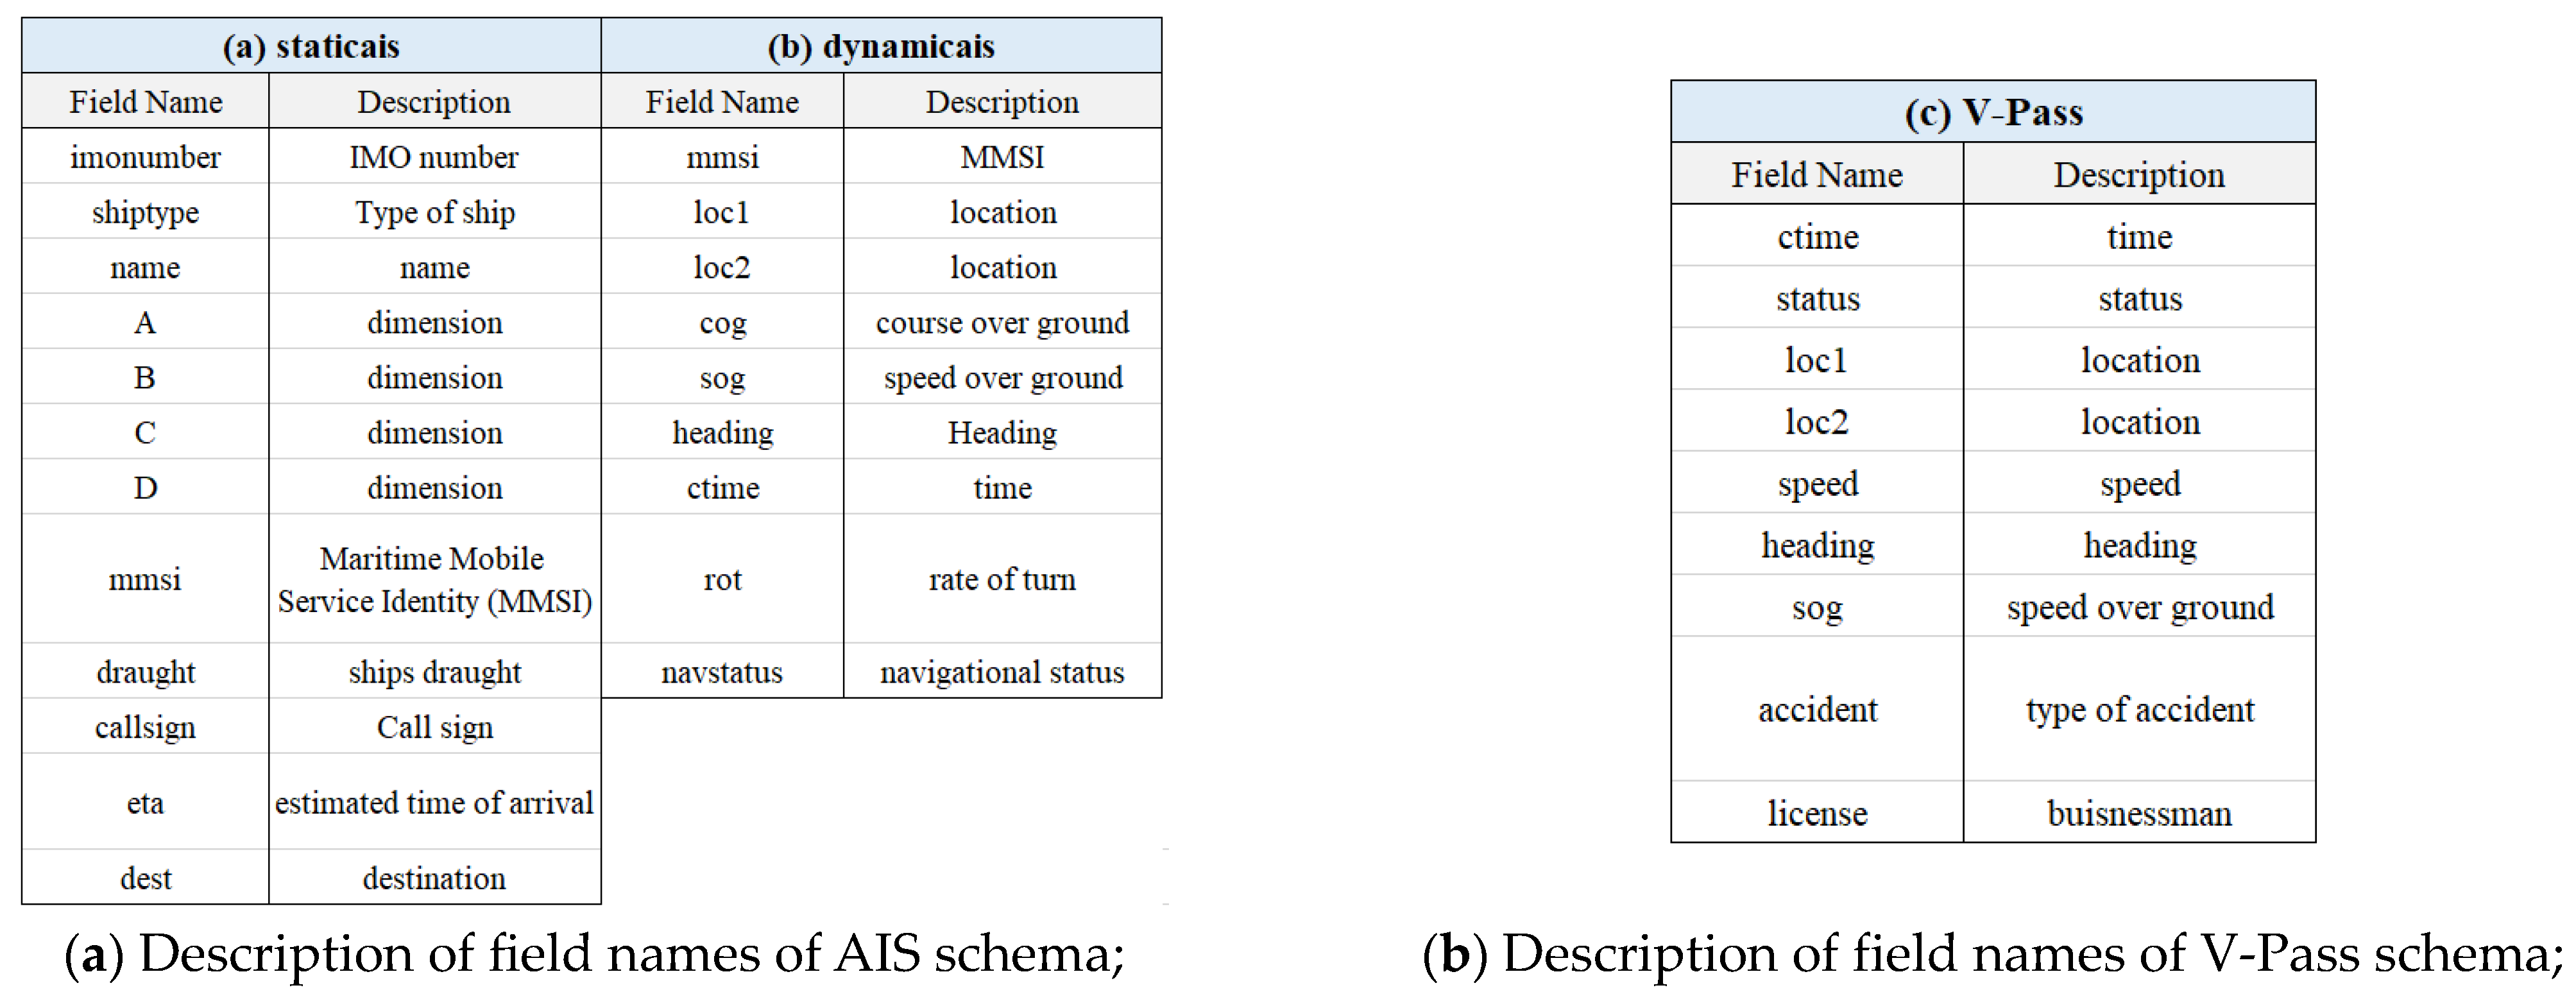
| AIS (Automatic Information System) [5] | (a) staticais | 1.3 MB | 13,856 |
| (b) daynamicais | 31.0 GB | 354,857,410 | |
| (c) V-Pass (Vessel-Pass) [25] | 2.8 GB | 35,053,969 | |
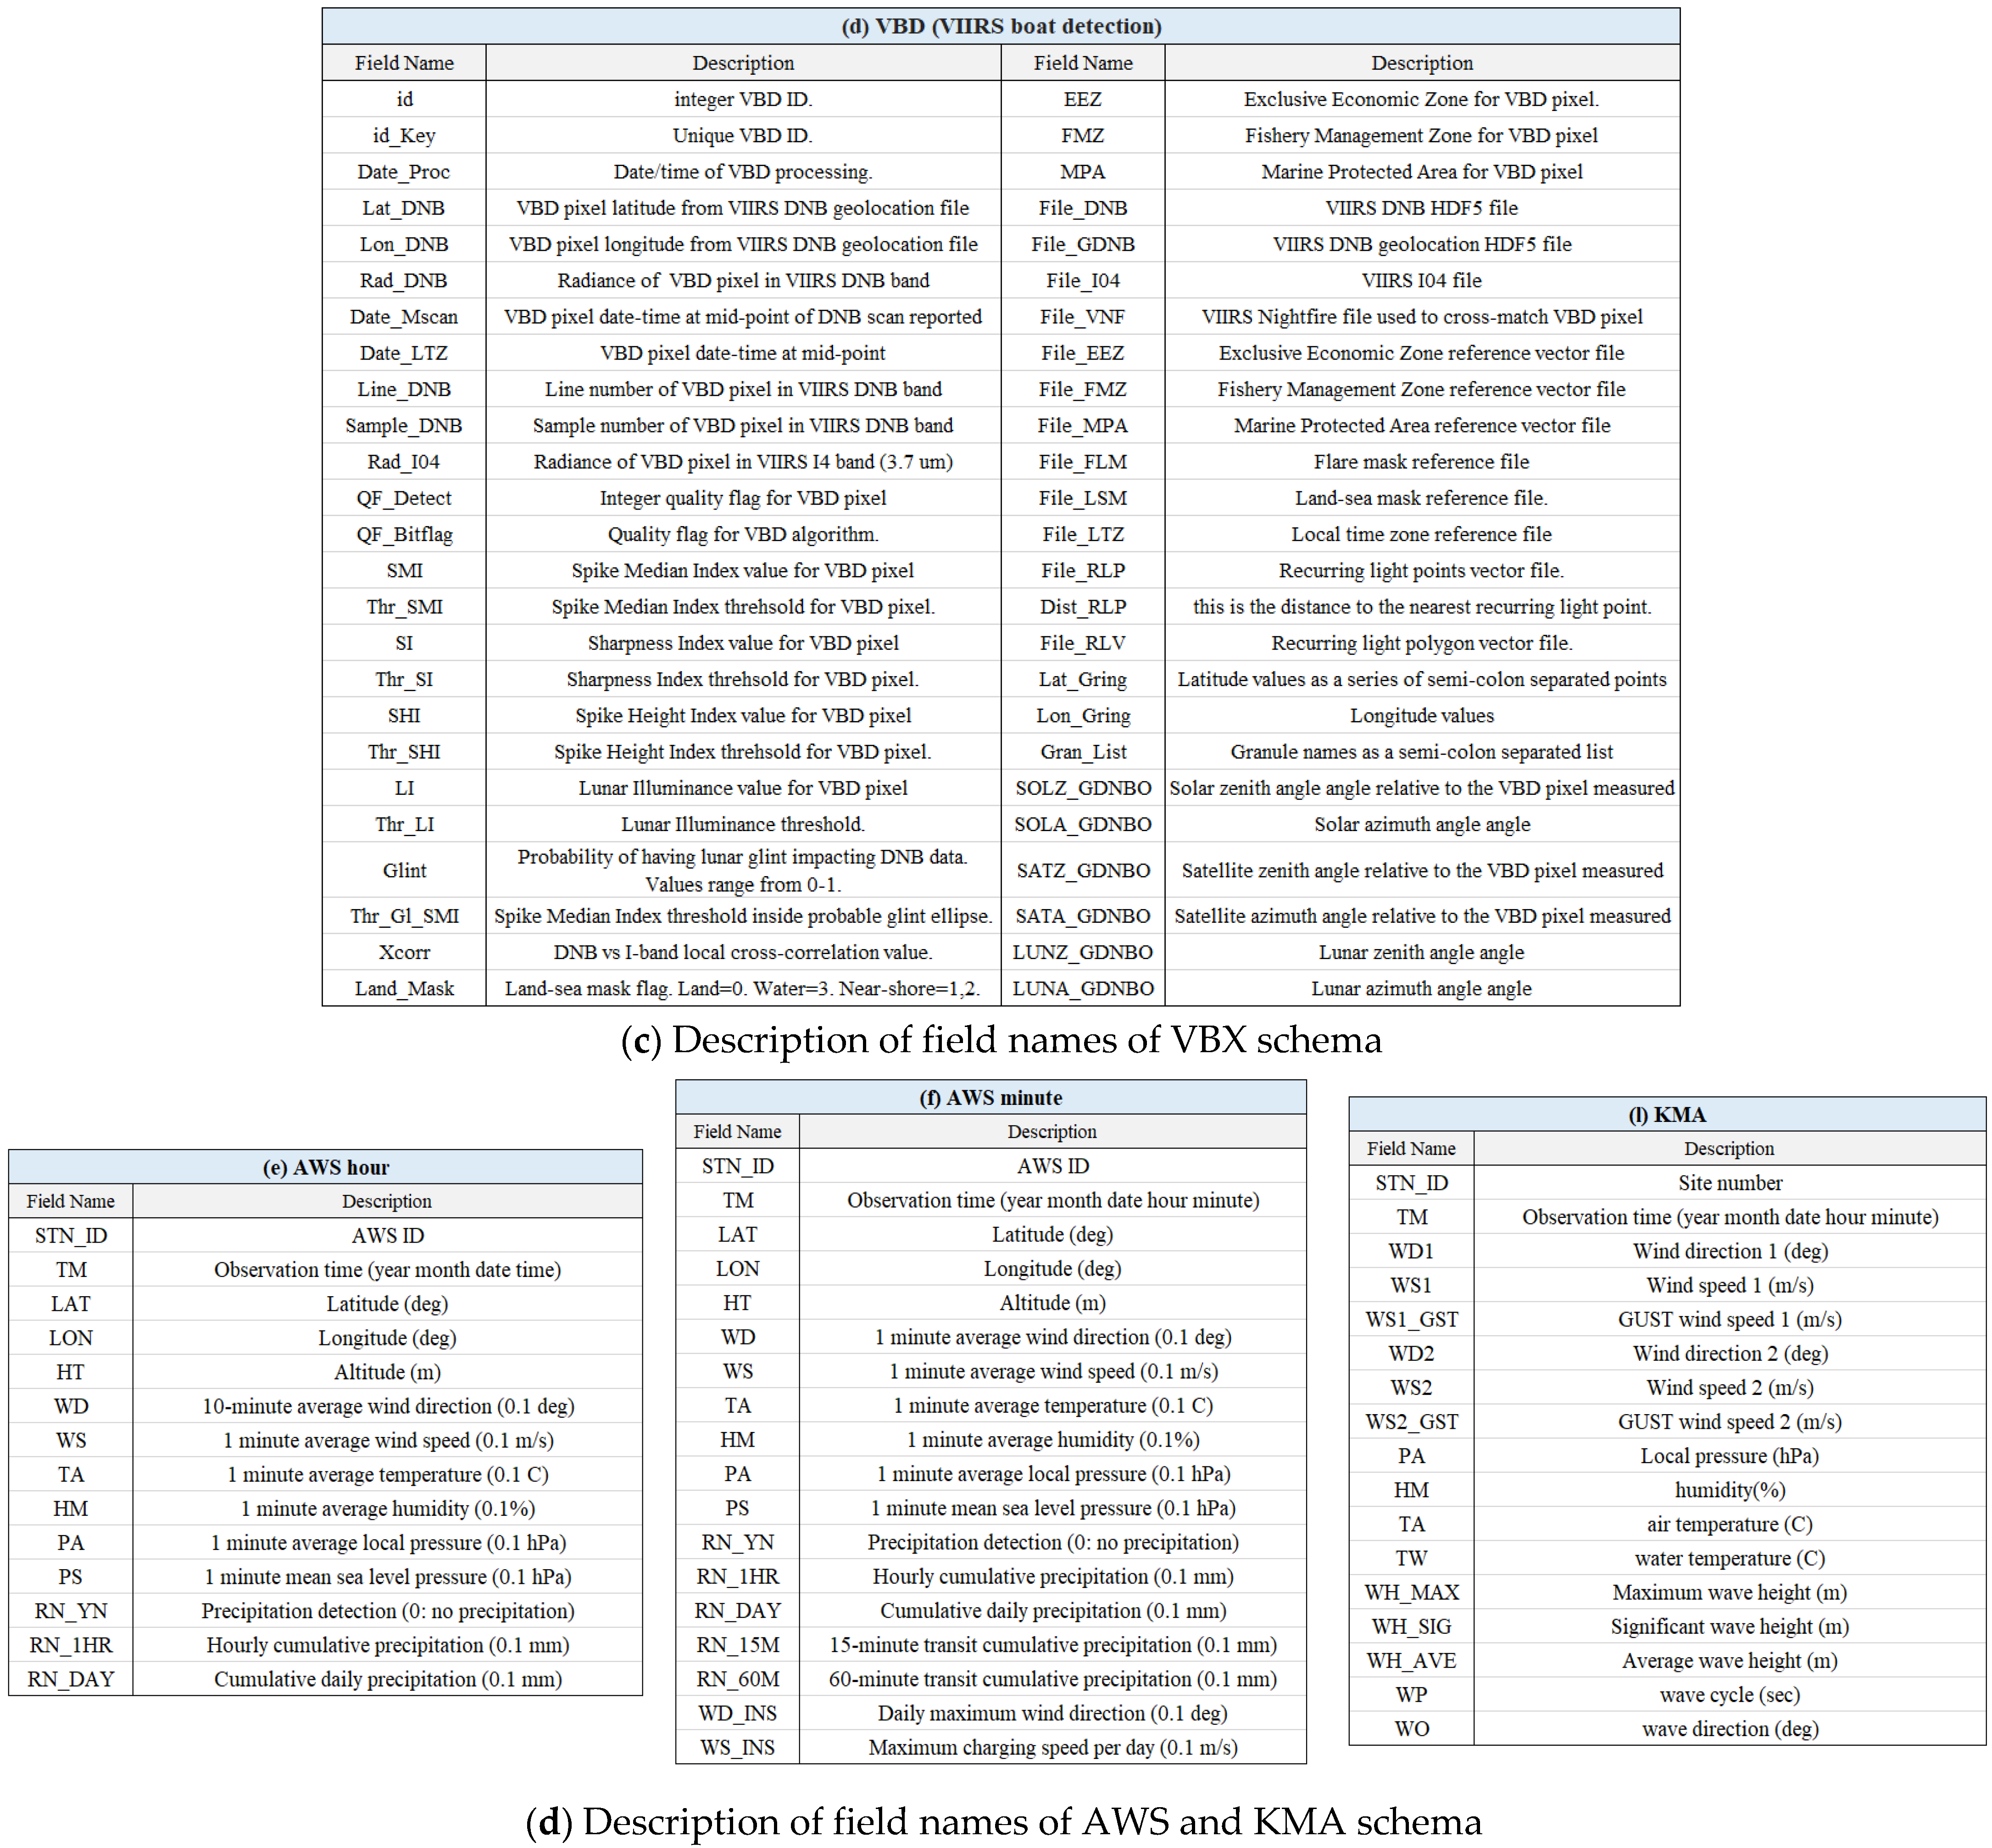
| (d) VBD (VIIRS boat detection) [16] | 10.3 GB | 9,709,207 | |
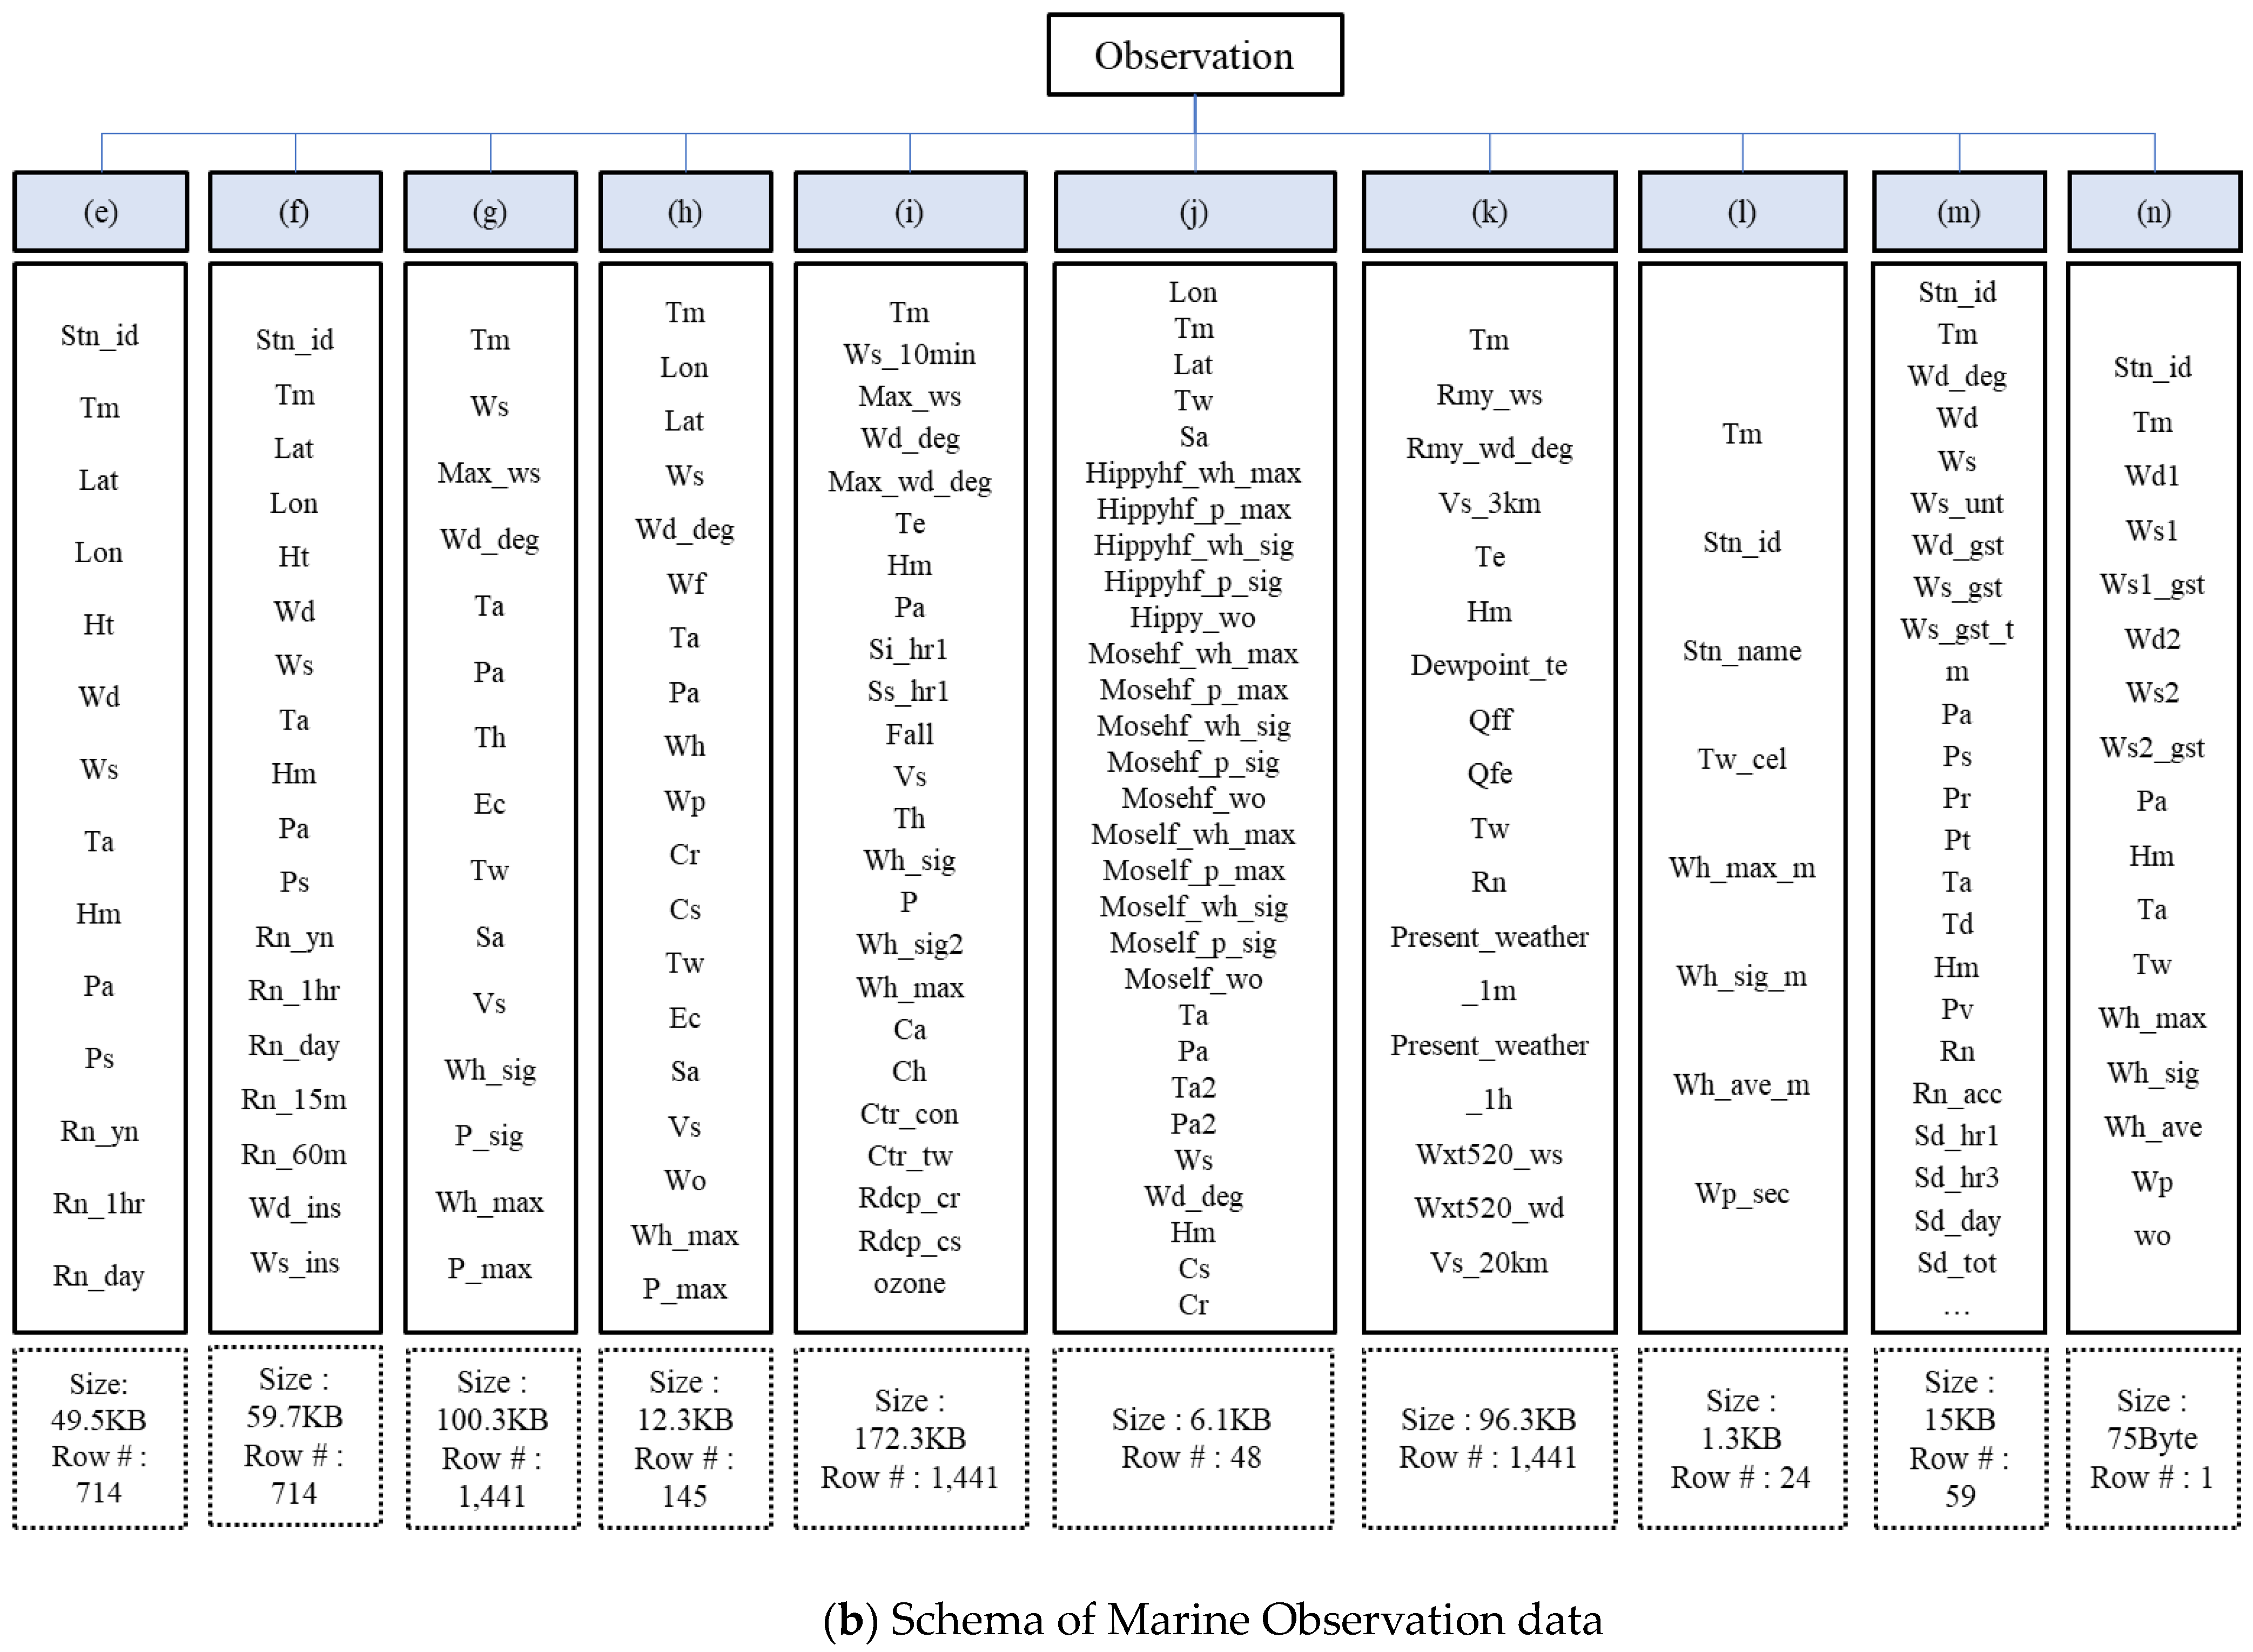
| Observation data | (e) Disaster Prevention Weather Observatory (hour) [26]: Aws_1hr_2019123123 | 49.5 KB | 714 |
| (f) Disaster Prevention Weather Observatory (minute) [26]: Aws_min_201912310000 | 59.7 KB | 714 | |
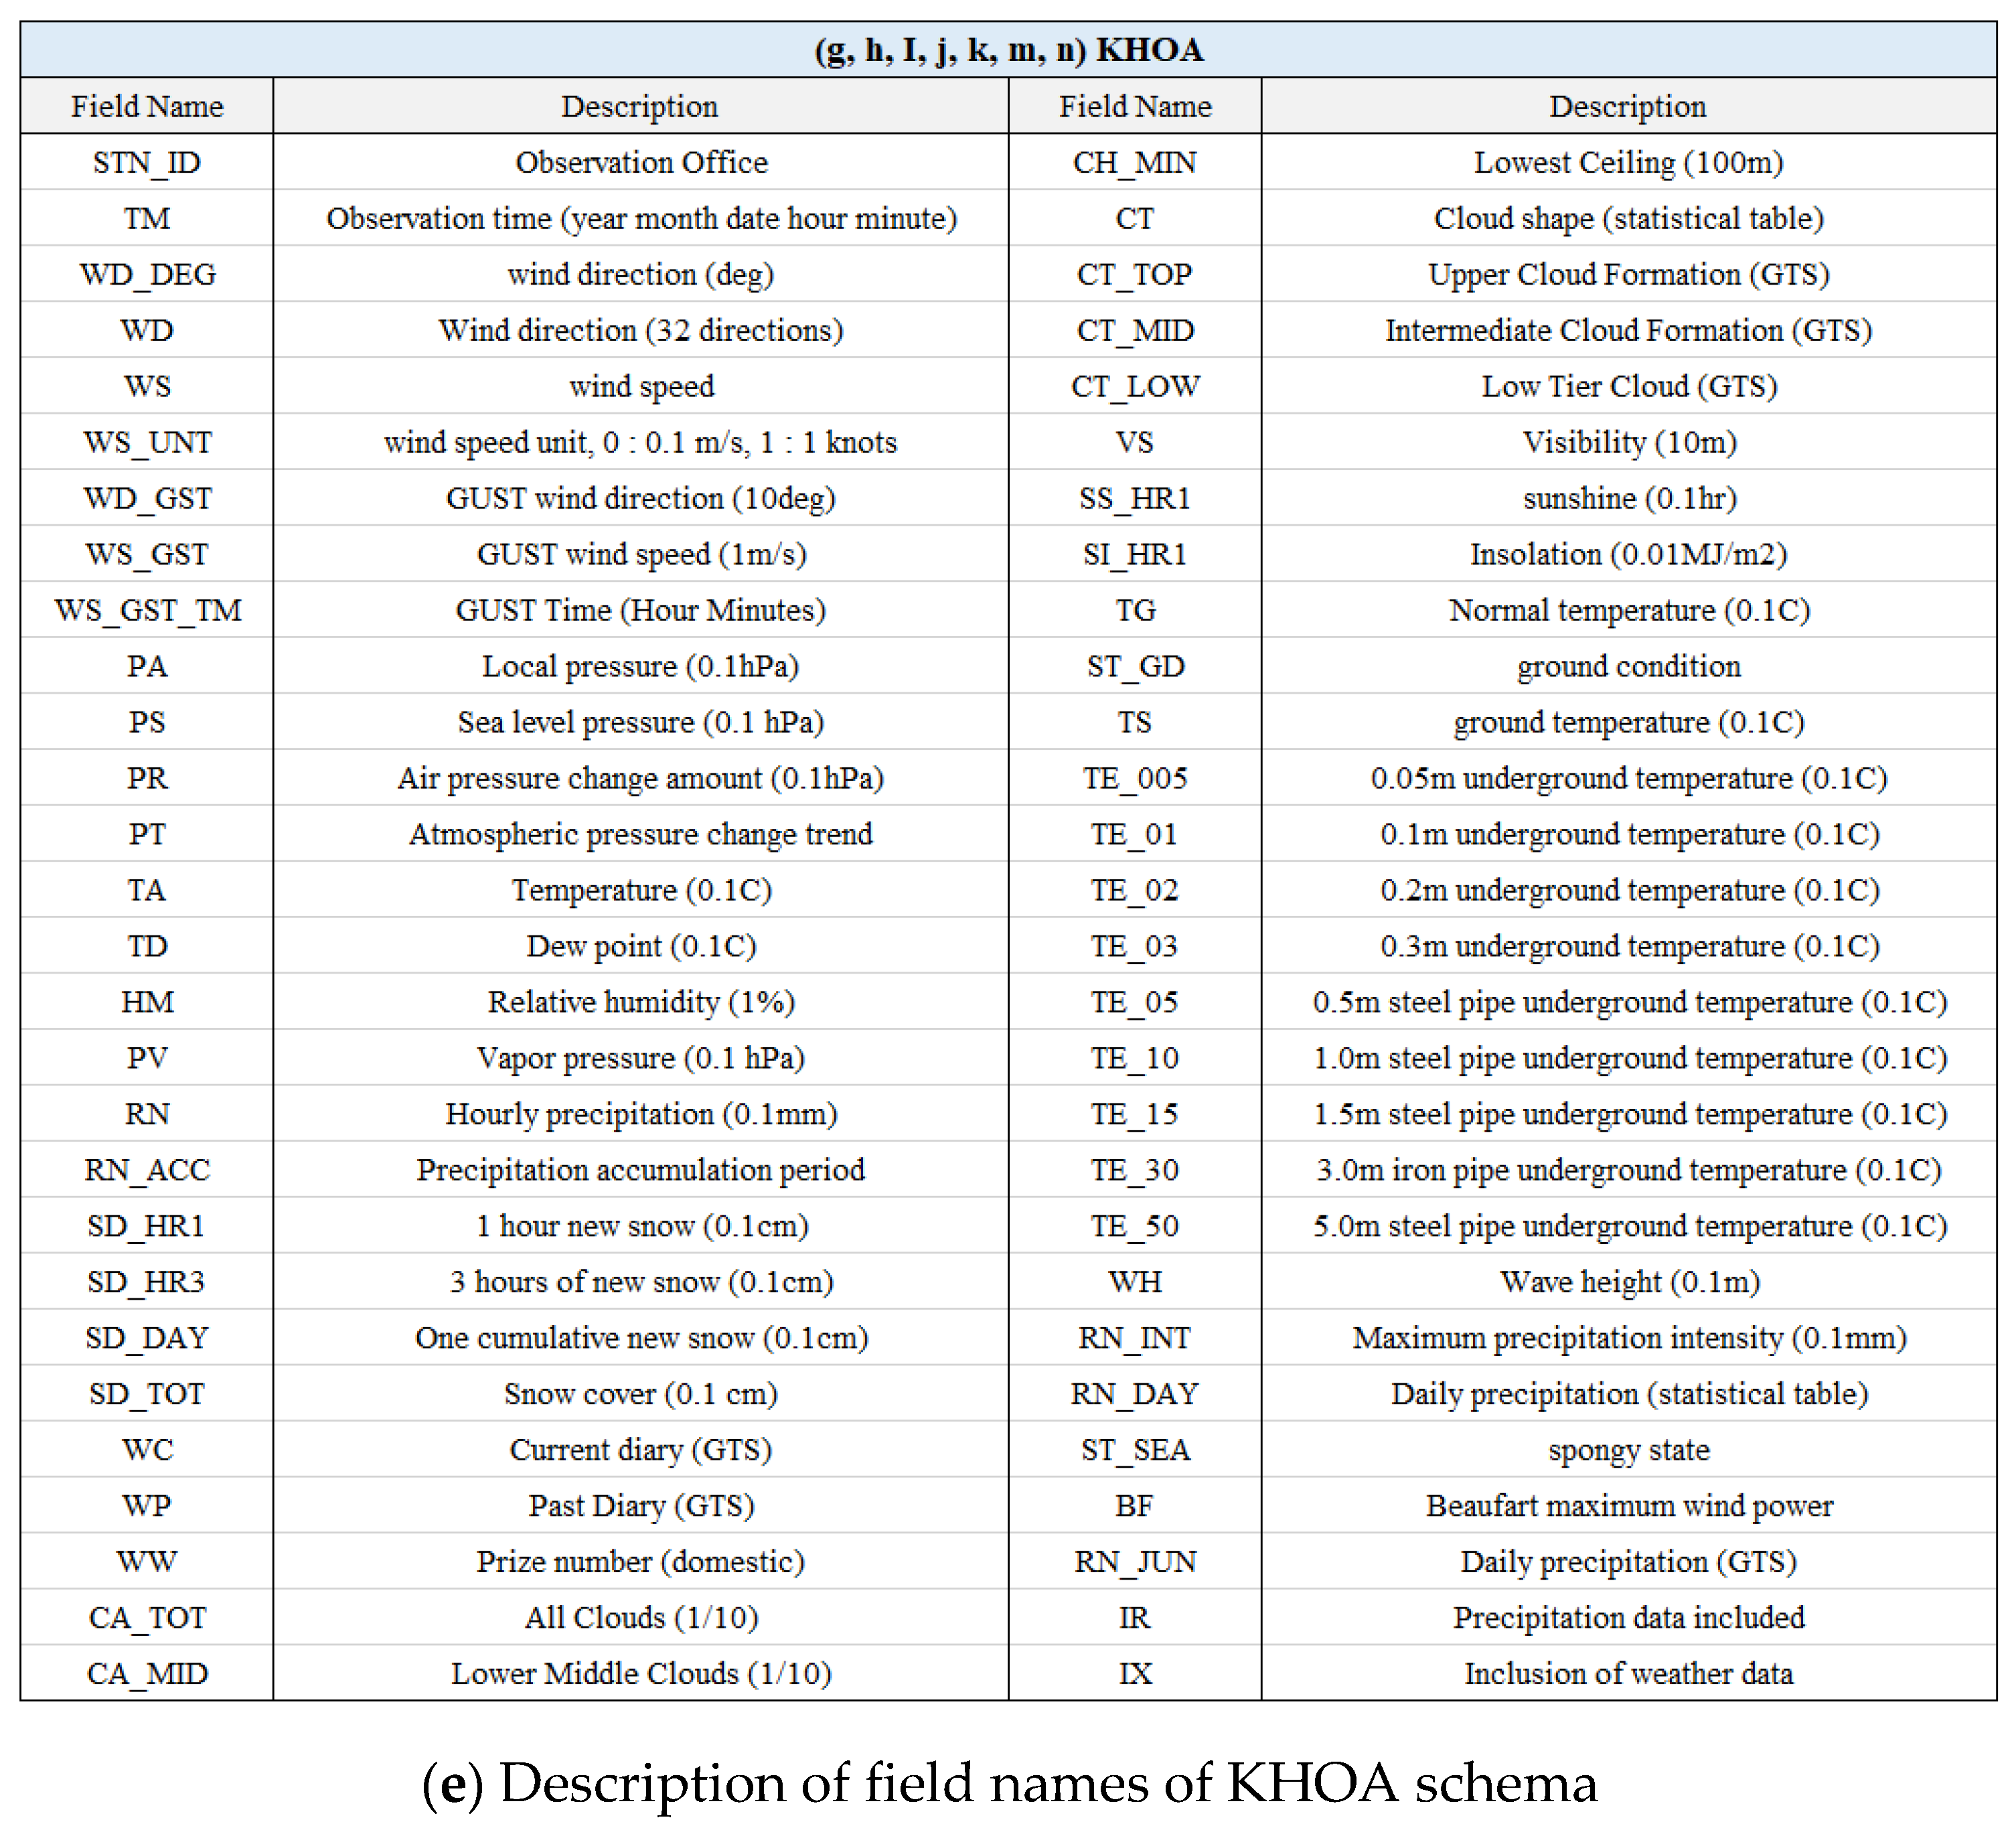
| (g) tide station [27]: Khoa_79980120191216 | 100.3 KB | 1441 | |
| (h) synoptic weather station [26]: Khoa_busan20191216 | 12.3 KB | 145 | |
| (i) Main route marine observation buoy [27]: Khoa_ieodo20191216 | 172.3 KB | 1441 | |
| (j) Marine observation buoys in major sea areas [27]: Khoa_jjea20191216 | 6.1 KB | 48 | |
| (k) wave observation buoy [26]: Khoa_sf_0001200191216 | 96.3 KB | 1441 | |
| (l) sea fog observatory [27]: Kma_utc2019121622475 | 1.3 KB | 24 | |
| (m) marine science base [27]: Shk60_202001050002 | 15 KB | 59 | |
| (n) Marine weather observation buoy [26]: Vbko60_20200106110022194 | 75 Byte | 1 | |
| Cluster | CPU | RAM | SSD | NIC | GPU | OS | |
|---|---|---|---|---|---|---|---|
| Vessel Big Data cluster | master node | Intel i9-7940x | 64 GB | 2 TB | 1Gb/1Gb | - | CentOS 7.7 |
| slaver node 01 | Intel i9-7940x | 64 GB | 2 TB | 1Gb/1Gb | - | CentOS 7.7 | |
| slaver node 02 | Intel i9-7940x | 64 GB | 2 TB | 1Gb/1Gb | - | CentOS 7.7 | |
| slaver node 03 | Intel i9-7940x | 64 GB | 2 TB | 1Gb/1Gb | - | CentOS 7.7 | |
| Vessel AI cluster | ai node 01 | Intel i9-7940x | 64 GB | 2 TB | 1Gb/1Gb | 2080 * 2 | Ubuntu 18.04 |
| ai node 02 | Intel i9-7940x | 64 GB | 2 TB | 1Gb/1Gb | 2080 * 2 | Ubuntu 18.04 | |
| AIS | Location | ||||
|---|---|---|---|---|---|
| ship | ship type | ship number | period | latitude | longitude |
| cargo | 70–79 | 9058 | 2018-12-01 – 2019-12-19 | 33°–38° | 124°–132° |
| tanker | 80–89 | 3104 | |||
| passenger | 60–69 | 133 | |||
| fishing | 30 | 458 | |||
| other | 1103 | ||||
| (a) Number of Row | (b) Extraction Data (Per 2 Min) | (c) Extraction Data (Per 1 Day) | |
|---|---|---|---|
| Fishing | 17,853,172 | 131,390 | 1761 |
| Ferry | 8,236,992 | 143,757 | 2803 |
| Cargo | 56,377,013 | 292,082 | 5273 |
Disclaimer/Publisher’s Note: The statements, opinions and data contained in all publications are solely those of the individual author(s) and contributor(s) and not of MDPI and/or the editor(s). MDPI and/or the editor(s) disclaim responsibility for any injury to people or property resulting from any ideas, methods, instructions or products referred to in the content. |
© 2023 by the authors. Licensee MDPI, Basel, Switzerland. This article is an open access article distributed under the terms and conditions of the Creative Commons Attribution (CC BY) license (https://creativecommons.org/licenses/by/4.0/).
Share and Cite
Park, S.; Yang, C.-S.; Kim, J. Design of Vessel Data Lakehouse with Big Data and AI Analysis Technology for Vessel Monitoring System. Electronics 2023, 12, 1943. https://doi.org/10.3390/electronics12081943
Park S, Yang C-S, Kim J. Design of Vessel Data Lakehouse with Big Data and AI Analysis Technology for Vessel Monitoring System. Electronics. 2023; 12(8):1943. https://doi.org/10.3390/electronics12081943
Chicago/Turabian StylePark, Sun, Chan-Su Yang, and JongWon Kim. 2023. "Design of Vessel Data Lakehouse with Big Data and AI Analysis Technology for Vessel Monitoring System" Electronics 12, no. 8: 1943. https://doi.org/10.3390/electronics12081943
APA StylePark, S., Yang, C.-S., & Kim, J. (2023). Design of Vessel Data Lakehouse with Big Data and AI Analysis Technology for Vessel Monitoring System. Electronics, 12(8), 1943. https://doi.org/10.3390/electronics12081943