Article

Large-Area Monitoring of Radiofrequency Electromagnetic Field Exposure Levels from Mobile Phone Base Stations and Broadcast Transmission Towers by Car-Mounted Measurements around Tokyo

National Institute of Information and Communications Technology, Koganei 1848795, Japan
*
Author to whom correspondence should be addressed.
Electronics 2023, 12(8), 1835; https://doi.org/10.3390/electronics12081835
Submission received: 14 February 2023 / Revised: 14 March 2023 / Accepted: 14 March 2023 / Published: 12 April 2023

Abstract

:
Car-mounted measurements of radiofrequency electromagnetic exposure levels were carried out in a large area around Tokyo. Prior to the electric field (E-field) measurements using a car, the effect of the car body was evaluated in an anechoic chamber. The measurements between May 2021 and February 2022 were carried out within a radius of 100 km centering on Nihonbashi, Tokyo, with a measurement distance of about 13,800 km. The measurement results were averaged in the reference area mesh (1 km2). It was found that the E-field strengths of FM/TV frequency bands are lower than that of mobile phone base stations. It was also found that the E-field strength of only the 5G frequency band is approximately 20–30 dB lower than that of all mobile phone systems. However, note that it is possible to depend on the data traffic of 5G. The E-field strength of all bands is higher in Tokyo than in other prefectures. Additionally, repeated measurements were carried out to investigate the reproducibility of the measured E-field. The standard deviation is less than 3 dB along the same route, and a similar tendency of E-field strength by the car to the time-averaged results of spot measurements in the past was confirmed. Finally, the relationship of E-field strength with population density was investigated. It was found that the E-field strength from mobile phone base stations has a positive relationship with population density.

1. Introduction

The authors have been conducting research for the purpose of quantitatively grasping the actual conditions of radiofrequency (RF) electromagnetic field (EMF) exposure levels in daily life and investigating the optimal way of risk communication using monitoring data since 2019 [1,2,3,4,5]. Studies on monitoring RF EMF exposure levels have also been conducted in other countries, especially those of the European Union [6,7,8,9,10,11,12,13,14,15,16,17,18,19,20,21,22]. In our spot measurement, we measured the RF EMF exposure level from mobile phone base stations and broadcast transmission stations in Tokyo suburbs and regional cities and compared them with past measurement results [1,2,3]. It was confirmed that the RF EMF exposure levels from mobile phone base stations are about three times higher than those obtained from past measurements in both urban and suburban areas. However, they are sufficiently low compared with the Japanese radio wave radiation protection guidelines [23], with a median value of approximately 1/10,000 or less [1]. Additional spot measurements in dwellings have confirmed that owing to the widespread use of wireless local area networks (W-LANs), the RF EMF exposure levels from W-LANs are approximately 50% of the exposure levels from mobile phone base stations [4].
Measurements of RF EMF exposure levels in a wide area were also carried out in Japan and overseas by installing measuring instruments in a car [24,25,26,27,28,29,30]. Unlike spot measurements, the main advantage of measurements with a moving car is that RF EMF levels can be easily measured in a wide area. It has been reported [24,25,26,27] that the transmitted power from mobile phone terminals was measured in a car. In particular, in [24,26], the authors used a head phantom, which simulates the electric properties of a human head, to measure RF EMF levels in a situation similar to that during voice calls. In [25,28,29,30], the authors measured RF EMF exposure levels from mobile phone base stations using an isotropic E-field probe. Estenberg and Augustsson reported their car-mounted measurements in Sweden at a frequency range of 30 MHz to 3 GHz using a three-axis antenna over a driving distance of 115 km [28]. One of the concerns from the viewpoint of RF EMF exposure is that it is difficult to obtain time-averaged exposure levels at the same point when driving. However, extensive amounts of measurements ensure that the median value is robust, as described in [28]. Aerts et al. investigated a method of predicting EMF exposure levels based on car-measured results [29]. Wang et al. also studied the prediction using an artificial neural network (ANN) model with car measurements [30]. They carried out E-field measurements along a 65 km route in Paris to evaluate the prediction using the ANN. In Japan, Kurosaki et al. investigated the relationship between transmitted power from a mobile phone and electric field (E-field) strength from mobile phone base stations for the 4th generation (4G) mobile phone system around Tokyo for about 8 h [25]. Since the power transmitted from a phone was the focus, only the frequency bandwidths allocated for one mobile operator were considered in the measurement of the E-field strength from the base stations [25].
In this paper, E-field measurements from May 2021 to February 2022 using a car driven within a radius of 100 km centered on Nihonbashi, Tokyo, which covers the entire areas of metropolitan Tokyo, Kanagawa, Saitama, and Chiba prefectures, and partial areas of Ibaraki, Tochigi, Gunma, Shizuoka, and Yamanashi prefectures are reported. The total measurement distance was about 13,000 km. In our measurement, the whole frequency range of mobile phone systems, including 5th generation (5G) systems, FM broadcasting, and terrestrial digital TV broadcasting, was considered. Prior to the measurements, the measurement system installed in the car was evaluated in a large anechoic chamber. In addition to the above, there are three discussions, as follows. The first measurement is to evaluate the effect of switching a three-axis isotropic probe on the measured E-field strength. The second one is to investigate the relationship of E-field strength by the car with the time-averaged E-field strength. Finally, the relationship between population density and E-field strength is discussed.

2. Materials and Methods

2.1. E-Field Measurement Equipment Mounted on a Car

A commercial hybrid car was modified for measuring the E-field strength of RF EMF (Figure 1). Two three-axis isotropic probes (Narda S.T.S. GmbH) for a low-frequency range (low-frequency probe) of 27 MHz to 3 GHz and for a high-frequency range (high-frequency probe) of 420 MHz to 6 GHz were installed in a radome on the roof of the car. The height of the probe was about 2.2 m from the ground. It is reported that the E-field strength tends to be slightly higher than that at the height of a person [2]. The E-field strengths detected by the probes were recorded together with information, including global positioning system (GPS) data through a spectrum analyzer (Narda S.T.S. GmbH) installed in the cabin. One of the unique points is that no additional engine was installed since the power supply capacity from the originally installed battery was sufficient to operate the measuring equipment. This is a benefit that ensures workability without reducing the space in the cabin. Note that it was confirmed that there was almost no difference in the noise level between when the equipment was mounted in the car, including driving, and when it was not.

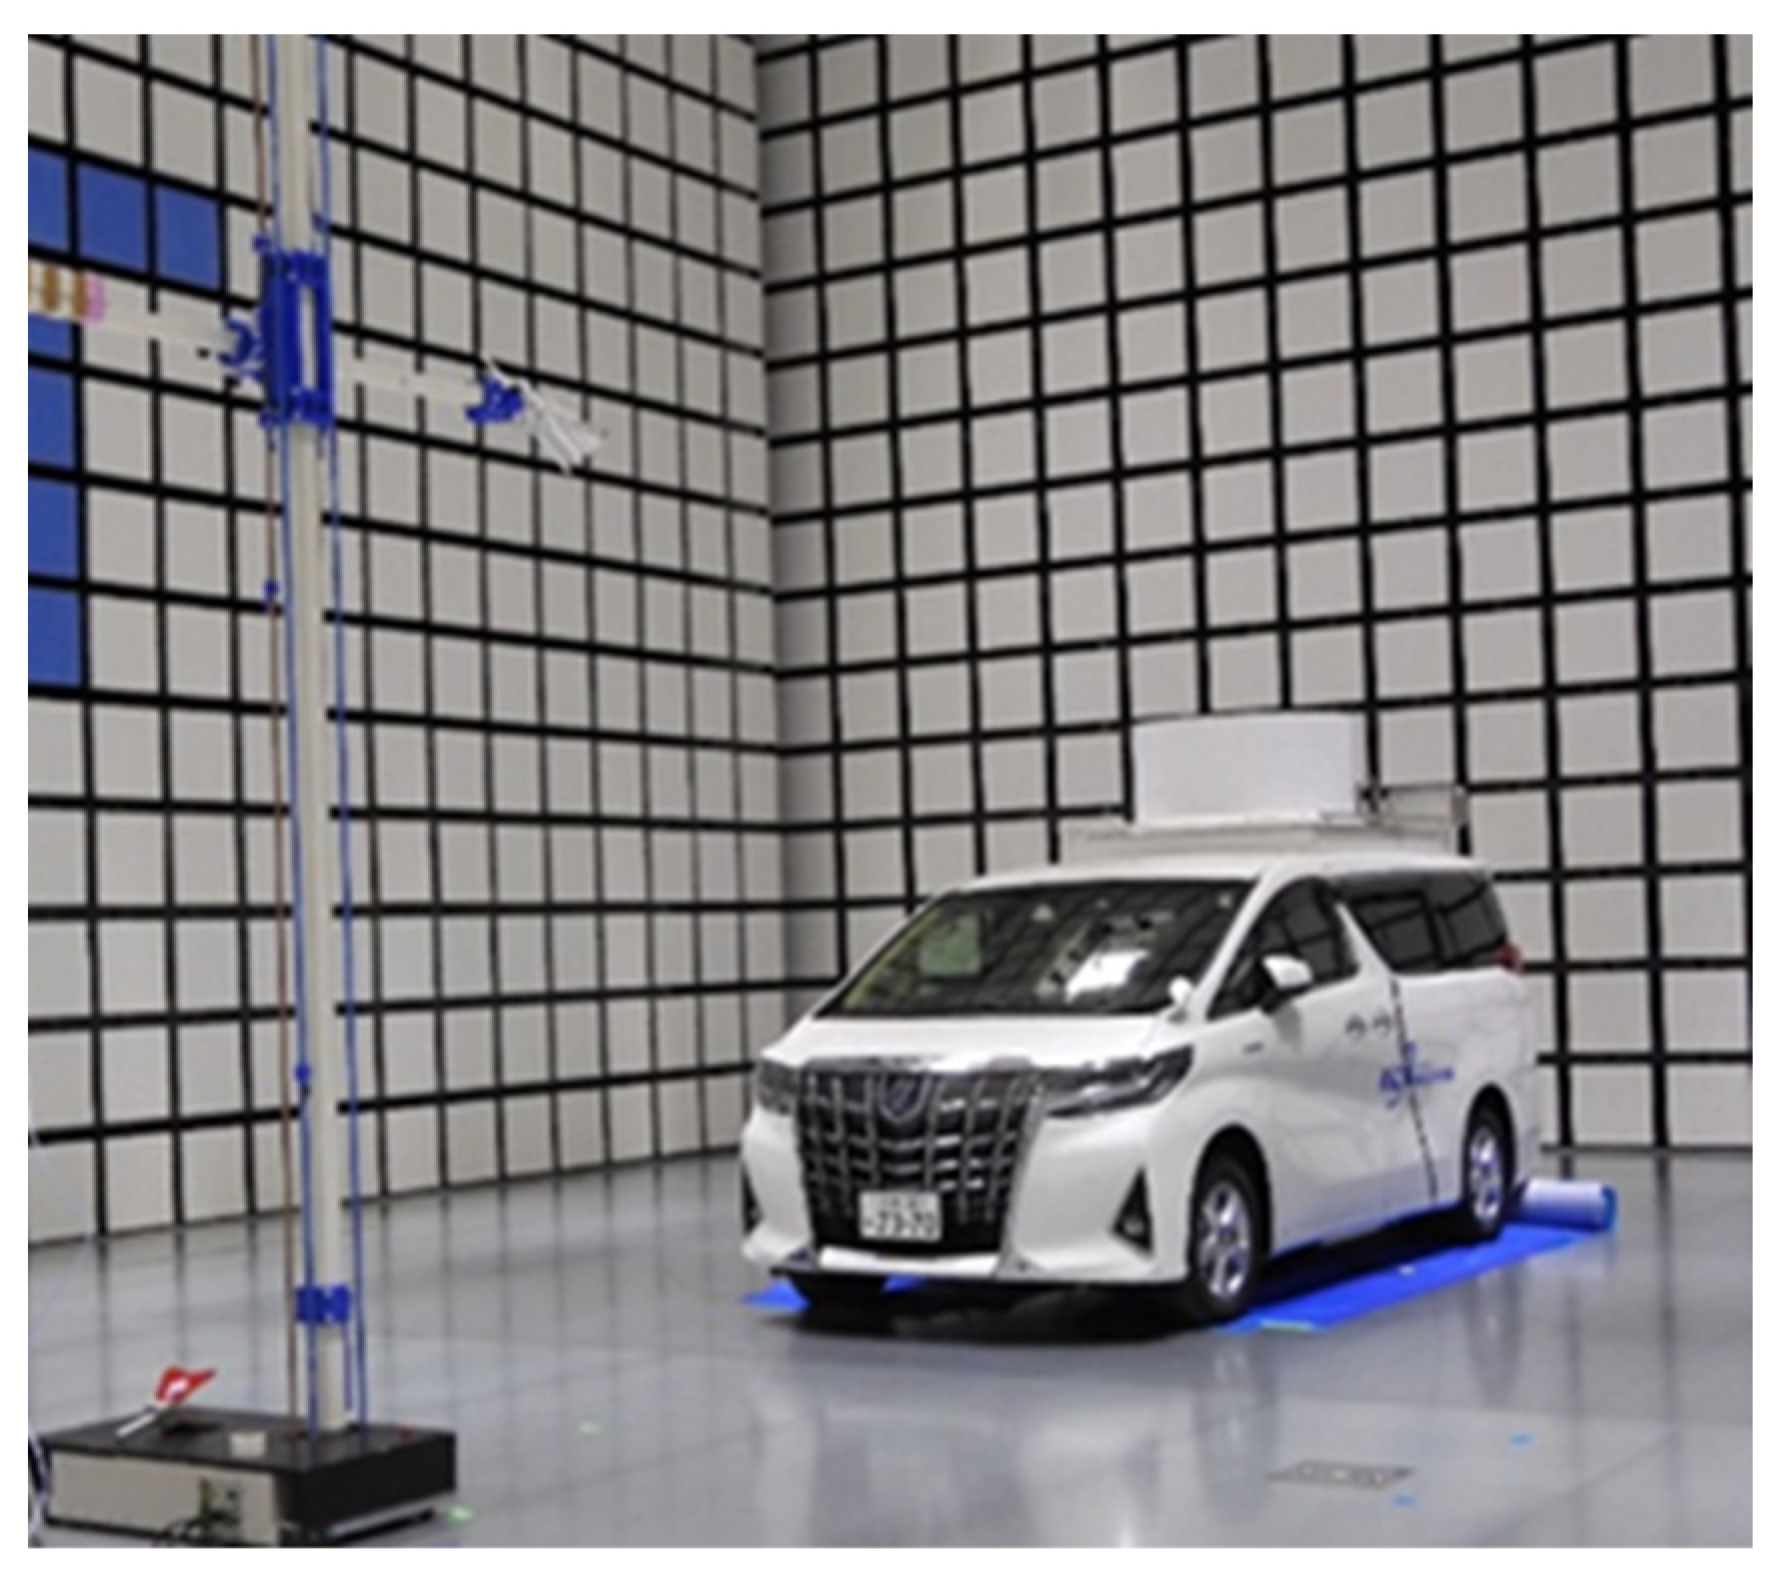
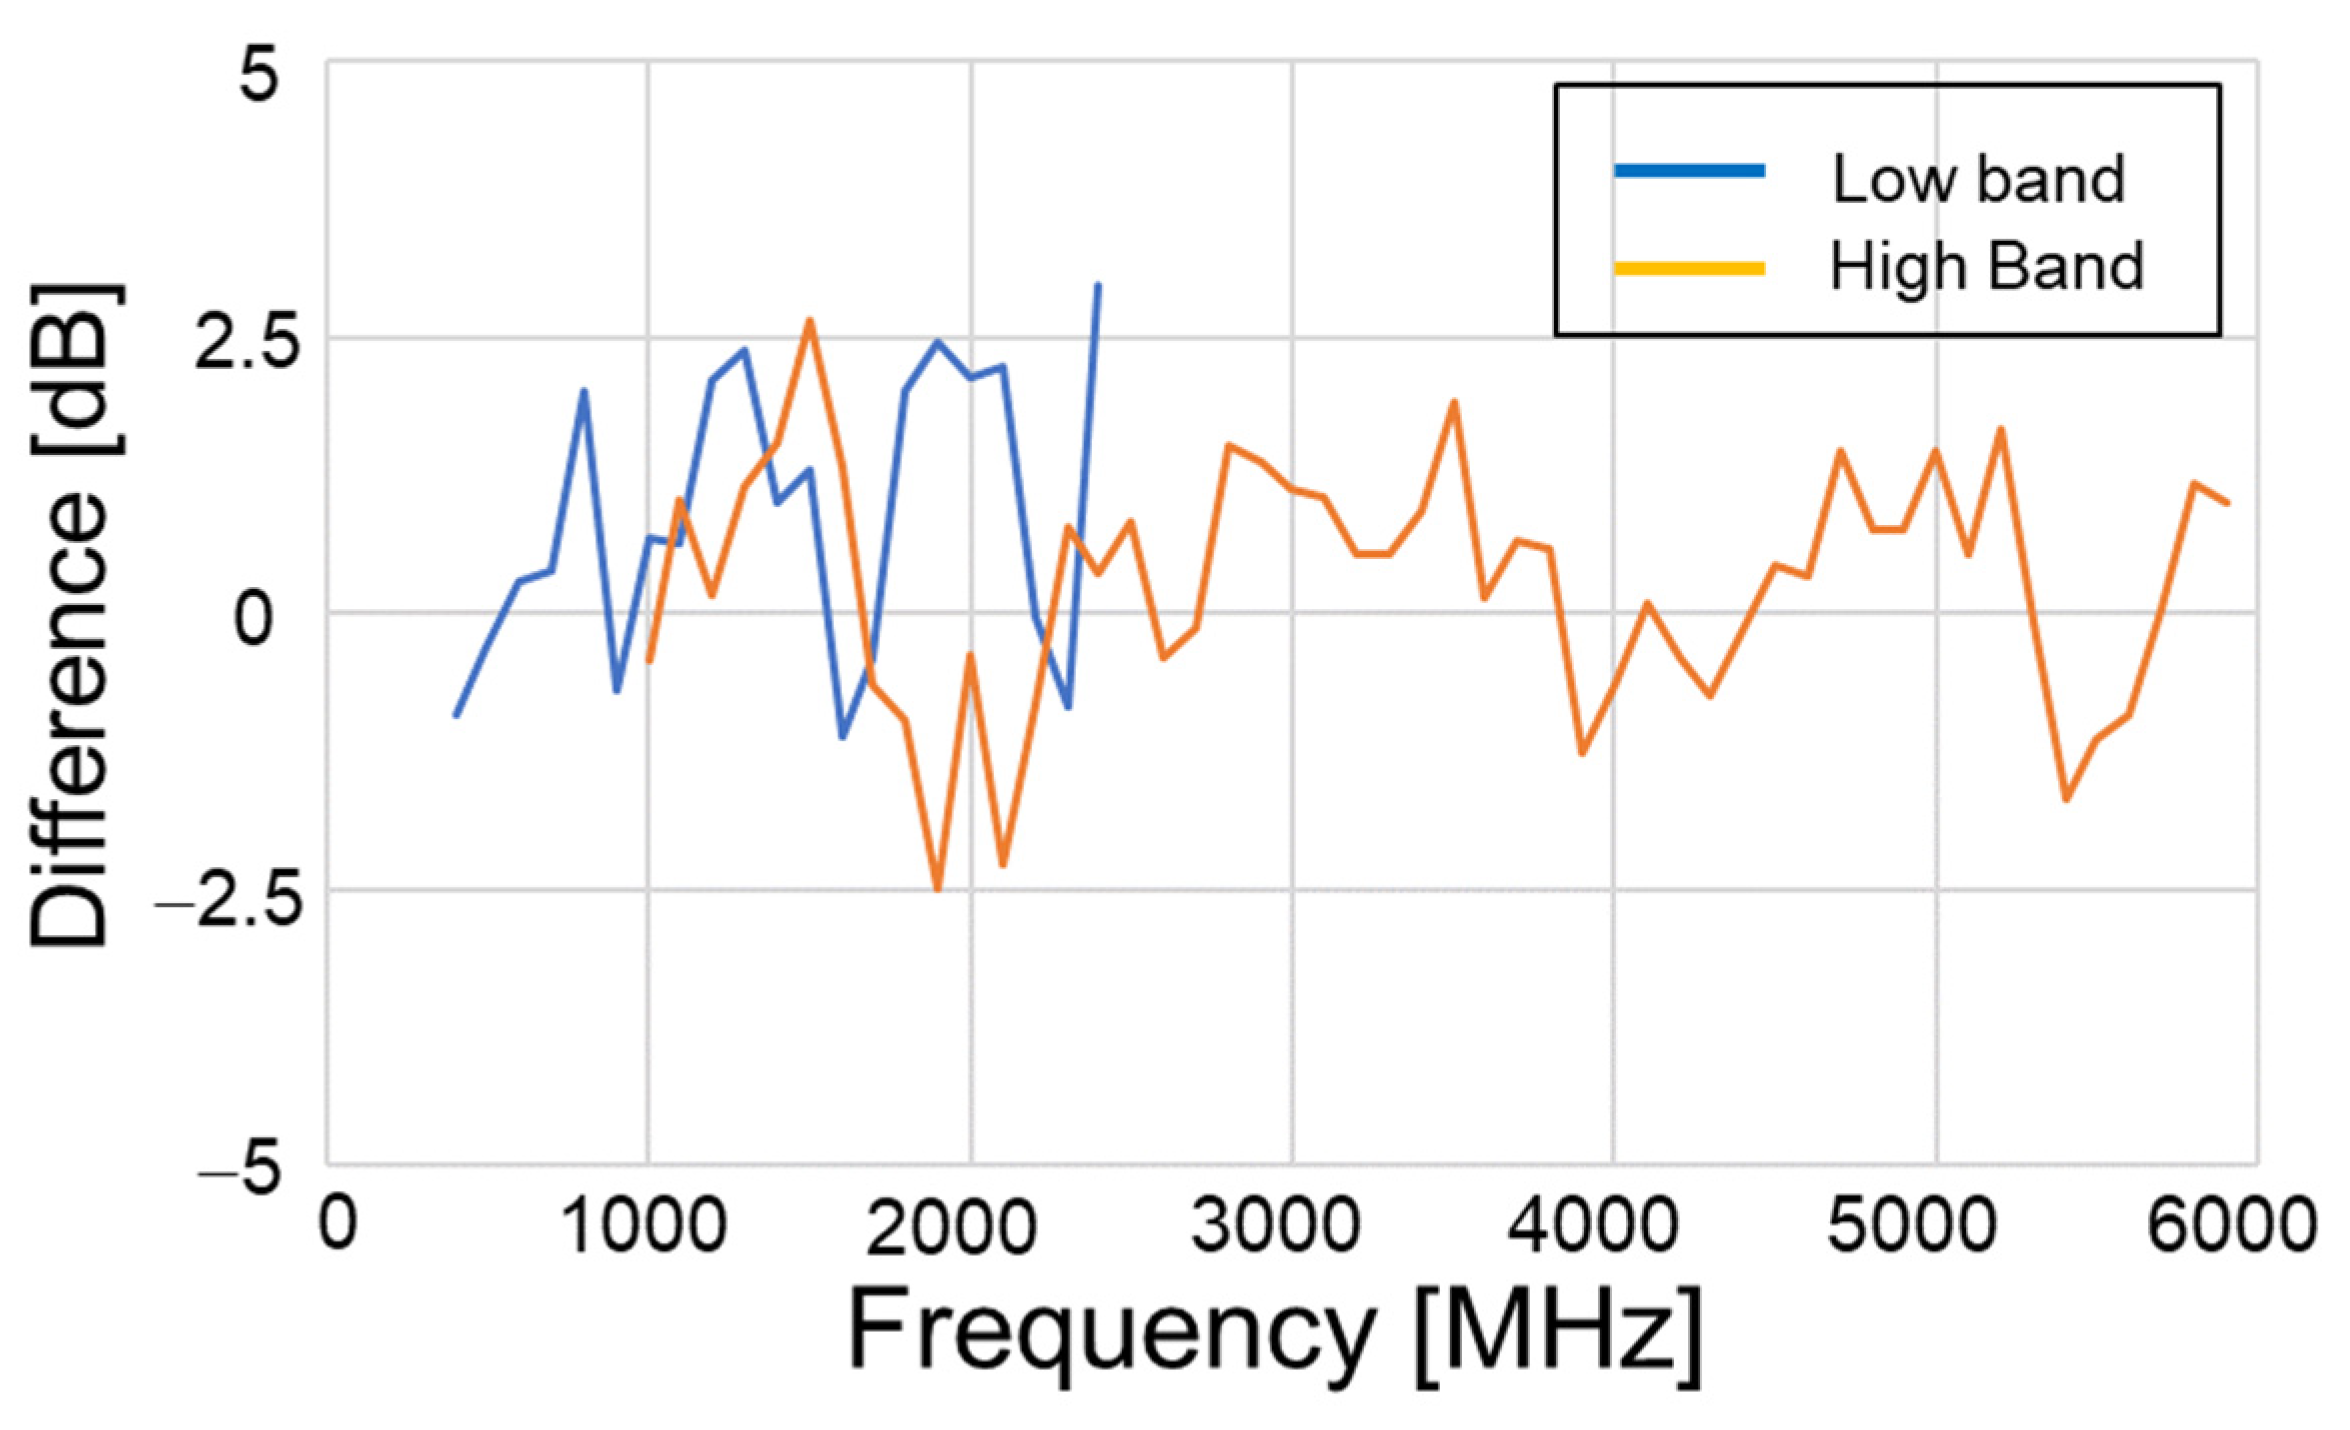
2.2. Evaluation in Anechoic Chamber

To evaluate the effect of the car body on the measurement of the E-field strength, we placed the car in a large anechoic chamber prior to an actual measurement on the road (Figure 1). The car was placed on a turntable, and the relative angle from the transmitting antenna was changed by 90 degrees (front, rear, left, and right). A log periodic antenna (UHALP 9108, Schwarzbeck) and a double-ridged guide antenna (Model 3117, ETS-Lindgren) were used as transmitting antennas for the low- and high-frequency probes, respectively. The antennas were inclined at 45 degrees. The height of the transmitting antenna was adjusted to the height of the probe. Continuous waves (CWs) were input to the transmitting antennas while the frequency was swept in 100 MHz steps. As a result, variations in the horizontal plane were 2.2 dB and 2.1 dB, on average, for each of the probes for the low and high frequencies, respectively. The measured results were compared with the E-field strength calculated from the gain of the transmitting antennas (Figure 2). The measured results were obtained by averaging the data of the angles in four directions at each frequency. It was confirmed that they were within the range of ±2.5 dB from the calculated value, although they differed depending on the frequency.

2.3. Measurement Conditions

As shown in Table 1, measurements were performed in the frequency bands used for FM/TV broadcasting, mobile phone base stations including 5G systems, broadband wireless access (BWA) base stations, and wireless LANs. Note that some of the frequency bands are allocated for time division duplex (TDD), which includes not only downlinks but also uplinks in the same frequency band.
The low-frequency probe was used to measure the E-field at frequencies from 76 to 95 MHz and from 700 MHz to 2.7 GHz, and the high-frequency probe was used at frequencies from 470 to 710 MHz and from 3.4 to 5.8 GHz. The time required for measurement and recording for each probe was about 6 s. From the viewpoint of radio wave protection, it is necessary to measure for 6 min and calculate the time average [23]. However, since the measurement was carried out while driving, the time average was not used in this study. The square root of the sum of the squares of the E-field (Eint) measured in each band was calculated using Equation (1) [1]. In this measurement, the resolution bandwidth (RBW) was set to 1 MHz (200 kHz for FM and TV). Δf is a frequency resolution (Hz), and f1 and f1 + (n − 1) × Δf are the lowest and highest frequencies in a desired frequency bandwidth, respectively. The E-field strength below the predetermined threshold (noise floor) is excluded when integrating within the band.
E i n t = Δ f 1.0552 R B W k = 0 n 1 ( E ( f 1 + k Δ f ) ) 2        

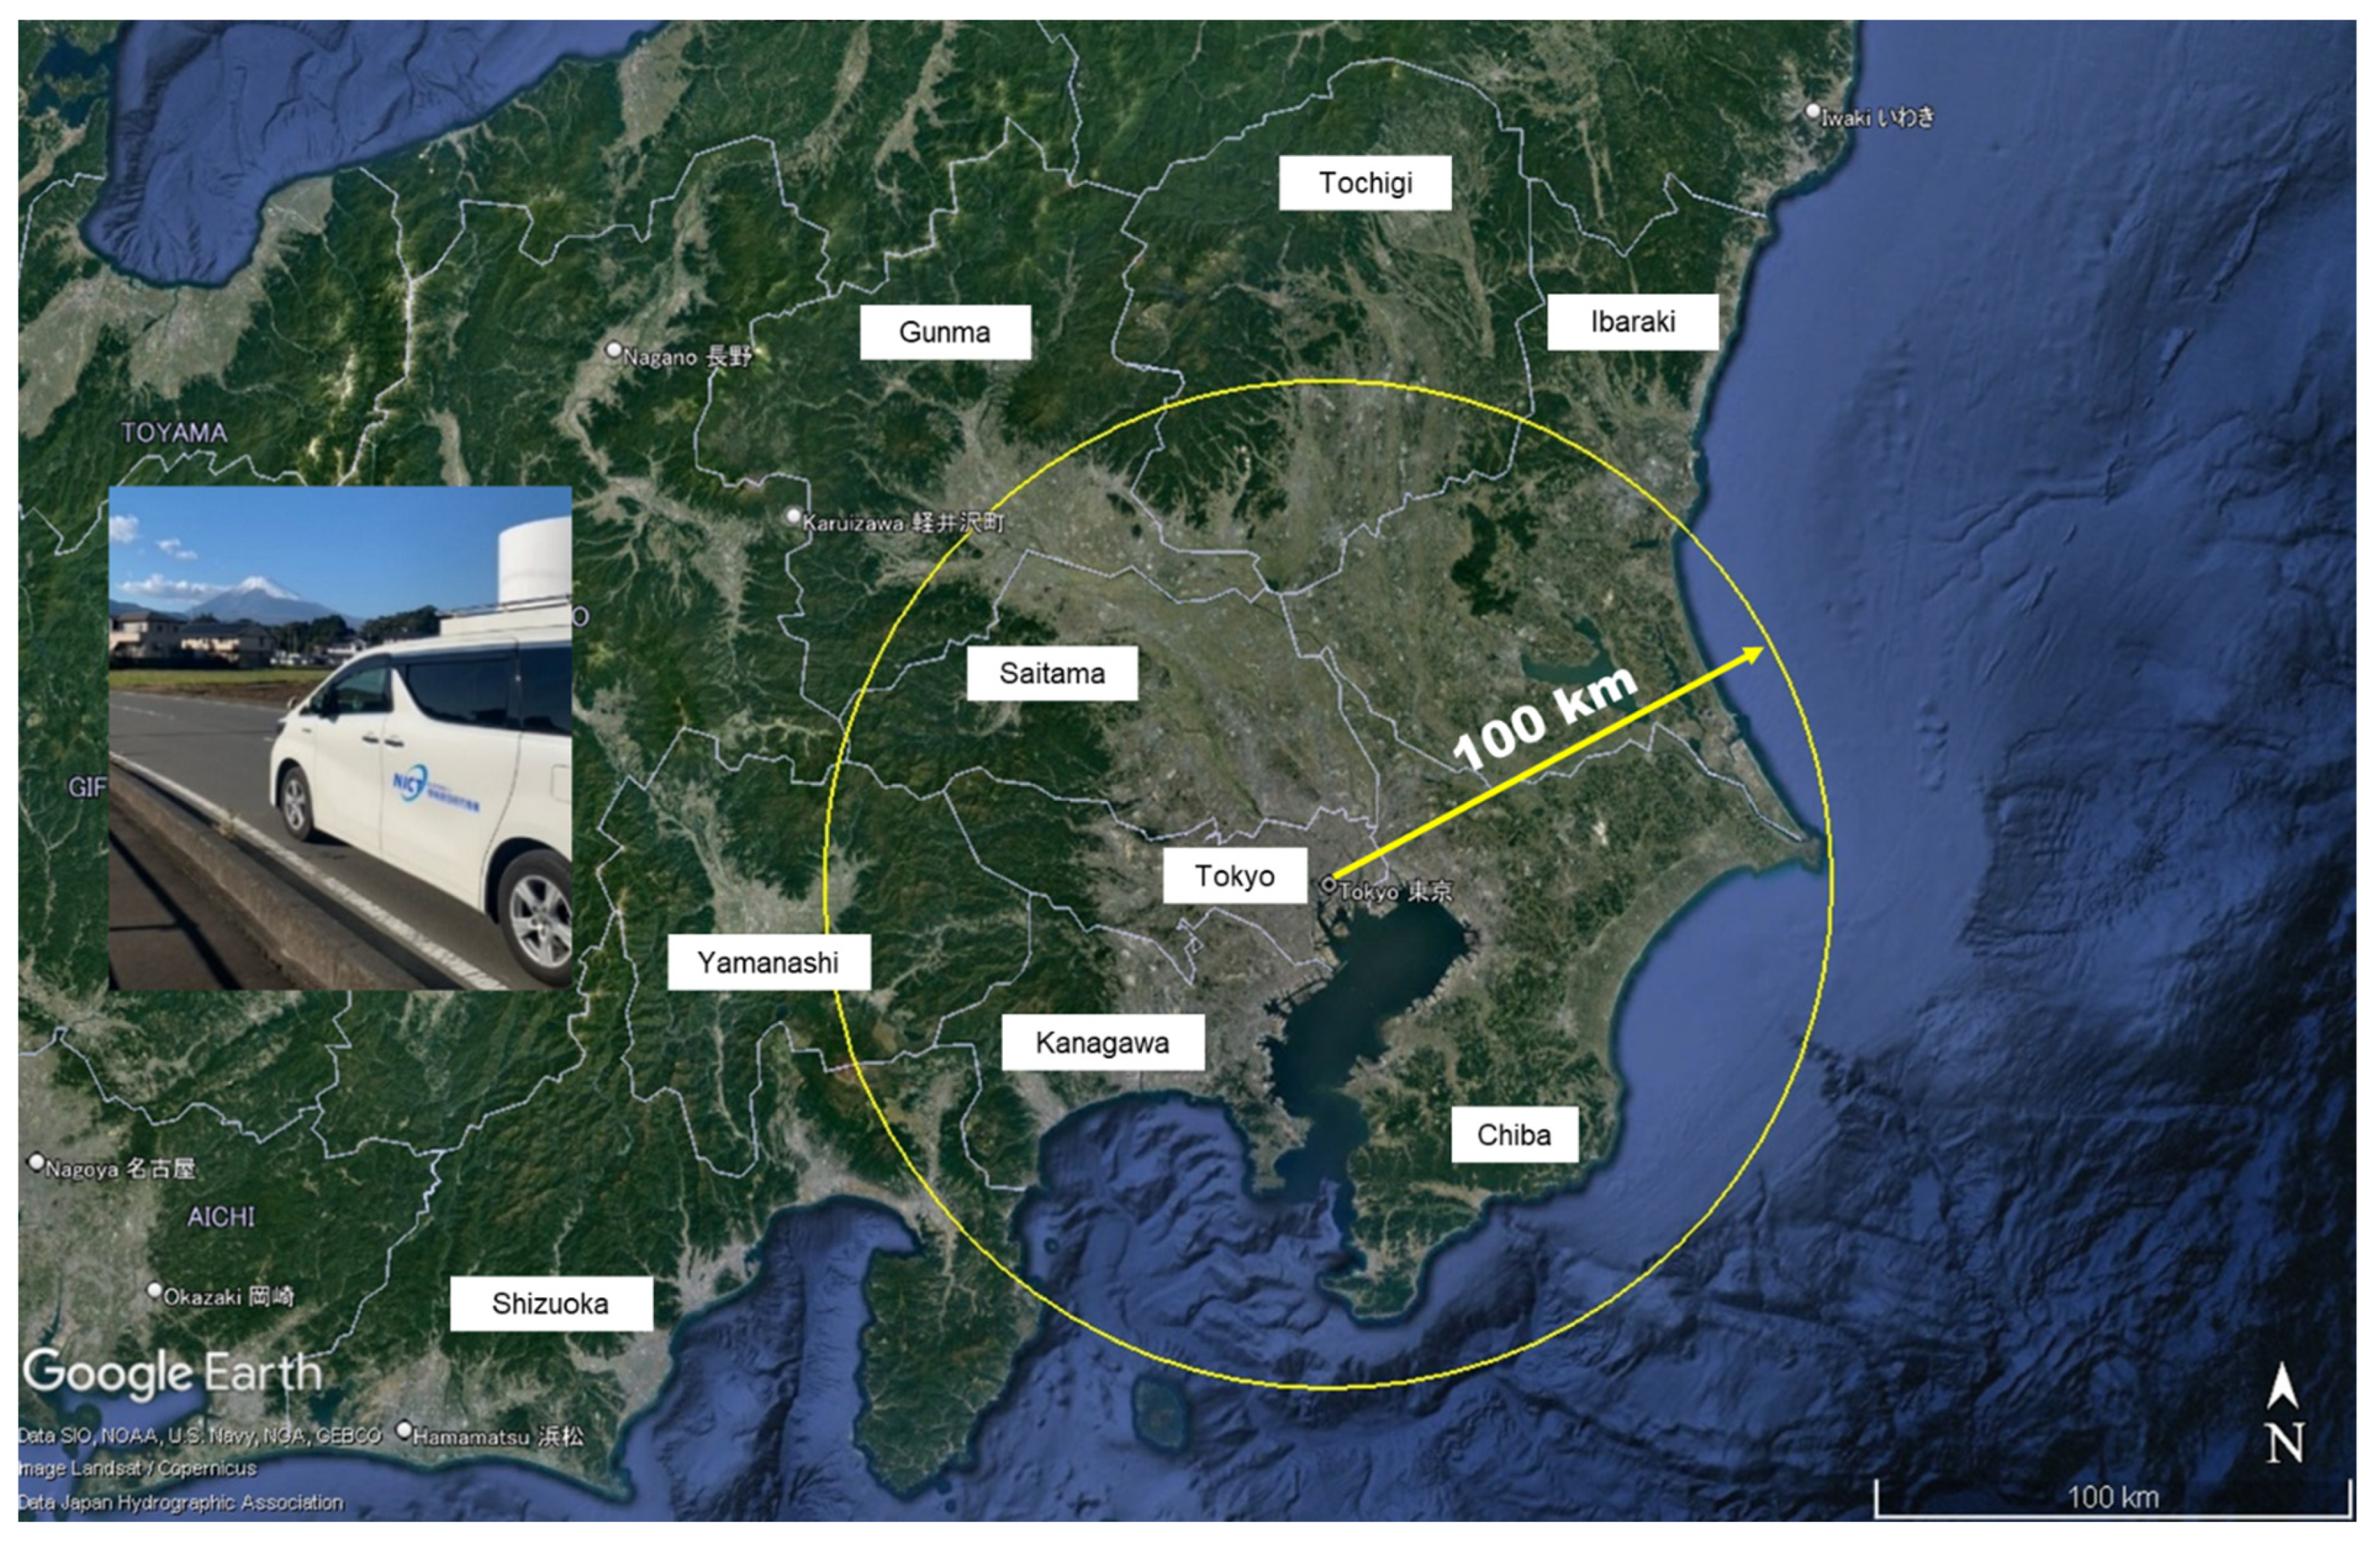
2.4. Wide Area Measurement
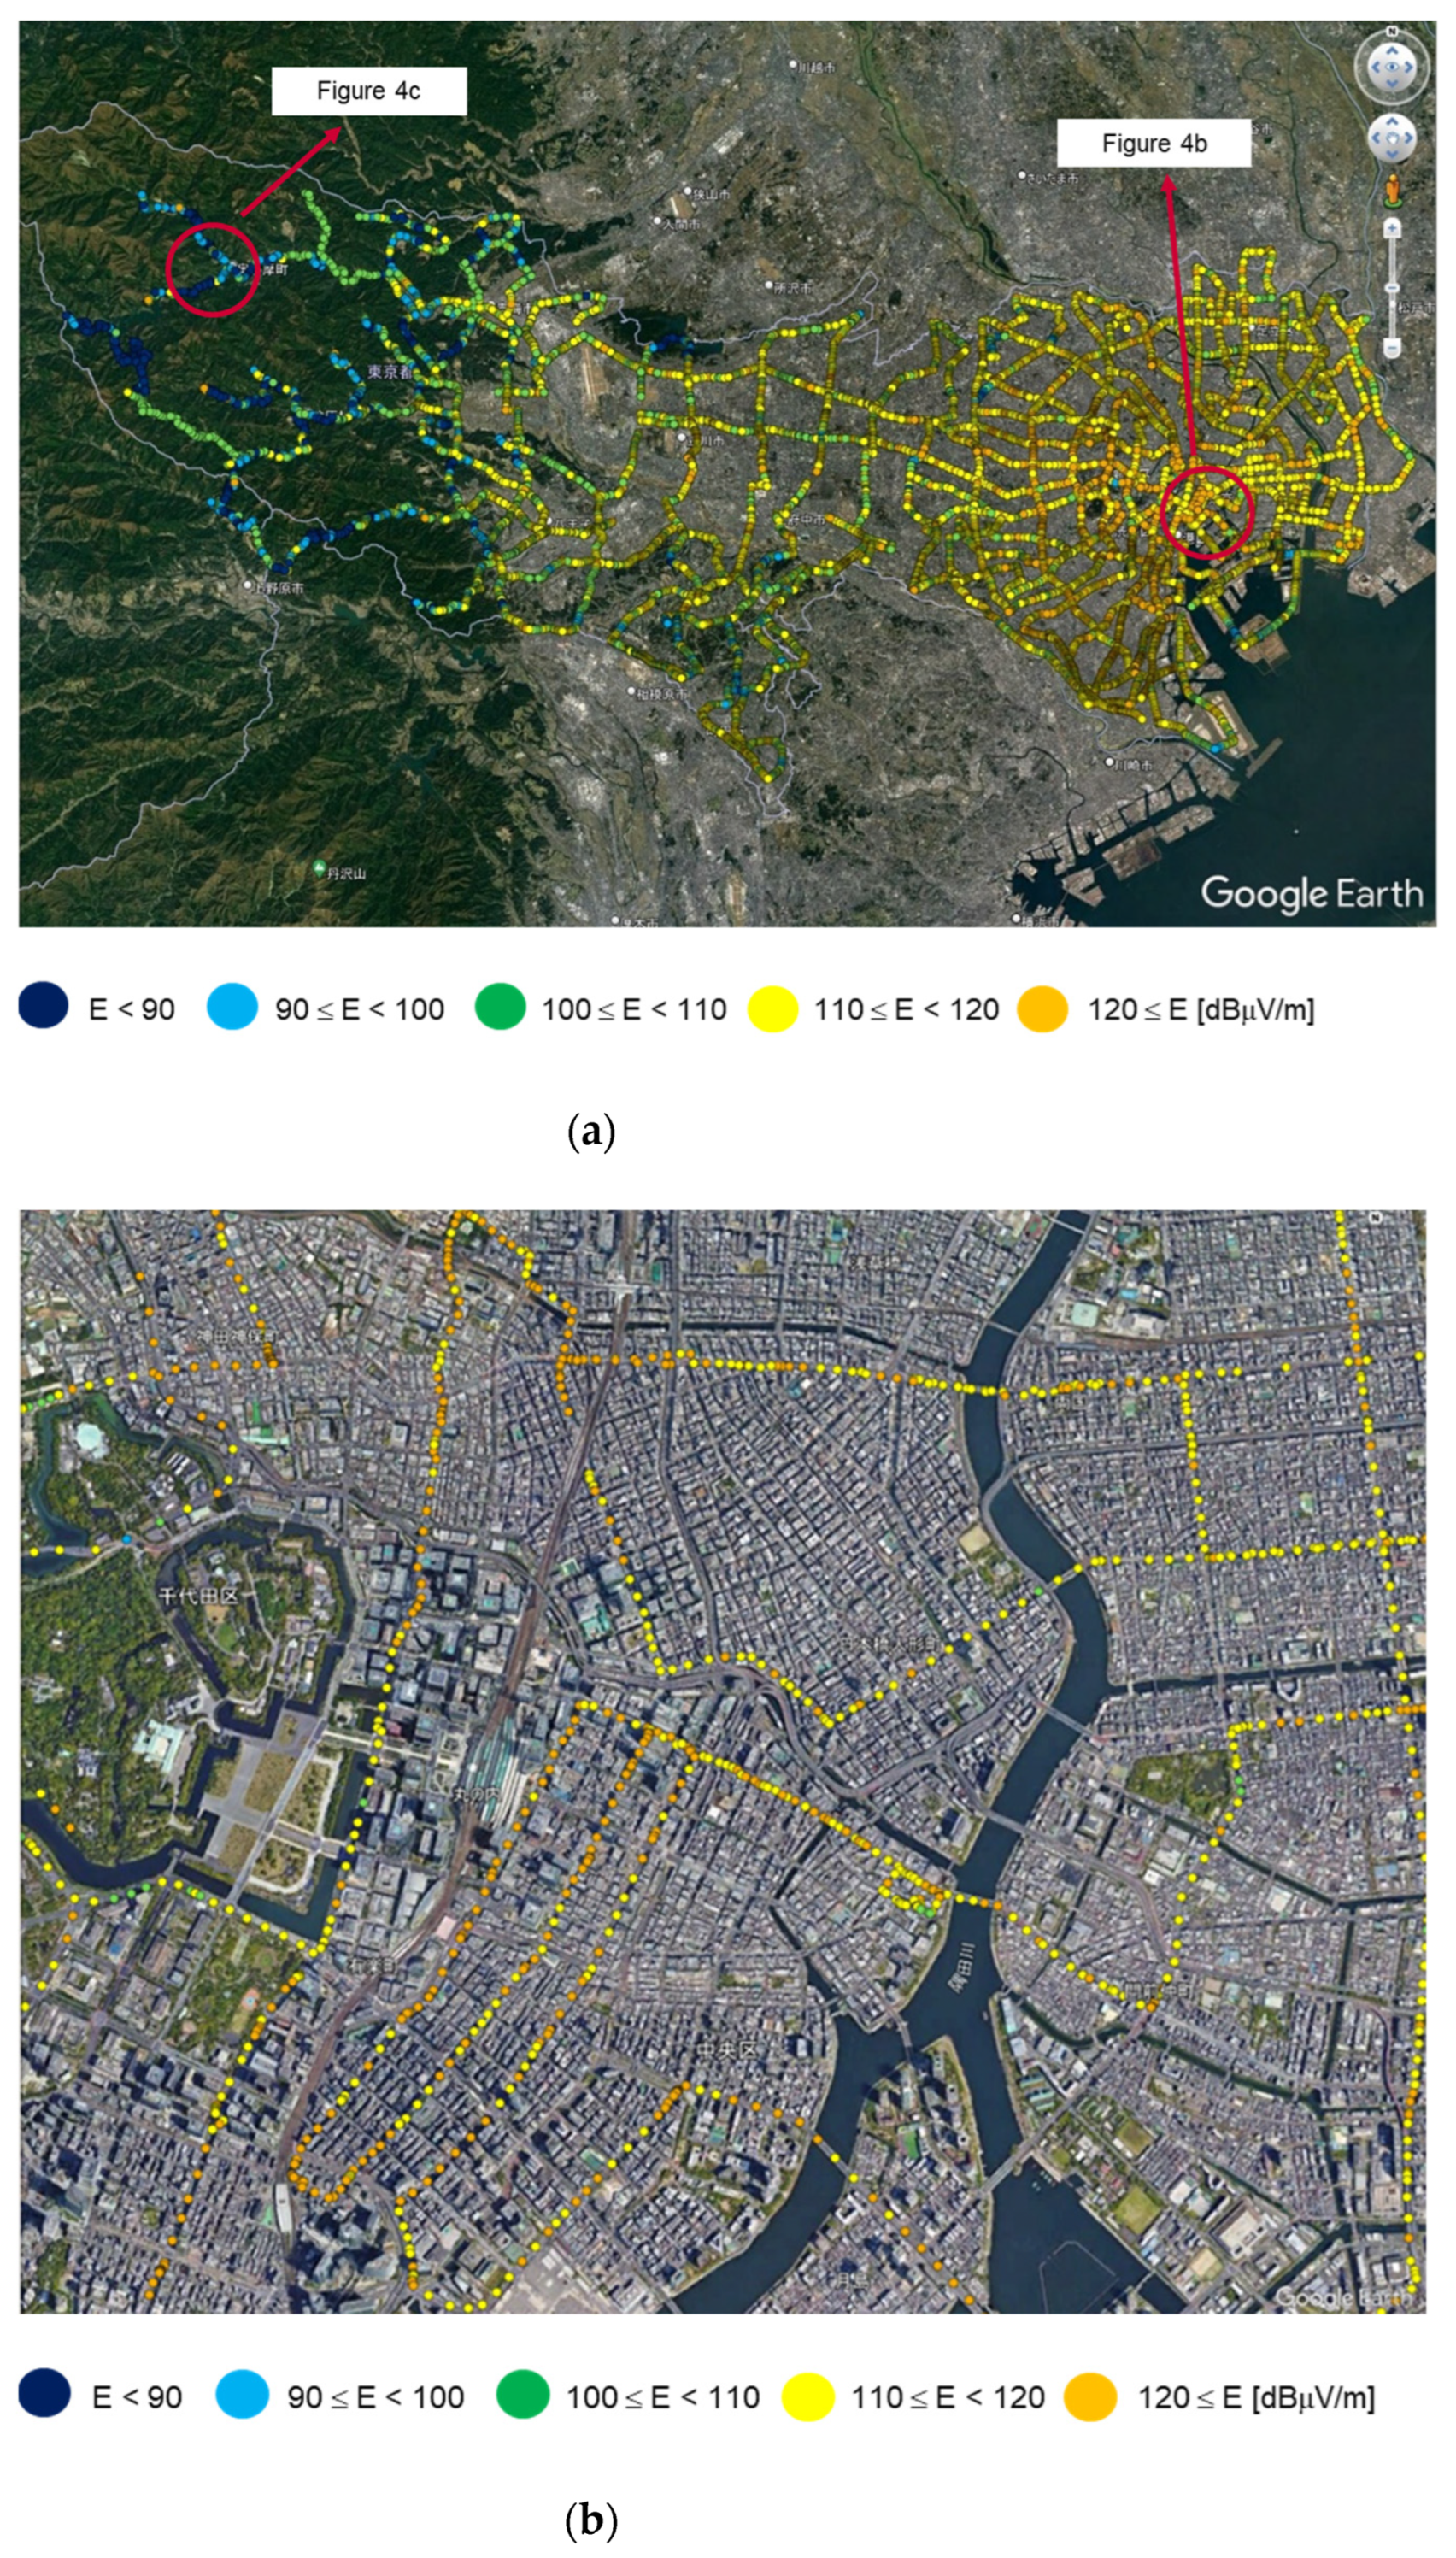
The measurement distance was about 13,800 km within a radius of 100 km centering on Nihonbashi, Tokyo, and the measurements were conducted between May 2021 and February 2022. The entire areas of metropolitan Tokyo, Kanagawa, Saitama, and Chiba prefectures, and parts of Ibaraki, Tochigi, Gunma, Shizuoka, and Yamanashi prefectures were included in the measurement range (Figure 3). Table 2 shows the information on the area and population of each prefecture in 2020. The measurement route was chosen mainly on national roads except for highways and covered all municipalities. The driving speed at the time of measurement was set to a maximum of 50 km/h, within the legal speed limit.

3. Results

The driving distance in each prefecture is described in Table 3, together with the average driving speed and two coverage ratios, as described below. We used the reference area mesh provided by the Japanese government [31] to divide the measurement area into a 1 km2 mesh. Information such as population density is linked to this mesh so that we can estimate how many people live in the area mesh we measured. The population coverages are shown in Table 3 as the ratio of the population summed over the meshes through which the car was driven to the total population in each prefecture. The mesh area coverage is the ratio of the measured number of meshes with the number of meshes in the prefecture assumed to be 100%. The mesh area coverage is low, but the population coverage is high. This is related to the existence of places where cars are not driven, such as mountains, rivers, and narrow roads.
Figure 4a shows the E-field strength distribution in the whole band for the measurement results in Tokyo as an example. The E-field strength at each measurement point is indicated by a colored circle. It can be seen that there is a difference in the E-field strength between the center of Tokyo and the suburbs. In particular, in the enlarged view around Nihonbashi shown in Figure 4b, the E-field strength is more than 110 dBμV/m in most cases, whereas it is less than 110 dBμV/m in rural areas (Figure 4c).
Figure 5 shows the box plot of the E-field strength from mobile phone base stations, including 5G (a) and only 5G (b) and broadcast transmission towers of FM (c) and TV (d) with the number of samples for each prefecture. The E-field strengths in the graphs are levels averaged within the reference area mesh (1 km2 mesh) [31]. Note that 5G in Yamanashi is omitted because the number of samples is only six.
It can be seen that the E-field strengths of FM/TV broadcast transmission towers (Figure 5c,d) are lower than that of mobile phone base stations (Figure 5a). It is also clear that the E-field strength of only 5G mobile phone base stations (Figure 5b) is approximately 20–30 dB lower than that of all mobile phone systems (Figure 5a). It has been reported that the E-field strength and its frequency from the 5G mobile phone base station varies depending on the data traffic [32]. In particular, when the downlink traffic increases, the time occupancy of the downlink signal may increase. In this measurement, the communications by terminals were not performed in the car. It is expected that the time-averaged E-field strength will be much higher than the above results when data traffic, especially downlink, exists. The E-field strength of all bands is higher in Tokyo than in other prefectures. The E-field strengths of mobile phone base stations and FM bands in Kanagawa and Saitama prefectures follow those of Tokyo. There is no clear trend in the E-field strength of TV except for Tokyo, which seems to be affected by the location of transmission towers. There are the Tokyo Skytree and the Tokyo tower, which are both broadcast transmission towers in the center of Tokyo, but also covering other prefectures described in Table 2, except for Yamanashi. The E-field strength of TV is relatively high in Yamanashi Prefecture because most of the measurement routes are near broadcast transmission towers.
In 2014, Estenberg and Augustsson reported their car-mounted measurements in Sweden at a frequency range of 30 MHz to 3 GHz using a three-axis antenna over a driving distance of 115 km [28]. Their results showed that the median E-field strengths in rural and urban areas and in Stockholm were 97.8, 110.1, and 119.9 dBμV/m, respectively. In addition, the E-field strengths from mobile phone base stations were dominant. For comparison with these results, similar areas were extracted in Tokyo, namely, the center area (23 wards), cities (outside the 23 wards except for rural areas), and rural areas (mountains) in Tokyo. The results showed that the median E-field strengths in rural areas, cities, and the center area are 104.0, 113.1, and 119.2 dBμV/m, respectively. It was found that these are of the same order as that shown in Ref. [28]. The interesting point is that in rural areas, our result is higher than that in Ref. [28], whereas the others are almost at the same level.

4. Discussion

4.1. Effect Due to Switching of the Three-Axis Probe

Since the measurement in SRM-3006 is performed while switching each axis of the three-axis isotropic probe, it is not possible to measure all three axes simultaneously. This is one of the concerns related to measurement while driving. Therefore, four different measurements were repeated five times to investigate the effect due to switching of the three-axis probe. One of the measurements is normal measurement with SRM-3006, which automatically switches the three axes and combines the E-field strengths of the three axes. For the remaining three measurements, one of the three axes is held during the measurement. Then, the results are combined by the root sum of squares and compared with the results of the normal measurement. Two routes (Routes 1 and 2) of approximately 2.5 km without any traffic signals, including line of sight (LOS) and non-LOS conditions, were selected in Tokyo.
The measurements were conducted while recording the GPS position, but owing to the accuracy of the GPS, it is not possible to obtain the same positional measurements. To compare the results between the normal three-axis measurement and the combined separate measurements of three axes, four types of measured results were first smoothed using a median filter, which is a nonlinear digital filtering technique used to remove noise from an image or signal. Then, interpolation was performed at 5 m intervals to obtain data at the same point and averaged for every five repeated measurements under the same conditions. Table 4 shows averaged differences between the normal three-axis and separate measurements along the two routes. The results show that there are no large differences compared with the results shown in Section 2.2, even though the measurement was performed by switching three axes.

4.2. Repeated Measurements in the Same Areas

To confirm the extent to which the measurement results vary depending on the driving time and other factors, we repeated measurements in the range of 1 km2 at two urban areas (Urban A and B) and two suburban areas around Tokyo (Suburban A and B) and one metropolitan area between May 2021 and February 2022 using the conditions shown in Table 5. For Urban area A, Suburban area A, and the metropolitan area, measurements were performed five times during the day and night on both weekdays and holidays and repeated four times during the period shown in Table 5 (80 times/area). Note that the number of valid measurement data is 78 for Urban A. For Urban area B and Suburban area B, measurements were repeated only during the day (40 times/area).
Table 6 shows the average driving speed. It is clear that the average driving speeds were less than about 25 km/h, similar to that in the wide-area measurement. The maximum, minimum, 90th, 50th, and 10th percentile values were calculated for each area under all the conditions shown in Table 5. Although the number of data obtained by one driving measurement varied by area and time of day, it was approximately 200 to 400. The standard deviation of the median (50th percentile) value in each area is shown in Table 7. Note that there was no marked difference by period, day of the week, and time zone, and the standard deviations were 3 dB or less, as shown in Table 7.
Figure 6 shows the box plot of the integrated E-field strength distribution for the mobile systems. The measurement results using the car show the average results of the maximum, minimum, 90th, 50th, and 10th percentile values over all measurements per area shown in Table 5. For comparison, the results of the past spot measurement [1] are also shown. Note that no spot measurement in the metropolitan area had been performed in the past. The spot measurements were carried out at the point of 10 × 10 (100 m2 per one point) in the area of 1 km2, but the data at the points where a car cannot be driven were removed and recalculated with the remaining measurement points. The E-field strength in the spot measurement was averaged over 1 min. The results of the car measurement show that the E-field strength is higher in the order of metropolitan areas, urban areas, and suburban areas. This tendency is also consistent with the results of spot measurement [1]. In addition, when the results of spot and car measurements were compared at the median value for the same area, it was found that the electric field strengths were almost at the same level within 4 dB.

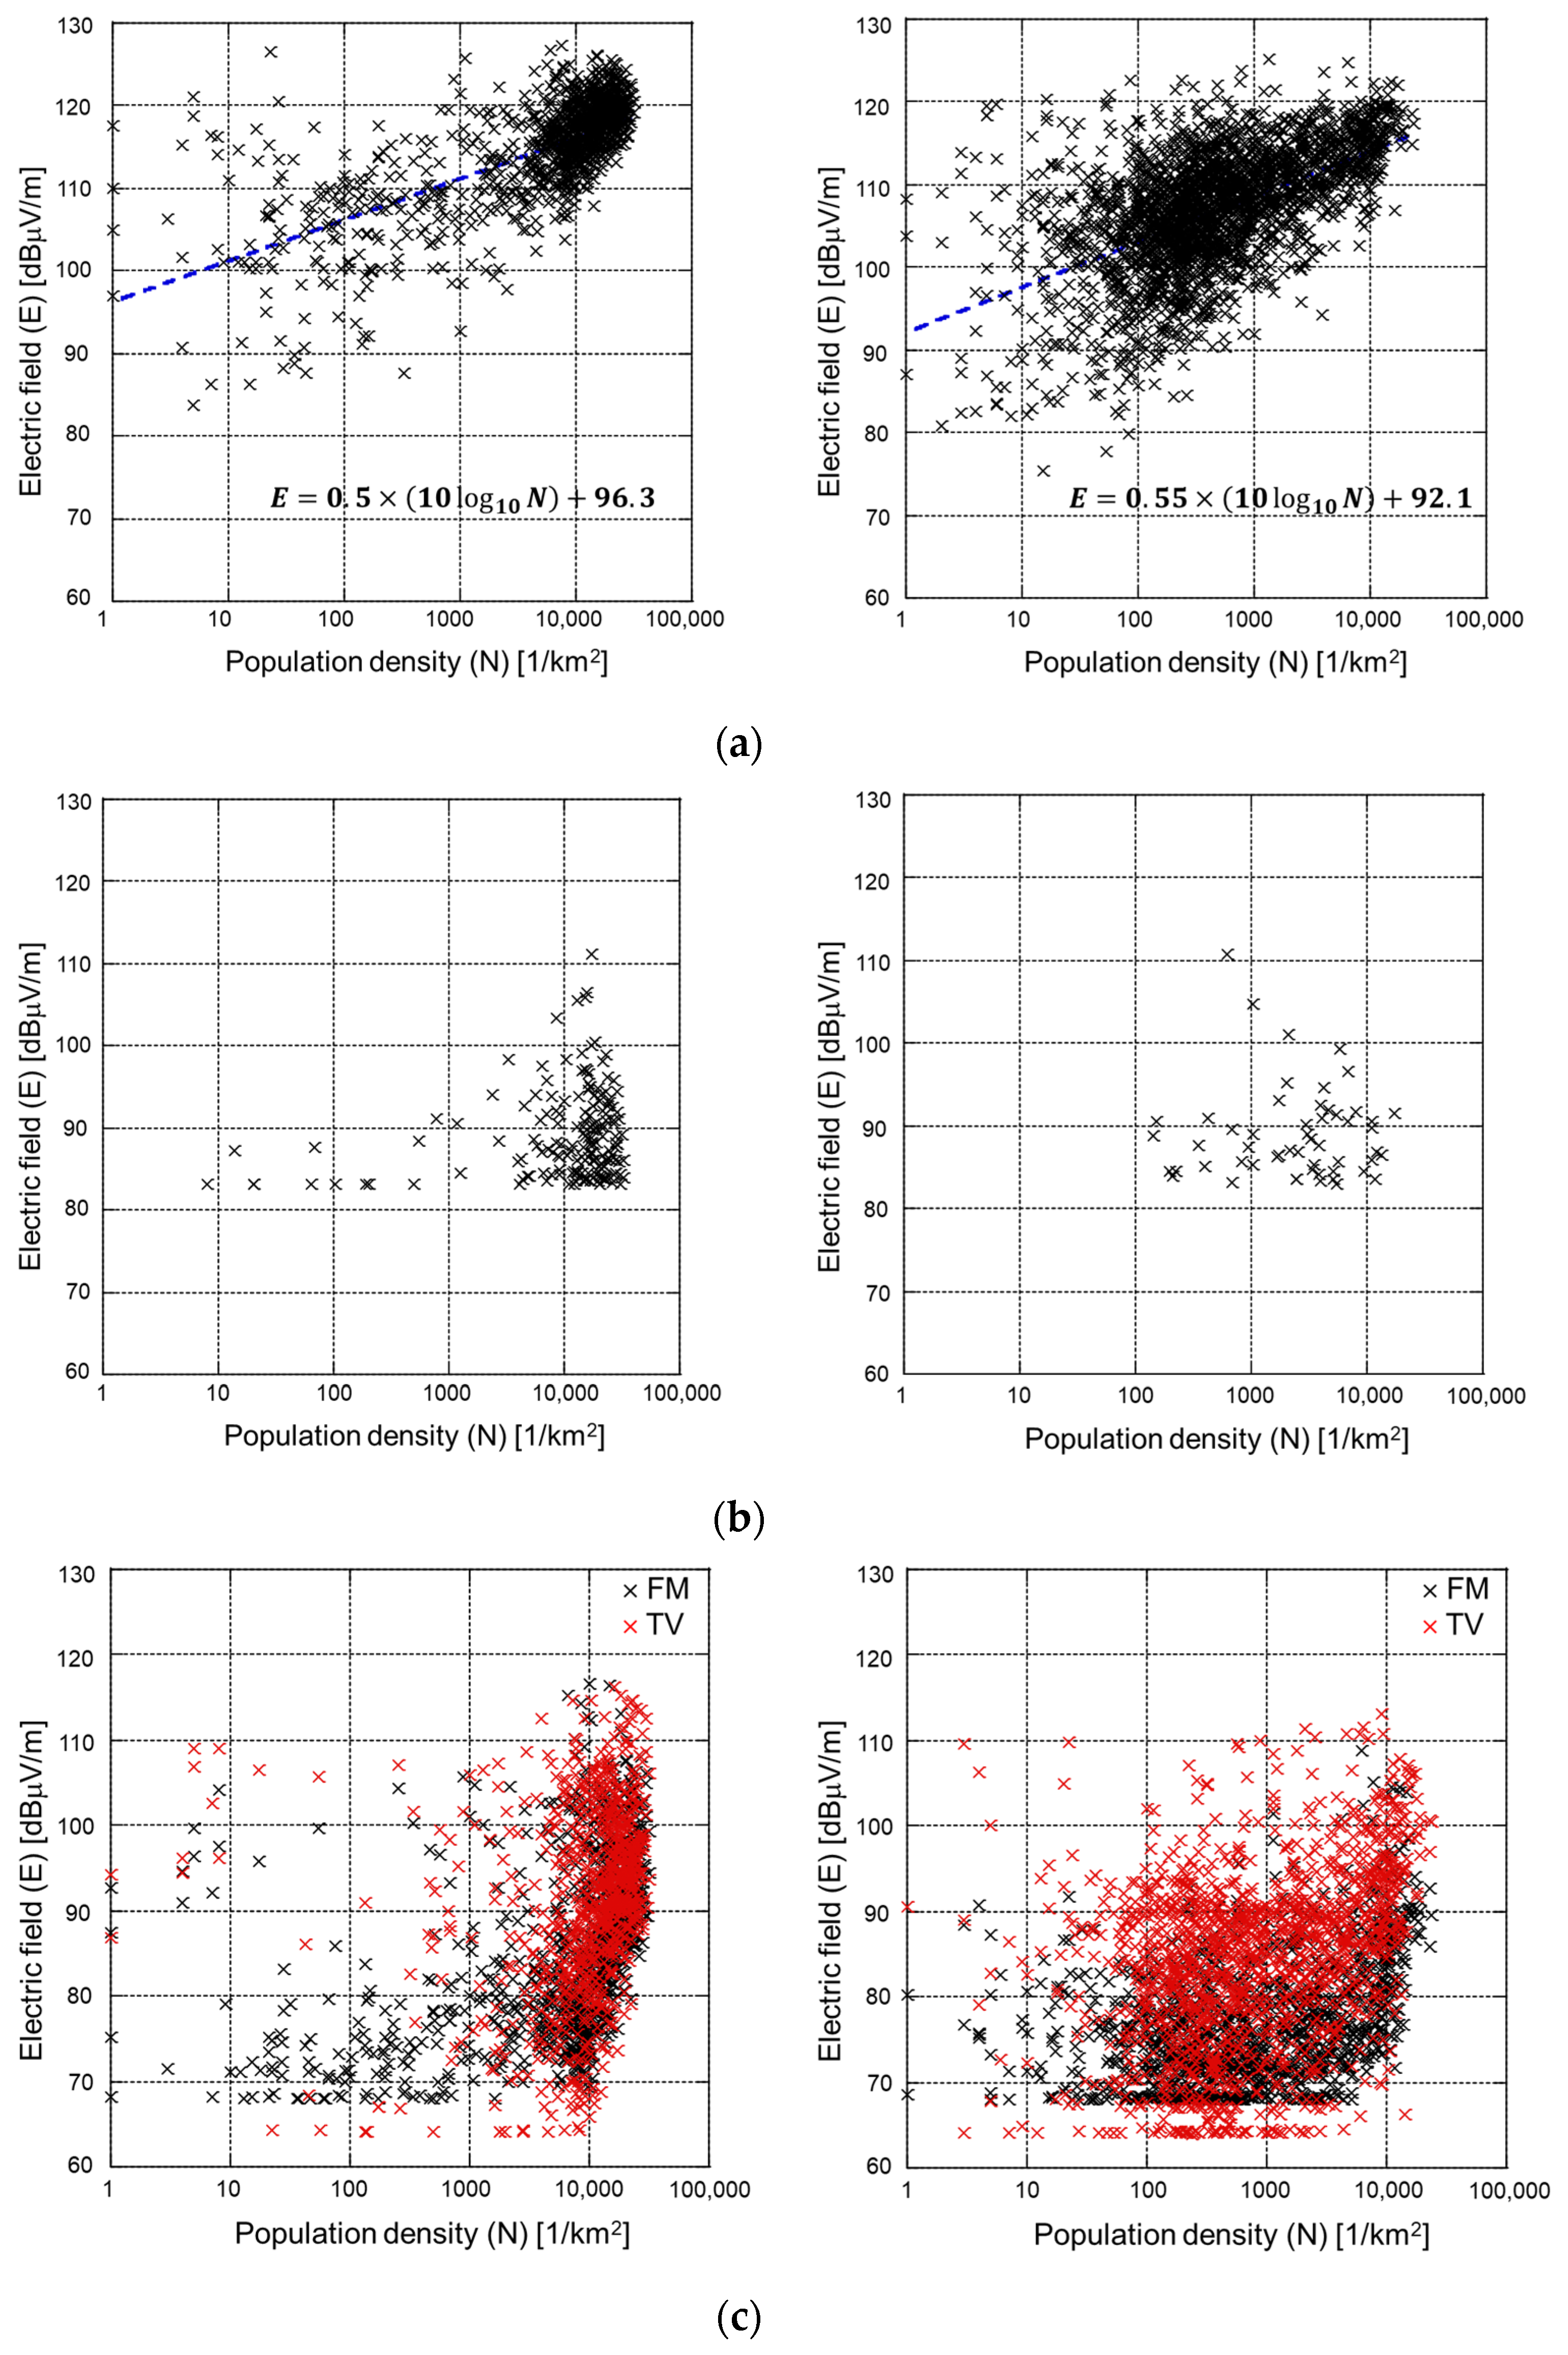
4.3. Relationship with Population Density

The relationship between the data measured over a wide area and the population density was discussed, referring to the literature [33]. Miura et al. measured the transmission power level (dBm/MHz) from a mobile phone terminal while driving in order to investigate the radio interference from the ground system to the satellite system in the development of a shared system of land and satellite communication systems [33]. They reported that the transmission power level is inversely proportional to the power of the population density.
In this work, a similar investigation was carried out using the results of the 2020 National Census [34]. We used the reference area mesh provided by the Japanese government [31] to divide the measurement area into a 1 km2 mesh. Information such as population density [34] is linked to this mesh so that we can estimate how many people live in the area mesh we measured. Figure 7 contains a scatter plot that shows the relationship between population density and E-field strength for mobile phone base stations, including 5G (a), only 5G (b), and for broadcast transmission towers of FM/TV (c) in metropolitan Tokyo and Chiba Prefecture. The horizontal and vertical axes show the population density and the E-field strength, respectively. For mobile phone base stations, including 5G (Figure 7a), there are proportional relationships with the power of the population density, although there are large variations. E-field strengths of only 5G (Figure 7b) are characterized by a small amount of data and concentration in densely populated areas such as 10,000 per km2. On the other hand, there is no significant relationship for broadcasting towers.
For mobile phone base stations, there are cases where the E-field strength is high in areas with low population density. For example, it has been confirmed that there are commercial facilities where almost no people live, while many people work there during the day. For broadcasting in Tokyo, the E-field strength is concentrated at 70 to 110 dBμV/m with a population density near 10,000 1/km2, which can be considered to be due to the existence of the Tokyo Skytree.
The regression line of the distribution for mobile phone base stations in Figure 7a was calculated to have a slope of about 0.5 in all prefectures. On the other hand, according to the literature [32], the transmission power from mobile phone terminals decreases with a slope of −0.38 when the population density increases. In this measurement, it was found that the E-field strength from mobile phone base stations increases with almost the same absolute value of the slope against the population density. That is, although [32] shows the results of the 3rd generation mobile phone system, the relationship between the two results is confirmed. The main reason that the E-field strength from mobile phone base stations has a positive relationship with population density seems to be that there are more mobile phone base stations in densely populated areas.

5. Conclusions

To measure the RF EMF exposure level in a large area, we modified a commercial car for E-field strength measurement. Prior to the E-field measurement using the car, the effect of the car body was evaluated in an anechoic chamber. The measurements between May 2021 and February 2022 were carried out within a radius of 100 km centering on Nihonbashi, Tokyo, including the whole areas of metropolitan Tokyo, Kanagawa, Saitama, and Chiba prefectures, and parts of Ibaraki, Tochigi, Gunma, Shizuoka, and Yamanashi prefectures with the measurement distance of about 13,800 km. The measurement results were averaged in a reference area mesh (1 km2). It was found that the E-field strengths of FM/TV are lower than that of mobile phone base stations. It was also found that the E-field strength of only 5G is approximately 20–30 dB lower than that of all mobile phone systems. However, note that it is possible to depend on the data traffic of 5G. The E-field strength of all bands is higher in Tokyo than in other prefectures.
The effect of switching a three-axis isotropic probe on the measured E-field strength was investigated. The results suggested that the effect of switching a three-axis probe is small. The results showed that there are no large differences compared with the results shown in Section 2.2, even though the measurement is performed by switching the three axes. From the repeated measurements in the same areas, the standard deviations in the same routes were less than 3 dB, and a similar tendency of E-field strength by the car to the time-averaged results of the spot measurements at the same locations in the past was confirmed. In addition, the relationship of E-field strength with population density was investigated. It was shown that the E-field strength from mobile phone base stations had a positive relationship with population density. To the authors’ knowledge, this is the first time that we have made a quantitative assessment of the relationship between E-field strength and population density over a large area. In the future, the measurement area will be expanded to all over Japan, and the measured frequency range will be higher, covering the 5G FR2, such as 28 GHz.

Author Contributions

Conceptualization, T.O.; measurement, K.T. and T.O.; data analysis, K.E., T.O., and M.I.; writing—original draft preparation, T.O.; supervision, M.T. and S.W. All authors have read and agreed to the published version of the manuscript.

Funding

This work was supported by the Ministry of Internal Affairs and Communications (JPMI10001), Japan.

Acknowledgments

The authors would like to thank K. Kamegai and S. Liu at NICT for their kind help and fruitful discussions.

Conflicts of Interest

The authors declare no conflict of interest.

References

  1. Onishi, T.; Ikuyo, M.; Tobita, K.; Liu, S.; Taki, M.; Watanabe, S. Radiofrequency Exposure Levels from Mobile Phone Base Stations in Outdoor Environments and an Underground Shopping Mall in Japan. Int. J. Environ. Res. Public Health 2021, 18, 8068. [Google Scholar] [CrossRef] [PubMed]
  2. Onishi, T.; Tobita, K.; Taki, M.; Watanabe, S. Outdoor measurement of exposure levels from mobile phone base stations and other sources. IEICE Tech. Rep. 2022, 122, 34–38. [Google Scholar]
  3. Tobita, K.; Onishi, T.; Taki, M.; Watanabe, S. Measurement of exposure levels to electromagnetic fields around broadcast transmit towers. IEICE Trans. 2023. submitted (In Japanese) [Google Scholar]
  4. Ikuyo, M.; Onishi, T.; Taki, M.; Watanabe, S. Radio frequency exposure levels in a house in Japan. In Proceedings of the 1st Annual Meeting of BioEM Technical Program and General Information, PB-30, Nagoya, Japan, 19–24 June 2022. [Google Scholar]
  5. Kamegai, K.; Taki, M.; Ikuyo, M.; Onishi, T.; Watanabe, S. Usage of Wireless Devices in Residences and Awareness of Radio Environment in Daily Life; IEICE Technical Report, EMCJ2022-24; Institute of Electronics, Information and Communication Engineers: Tokyo, Japan, 2022. [Google Scholar]
  6. Rowley, J.T.; Joyner, K.H. Comparative international analysis of radiofrequency exposure surveys of mobile communication radio base stations. J. Expo. Sci. Environ. Epidemiol. 2012, 22, 304–315. [Google Scholar] [CrossRef]
  7. Joseph, W.; Verloock, L.; Goeminne, F.; Vermeeren, G.; Martens, L. Assessment of RF Exposures from Emerging Wireless Communication Technologies in Different Environments. Health Phys. 2012, 102, 161–172. [Google Scholar] [CrossRef]
  8. Joseph, W.; Verloock, L.; Goeminne, F.; Vermeeren, G.; Martens, L. In situ LTE exposure of the general public: Characterization and extrapolation. Bioelectromagnetics 2012, 33, 466–475. [Google Scholar] [CrossRef]
  9. Aerts, S.; Deschrijver, D.; Joseph, W.; Verloock, L.; Goeminne, F.; Martens, L.; Dhaene, T. Exposure assessment of mobile phone base station radiation in an outdoor environment using sequential surrogate modeling. Bioelectromagnetics 2013, 34, 300–311. [Google Scholar] [CrossRef]
  10. Kim, B.C.; Kim, W.-K.; Lee, G.-T.; Choi, H.-D.; Kim, N.; Pack, J.-K. Evaluation of radiofrequency exposure levels from multiple wireless installations in population dense areas in Korea. Bioelectromagnetics 2014, 35, 603–606. [Google Scholar] [CrossRef]
  11. Bürgi, A.; Scanferla, D.; Lehmann, H. Time Averaged Transmitter Power and Exposure to Electromagnetic Fields from Mobile Phone Base Stations. Int. J. Environ. Res. Public Health 2014, 11, 8025–8037. [Google Scholar] [CrossRef]
  12. Mossetti, S.; de Bartolo, D.; Veronese, I.; Cantone, M.C.; Cosenza, C.; Nava, E. Extrapolation techniques evaluating 24 hours of average electromagnetic field emitted by radio base station installations: Spectrum analyzer measurements of LTE and UMTS signals. Radiat. Prot. Dosim. 2016, 173, 43–48. [Google Scholar] [CrossRef]
  13. Joseph, W.; Aerts, S.; Vandenbossche, M.; Thielens, A.; Martens, L. Drone based measurement system for radiofrequency exposure assessment. Bioelectromagnetics 2016, 37, 195–199. [Google Scholar] [CrossRef] [PubMed]
  14. Sagar, S.; Adem, S.M.; Struchen, B.; Loughran, S.P.; Brunjes, M.E.; Arangua, L.; Dalvie, M.A.; Croft, R.J.; Jerrett, M.; Moskowitz, J.M.; et al. Comparison of radiofrequency electromagnetic field exposure levels in different everyday microenvironments in an international context. Environ. Int. 2018, 114, 297–306. [Google Scholar] [CrossRef] [PubMed]
  15. Aerts, S.; Wiart, J.; Martens, L.; Joseph, W. Assessment of long-term spatio-temporal radiofrequency electromagnetic field exposure. Environ. Res. 2018, 161, 136–143. [Google Scholar] [CrossRef] [PubMed]
  16. Iyare, R.N.; Volskiy, V.; Vandenbosch, G.A. Study of the electromagnetic exposure from mobile phones in a city like environment: The case study of Leuven, Belgium. Environ. Res. 2019, 175, 402–413. [Google Scholar] [CrossRef]
  17. Mazloum, T.; Aerts, S.; Joseph, W.; Wiart, J. RF-EMF exposure induced by mobile phones operating in LTE small cells in two different urban cities. Ann. Telecommun. 2019, 74, 35–42. [Google Scholar] [CrossRef]
  18. Wang, S.; Wiart, J. Sensor-Aided EMF Exposure Assessments in an Urban Environment Using Artificial Neural Networks. Int. J. Environ. Res. Public Health 2020, 17, 3052. [Google Scholar] [CrossRef]
  19. ANFR. Assessment of the Exposure of the General Public to 5G Electromagnetic Waves, Part 2: First Measurement Results on 5G Pilots in the 3400–3800 MHz Band; ANFR (Agence Nationale des Fréquences): Maisons-Alfort, France, 2020. [Google Scholar]
  20. Gledhill, M. Exposures to Radiofrequency Fields Near 5G Cell Sites; Ministry of Health: Wellington, New Zealand, 2020. [Google Scholar]
  21. OFCOM. Electromagnetic Field (EMF) Measurements Near 5G Mobile Phone Base Stations; OFCOM (Office of Communications): London, UK, 2020. [Google Scholar]
  22. Iakovidis, S.; Apostolidis, C.; Manassas, A.; Samaras, T. Electromagnetic Fields Exposure Assessment in Europe Utilizing Publicly Available Data. Sensors 2022, 22, 8481. [Google Scholar] [CrossRef]
  23. Ministry of Internal Affairs and Communications in Japan. Radio-Radiation Protection Guidelines; Ministry of Internal Affairs and Communications in Japan: Tokyo, Japan, 2018. (In Japanese)
  24. Kuhn, S.; Kuster, N. Field evaluation of the human exposure from multiband, multisystem mobile phones. IEEE Trans. EMC 2013, 55, 275–287. [Google Scholar] [CrossRef]
  25. Kurosaki, S.; Hagiwara, M.; Taki, M.; Aimoto, A.; Ikuyo, M.; Esaki, K.; Wake, K. Investigation of E-field strength from mobile phone base stations and transmitted power from 4th generation mobile phones. In Proceedings of the Joint Annual Meeting of the Bioelectromagnetics Society and the European BioElectromagnetics Association, BioEM2018, PB-48, Portorož, Slovenia, 25–29 June 2018. [Google Scholar]
  26. Lee, A.-K.; Choi, H.-D. Brain EM Exposure for Voice Calls of Mobile Phones in Wireless Communication Environment of Seoul, Korea. IEEE Access 2020, 8, 163176–163185. [Google Scholar] [CrossRef]
  27. Lee, A.-K.; Jeon, S.-B.; Choi, H.-D. EMF Levels in 5G New Radio Environment in Seoul, Korea. IEEE Access 2021, 9, 19716–19722. [Google Scholar] [CrossRef]
  28. Estenberg, J.; Augustsson, T. Extensive frequency selective measurements of radiofrequency fields in outdoor environments performed with a novel mobile monitoring system. Bioelectromagnetics 2013, 35, 227–230. [Google Scholar] [CrossRef] [PubMed]
  29. Aerts, S.; Joseph, W.; Maslanyj, M.; Addison, D.; Mee, T.; Colussi, L.; Kamer, J.; Bolte, J. Prediction of RF-EMF exposure levels in large outdoor areas through car-mounted measurements on the enveloping roads. Environ. Int. 2016, 94, 482–488. [Google Scholar] [CrossRef] [PubMed]
  30. Wang, S.; Mazloum, T.; Wiart, J. Prediction of RF-EMF Exposure by Outdoor Drive Test Measurements. Telecom 2022, 3, 396–406. [Google Scholar] [CrossRef]
  31. Reference Mesh. Available online: https://www.stat.go.jp/data/mesh/m_tuite.html (accessed on 30 September 2022).
  32. Aerts, S.; Verloock, L.; van den Bossche, M.; Colombi, D.; Martens, L.; Tornevik, C.; Joseph, W. In-situ measurement methodology for the assessment of 5G NR massive MIMO base station exposure at Sub-6 GHz freqeuencies. IEEE Access 2019, 7, 184658–184667. [Google Scholar] [CrossRef]
  33. Miura, A.; Watanabe, H.; Hamamoto, N.; Fujino, Y. Transmit power measurement of terrestrial cellular phone. J. Natl. Inst. Inf. Commun. Technol. 2015, 62, 21–27. [Google Scholar]
  34. 2020 National Census. Available online: https://www.e-stat.go.jp/gis/statmap-search?page=1&type=1&toukeiCode=00200521&toukeiYear=2015&aggregateUnit=S&serveyId=S002005112015&statsId=T000846 (accessed on 30 September 2022).
Figure 1. E-field measuring equipment in a radome mounted on a car in an anechoic chamber.
Electronics 12 01835 g001
Figure 2. Measured and calculated E-fields.
Electronics 12 01835 g002
Figure 3. Radius of 100 km centering on Nihonbashi, Tokyo, and scene of measurement in front of Mt. Fuji (inset).
Electronics 12 01835 g003
Figure 4. Examples of measurement results in Tokyo. (a) Whole area of Tokyo; (b) around Nihonbashi; (c) Okutama area.
Electronics 12 01835 g004aElectronics 12 01835 g004b
Figure 5. Box plot of E-field strength for each prefecture. (a) Mobile systems (including 5G); (b) 5G; (c) FM; (d) TV.
Electronics 12 01835 g005aElectronics 12 01835 g005b
Figure 6. Box plot of E-field strength measured by car and those of past spot measurement for mobile phone systems.
Electronics 12 01835 g006
Figure 7. Relationship between population density and E-field strength. Left, Tokyo; right, Chiba. (a) Mobile (including 5G); (b) mobile (5G); (c) FM/TV.
Electronics 12 01835 g007
Table 1. Frequency ranges in this measurement.
NameFrequency Range [MHz]
FM76–95
TV470–710
700 MHz band773–803
800 MHz band860–890
900 MHz band945–960
1500 MHz band1475.9–1510.9
1700 MHz band1805–1880
1900 MHz band (TDD)1884.5–1916.6
2000 MHz band2110–2170
2400 MHz band2400–2497
2500 MHz band (TDD)2545–2645
3500 MHz band (TDD)3400–3600
3700 MHz band (5G; TDD)3600–4100
4500 MHz band (5G; TDD)4500–4600
4600 MHz band (L5G; TDD)4600–4900
5200 MHz band5150–5250
5300 MHz band5250–5350
5600 MHz band5470–5730
Table 2. Area and population of each prefecture in 2020.
PrefectureArea [km2]Population [k]
Tokyo210414,048
Kanagawa24169237
Saitama37687345
Chiba50826284
Ibaraki60962867
Tochigi64081933
Gunma63621939
Shizuoka72553633
Yamanashi4201810
Table 3. Driving distance and coverage ratios in each prefecture in the measurement.
PrefectureDriving Distance for Measurement [km]Average Driving Speed [km/h]Mesh Area Coverage [%]Population Coverage [%]
Tokyo158019.331.384.1
Kanagawa168922.540.185.4
Saitama262425.333.577.5
Chiba180130.233.462.2
Ibaraki231533.328.860.6
Tochigi104031.814.253.9
Gunma104827.611.163.0
Shizuoka90230.05.817.4
Yamanashi81333.711.045.6
Table 4. Averaged differences between normal three-axis and separate measurements.
RouteAveraged Difference [dB]
Route 10.6
Route 2−0.1
Table 5. Conditions of repeated measurements during May 2021 to February 2022.
AreaCombinationNumber of CombinationsTotal Number of Valid
Measurements
DayDaytime/
Nighttime
Number of Repetitions per One Condition
Urban AWeekdays/
Holidays
Day/Night5478
Suburban A80
Metropolitan80
Urban BDay40
Suburban B40
Table 6. Average speed in repeated measurement.
AreaAverage Driving Speed [km/h]
Urban A16.8
Suburban A25.4
Metropolitan13.6
Urban B16.2
Suburban B21.9
Table 7. Standard deviation of median value [dB].
SystemUrban AUrban BSuburban ASuburban BMetropolitan
FM0.730.761.61.60.5
TV1.70.882.33.00.6
Mobile1.61.12.30.741.3
Disclaimer/Publisher’s Note: The statements, opinions and data contained in all publications are solely those of the individual author(s) and contributor(s) and not of MDPI and/or the editor(s). MDPI and/or the editor(s) disclaim responsibility for any injury to people or property resulting from any ideas, methods, instructions or products referred to in the content.

