Abstract
Phishing leverages people’s tendency to share personal information online. Phishing attacks often begin with an email and can be used for a variety of purposes. The cybercriminal will employ social engineering techniques to get the target to click on the link in the phishing email, which will take them to the infected website. These attacks become more complex as hackers personalize their fraud and provide convincing messages. Phishing with a malicious URL is an advanced kind of cybercrime. It might be challenging even for cautious users to spot phishing URLs. The researchers displayed different techniques to address this challenge. Machine learning models improve detection by using URLs, web page content and external features. This article presents the findings of an experimental study that attempted to enhance the performance of machine learning models to obtain improved accuracy for the two phishing datasets that are used the most commonly. Three distinct types of tuning factors are utilized, including data balancing, hyper-parameter optimization and feature selection. The experiment utilizes the eight most prevalent machine learning methods and two distinct datasets obtained from online sources, such as the UCI repository and the Mendeley repository. The result demonstrates that data balance improves accuracy marginally, whereas hyperparameter adjustment and feature selection improve accuracy significantly. The performance of machine learning algorithms is improved by combining all fine-tuned factors, outperforming existing research works. The result shows that tuning factors enhance the efficiency of machine learning algorithms. For Dataset-1, Random Forest (RF) and Gradient Boosting (XGB) achieve accuracy rates of 97.44% and 97.47%, respectively. Gradient Boosting (GB) and Extreme Gradient Boosting (XGB) achieve accuracy values of 98.27% and 98.21%, respectively, for Dataset-2.
1. Introduction
The internet and the World Wide Web are essential components of modern society. The continuous improvement of technology has made it possible to host an increasing number of beneficial web applications, which in turn have attracted many internet users. Web applications, such as social media applications, online payment systems, news, research portals, etc. become widely accessible online. In turn, this encourages the cybercriminals to launch more cyberattacks. The most common cyberattack against internet users is a phishing attack. Phishers use various social engineering methods and constantly change their tactics to deceive people. They create phishing emails, social media postings, text messages, etc. that appear authentic to obtain sensitive information from their victims or to install malware on their computers. Fear, curiosity, urgency and greed are regularly used by phishers to convince victims to visit fraudulent websites or to click on harmful links [1]. After a successful phishing attack, the target’s network is compromised; sensitive information is stolen; and the victim is left vulnerable on the internet. There were over a million phishing attacks in the first quarter of 2022, according to data provided by the anti-phishing working group (APWG). It is the most ever reported in a quarter and has continued a steady trend over the past year. APWG saw over 200,000 phishing attacks in April 2021. By March 2022, the number had almost exactly doubled, reaching 384,291 [2]. Detecting phishing web links (URLs) is becoming increasingly critical; hence, having an AI-based autonomous detection system is necessary. Researchers have proposed many different methods in order to recognize phishing Uniform Resource Locators (URLs). The most straightforward method of blocking phishing URLs is based on either a blacklist or a whitelist of URLs. The effectiveness of this detection is heavily dependent on the list of URLs. The system will either block access to the URL or decide to allow access to the URL based on whether the URL is already included in the existing list. This method needs a long list of URLs, which can be made manually or automatically, and it needs to be updated often. Otherwise, newly created phishing URLs bypass protection [3]. Next is a heuristic method that generalizes the detection strategy more effectively than blacklisting. The detecting system will function according to the rules. These rules are derived from the existing URL list. However, this needs substantial research into the many distinct methods of phishing URL generation [4,5].
To simplify developing rules based on data, researchers employ Machine learning/Deep learning models. Machine learning algorithms are data-driven computational techniques for automatically acquiring new knowledge. The algorithms improve as they get more learning samples. A branch of machine learning is called deep learning. An essential part of machine learning is selecting the features that will assist the construction of a good model that performs well on unseen data. The quality of machine-learned insights depends on the data used to train the model. Features are the building blocks of a data set and are used as independent variables in machine learning models. Researchers have carried out many studies in order to identify phishing URLs by utilizing a variety of feature sets that were taken from different datasets. Some researchers prefer to use the lexical features of phishing URLs because it is easy and safe [6]. Some are exploiting content features on websites that are extremely risky to process. Phishing websites often include malicious malware that could potentially disrupt the processing system [7,8]. Along with URL and webpage content features, other external features, such as DNS information and web page ranking, are also utilized. The visual similarity features are employed by certain studies [9]. Hybrid features, which might contain URL lexical features, webpage content features, external features and others are favored by many scholars [10]. Machine learning models, based on hybrid features, outperform other models in terms of performance. The UCI and Mendeley dataset [11] are commonly utilized for phishing URL identification due to its hybrid features. Most of the present research focuses on enhancing detection models using various machine learning methods by adding new features along with existing features in the dataset/group the features/filter or rank the features/applying ensemble the classification algorithms in different order to improve the performance. Less attention is paid to the fine-tuning factors.
To improve detection outcomes, some existing research essentially combines the proposed method with hyper-parameter optimization. Our experiment aims to combine several fine-tuning elements with the machine learning model to evaluate the performance impact without adding any additional detection methodologies, such as grouping attribute or ensemble algorithms, etc. In this experiment, we combine three different performance-improving fine-tuning factors (data balancing, hyper-parameter tuning, feature selection). Multiple fine-tuning factors help to improve the accuracy.
- According to our investigations, data balancing results in a minor improvement in performance.
- Usually, the tuning of hyper-parameters is iterative, consumes time for optimizing the hyper-parameter for the selected machine learning model and dataset. Based on the results of our experiments, researchers can use the different tuning parameters right away, depending on the model they choose. According to the findings, some of the models, such as SVM, KNN and GB, show a considerable improvement in accuracy when applied to Dataset-1. For Dataset-2, SVM, KNN, GNB and DT add considerable improvements.
- The selection of features is once again an iterative process, consumes time to find an optimal number of features. In our experiment, we vary the number of features and score methods to assess performance. Results show the minimum and maximum number of features needed to achieve a higher accuracy margin and a higher accuracy, respectively.
- Combining all these fine-tuning factors with the machine learning model gives better performance than the existing research works. To the best of our knowledge, these three tuning parameters have not so far been tested together for phishing URL detection.
The paper’s contributions are as follows:
- Optimal hyper-parameters for UCI (UC Irvine) and Mendeley phishing datasets.
- Analyzing the effectiveness of eight machine learning algorithms using different performance-tuning factors, such as dataset balancing, hyper-parameter tuning and feature selection.
- Accuracy, precision, recall and F1-Score are included in the performance evaluation.
- Performance comparison.
The following summarizes the paper’s structure: Section 1 outlines the problem; its significance and the various methods being employed to address it. Section 2 discusses current research studies. In Section 3, the most popular machine learning algorithms are covered. The experimental dataset and the detection approach are described in detail in Section 4. The experiments’ results and contrasts of the results with prior studies are described in Section 5. The paper is concluded in Section 6.
2. Related Works
In the topic of phishing URL detection, a significant amount of research has been carried out, with the UCI and Mendeley phishing datasets. A study article by Khan et al. [12] compared the efficacy of various machine learning methods (DT, SVM, RF, NB, kNN and ANN) with three different datasets. Additionally, it examines the effectiveness of several machine learning models using a dataset with reduced dimensions. Datasets were gathered from the repository for machine learning at UCI and other online sources. The result reveals that the Random Forest method and the artificial neural network achieved 97% accuracy. Salihovic et al. [13] conducted another study that also made use of the UCI phishing dataset and the Spam dataset. For the experiment, six different machine learning algorithms (RF, kNN, ANN, SVM, LR and NB) were used. The results of the experiment show that the dataset responded differently depending on the feature selection methodology. Random Forest with Ranker + Principal Component Optimization achieved 97.33% accuracy for Phishing detection, whereas Random Forest with BestFirst + CfsSubsEval Optimization achieved 94.24% accuracy. A phisher fighter system that uses URL features and webpage features to detect phishing URLs was proposed by Vishva et al. [14]. The UCI phishing dataset was utilized for URL features, while the TF-IDF NLP approach was used to produce features for webpage content. Three machine learning algorithms (LogR, RF, and SVM) are employed in the classification of the URLs. The results show that, with a classification accuracy of 96%, the Random Forest algorithm delivers the best performance.
Hutchinson et al. [15] published an article that emphasizes the importance of the features in classification problems, especially phishing detection using a Random Forest algorithm. The experiment utilizes the UCI phishing dataset, and the features are grouped into five categories (Sets A, B, C, D and E), which include URL based features, host-based features, ranking based features and all combined features. The result shows that Set D and E achieved higher accuracy of 95.5% and 96.5%, respectively. A comparative analysis of the effectiveness of various machine learning models using two distinct datasets, such as the UCI phishing dataset and the Mendeley phishing dataset, was presented by Sarasjati et al. [16]. Random Forest outperformed other classification techniques in the testing, with accuracy rates of 88.92% for the UCI dataset and 97.50% for the Mendeley dataset. Tama et al. [17] compared various ensembles of classifiers to detect phishing on the web. The UCI dataset was utilized. The experiment involved ensembles and single classification algorithms. Their detection performance was assessed using AUC for different resampling methods. The experiments showed that Random Forest was superior to xgboost, Rotation Forest, GBM and single classifiers C50, C-DT and CART. Karabatak [18] analyzed the efficacy of classification algorithms by comparing their results on a UCI phishing dataset. The dataset for phishing websites was reduced in dimension, and performance evaluations of classification algorithms were conducted. The results of experiments showed that minimizing the number of features improves the performance of some classification methods. Al-Sarem et al. [19] suggests a method for identifying phishing websites that uses an efficient stacking ensemble. UCI and two Mendeley Phishing datasets were utilized for the experiments. The proposed method improved detection accuracy to 97.16%, 98.58% and 97.39% for Datasets-1, -2 and -3, respectively. The existing works in the phishing URL detection are outlined in Table 1.

Table 1.
Outline of related works.
In order to solve the problem of phishing URL detection, various machine learning and deep learning models were applied. The UCI and Mendeley Phishing datasets are commonly used in much of the existing research. To increase the performance of the machine learning model, a variety of detection techniques were employed, such as adding new features to the dataset, grouping existing features into distinct categories, filtering or ranking the features and employing an ensemble classification method. Even though these approaches boost model performance, performance tuning factors are given less consideration. Our study focuses on combining multiple performance tuning factors with a machine learning model, improving the model’s performance.
Purpose of the research work: The purpose of our research is to increase the accuracy of phishing detection by integrating multiple performance tuning factors with a machine learning model and evaluating the performance without the inclusion of additional detection methodologies.
Research Gap: Most of the present research focuses on enhancing detection models using various machine learning methods by adding new features along with existing features in the dataset/group the features/filter or rank the features/applying ensemble the classification algorithms in different order to improve the performance. Less attention is paid to the fine-tuning factors. Some of the existing research uses merely hyper-parameter tuning combined with the approach they propose to get better detection results. Our experiment aims to combine multiple fine-tuning elements with the machine learning model to evaluate the performance impact without adding any additional detection methodologies, such as grouping attribute, ensemble algorithms, etc.
Our research evaluates the effectiveness of the most used machine learning model and focuses on three different fine-tuning parameters. The model’s performance improves with each fine-tuning factor. Combining all the three performance-tweaking factors with a machine learning model significantly enhances the performance.
3. Background
Detecting phishing URLs is a binary classification problem. Binary classification in machine learning divides raw data into two groups. The most common classification algorithms for phishing URL detection are shown in Table 2. In our experimental study, these algorithms are used with tuning factors to assess performance.

Table 2.
Classification algorithms.
4. Methodology
The main objective of our experimental study is to evaluate the performance of the fine-tuned machine learning model. The experiment makes use of the eight most common machine learning algorithms listed in Table 2. We employ three different types of tuning factors, such as dataset balancing, hyper-parameter optimization and feature selection. In each case, the performance of the algorithm with a specific dataset is presented in Section 5. Figure 1 depicts an overview of the system process flow.
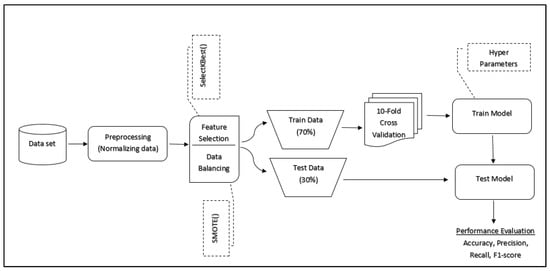
Figure 1.
Process flow.
The most popular datasets from UCI and Mendeley Repository are used in the experiment. Before running the experiment, the dataset was normalized, balanced (if needed) and divided into training and test sets. We apply the selectKbest filtering method, which employs a variety of scoring functions, including correlations and mutual information gain, to choose a subset of features from the full set in order to reduce the data dimension. The experiment uses all eight machine learning models that are listed in Table 1. Four metrics, including accuracy, precision, recall and F1-score, are used to assess each machine learning model’s performance [6]. These metrics are obtained from the confusion matrices, as given in Table 3. In addition, it is essential to evaluate the stability of every machine learning algorithm. Cross-validation is a method for evaluating the effectiveness of a model by using a subset of the input data as training and a portion of the input data as testing that has never been used before. Our experiment used the 10-fold cross validation method [27] to guarantee the machine learning algorithm’s stable performance.

Table 3.
Confusion matrix.
- Accuracy (acc)
Shows how many accurate predictions were made compared to the total number of predictions.
- Precision (Pr)
Precision is a way to measure how many positive class predictions are actually true.
- Recall (Rc)
Recall measures how many instances of a given class were correctly predicted out of all instances of that class in the dataset.
- F1-Score (FS)
F-Measure combines precision and recall into one score.
TP = Truly Positive (TP), TN = Truly Negative, FP =False Positive and FN = False Negative.
Experiments Dataset
The initial dataset utilized in this experiment was obtained from the UCI Repository [28]. This dataset has 11,055 records and 31 features. Out of the 31 features, 30 of which are independent features and 1 of which is a target, which is categorized into 4 groups, such as address bar-based features, abnormality-based features, HTML and JavaScript-based features, and domain-based features. In the 11,055 instances, 6157 reliable websites (1) and 4898 phishing websites (−1) make up the dataset.
The second dataset, which was obtained from the Mendeley repository [29], was made up of 48 features that were taken from a total of 10,000 online pages, 5000 of which were phishing sites and 5000 of which were legitimate websites. Alexa and Common Crawl are used to compile lists of legitimate websites; whereas Phish-Tank and Open-Phish are used to compile lists of malicious ones. Binary labels, such as 0 for legitimate and 1 for phishing, are present in this dataset. These features are divided into three groups: features based on anomalies, features based on HTML/JavaScript and features based on the address bar. Examples of address bar-based functionality include the port number and length of a website’s URL. HTML and JavaScript techniques are incorporated within the website’s source code for both abnormal-based and HTML/JavaScript features. The downloading of items from other websites is an illustration of an abnormal-based functionality [30]. The dataset’s overview is presented in Table 4. Table 5 and Table 6 provide the dataset’s characteristics.

Table 4.
Summary of the datasets.

Table 5.
Features of Dataset-1.

Table 6.
Features of Dataset-2.
5. Experiment Results
The performance effects of three different fine-tuning factors on eight different classification algorithms are examined in this section. Section 5.1 investigates the effects of data balancing on classification algorithms. Section 5.2 assesses the performance improvement by using hyper-parameters. Section 5.3 analyzes the ideal feature set to achieve the best performance.
5.1. Investigates the Effects of Data Balancing on Classification Algorithms
Balanced data has an even distribution of the target class, but unbalanced data can be different. The imbalanced dataset could lead to skewed results. In other words, unbalanced data can lead to results that are skewed in favor of the majority class. The machine learning algorithm is not able to learn from the minority class. Subsequently, whatever test data is given to the machine learning algorithm will be assigned to the majority class. Model performance is often measured by prediction accuracy. In the case of an imbalanced dataset, this is inappropriate [31]. Zheng et al. [32] examined the effects of imbalanced data on machine learning models by evaluating eight well-known machine learning models on 48 different imbalanced datasets. The results demonstrate that, as the imbalance rate increases, the classification accuracy of the algorithms decreases.
To solve this problem, various methods might be used. Common and straightforward are undersampling and oversampling. Uneven datasets can be balanced using the technique of undersampling. In this approach, the size of the class that belongs to the majority is reduced while all the data from the minority class is retained, while oversampling will raise the quantity of minority data samples to match the majority. The minority class’s data samples will be duplicated. Usually, oversampling is better than undersampling because deleting data can mean losing critical features. For the minority class, synthetic samples are created using the synthetic minority oversampling technique (SMOTE) [33,34]. A symbolic representation of oversampling using SMOTE is depicted in Figure 2, and the algorithm is presented in Algorithm 1. This approach overcomes random oversampling’s overfitting problem. Dataset-1 is having 56% legitimate URLs and 44% phishing URLs as shown in Table 7. So, we apply SMOTE oversampling technique to balance the Dataset-1 for our experiment. With the balanced and unbalanced dataset, the experiment displays the performance of eight different machine learning algorithms. The results are shown in Table 8.
| Algorithm 1: SMOTE |
| Input: Imbalanced URL (Phishing and Benign URLs) Dataset D |
| Output: Balanced URL (Phishing and Benign URLs) Dataset |
| Load (URL Dataset) |
| Find the Minority Class Set () |
| Take the random sample in ( ϵ ) |
| For each in : |
| Find the -Nearest Neighbor () of . |
| For each in : |
| Identify the vector between and . |
| Multiply the vector by a random number between 0 and 1 and add to the current data point. |
| Add to |
| return |

Figure 2.
Oversampling using SMOTE.

Table 7.
Experiment dataset for Data Balancing.

Table 8.
Performance comparison of balanced dataset with imbalanced dataset (Dataset-1).
According to the experiment results in Table 8 and Figure 3, minor performance improvement occurs after balancing the Dataset-1. The algorithms SVM, BNB, KNN, DT, RF and GB provide marginal improvements in performance. The RF and XGB algorithms achieve the highest accuracy (%) for the balanced dataset with scores of 97.425 and 97.028, respectively, and the XGB and RF algorithms achieve the highest F1-Score with scores of 97.582 and 97.529, respectively, for the imbalanced dataset.
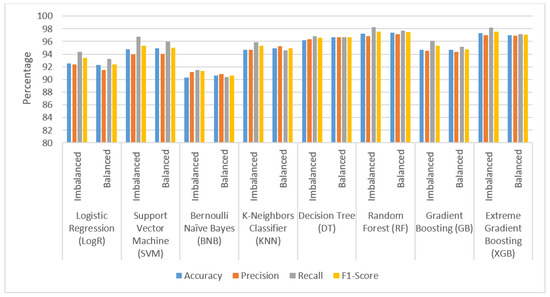
Figure 3.
Performance comparison of balanced dataset with imbalanced dataset (Dataset-1).
5.2. Examine the Performance Impact of Hyper-Parameter Tuning on Classification Algorithms
Hyper-parameters are the parameters that are set by the user to control the learning process of the machine learning model. Estimated model parameters that failed to minimize the loss function are a byproduct of poorly tuned hyper-parameters. This implies that the model is more inaccurate. The optimal values for the hyper-parameters can be calculated either manually or automatically. When manually tuning hyper-parameters, it is often best to start with the recommended values or rules of thumb and then to search through a range of values by trial and error. However, manual tuning requires a lot of effort and takes a lot of time. It is impractical if there are several hyper-parameters with a wide range. Automated methods of hyper-parameter tuning use an algorithm to identify the optimum values. Grid search, Random search and Bayesian optimization are common automated methods. In our experiment, the grid search approach was employed. Grid search is a "brute force" technique for hyper-parameter tweaking. The model is first fit using a grid of all possible values for each discrete hyper-parameter. Every set’s performance from the model is recorded, and the set with the best performance is chosen.
The experimental datasets are listed in Table 9. Hyper-parameters and values for eight different classification models are provided in Table 10. Table 11 and Figure 4 show the performance comparison of the hyper-parameter tuned and untuned model for Dataset-1. Table 12 and Figure 5 show the performance comparison of hyper-parameter tuned and untuned model for Dataset-2.

Table 9.
Experiment dataset for Hyper-Parameter Tuning.

Table 10.
Hyper-parameters for classification algorithms.

Table 11.
Performance comparison of hyper-parameter tuned and untuned model for Dataset-1.
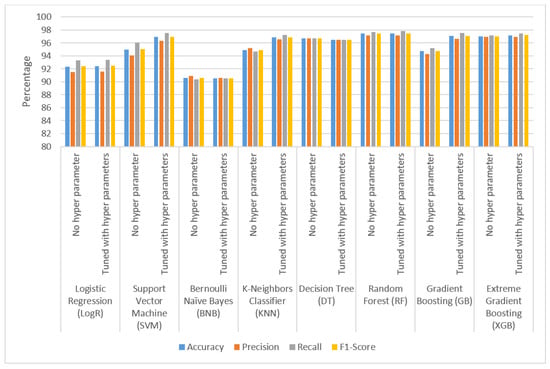
Figure 4.
Performance comparison of hyper-parameter tuned and untuned model for Dataset-1.

Table 12.
Performance comparison of hyper-parameter tuned and untuned model (Dataset-2).
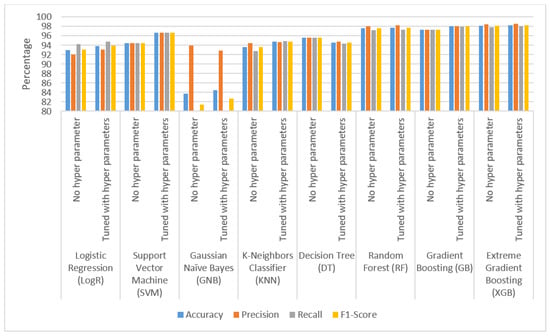
Figure 5.
Performance comparison of hyper-parameter tuned and untuned model (Dataset-2).
As stated in Table 11 and Table 12, most common classification algorithms exhibit modest to significant changes in accuracy (%) value for Dataset-1 and Dataset-2, as illustrated in Figure 4 and Figure 5. GB, XGB and RF achieve the highest performance for Dataset-1 with 97.076, 97.182 and 97.466 accuracies, respectively. RF, GB and XGB achieve the highest performance for Dataset-2, with 97.74, 97.98 and 98.26 accuracies, respectively.
5.3. Examine the Minimum and Maximum Number of Features Needed for Optimal Performance
The process of choosing a subset of variables from the original data set to utilize as inputs in a machine learning model is known as feature selection. Typically, data collection includes a sizable number of attributes. A variety of methods can be used to determine which of these features are useful in generating predictions. Models for machine learning with fewer features have benefits such as less redundancy, simpler understanding, faster training and simpler deployment. Simpler models might be more generalizable and exhibit less overfitting. A model with too many variables frequently becomes noisy. By removing noisy and useless information, the model may be better able to adapt to fresh, unforeseen data, resulting in predictions that are more accurate. A feature selection procedure combines a search technique and an evaluation method. The search technique suggests new subsets of features, and the evaluation metric assesses the subset’s quality. These methods can be classified as a filter, wrapper or embedding. Our experiment employs the filtering method. The first phase of a filter algorithm is to rank features according to some criteria, and the second is to select the features with the highest ranking to use in training the machine learning models. The experiment makes use of SelectKBest in order to choose the features that have the best variance. There are two inputs to this method. One is the scoring metric, which is the ANOVA F-value between label and feature for classification tasks or mutual_info_classif for mutual information for a discrete target or chi2 for chi-squared stats of non-negative features for classification tasks, and another is the value of K, which denotes the number of features in the final dataset. Table 13 shows the features of two separate datasets utilized in the experiment. The mutual information gains score for every feature in Dataset-1, and Dataset-2 is depicted in Figure 6 and Figure 7 respectively. Data were normalized and balanced prior to the experiment. Hyper-parameter tuning is also used to produce better results with fewer features. The K parameter for the selectKbest() method ranges from 2 to the total number of features in the dataset. Table 14 and Table 15 display the experiment’s outcomes.

Table 13.
Experiment dataset for feature selection.
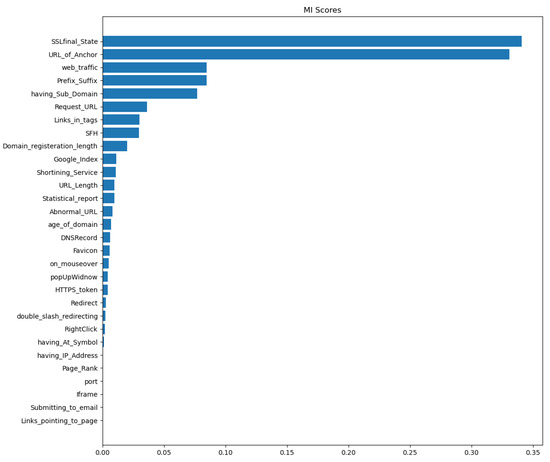
Figure 6.
Mutual information gain score for Dataset-1.
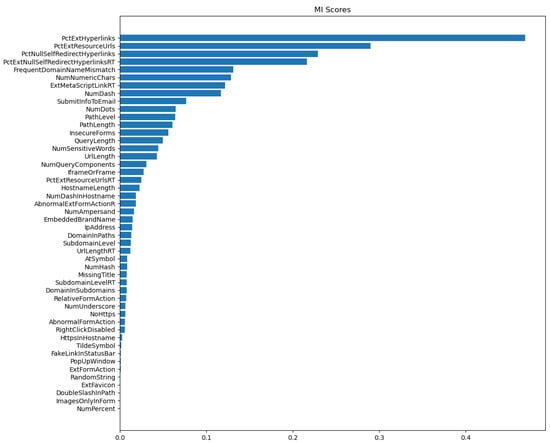
Figure 7.
Mutual information gain score for Dataset-2.

Table 14.
Maximum and minimum number of features for optimal performance for Dataset-1.

Table 15.
Maximum and minimum number of features for optimal performance for Dataset-2.
Table 14 and Table 15 illustrate the minimum and a maximum number of features necessary to achieve optimal accuracy for Datasets-1 and -2 using eight classification algorithms. The minimum number of features required to provide a larger accuracy margin suggests that a dimension reduction will improve performance. Table 16 and Table 17 show a summary of the overall performance in terms of accuracy for Dataset-1 and Dataset-2 with different tuning factors. Dataset-2 is already a balanced set; hence, no SMOTE procedure was necessary. Figure 8 and Figure 9 demonstrate conclusively that tuned classification algorithms are more accurate than untuned classification algorithms. Random Forest (RF) and Gradient Boosting (GB) achieve 97.440% and 97.47% accuracy (%) for Dataset-1, respectively. For Dataset-2, Extreme Gradient Boosting (XGB) and Gradient Boosting (GB) have a higher accuracy (%) of 98.21 and 98.27, respectively.

Table 16.
Dataset-1 performance (accuracy %) comparison.

Table 17.
Dataset-2 performance (accuracy %) comparison.
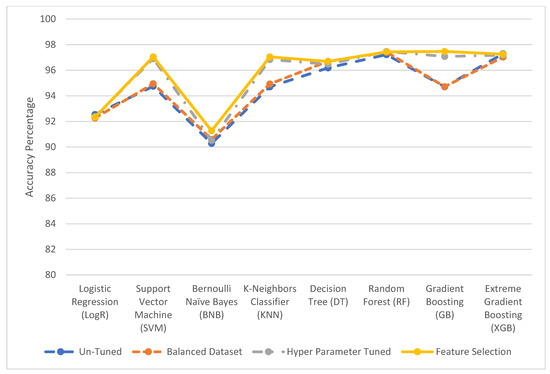
Figure 8.
Dataset-1 performance (accuracy %) comparison.
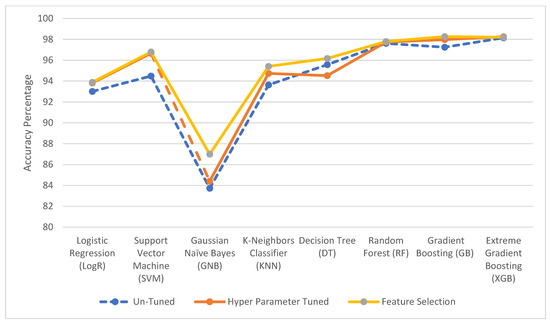
Figure 9.
Dataset-2 performance (accuracy %) comparison.
The performance comparison between existing approaches and our fine-tuned method is shown in Table 18 and Figure 10 and Figure 11. The results show that the fine-tuned method outperforms with the UCI dataset and receives almost the same results as the ensemble methods with the Mendeley dataset.

Table 18.
Performance comparison of existing and fine-tuned method for Dataset-1 and Dataset-2.
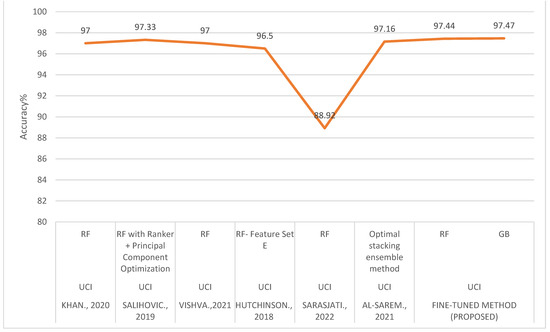
Figure 10.
Performance comparison of existing and fine-tuned system for UCI dataset [12,13,14,15,16,19].
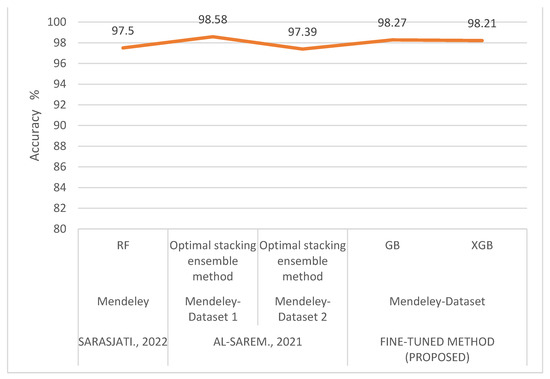
Figure 11.
Performance comparison of existing and fine-tuned method for Mendeley dataset [16,19].
6. Conclusions and Future Scope
Phishing via spoofed URLs is a deceptive technique used to deceive users into downloading malicious software or disclosing personal information. Most of these phishing URLs are spread through email or SMS or through social media post. To detect these URLs is a real challenging task for internet users. The machine learning based solution provides an automatic detection of such harmful URLs. Existing research works focus on enhancing detection accuracy by the introduction of novel methods, such as selecting some features, ranking some features, grouping some features, ensemble of the machine learning model and so on. Tuning parts of the machine learning model are given less consideration.
Adding single tuning factors to the machine learning model does not create significant impact on the performance. That is why this experiment evaluates the performance of the eight machine learning algorithms with three different performance tuning factors, such as dataset balancing, hyper-parameter tuning and feature selection.
The results demonstrate conclusively that tuned classification algorithms are more accurate than existing classification algorithms. According to our investigations, data balancing results in a minor improvement in performance. In hyper-parameter tuning, the experimental results show that SVM, KNN and GB algorithms improve the accuracy when applied to Dataset-1. For Dataset-2, SVM, KNN, GNB and DT add considerable improvements. With regards to feature selection, the result highlights the minimum number of features required to achieve higher accuracy margin. This will help the future research to choose best scoring function with an optimum number of features. By combining all the three fine-tuning factors with the machine learning model without adding any additional procedure, the model performs better in terms of accuracy. The result shows that tuning factors enhance the efficiency of machine learning algorithms. For Dataset-1, Random Forest (RF) and Gradient Boosting (XGB) achieve accuracy rates of 97.44% and 97.47%, respectively. Gradient Boosting (XGB) and Extreme Gradient Boosting (XGB) achieve accuracy values of 98.27% and 98.21%, respectively, for Dataset-2.
In the future we will work on important techniques in the network known as software-defined networking (SDN) and blockchain technology that offer several benefits by separating the intelligence of the network (the controller) from the underlying network architecture. SDN is an example of an advantage that may be gained from this separation (data plane) [35]. The most significant innovation behind Bitcoin is the blockchain innovation mechanism. It is still dealing with issues such as security, information management, compliance and dependability. In the future, our research will uncover various cloud security concerns and network issues in order to thwart cloud threats and facilitate risk reduction strategies for researchers, end-users and cloud providers undertaking threat analysis [36].
Author Contributions
Data Curation, S.R.A.S., S.B., A.S.A.-K. and B.S.; Formal Analysis, S.R.A.S., S.B., A.S.A.-K., B.S. and S.C.; Funding Acquisition, A.M., J.L.W. and A.B.; Investigation, S.C. and B.S.; Methodology, S.R.A.S., S.B., A.S.A.-K. and B.S.; Project Administration, A.M., J.L.W. and A.B.; Resources, B.S. and S.C.; Software, S.R.A.S., S.B., A.S.A.-K. and B.S.; Validation, B.S.; Visualization, A.M., J.L.W. and A.B.; Writing—Original Draft, S.R.A.S., S.B., A.S.A.-K. and B.S.; Writing—Review and Editing, A.M., J.L.W. and A.B. All authors have read and agreed to the published version of the manuscript.
Funding
This research received no external funding.
Institutional Review Board Statement
Not applicable.
Informed Consent Statement
Not applicable.
Data Availability Statement
The data can be publicly accessed from: https://archive.ics.uci.edu/ml/datasets/website+phishing (accessed on 26 March 2015); https://archive.ics.uci.edu/mL/datasets/Phishing+Websites (accessed on 26 March 2015).
Conflicts of Interest
The authors declare no conflict of interest.
References
- Andress, J. The Basics of Information Security, 2nd ed.; Chapter 8; Syngress: Oxford, UK, 2014. [Google Scholar] [CrossRef]
- Anti-Phishing Working Group (APWG) Legacy Reports. Available online: https://docs.apwg.org/reports/apwg_trends_report_q2_2022.pdf (accessed on 1 December 2022).
- Raja, A.S.; Madhubala, R.; Rajesh, N.; Shaheetha, L.; Arulkumar, N. Survey on Malicious URL Detection Techniques. In Proceedings of the 6th International Conference on Trends in Electronics and Informatics (ICOEI), Tirunelveli, India, 28–30 April 2022; pp. 778–781. [Google Scholar] [CrossRef]
- Raja, A.S.; Pradeepa, G.; Arulkumar, N. Mudhr: Malicious URL detection using heuristic rules based approach. In AIP Conference Proceedings; AIP Publishing LLC: Woodbury, NY, USA, 2022; Volume 2393. [Google Scholar]
- Mohammad, R.; Thabtah, F.; McCluskey, T.L. Phishing Website Features. Available online: https://eprints.hud.ac.uk/id/eprint/24330/6/MohammadPhishing14July2015.pdf (accessed on 1 December 2022).
- Raja, A.S.; Vinodini, R.; Kavitha, A. Lexical features based malicious URL detection using machine learning techniques. Mater. Today Proc. 2021, 47, 163–166. [Google Scholar] [CrossRef]
- Hou, Y.-T.; Chang, Y.; Chen, T.; Laih, C.-S.; Chen, C.-M. Malicious web content detection by machine learning. Expert Syst. Appl. 2010, 37, 55–60. [Google Scholar] [CrossRef]
- Raja, A.S.; Sundarvadivazhagan, B.; Vijayarangan, R.; Veeramani, S. Malicious Webpage Classification Based on Web Content Features Using Machine Learning and Deep Learning. In Proceedings of the International Conference on Green Energy, Computing and Sustainable Technology (GECOST) 2022, Virtual, 26–28 October 2022. [Google Scholar] [CrossRef]
- Sahoo, D.; Liu, C.; Hoi, S.C. Malicious URL Detection using Machine Learning: A Survey. arXiv arXiv:1701.07179, 2017.
- Awasthi, A.; Goel, N. Phishing website prediction using base and ensemble classifier techniques with cross-validation. Cybersecurity 2022, 5, 22. [Google Scholar] [CrossRef] [PubMed]
- Tang, L.; Mahmoud, Q.H. A Survey of Machine Learning-Based Solutions for Phishing Website Detection. Mach. Learn. Knowl. Extr. 2021, 3, 672–694. [Google Scholar] [CrossRef]
- Khan, S.A.; Khan, W.; Hussain, A. Phishing Attacks and Websites Classification Using Machine Learning and Multiple Datasets (A Comparative Analysis). In Intelligent Computing Methodologies: 16th International Conference, ICIC 2020, Bari, Italy, 2–5 October 2020, Proceedings, Part III; Lecture Notes in Computer Science; Springer: Cham, Switzerland, 2020; Volume 12465. [Google Scholar] [CrossRef]
- Salihovic, I.; Serdarevic, H.; Kevric, J. The Role of Feature Selection in Machine Learning for Detection of Spam and Phishing Attacks. Advanced Technologies, Systems, and Applications. In Advanced Technologies, Systems, and Applications II: Proceedings of the International Symposium on Innovative and Interdisciplinary Applications of Advanced Technologies (IAT); Lecture Notes in Networks and Systems; Springer: Cham, Switzerland, 2019; Volume 60, p. 60. [Google Scholar] [CrossRef]
- Vishva, E.S.; Aju, D. Phisher Fighter: Website Phishing Detection System Based on URL and Term Frequency-Inverse Document Frequency Values. J. Cyber Secur. Mobil. 2021, 11, 83–104. [Google Scholar] [CrossRef]
- Hutchinson, S.; Zhang, Z.; Liu, Q. Detecting Phishing Websites with Random Forest. Machine Learning and Intelligent Communications: Third International Conference, MLICOM 2018, Lecture Notes of the Institute for Computer Sciences, Social Informatics and Telecommunications Engineering. Hangzhou, China, 6–8 July 2018; Meng, L., Zhang, Y., Eds.; Springer International Publishing: Cham, Switzerland, 2018; Volume 251. [Google Scholar] [CrossRef]
- Sarasjati, W.; Rustad, S.; Santoso, H.A.; Syukur, A.; Rafrastara, F.A. Comparative Study of Classification Algorithms for Website Phishing Detection on Multiple Datasets. In International Seminar on Application for Technology of Information and Communication (iSemantic); IEEE: New York, NY, USA, 2022; pp. 448–452. [Google Scholar] [CrossRef]
- Tama, B.A.; Rhee, K.-H. A Comparative Study of Phishing Websites Classification Based on Classifier Ensembles. J. Korea Multimed. Soc. 2018, 21, 617–625. [Google Scholar] [CrossRef]
- Karabatak, M.; Mustafa, T. Performance comparison of classifiers on reduced phishing website dataset. In Proceedings of the 6th International Symposium on Digital Forensic and Security (ISDFS), Antalya, Turkey, 22–25 March 2018; pp. 1–5. [Google Scholar] [CrossRef]
- Al-Sarem, M.; Saeed, F.; Al-Mekhlafi, Z.G.; Mohammed, B.A.; Al-Hadhrami, T.; Alshammari, M.T.; Alreshidi, A.; Alshammari, T.S. An Optimized Stacking Ensemble Model for Phishing Websites Detection. Electronics 2021, 10, 1285. [Google Scholar] [CrossRef]
- Feroz, M.N.; Mengel, S. Examination of data, rule generation and detection of phishing URLs using online logistic regression. In IEEE International Conference on Big Data (Big Data); IEEE: New York, NY, USA, 2014; pp. 241–250. [Google Scholar]
- Anupam, S.; Kar, A.K. Phishing website detection using support vector machines and nature-inspired optimization algorithms. Telecommun. Syst. 2021, 76, 17–32. [Google Scholar] [CrossRef]
- Machado, L.; Gadge, J. Phishing Sites Detection Based on C4.5 Decision Tree Algorithm. In Proceedings of the International Conference on Computing, Communication, Control and Automation (ICCUBEA), Pune, India, 17–18 August 2017; pp. 1–5. [Google Scholar]
- Altyeb, A. Phishing Websites Classification using Hybrid SVM and KNN Approach. Int. J. Adv. Comput. Sci. Appl. 2017, 8. [Google Scholar] [CrossRef]
- Subasi, A.; Molah, E.; Almkallawi, F.; Chaudhery, T.J. Intelligent phishing website detection using random forest classifier. In Proceedings of the International Conference on Electrical and Computing Technologies and Applications (ICECTA), Phuket, Thailand, 12–13 October 2017; pp. 1–5. [Google Scholar]
- Bhoj, N.; Bawari, R.; Tripathi, A.; Sahai, N. Naive and Neighbour Approach for Phishing Detection. In Proceedings of the IEEE International Conference on Communication Systems and Network Technologies (CSNT), Bhopal, India, 18–19 June 2021; pp. 171–175. [Google Scholar]
- Brownlee, J. Ensemble Learning Algorithms With Python: Make Better Predictions with Bagging, Boosting, and Stacking; Machine Learning Mastery: San Francisco, CA, USA, 2021. [Google Scholar]
- Tougui, I.; Jilbab, A.; El Mhamdi, J. Impact of the Choice of Cross-Validation Techniques on the Results of Machine Learning-Based Diagnostic Applications. Healthc. Inform. Res. 2021, 27, 189–199. [Google Scholar] [CrossRef] [PubMed]
- Mohammad, R.; McCluskey, T.L.; Thabtah, F. UCI Machine Learning Repository: Phishing Websites Data Set. Available online: https://archive.ics.uci.edu/ml/index.php (accessed on 26 March 2015).
- Tan, C.L. Phishing Dataset for Machine Learning: Feature Evaluation. Mendeley Data 2018, 1, 2018. [Google Scholar]
- Almseidin, M.; Zuraiq, A.A.; Al-Kasassbeh, M.; Alnidami, N. Phishing Detection Based on Machine Learning and Feature Selection Methods. Int. J. Interact. Mob. Technol. 2019, 13, 171–183. [Google Scholar] [CrossRef]
- Ul Hassan, I.; Ali, R.H.; Ul Abideen, Z.; Khan, T.A.; Kouatly, R. Significance of Machine Learning for Detection of Malicious Websites on an Unbalanced Dataset. Digital 2022, 2, 501–519. [Google Scholar] [CrossRef]
- Zheng, M.; Wang, F.; Hu, X.; Miao, Y.; Cao, H.; Tang, M. A Method for Analyzing the Performance Impact of Imbalanced Binary Data on Machine Learning Models. Axioms 2022, 11, 607. [Google Scholar] [CrossRef]
- Synthetic Minority Over-Sampling TEchnique (SMOTE). Available online: https://medium.com/@corymaklin/synthetic-minority-over-sampling-technique-smote-7d419696b88c (accessed on 1 December 2022).
- Chawla, N.V.; Bowyer, K.W.; Hall, L.O.; Kegelmeyer, W.P. SMOTE: Synthetic Minority Over-sampling Technique. J. Artif. Intell. Res. 2002, 16, 321–357. [Google Scholar] [CrossRef]
- Badotra, S.; Panda, S.N. SNORT based early DDoS detection system using Opendaylight and open networking operating system in software defined networking. Clust. Comput. 2021, 24, 501–513. [Google Scholar] [CrossRef]
- Rani, M.; Guleria, K.; Panda, S.N. Blockchain Technology Novel Prospective for Cloud Security. In Proceedings of the 2022 10th International Conference on Reliability, Infocom Technologies and Optimization (Trends and Future Directions)(ICRITO), Noida, India, 13–14 October 2022; IEEE: New York, NY, USA; pp. 1–6. [Google Scholar]
Disclaimer/Publisher’s Note: The statements, opinions and data contained in all publications are solely those of the individual author(s) and contributor(s) and not of MDPI and/or the editor(s). MDPI and/or the editor(s) disclaim responsibility for any injury to people or property resulting from any ideas, methods, instructions or products referred to in the content. |
© 2023 by the authors. Licensee MDPI, Basel, Switzerland. This article is an open access article distributed under the terms and conditions of the Creative Commons Attribution (CC BY) license (https://creativecommons.org/licenses/by/4.0/).