
Impact of In-Air Gestures on In-Car Task’s Diver Distraction

 , ,
, , 
Abstract
1. Introduction
- Lighting conditions: Gesture recognition systems are highly sensitive to lighting, and strong light or shadows may interfere with gesture recognition [6].
- Gesture diversity and variations: Different shapes and motions of gestures may lead to changes in visual features, thus affecting the accuracy of gesture recognition [7].
- Quality and diversity of datasets: The performance of gesture recognition systems largely depends on the quality and diversity of training data. If the training dataset is insufficient or not representative, the accuracy of gesture recognition may be affected [7]. It is also mentioned that there are currently few effective datasets available for training gesture recognition models, and even fewer datasets with accurate annotations for hand actions [7,10].
- We develop an evaluation system to measure the level of driver distraction caused by two different interaction methods: gesture and touch. Specifically, in the assessment of the driver’s primary task, calculate the driving scores under different interaction methods.
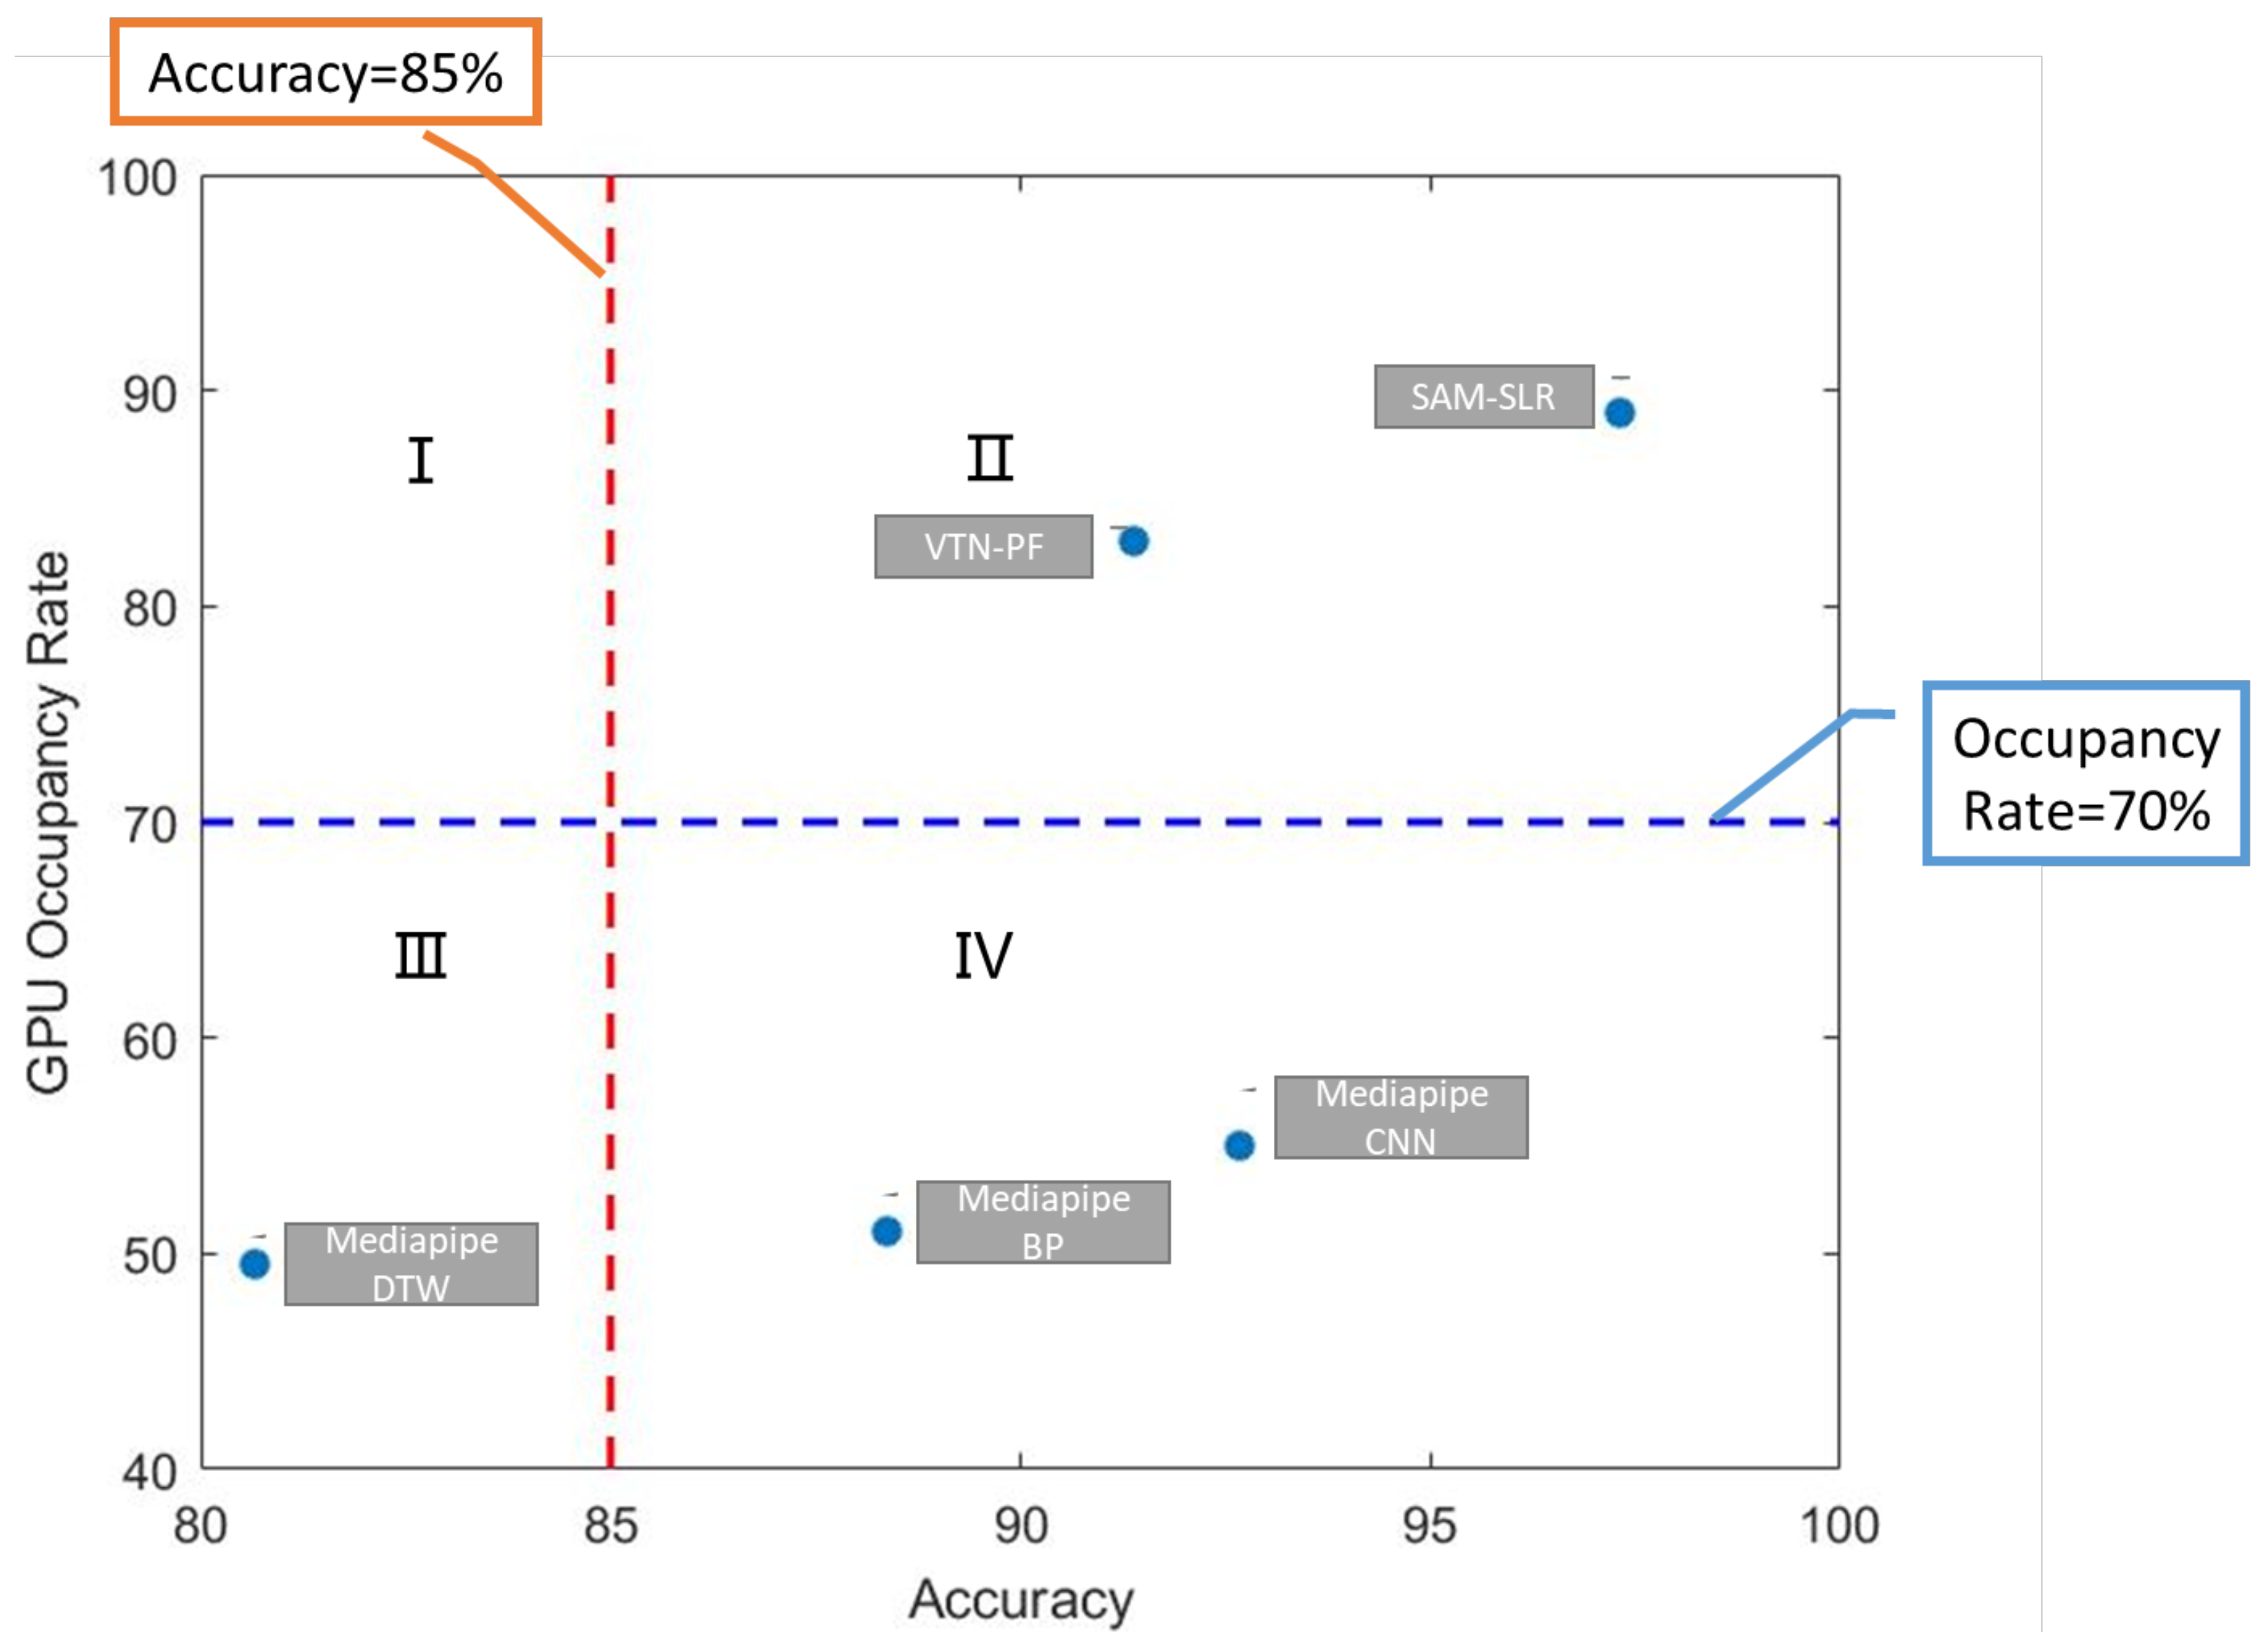
- We proposed a gesture recognition framework based on Mediapipe suitable for Android mobile devices and tested it on the AUSTL dataset alongside two state-of-the-art gesture recognition methods.
- We design a custom IVIS system interface and build a simulation environment to mimic driving scenarios. At the same time, use user experiments to select the most suitable gestures for the system’s gesture interaction.
2. Related Work
2.1. Design of IVIS Interaction Interfaces
2.2. In-Air Gesture Recognition Methods
2.3. Factors Causing Driver Distraction
3. Methodology
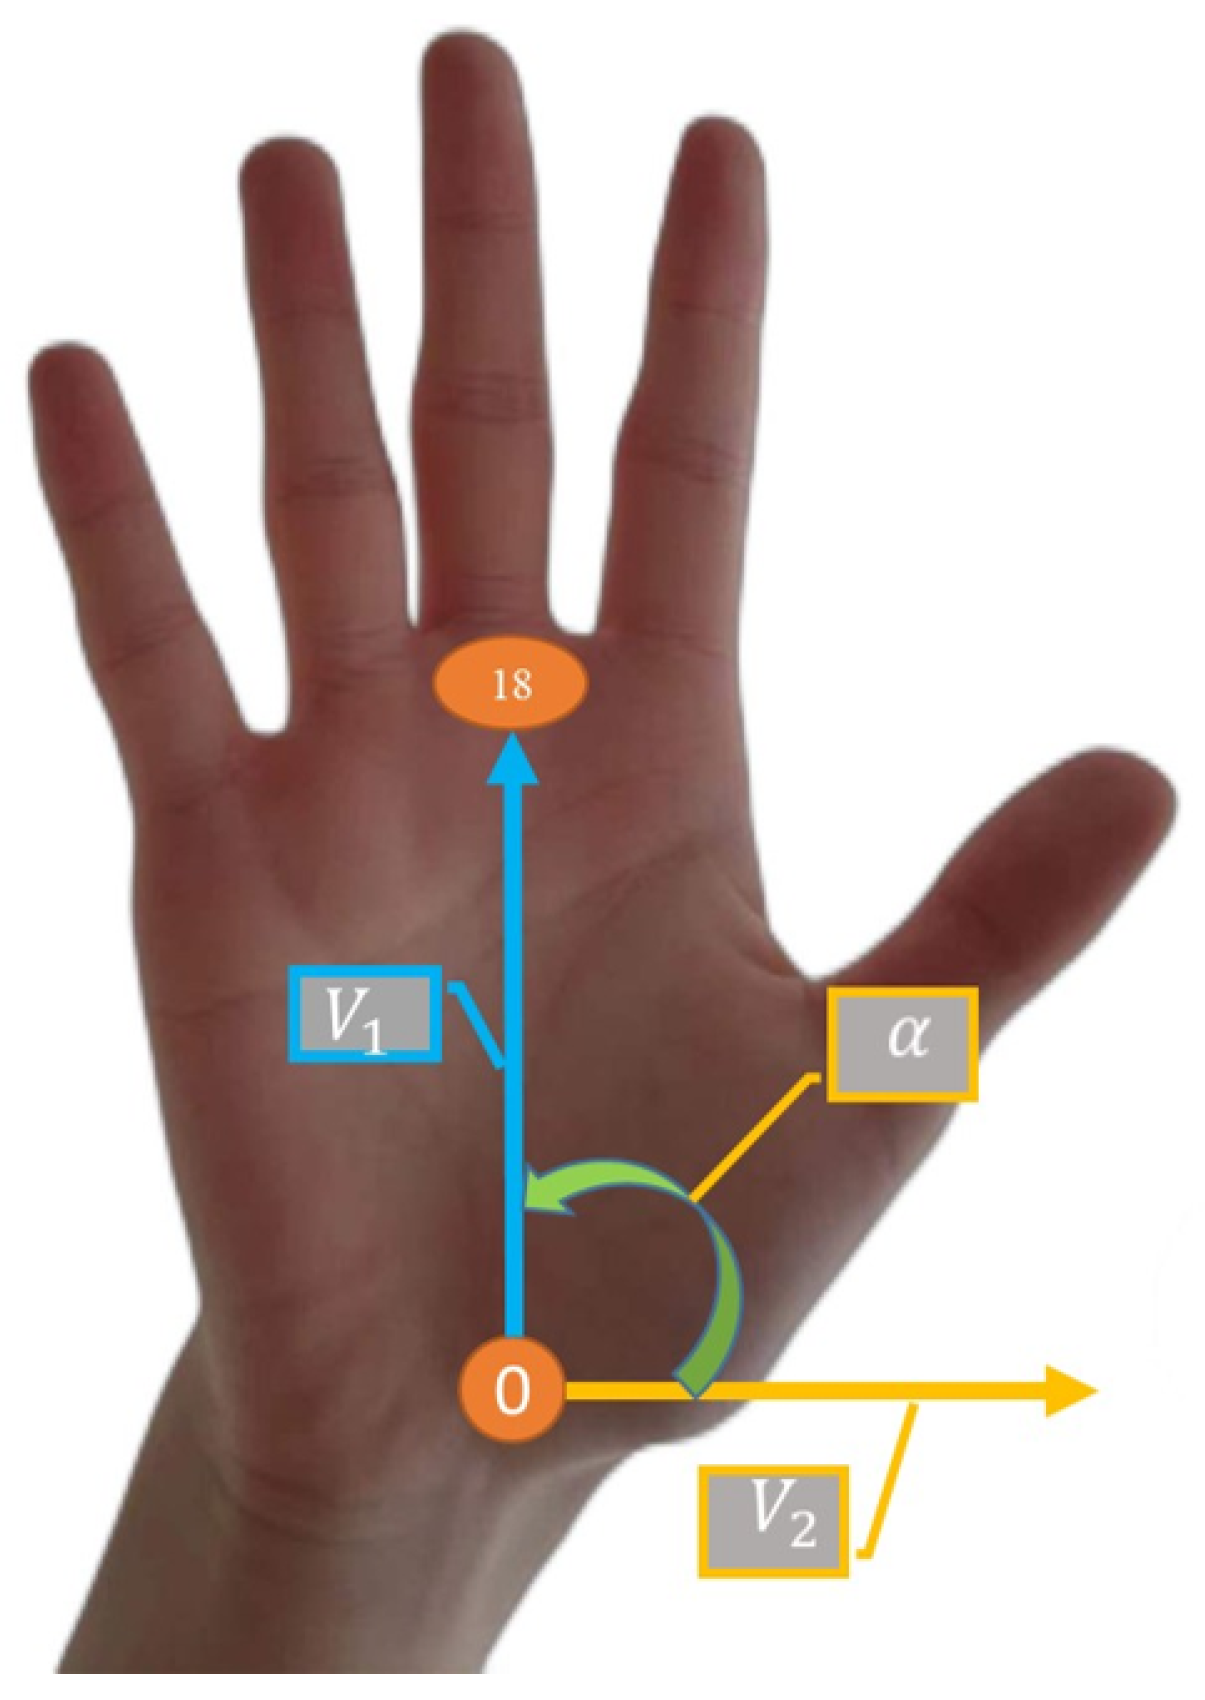
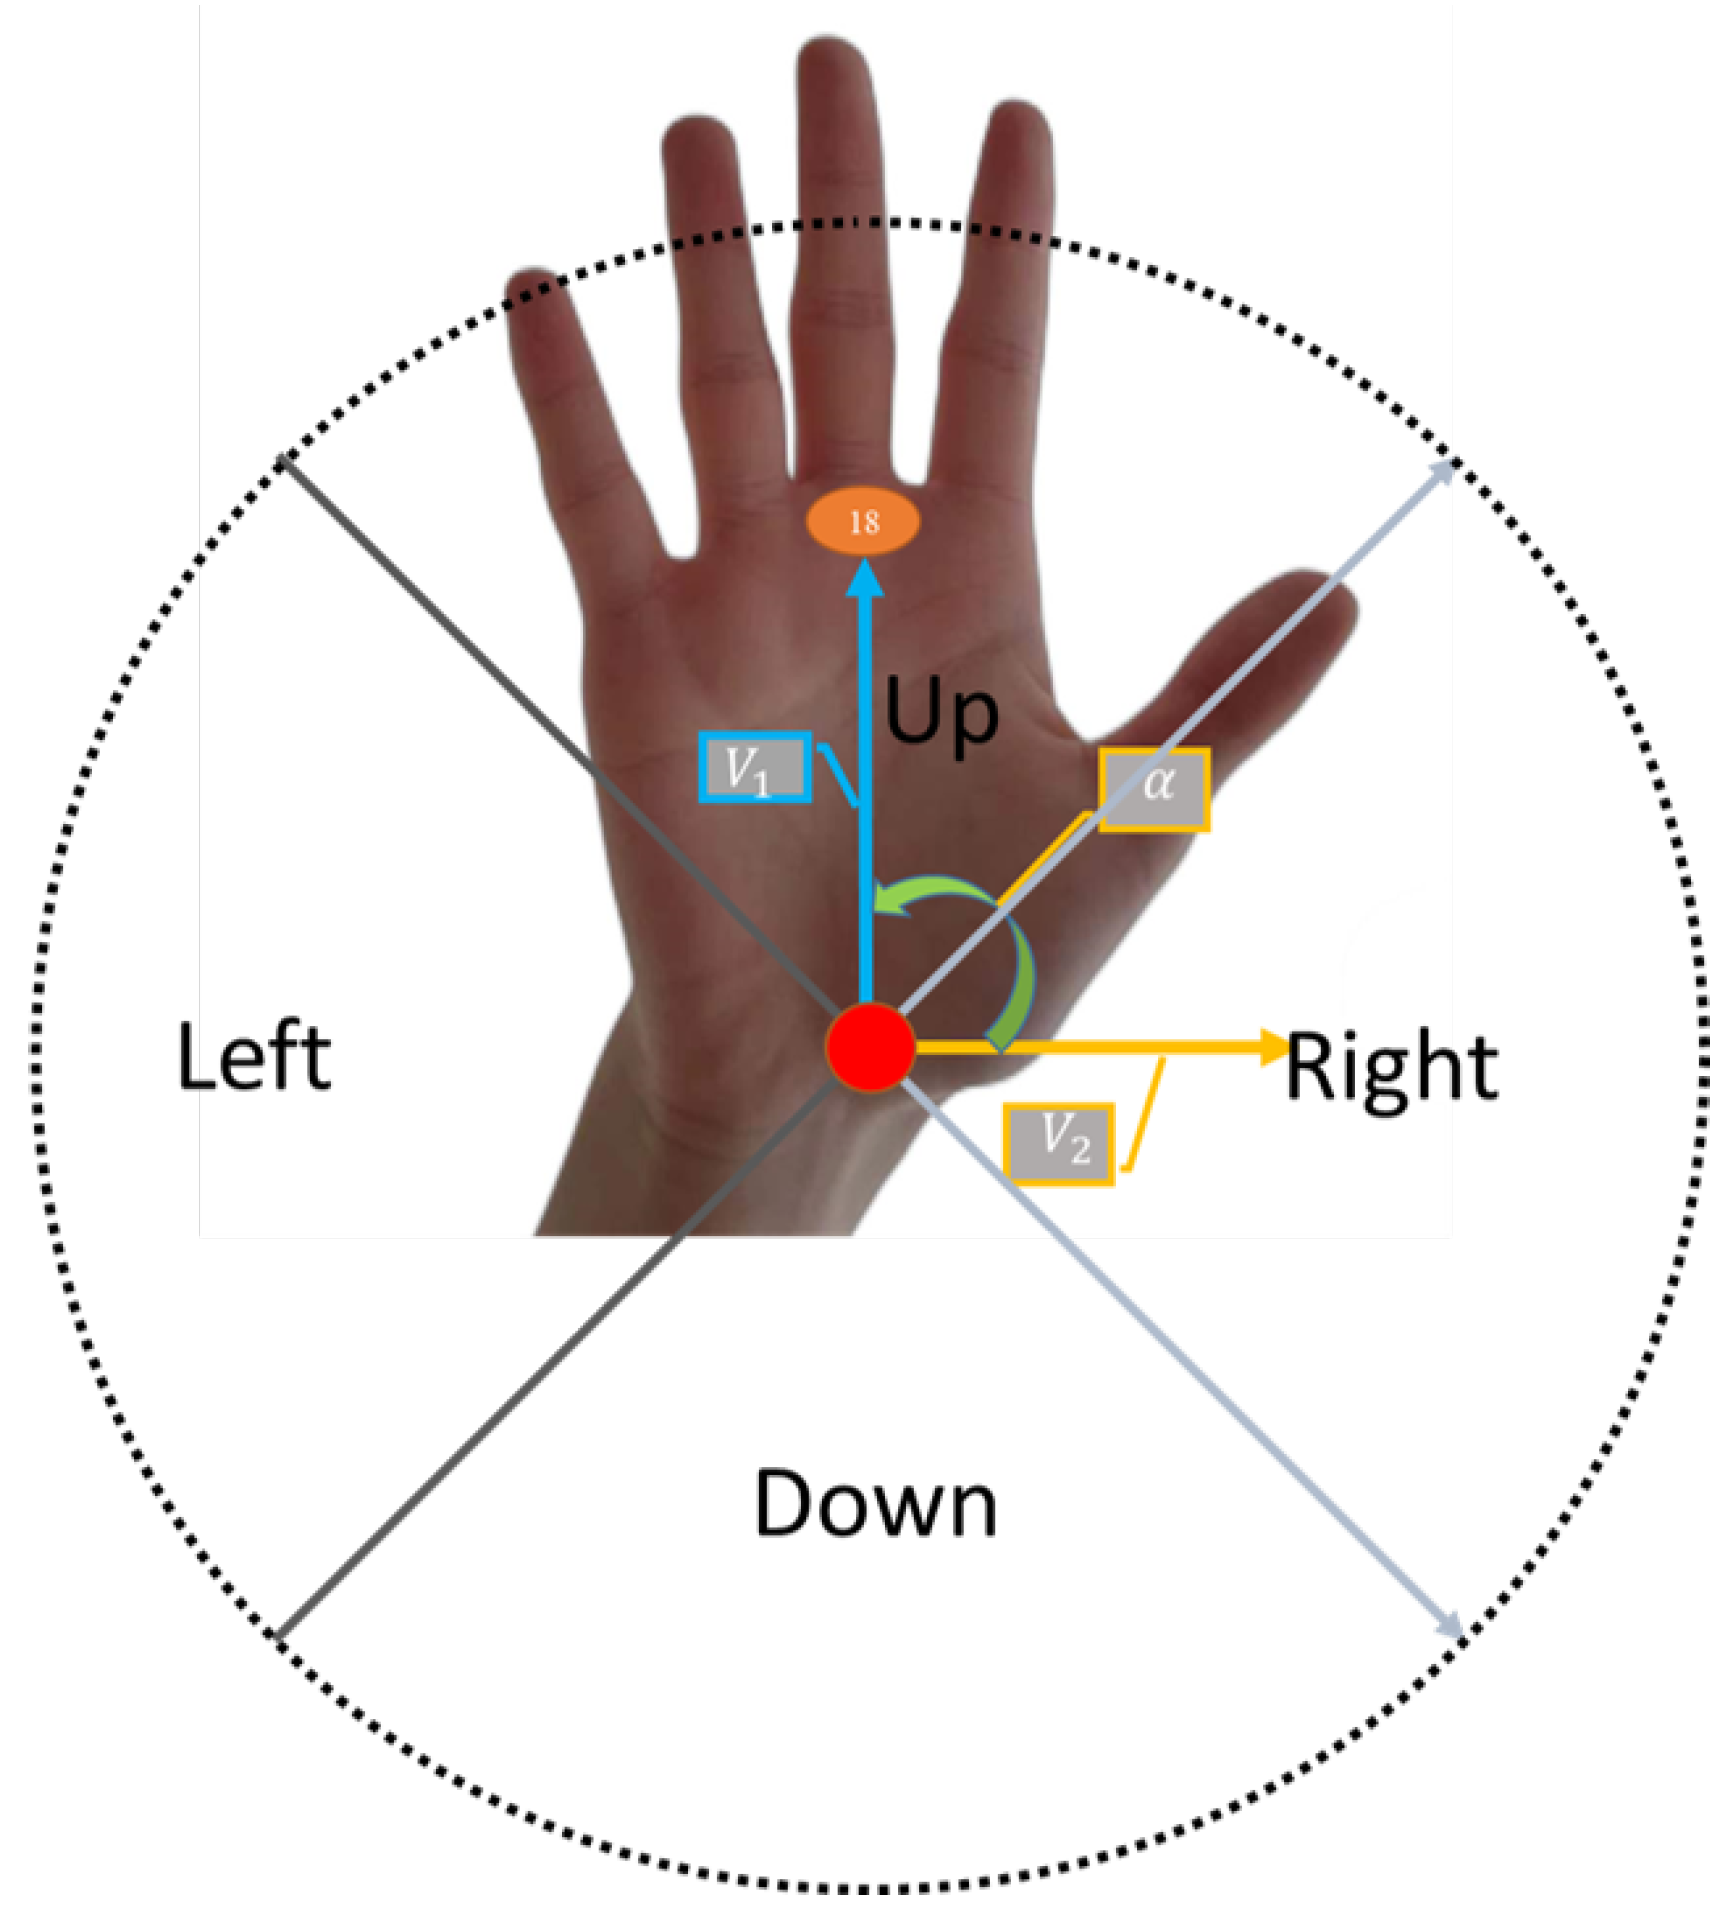
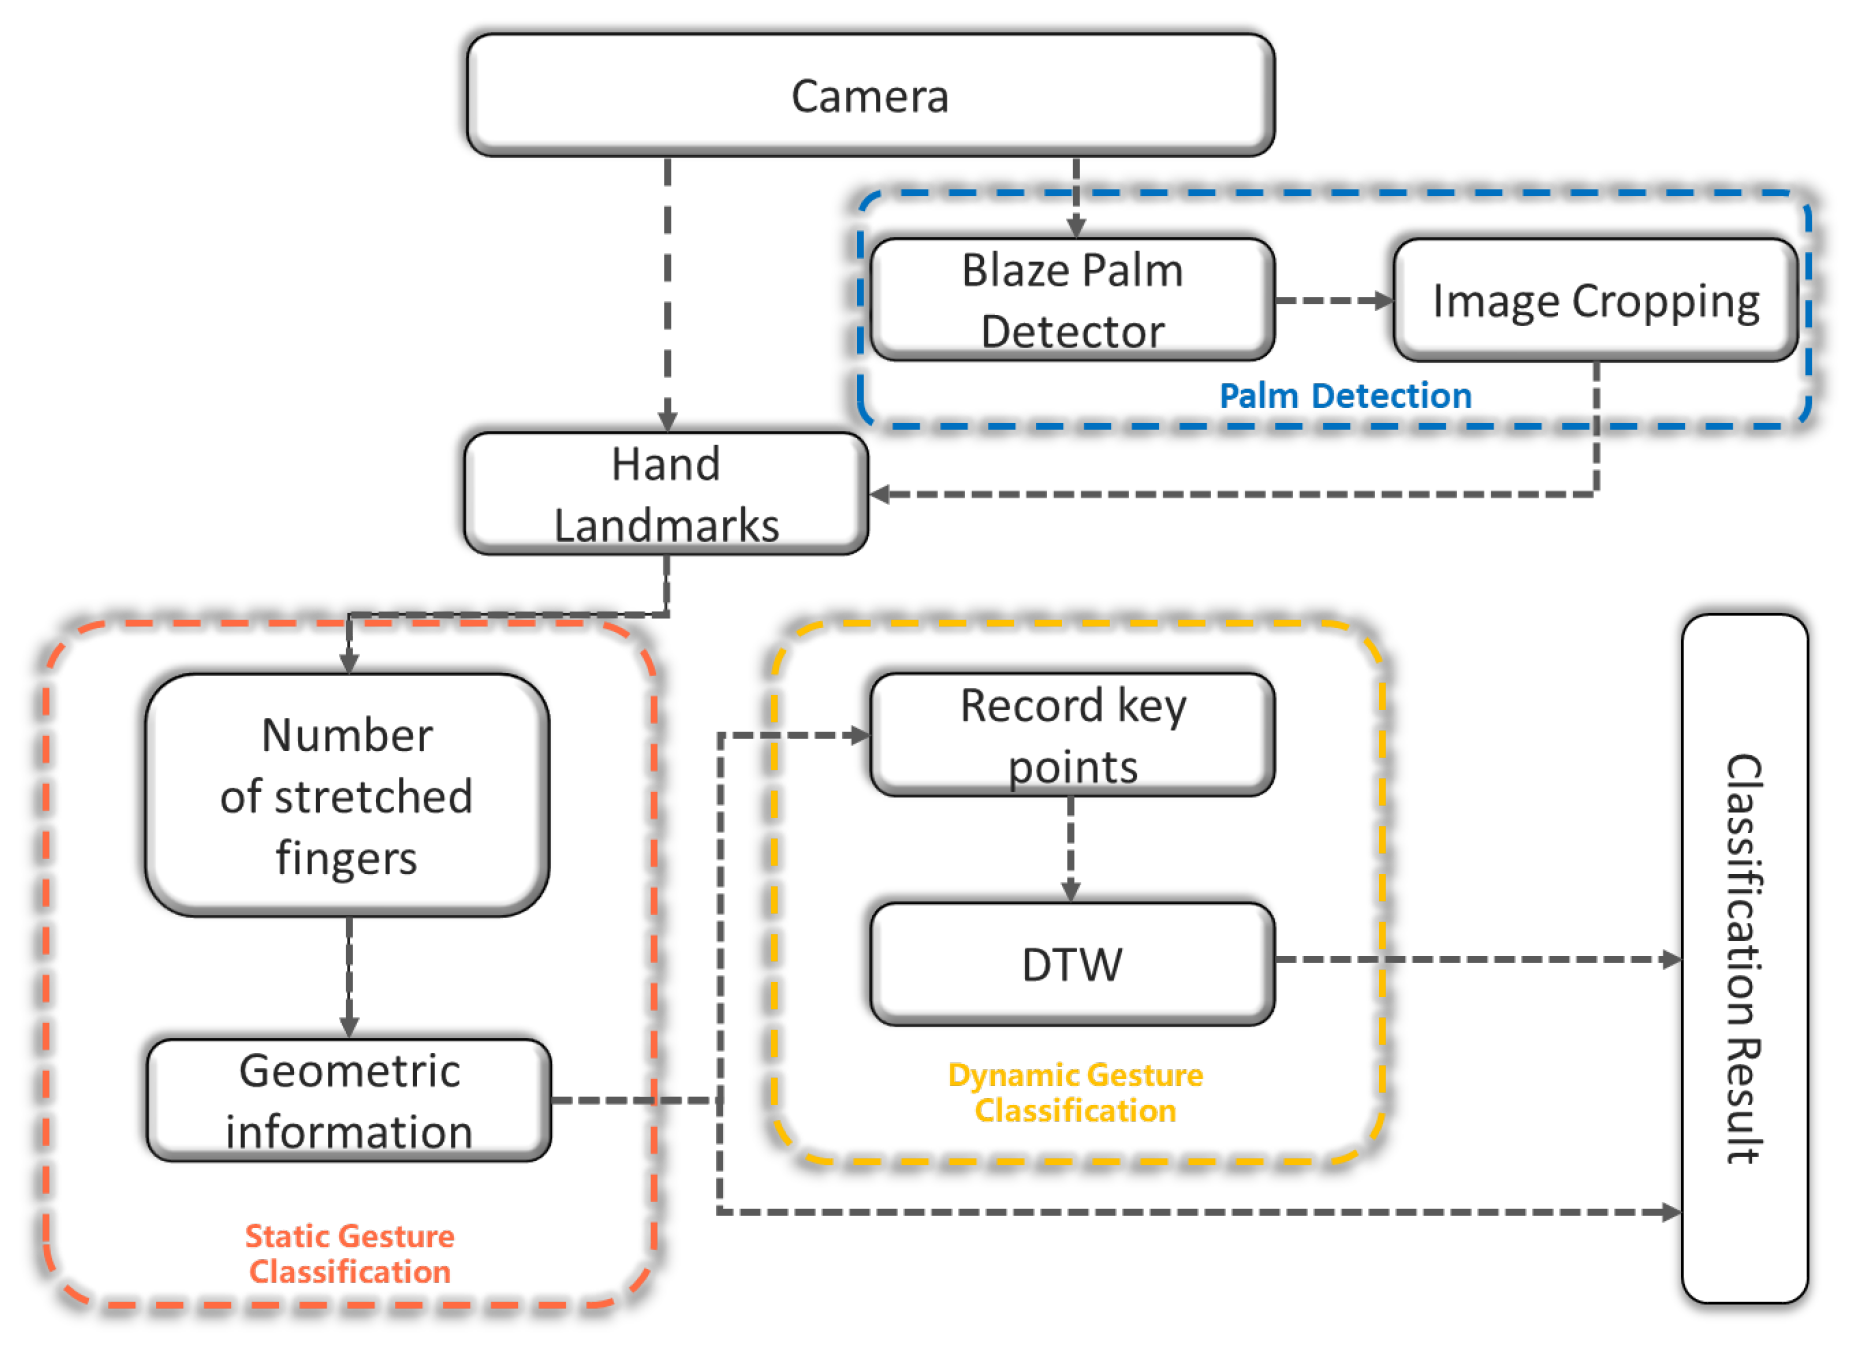
3.1. In-Air Gesture Recognition Framework
3.2. User Study
3.3. System Design
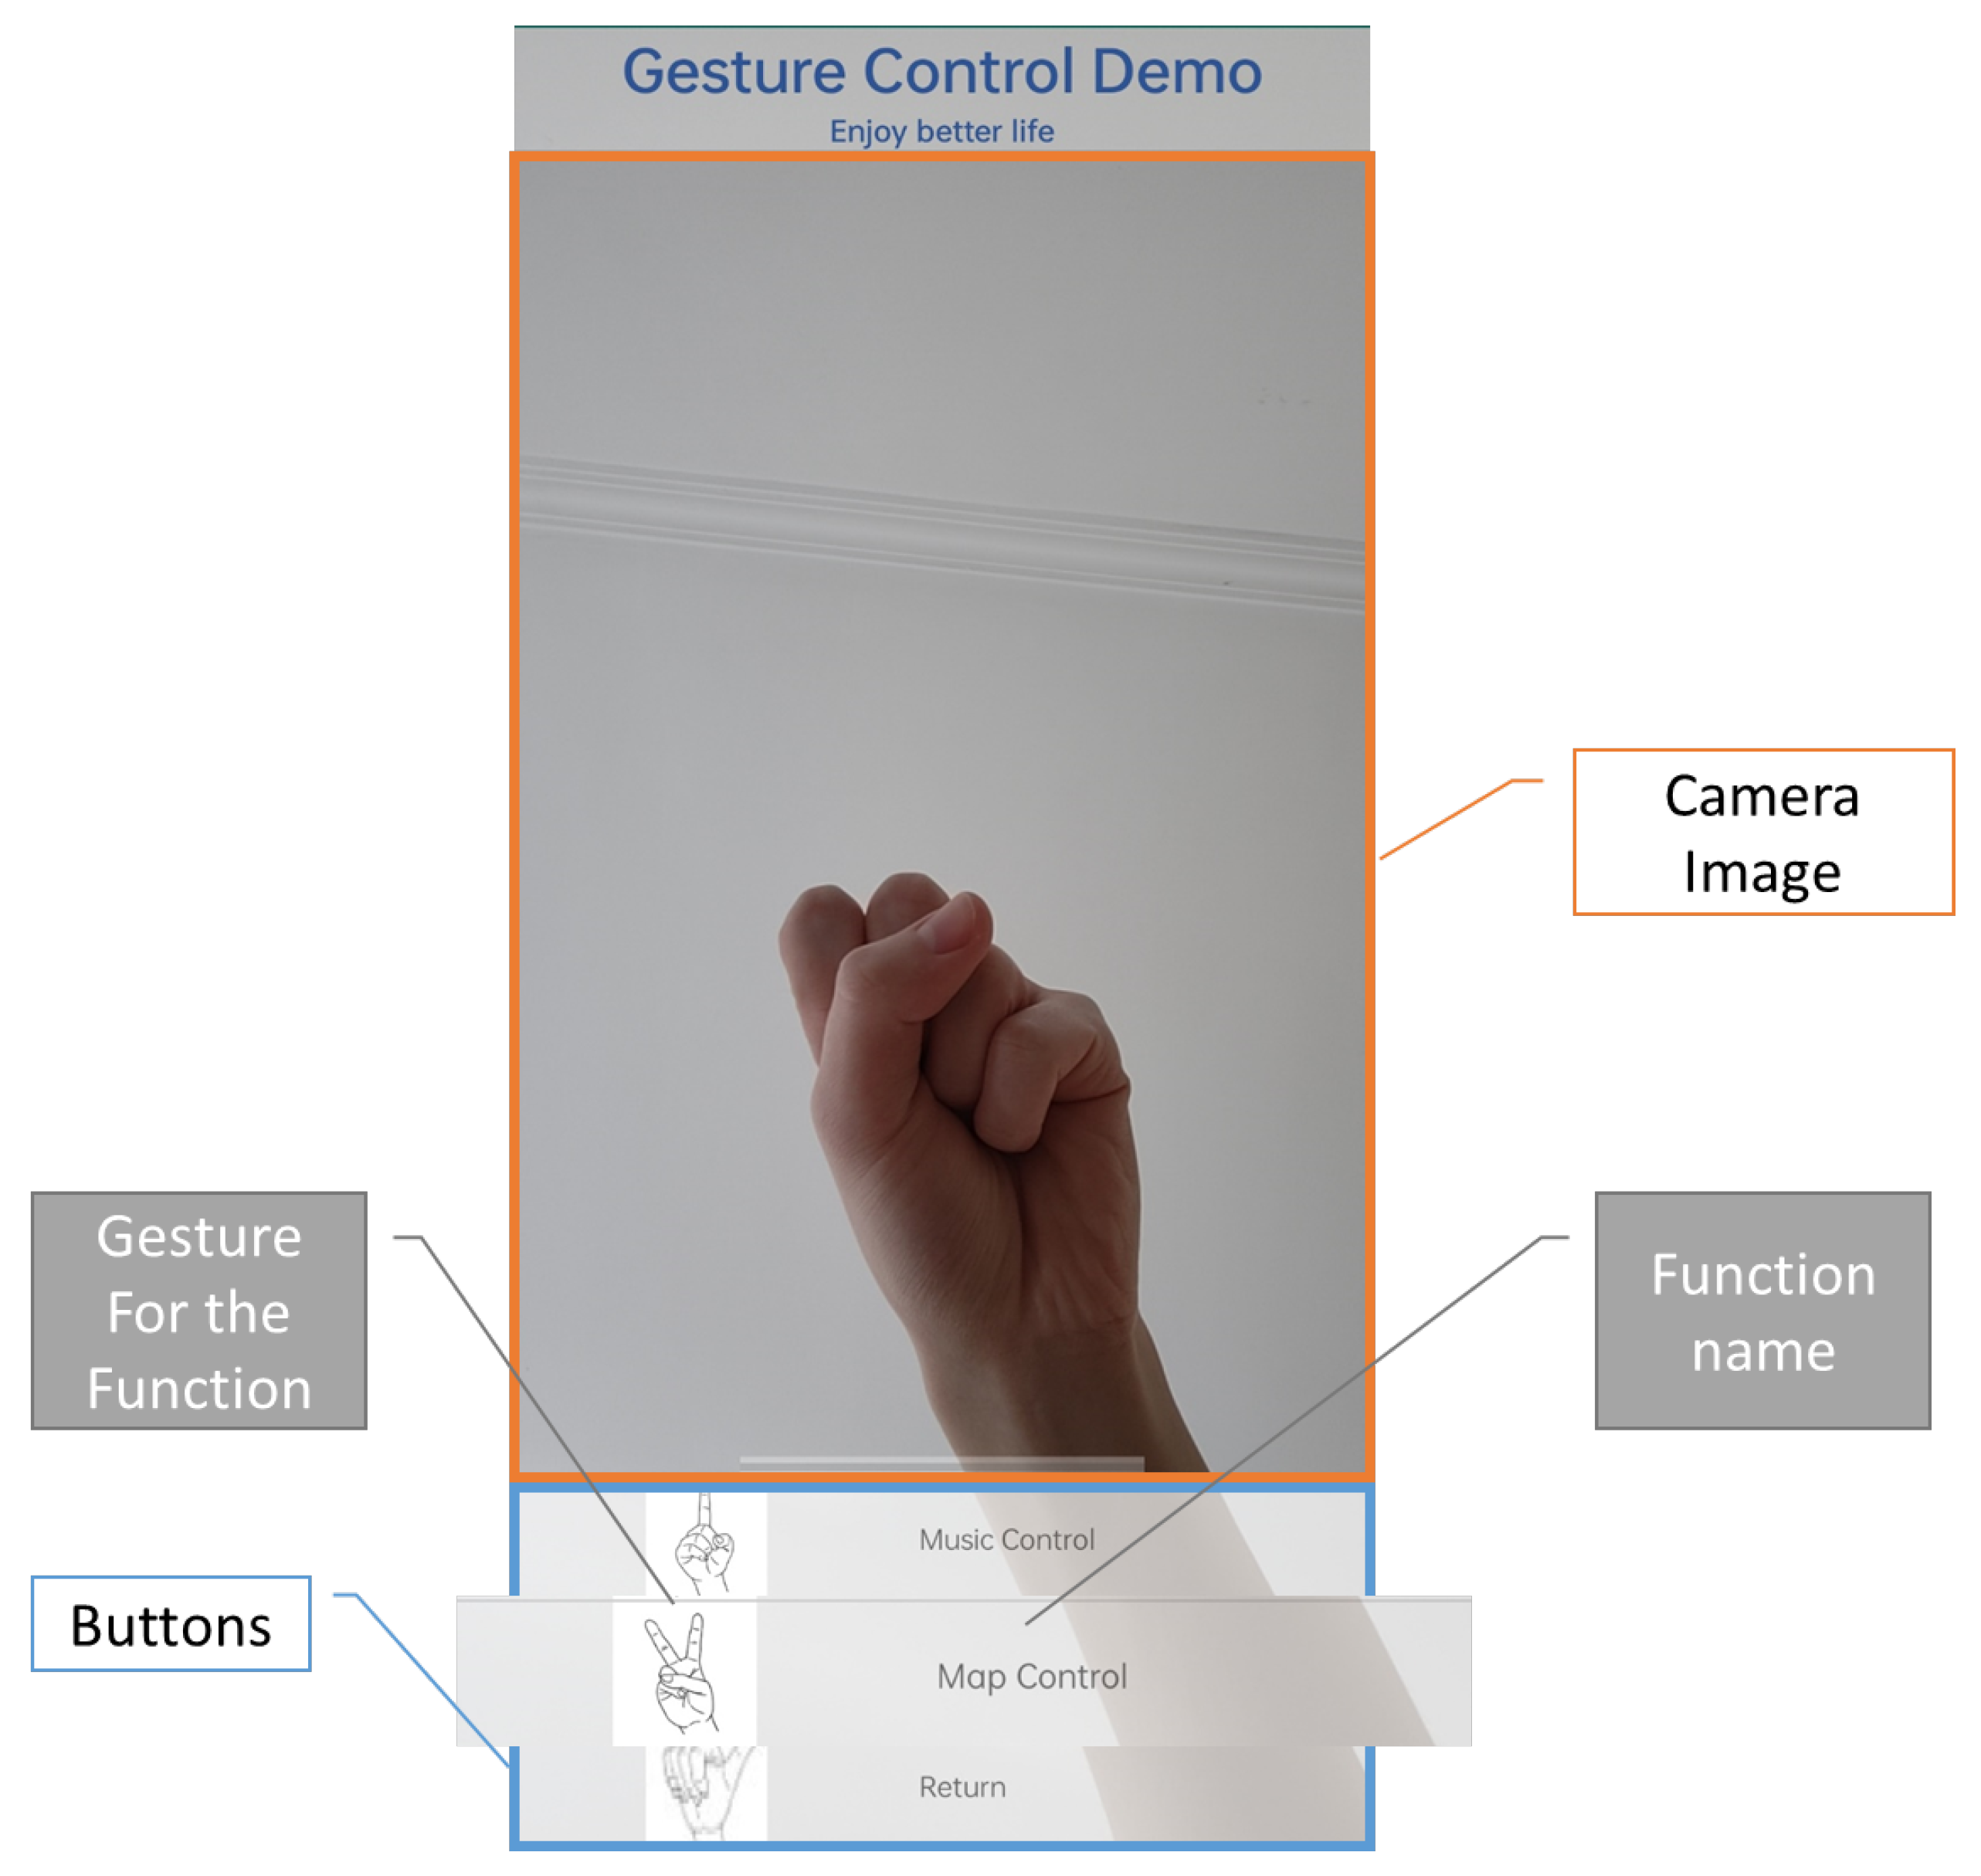
3.3.1. System Function
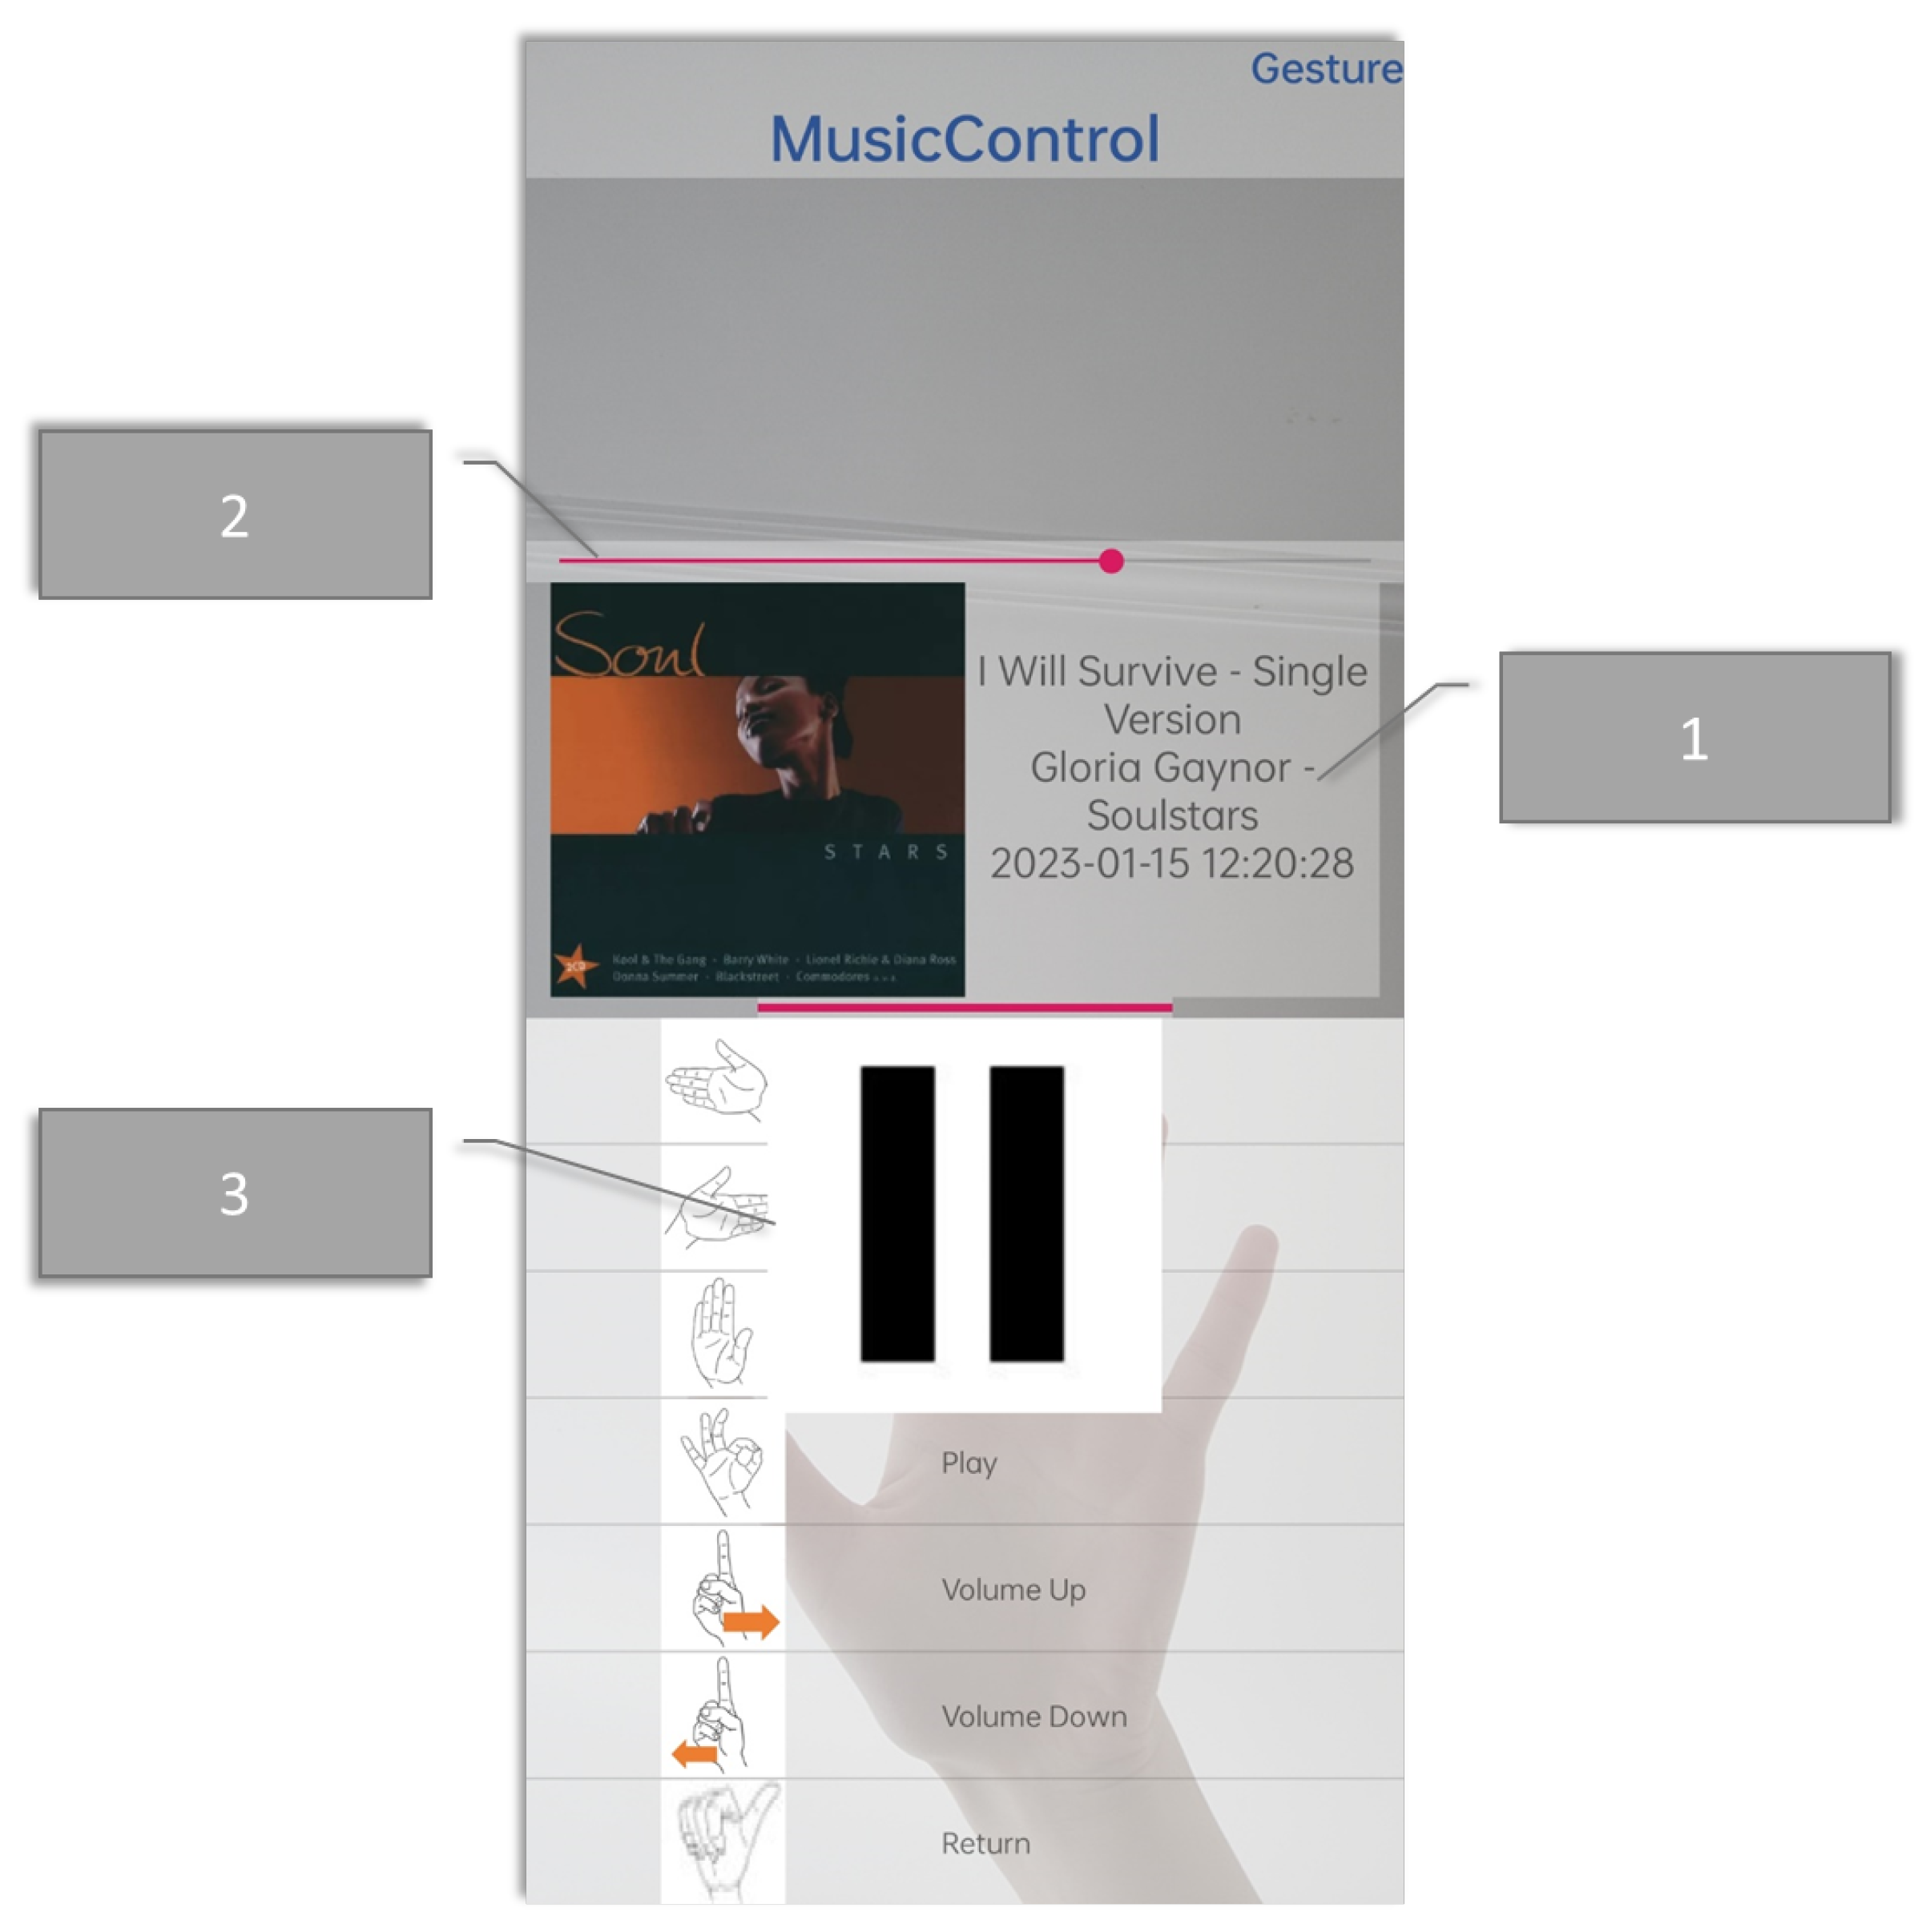
- Music control: This section includes music playback, pausing, volume adjustment, and song switching.
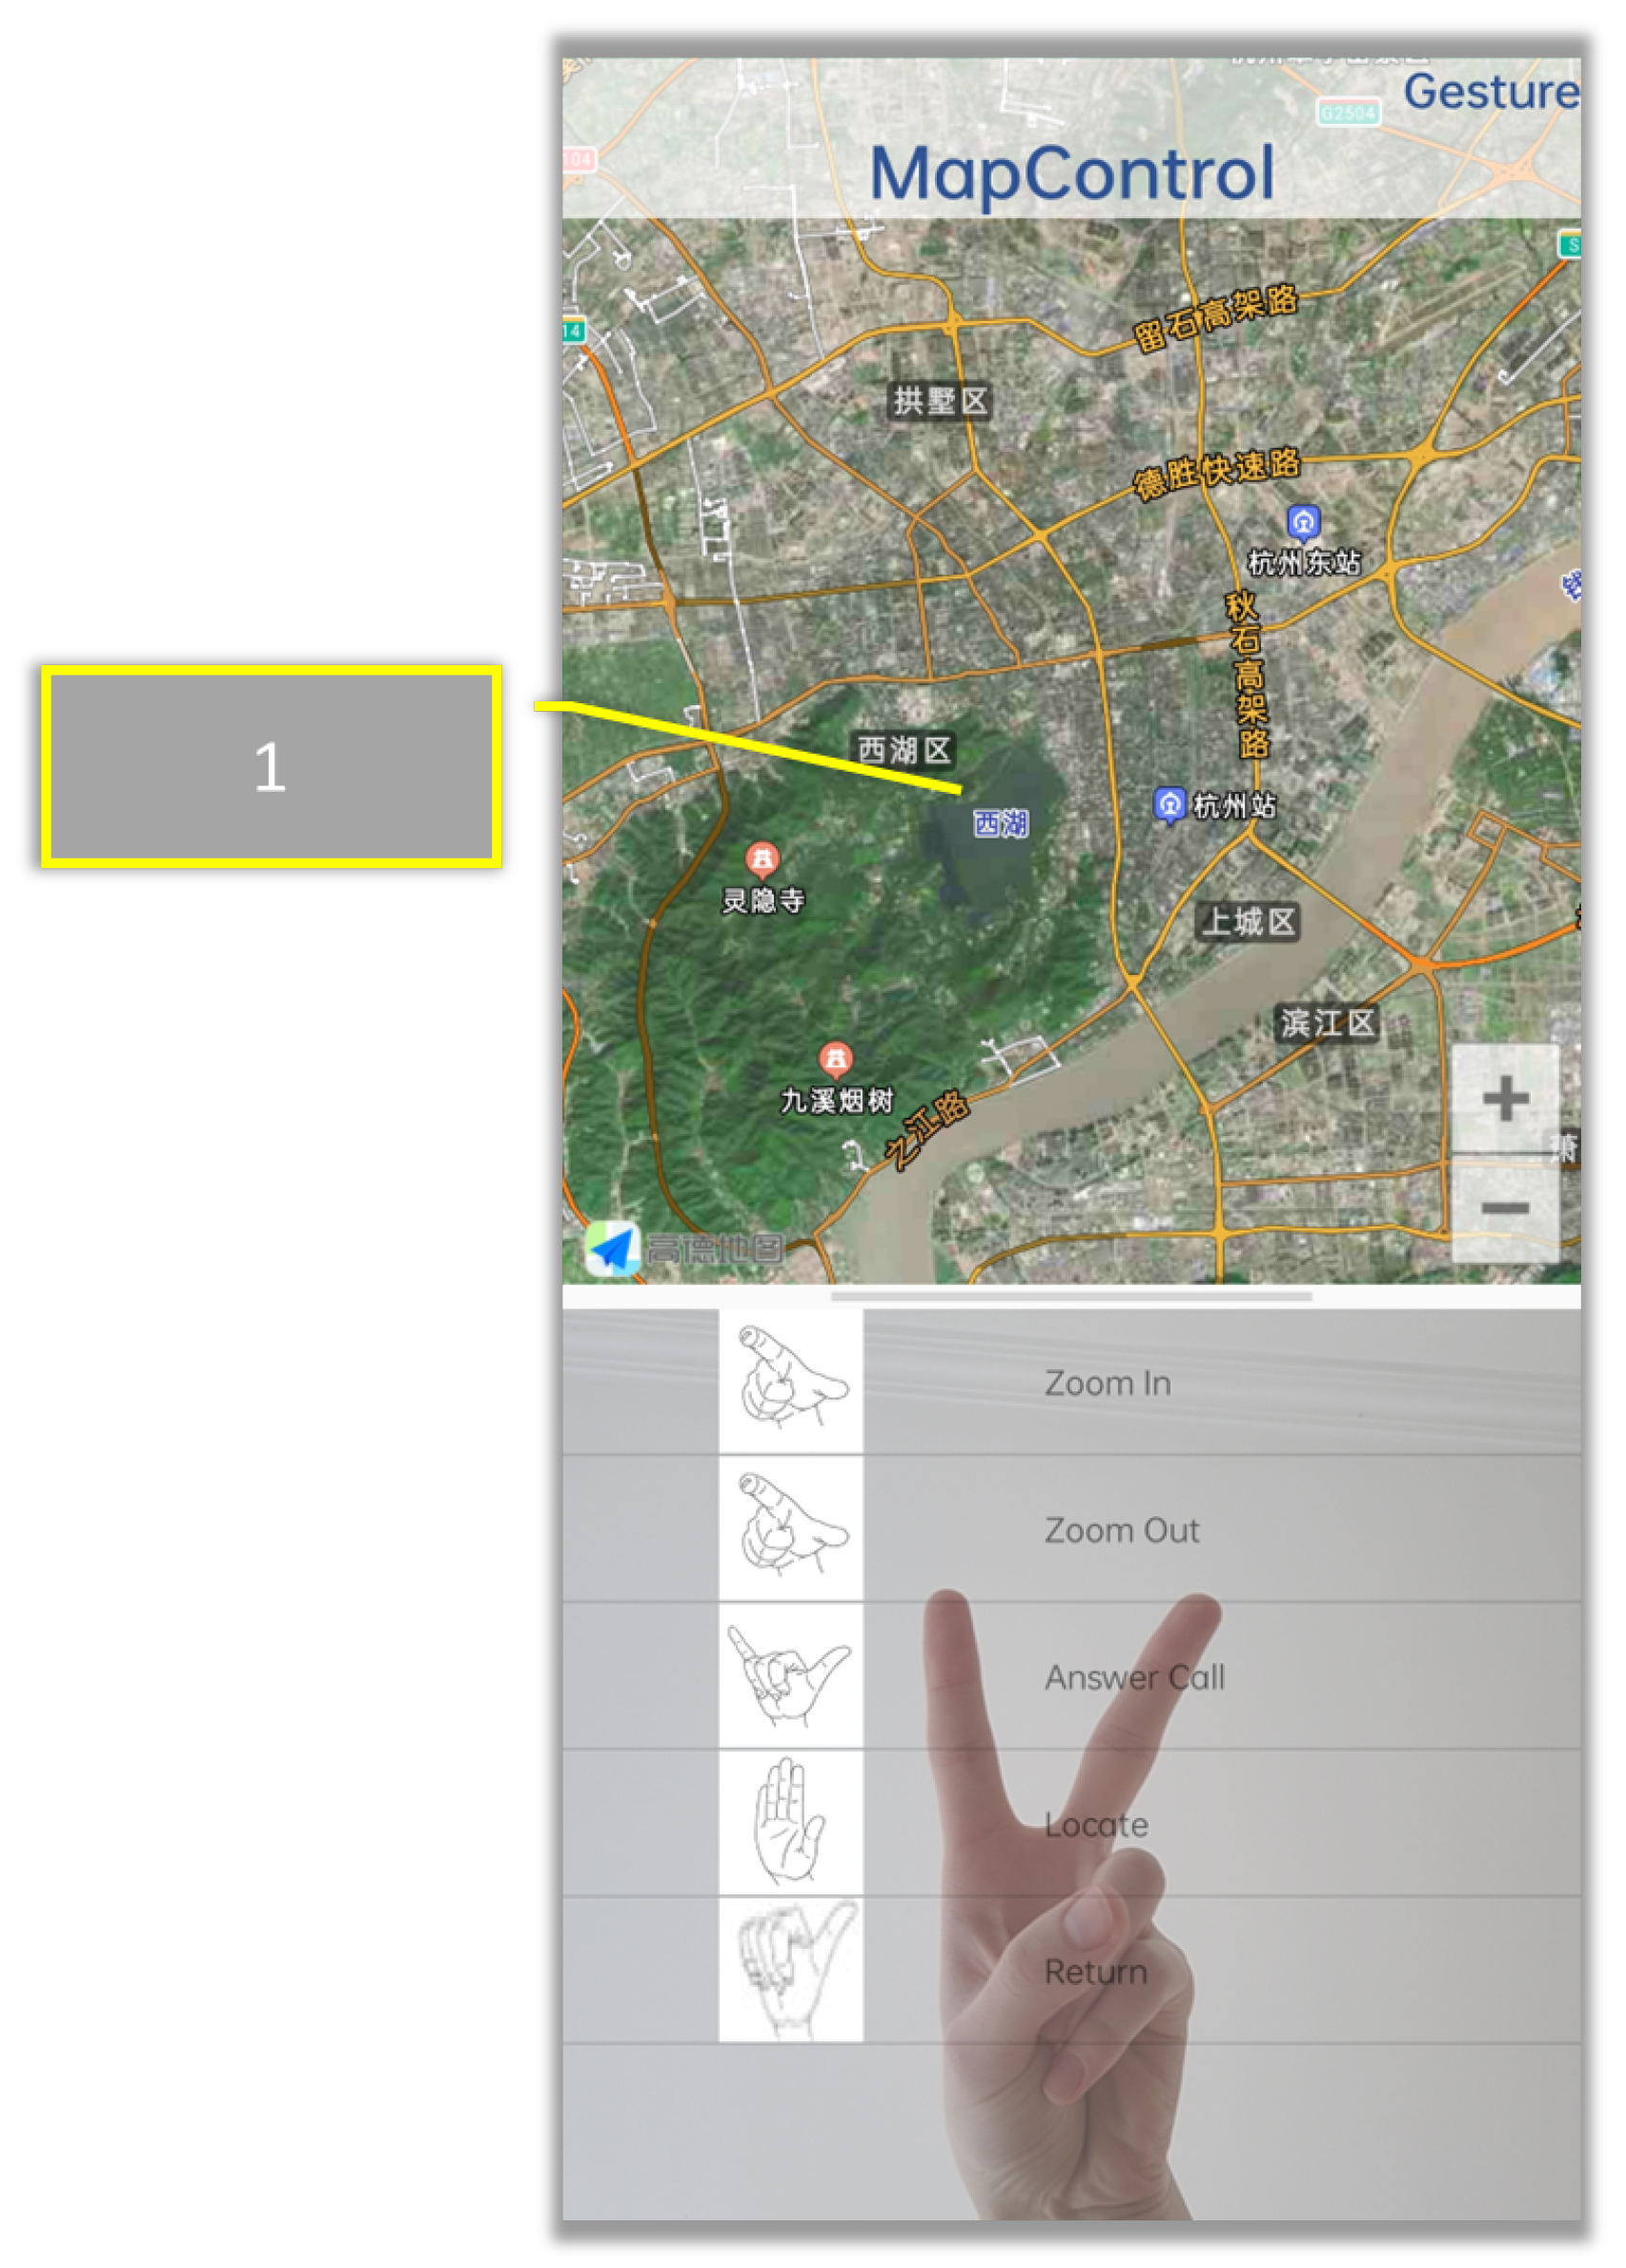
- Map control: This section includes map movement, zooming, and positioning.
- Call answering: This section includes answering and hanging up mobile phone calls.
3.3.2. Interface Design
3.4. Experiment Design
3.4.1. Experimental Environment Preparation
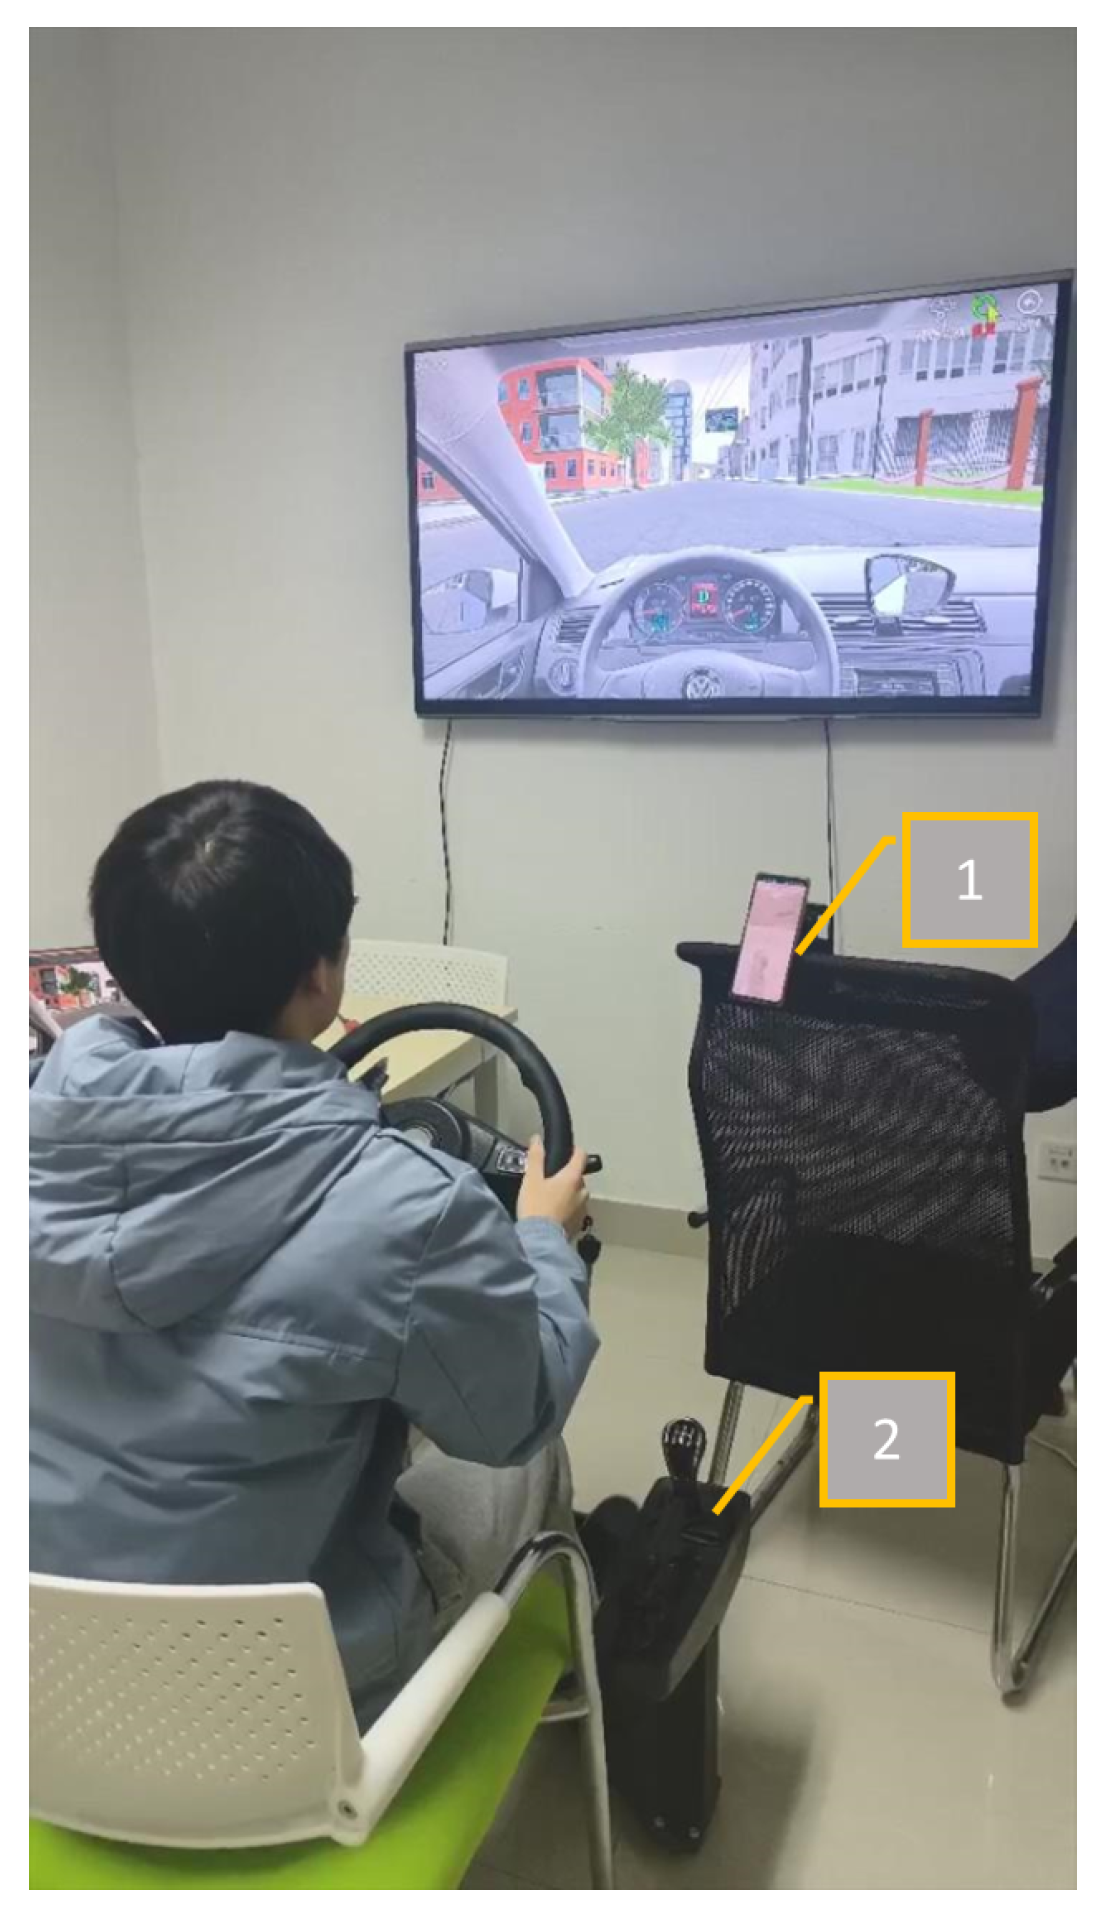
Participants
Driving Simulation Environment
3.4.2. Experiment 1: Find the Most Appropriate Gesture
Experiment Design
Procedure
- The experimenter proposed a preliminary set of gestures based on driver suggestions and personal experience.
- The experimenter added all the gestures in the collection to the application designed in the experiment preparation.
- Each test subject was invited to complete experimental tasks on a driving simulator. The tasks required the test subjects to make gestures corresponding to the number given by the experimenter. However, prior to the experiment, each test subject underwent a warm-up drive and familiarized themselves with the number corresponding to each gesture and the action of the gesture. The application recorded the time taken for each test subject to perform each gesture correctly during the experiment.
- After completing the test, each test subject completed a questionnaire to indicate their preference for different gestures.
- The experimenters analyzed both objective and subjective indicators and selected the gestures with the highest scores.
3.4.3. Experiment 2: Comparative Experiments
Experiment Design
Procedure
- Incorporate the gesture set identified in Experiment 1 into the application to be used in the experiment.
- Warm-up driving: Prior to the actual experiment, participants must drive in the simulation environment to familiarize themselves with the driving simulator, the software’s simulated road conditions, and all system functions. They must also be able to use touch and gestures to complete system tasks.
- Participants begin the interface test, using both touch and gesture interaction methods to manipulate all tasks in the IVIS system. The order in which each interaction method is used is randomized, and a 15-minute break is required between experiments using the two interaction methods to eliminate the potential influence of the interaction method order on experimental results. To ensure driving safety, participants are required to hold the steering wheel with their left hand and control the task with their right hand when performing manipulation tasks.
- Record the driving violations and task completion times for each participant during the test.
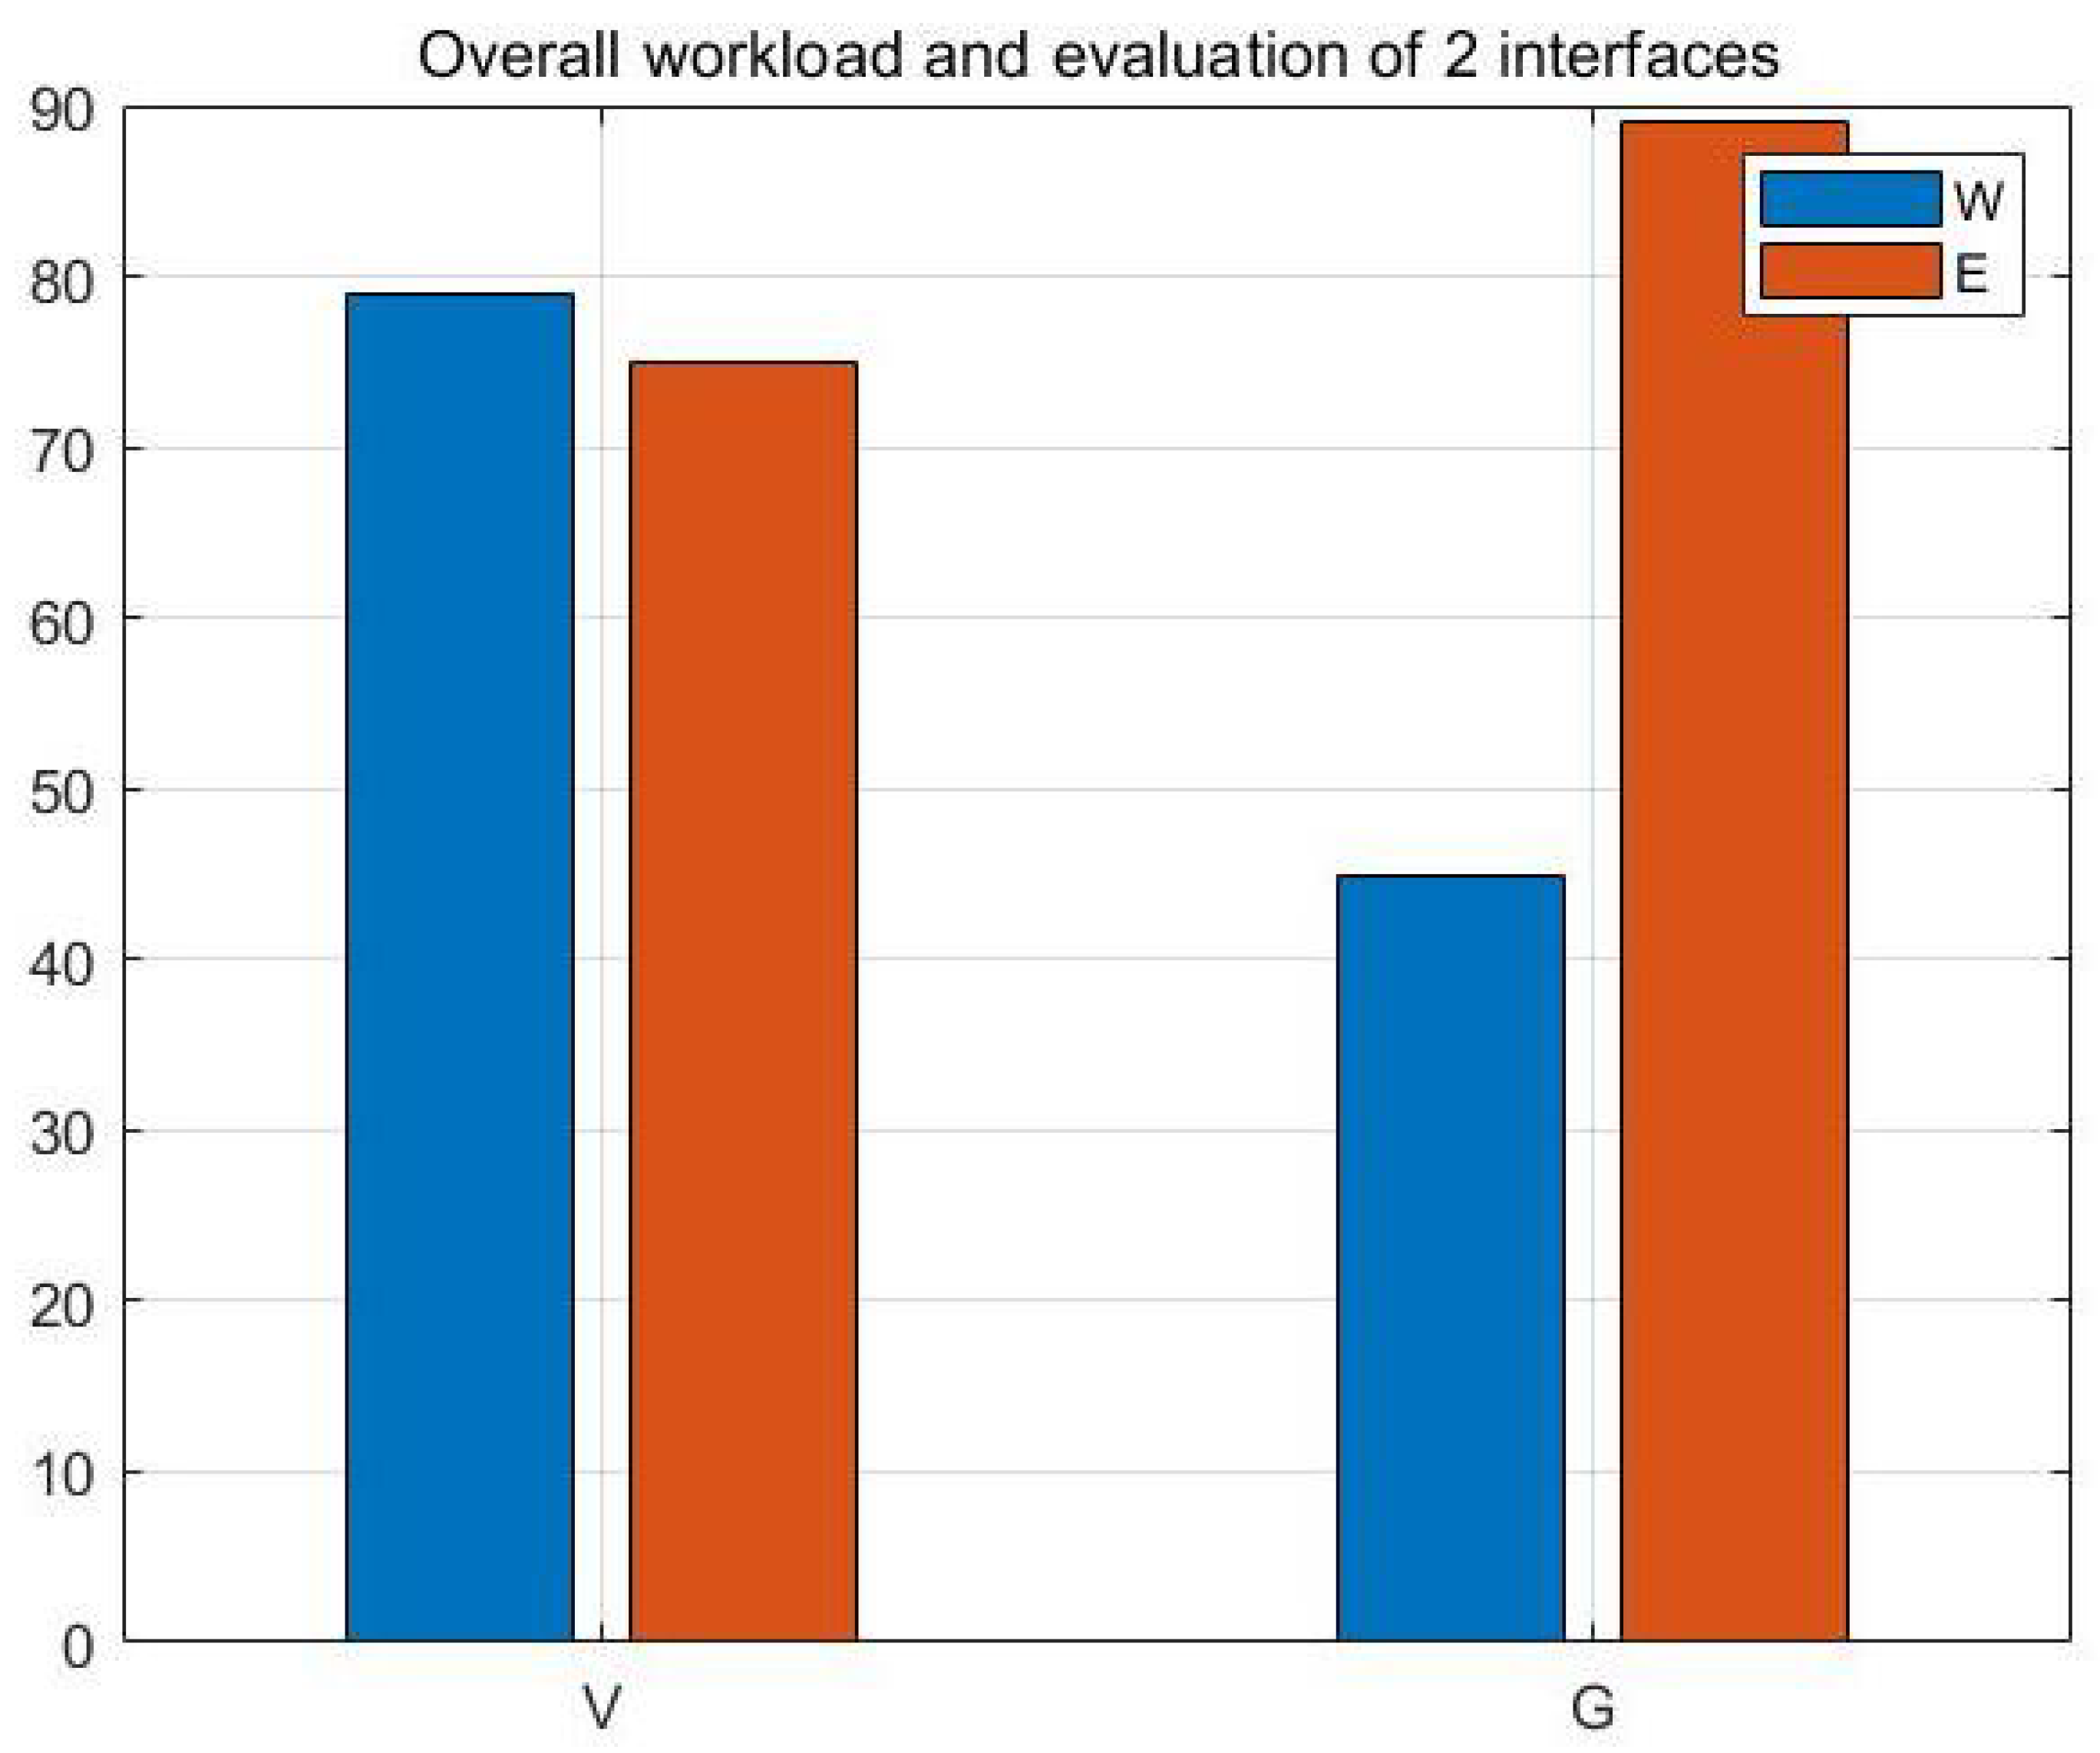
- After completing the test, collect subjective evaluations from participants. Participants will complete a NASA TLX stress load test and a questionnaire on their interaction preferences.
4. Result and Interpretation
4.1. Experiment 1
4.1.1. Camera Positioning
4.1.2. Selection of the Most Suitable Gesture
4.1.3. Effects of Handedness
4.2. Experiment 2
4.2.1. Primary Mission

4.2.2. Secondary Mission
4.2.3. Subjective Evaluation
5. Discussion
5.1. Camera Positioning
5.2. Determination of the Most Suitable Gesture
5.3. Analysis of Interruption Caused by Gesture Interface
5.3.1. Primary Mission
5.3.2. Secondary Mission
5.3.3. Subjective Evaluation
6. Conclusions
Author Contributions
Funding
Data Availability Statement
Conflicts of Interest
References
- Bilius, L.B.; Vatavu, R.D. A synopsis of input modalities for in-vehicle infotainment and consumption of interactive media. In Proceedings of the ACM International Conference on Interactive Media Experiences, Barcelona, Spain, 17–19 June 2020; pp. 195–199. [Google Scholar]
- Ba h, K.M.; Jæger, M.G.; Skov, M.B.; Thomassen, N.G. You can touch, but you can’t look: Interacting with in-vehicle systems. In Proceedings of the SIGCHI Conference on Human Factors in Computing Systems, Florence, Italy, 5–10 April 2008; pp. 1139–1148. [Google Scholar]
- Oviedo-Trespalacios, O.; Nandavar, S.; Haworth, N. How do perceptions of risk and other psychological factors influence the use of in-vehicle information systems (IVIS)? Transp. Res. Part F Traffic Psychol. Behav. 2019, 67, 113–122. [Google Scholar] [CrossRef]
- Bulej, L.; Bureš, T.; Hnětynka, P.; Čamra, V.; Siegl, P.; Töpfer, M. IVIS: Highly customizable framework for visualization and processing of IoT data. In Proceedings of the 2020 46th Euromicro Conference on Software Engineering and Advanced Applications (SEAA), Portoroz, Slovenia, 26–28 August 2020; pp. 585–588. [Google Scholar]
- Kong, X.; Wu, Y.; Wang, H.; Xia, F. Edge Computing for Internet of Everything: A Survey. IEEE Internet Things J. 2022, 9, 23472–23485. [Google Scholar] [CrossRef]
- Ryumin, D.; Kagirov, I.; Ivanko, D.; Axyonov, A.; Karpov, A. Automatic detection and recognition of 3d manual gestures for human-machine interaction. Int. Arch. Photogramm. Remote. Sens. Spat. Inf. Sci. 2019, XLII-2/W12, 179–183. [Google Scholar] [CrossRef]
- Jiang, S.; Sun, B.; Wang, L.; Bai, Y.; Li, K.; Fu, Y. Skeleton aware multi-modal sign language recognition. In Proceedings of the IEEE/CVF Conference on Computer Vision and Pattern Recognition, Nashville, TN, USA, 20–25 June 2021; pp. 3413–3423. [Google Scholar]
- Ryumin, D.; Ivanko, D.; Ryumina, E. Audio-Visual Speech and Gesture Recognition by Sensors of Mobile Devices. Sensors 2023, 23, 2284. [Google Scholar] [CrossRef]
- Wu, Y.; Zheng, B.; Zhao, Y. Dynamic gesture recognition based on LSTM-CNN. In Proceedings of the 2018 Chinese Automation Congress (CAC), Xi’an, China, 30 November–2 December 2018; pp. 2446–2450. [Google Scholar]
- Kagirov, I.; Ryumin, D.; Axyonov, A. Method for multimodal recognition of one-handed sign language gestures through 3D convolution and LSTM neural networks. In Proceedings of the Speech and Computer: 21st International Conference, SPECOM 2019, Istanbul, Turkey, 20–25 August 2019; Springer: Berlin/Heidelberg, Germany, 2019; pp. 191–200. [Google Scholar]
- Prabhakar, G.; Rajkhowa, P.; Harsha, D.; Biswas, P. A wearable virtual touch system for IVIS in cars. J. Multimodal User Interfaces 2022, 16, 87–106. [Google Scholar] [CrossRef]
- Suh, Y.; Ferris, T.K. On-road evaluation of in-vehicle interface characteristics and their effects on performance of visual detection on the road and manual entry. Hum. Factors 2019, 61, 105–118. [Google Scholar] [CrossRef]
- Kong, X.; Duan, G.; Hou, M.; Shen, G.; Wang, H.; Yan, X.; Collotta, M. Deep Reinforcement Learning-Based Energy-Efficient Edge Computing for Internet of Vehicles. IEEE Trans. Ind. Inform. 2022, 18, 6308–6316. [Google Scholar] [CrossRef]
- Ma, P.; Wang, Y.; Petridis, S.; Shen, J.; Pantic, M. Training strategies for improved lip-reading. In Proceedings of the ICASSP 2022—2022 IEEE International Conference on Acoustics, Speech and Signal Processing (ICASSP), Singapore, 22–27 May 2022; pp. 8472–8476. [Google Scholar]
- Ivanko, D.; Ryumin, D.; Kashevnik, A.; Axyonov, A.; Karnov, A. Visual Speech Recognition in a Driver Assistance System. In Proceedings of the 2022 30th European Signal Processing Conference (EUSIPCO), Belgrade, Serbia, 29 August–2 September 2022; pp. 1131–1135. [Google Scholar]
- Kim, M.; Yeo, J.H.; Ro, Y.M. Distinguishing homophenes using multi-head visual-audio memory for lip reading. In Proceedings of the AAAI Conference on Artificial Intelligence, Virtual Event, 22 February–1 March 2022; Volume 36, pp. 1174–1182. [Google Scholar]
- Moon, G.; Yu, S.I.; Wen, H.; Shiratori, T.; Lee, K.M. Interhand2. 6m: A dataset and baseline for 3d interacting hand pose estimation from a single rgb image. In Proceedings of the Computer Vision—ECCV 2020: 16th European Conference, Glasgow, UK, 23–28 August 2020; Springer: Berlin/Heidelberg, Germany, 2020; pp. 548–564. [Google Scholar]
- Sincan, O.M.; Keles, H.Y. Autsl: A large scale multi-modal turkish sign language dataset and baseline methods. IEEE Access 2020, 8, 181340–181355. [Google Scholar] [CrossRef]
- Li, D.; Rodriguez, C.; Yu, X.; Li, H. Word-level deep sign language recognition from video: A new large-scale dataset and methods comparison. In Proceedings of the IEEE/CVF Winter Conference on Applications of Computer Vision, Snowmass Village, CO, USA, 1–5 March 2020; pp. 1459–1469. [Google Scholar]
- Escalera, S.; Gonzàlez, J.; Baró, X.; Reyes, M.; Lopes, O.; Guyon, I.; Athitsos, V.; Escalante, H. Multi-modal gesture recognition challenge 2013: Dataset and results. In Proceedings of the 15th ACM on International Conference on Multimodal Interaction, Sydney, Australia, 9–13 December 2013; pp. 445–452. [Google Scholar]
- Ronchetti, F.; Quiroga, F.; Estrebou, C.; Lanzarini, L.; Rosete, A. LSA64: A Dataset of Argentinian Sign Language. In Proceedings of the XX II Congreso Argentino de Ciencias de la Computación (CACIC), San Luis, Argentina, 3–5 October 2016. [Google Scholar]
- Joze, H.R.V.; Koller, O. Ms-asl: A large-scale data set and benchmark for understanding american sign language. arXiv 2018, arXiv:1812.01053. [Google Scholar]
- Tang, H.; Liu, H.; Xiao, W.; Sebe, N. Fast and robust dynamic hand gesture recognition via key frames extraction and feature fusion. Neurocomputing 2019, 331, 424–433. [Google Scholar] [CrossRef]
- Sagayam, K.M.; Hemanth, D.J.; Vasanth, X.A.; Henesy, L.E.; Ho, C.C. Optimization of a HMM-based hand gesture recognition system using a hybrid cuckoo search algorithm. In Hybrid Metaheuristics for Image Analysis; Springer: Berlin/Heidelberg, Germany, 2018; pp. 87–114. [Google Scholar]
- Yu, J.; Qin, M.; Zhou, S. Dynamic gesture recognition based on 2D convolutional neural network and feature fusion. Sci. Rep. 2022, 12, 4345. [Google Scholar] [CrossRef] [PubMed]
- Lee, S.K.; Kim, J.H. Air-Text: Air-Writing and Recognition System. In Proceedings of the 29th ACM International Conference on Multimedia, Virtual Event, Chengdu, China, 20–24 October 2021; pp. 1267–1274. [Google Scholar]
- Zhang, F.; Bazarevsky, V.; Vakunov, A.; Tkachenka, A.; Sung, G.; Chang, C.L.; Grundmann, M. Mediapipe hands: On-device real-time hand tracking. arXiv 2020, arXiv:2006.10214. [Google Scholar]
- Dadashzadeh, A.; Targhi, A.T.; Tahmasbi, M.; Mirmehdi, M. HGR-Net: A fusion network for hand gesture segmentation and recognition. IET Comput. Vis. 2019, 13, 700–707. [Google Scholar] [CrossRef]
- Guo, F.; He, Z.; Zhang, S.; Zhao, X.; Fang, J.; Tan, J. Normalized edge convolutional networks for skeleton-based hand gesture recognition. Pattern Recognit. 2021, 118, 108044. [Google Scholar] [CrossRef]
- Novopoltsev, M.; Verkhovtsev, L.; Murtazin, R.; Milevich, D.; Zemtsova, I. Fine-tuning of sign language recognition models: A technical report. arXiv 2023, arXiv:2302.07693. [Google Scholar]
- De Coster, M.; Van Herreweghe, M.; Dambre, J. Isolated sign recognition from rgb video using pose flow and self-attention. In Proceedings of the IEEE/CVF Conference on Computer Vision and Pattern Recognition, Nashville, TN, USA, 20–25 June 2021; pp. 3441–3450. [Google Scholar]
- Zha, Z.; Yuan, X.; Wen, B.; Zhou, J.; Zhang, J.; Zhu, C. From rank estimation to rank approximation: Rank residual constraint for image restoration. IEEE Trans. Image Process. 2019, 29, 3254–3269. [Google Scholar] [CrossRef]
- Zha, Z.; Yuan, X.; Zhou, J.; Zhu, C.; Wen, B. Image restoration via simultaneous nonlocal self-similarity priors. IEEE Trans. Image Process. 2020, 29, 8561–8576. [Google Scholar] [CrossRef]
- Zha, Z.; Yuan, X.; Wen, B.; Zhang, J.; Zhou, J.; Zhu, C. Image restoration using joint patch-group-based sparse representation. IEEE Trans. Image Process. 2020, 29, 7735–7750. [Google Scholar] [CrossRef]
- Grahn, H.; Kujala, T. Impacts of touch screen size, user interface design, and subtask boundaries on in-car task’s visual demand and driver distraction. Int. J. Hum.-Comput. Stud. 2020, 142, 102467. [Google Scholar] [CrossRef]
- Vaezipour, A.; Rakotonirainy, A.; Haworth, N.; Delhomme, P. A simulator study of the effect of incentive on adoption and effectiveness of an in-vehicle human machine interface. Transp. Res. Part F Traffic Psychol. Behav. 2019, 60, 383–398. [Google Scholar] [CrossRef]
- Jung, J.; Lee, S.; Hong, J.; Youn, E.; Lee, G. Voice+ tactile: Augmenting in-vehicle voice user interface with tactile touchpad interaction. In Proceedings of the 2020 CHI Conference on Human Factors in Computing Systems, Honolulu, HI, USA, 25–30 April 2020; pp. 1–12. [Google Scholar]
- Kong, X.; Zhu, B.; Shen, G.; Workneh, T.C.; Ji, Z.; Chen, Y.; Liu, Z. Spatial-Temporal-Cost Combination Based Taxi Driving Fraud Detection for Collaborative Internet of Vehicles. IEEE Trans. Ind. Inform. 2022, 18, 3426–3436. [Google Scholar] [CrossRef]
- Gupta, S.; Bagga, S.; Sharma, D.K. Hand Gesture Recognition for Human Computer Interaction and Its Applications in Virtual Reality. In Advanced Computational Intelligence Techniques for Virtual Reality in Healthcare; Springer: Berlin/Heidelberg, Germany, 2020; pp. 85–105. [Google Scholar]
- Wong, A. NetScore: Towards universal metrics for large-scale performance analysis of deep neural networks for practical on-device edge usage. In Proceedings of the Image Analysis and Recognition: 16th International Conference, ICIAR 2019, Waterloo, ON, Canada, 27–29 August 2019; Springer: Berlin/Heidelberg, Germany, 2019; pp. 15–26. [Google Scholar]
- Roider, F.; Raab, K. Implementation and evaluation of peripheral light feedback for mid-air gesture interaction in the car. In Proceedings of the 2018 14th International Conference on Intelligent Environments (IE), Rome, Italy, 25–28 June 2018; pp. 87–90. [Google Scholar]
- Truschin, S.; Schermann, M.; Goswami, S.; Krcmar, H. Designing interfaces for multiple-goal environments: Experimental insights from in-vehicle speech interfaces. ACM Trans. Comput.-Hum. Interact. (TOCHI) 2014, 21, 1–24. [Google Scholar] [CrossRef]
- Kong, X.; Chen, Q.; Hou, M.; Rahim, A.; Ma, K.; Xia, F. RMGen: A Tri-Layer Vehicular Trajectory Data Generation Model Exploring Urban Region Division and Mobility Pattern. IEEE Trans. Veh. Technol. 2022, 71, 9225–9238. [Google Scholar] [CrossRef]
- Sarter, N.B. Multiple-resource theory as a basis for multimodal interface design: Success stories, qualifications, and research needs. In Attention: From Theory to Practice; Oxford University Press: New York, NY, USA, 2007; pp. 187–195. [Google Scholar]
- Li, H.; Wu, L.; Wang, H.; Han, C.; Quan, W.; Zhao, J. Hand gesture recognition enhancement based on spatial fuzzy matching in leap motion. IEEE Trans. Ind. Inform. 2019, 16, 1885–1894. [Google Scholar] [CrossRef]
- Liu, F.; Zeng, W.; Yuan, C.; Wang, Q.; Wang, Y. Kinect-based hand gesture recognition using trajectory information, hand motion dynamics and neural networks. Artif. Intell. Rev. 2019, 52, 563–583. [Google Scholar] [CrossRef]
- Oudah, M.; Al-Naji, A.; Chahl, J. Elderly care based on hand gestures using Kinect sensor. Computers 2020, 10, 5. [Google Scholar] [CrossRef]


| Datasets | Time | Components |
|---|---|---|
| InterHand2.6M [17] | 2020 | 2.6 million frames of hand keypoint annotations, including a total of 1068 hand models. |
| AUTSL [18] | 2020 | A Turkish sign language dataset with 226 signs, comprising 38,336 videos. |
| WLASL [19] | 2019 | An American sign language dataset with over 2000 gestures, containing around 47,000 videos. |
| ChaLearn Pose [20] | 2013 | An Italian gesture collection with information on 20 gestures and other body parts. |
| LSA64 [21] | 2016 | An Argentine sign language collection with 64 gestures, containing 3200 videos. |
| MS-ASL [22] | 2018 | A collection of more than 25,000 real-life American sign language videos. |
| Cambridge Hand Gesture datasets [23,24] | 2007 | A dataset with 9 gestures, containing 900 videos of both static and dynamic gestures. |
| Northwestern University Hand Gesture datasets [23,25] | 2009 | A dataset with 10 gestures, containing 1050 videos under different background conditions. |
| Layers | Input | Output |
|---|---|---|
| Input | Array | |
| Hidden | ||
| Hidden | ||
| Output |
| Layers | Input | Output |
|---|---|---|
| Input | Array | |
| Reshape | ||
| LSTM | ||
| Hidden | ||
| Output |
| Data Set | BP | LSTM | DTW |
|---|---|---|---|
| Cambridge | |||
| Northwestern |
| Recognition Method | Accuracy | GPU Occupancy Rate |
|---|---|---|
| SAM-SLR | ||
| VTN-PF | ||
| Mediapipe+CNN | ||
| Mediapipe+BP | ||
| Mediapipe+DTW |
| Violation | Penalty |
|---|---|
| Speed violation | |
| Below the speed limit | |
| Car stalled | |
| Pressure line | |
| Crash | |
| Changing lanes illegally | |
| Below the speed limit |
| Gesture | Function | Score |
|---|---|---|
 | Enter Music Control | 98 |
 | Enter Map Control | 98 |
 | Return | 96 |
 | Play Music | 95 |
 | Locate | 94 |
 | Answer the Call | 94 |
 | Pause Music | 93 |
 | Drag Map | 93 |
 | Previous Song | 91 |
 | Next Song | 90 |
 | Volume Change | 85 |
 | Zoom Map | 85 |
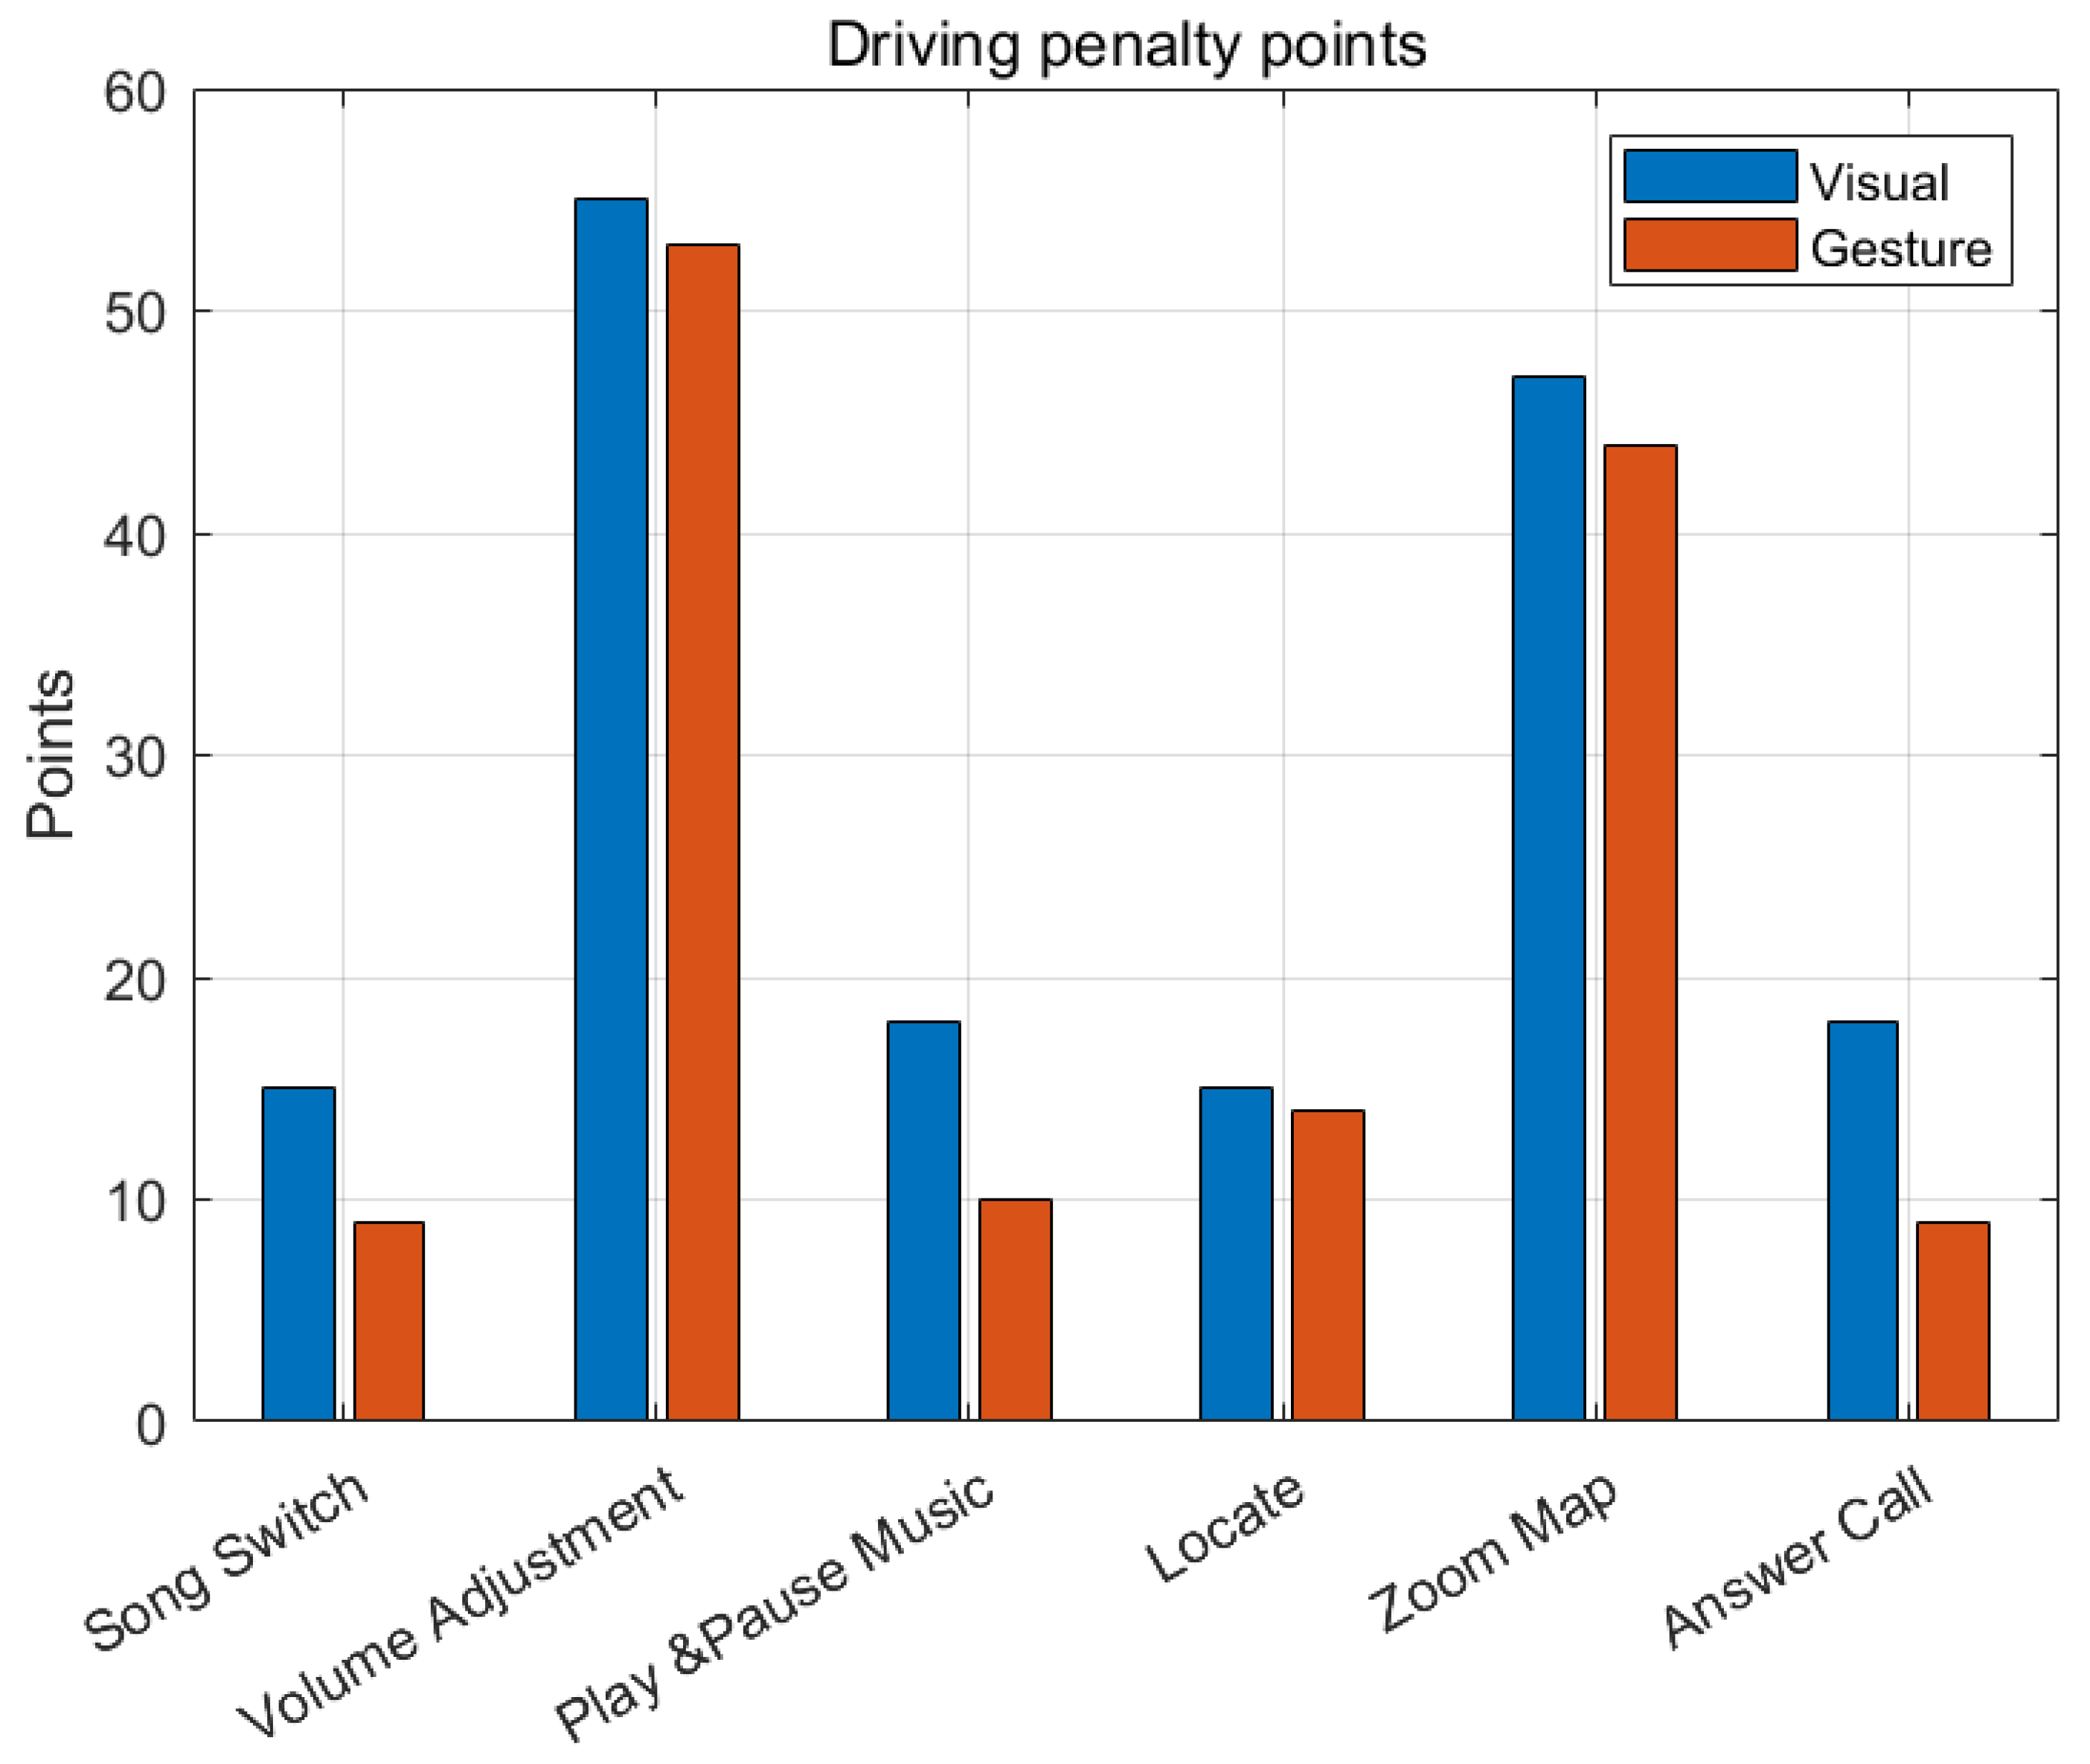
| Interface | ||||||
| V | 15 | 55 | 18 | |||
| G | 9 | 53 | 10 | |||
| Interface | ||||||
| V | 15 | 47 | 18 | |||
| G | 14 | 44 | 9 |
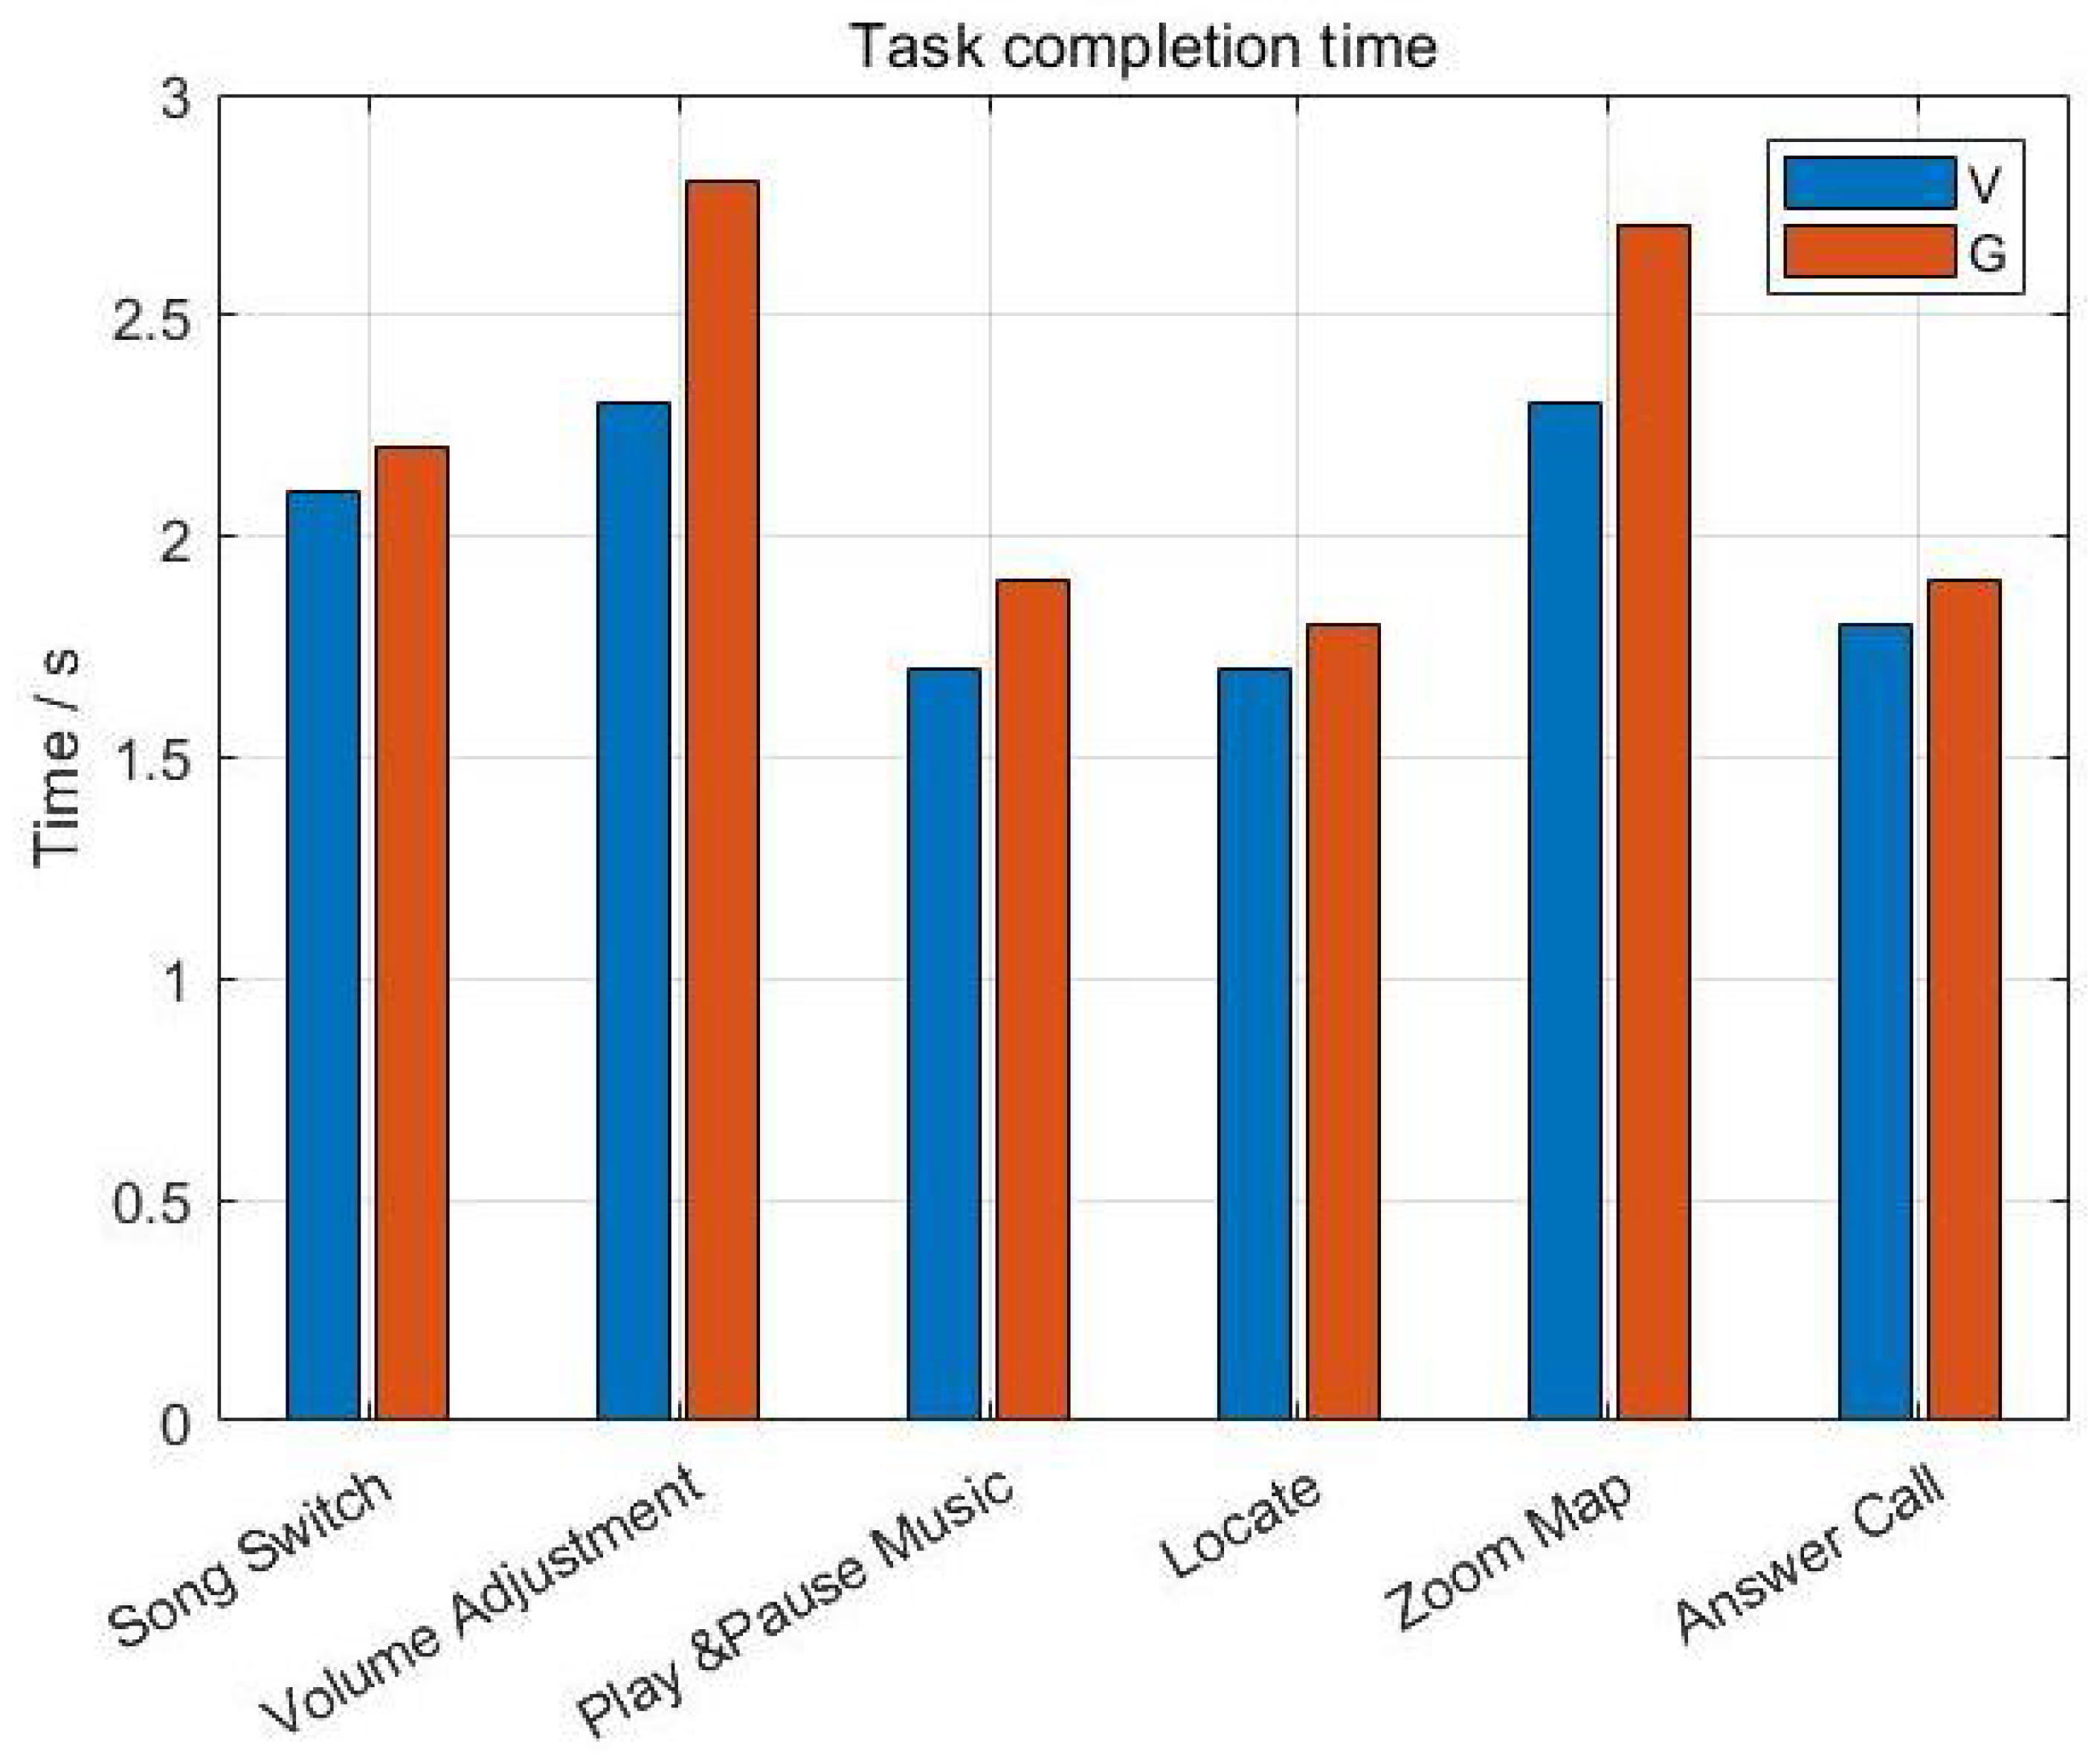
| Interface | ||||||
| V | ||||||
| G | ||||||
| Interface | ||||||
| V | ||||||
| G |
| Interface | ||||||
| V | ||||||
| G | ||||||
| Interface | ||||||
| V | ||||||
| G |
Disclaimer/Publisher’s Note: The statements, opinions and data contained in all publications are solely those of the individual author(s) and contributor(s) and not of MDPI and/or the editor(s). MDPI and/or the editor(s) disclaim responsibility for any injury to people or property resulting from any ideas, methods, instructions or products referred to in the content. |
© 2023 by the authors. Licensee MDPI, Basel, Switzerland. This article is an open access article distributed under the terms and conditions of the Creative Commons Attribution (CC BY) license (https://creativecommons.org/licenses/by/4.0/).
Share and Cite
Cui, C.; Shen, G.; Wang, Y.; Xu, Y.; Du, H.; Zhang, W.; Kong, X. Impact of In-Air Gestures on In-Car Task’s Diver Distraction. Electronics 2023, 12, 1626. https://doi.org/10.3390/electronics12071626
Cui C, Shen G, Wang Y, Xu Y, Du H, Zhang W, Kong X. Impact of In-Air Gestures on In-Car Task’s Diver Distraction. Electronics. 2023; 12(7):1626. https://doi.org/10.3390/electronics12071626
Chicago/Turabian StyleCui, Chengyong, Guojiang Shen, Yu Wang, Yile Xu, Hao Du, Wenyi Zhang, and Xiangjie Kong. 2023. "Impact of In-Air Gestures on In-Car Task’s Diver Distraction" Electronics 12, no. 7: 1626. https://doi.org/10.3390/electronics12071626
APA StyleCui, C., Shen, G., Wang, Y., Xu, Y., Du, H., Zhang, W., & Kong, X. (2023). Impact of In-Air Gestures on In-Car Task’s Diver Distraction. Electronics, 12(7), 1626. https://doi.org/10.3390/electronics12071626