Article

Fog Computing Resource-Scheduling Strategy in IoT Based on Artificial Bee Colony Algorithm

1
College of Mechanical Engineering, North China University of Science and Technology, Tangshan 063210, China
2
HUIDA Sanitary Ware Co., Ltd., Tangshan 063000, China
*
Author to whom correspondence should be addressed.
Electronics 2023, 12(7), 1511; https://doi.org/10.3390/electronics12071511
Submission received: 21 February 2023 / Revised: 17 March 2023 / Accepted: 21 March 2023 / Published: 23 March 2023

Abstract

:
As the amount of data input increases, fog devices on IoT edge networks become increasingly inefficient. However, a well-designed fog computing resource-scheduling strategy can help to reduce excessive time delays and energy consumption. Therefore, in this paper, we propose an efficient fog computing resource-scheduling strategy. First, we used particle swarm optimization (PSO) to determine the optimal load balance among fog nodes and to obtain the optimal computation time and energy consumption in a single fog cluster. Second, we designed a particle swarm genetic joint optimization artificial bee colony algorithm (PGABC) to optimize the task scheduling among fog clusters based on the time and energy consumption obtained from load balancing. In addition, PGABC was used to optimize the task-scheduling model, which further reduced the delay and energy consumption of fog computing. The experimental results show that the time delay that was calculated using the proposed PGABC algorithm in the given model was reduced by 1.04%, 15.9%, and 28.5%, compared to GABC, ABC, and PSO, respectively, and the energy consumption was reduced by 3.9%, 6.6%, and 12.6%, respectively. The proposed resource-scheduling strategy reduced the delay by approximately 31.25%, 27.8%, 27.8%, and 25.4%, and the energy consumption by approximately 9.7%, 33.3%, 32%, and 29.6%, compared to SJF–PSO, PGABC-R, HSF.ABC&PSO, and MFO, respectively.

1. Introduction

The Internet of Things (IoT) has gained global attention in recent years and has developed rapidly. However, with the advancement of technology and society, an increasing amount of IoT devices and data are appearing, presenting a series of severe challenges in relation to data storage and transmission. These challenges have also ushered in a series of emerging technological revolutions. As the core of the IoT, cloud computing provides services such as storage capacity, high processing power, and computing resources. In addition, cloud servers support the visualization of computing resources [1]. However, cloud servers are usually located far away from the end devices. Thus, cloud servers sometimes cause long WAN delays and a poor quality of service in latency-sensitive applications [2,3]. Moreover, with the increasing demand for connected devices and IoT applications, cloud computing has various problems that need to be optimized, such as those that are related to bandwidth, privacy, delay, storage, response time, security, and the excessive concentration of computing resources [4,5,6]. Therefore, Cisco proposed a new computing concept in 2012 known as fog computing (FC) [7]. FC complements cloud computing in application servers with high latency sensitivity [8,9,10]. FC can integrate storage, networking, and cloud computing services for the end users [11]. As a result of these advantages, FC is widely used in electronic health [12,13,14,15,16], smart home [17], manufacturing [18], smart grid [19], and smart city applications [20,21].
FC can meet the requirements of many IoT devices; however, it still faces numerous challenges and urgent optimization problems [22]. Indicators such as delay optimization, bandwidth optimization, and energy consumption optimization play an important role in FC [4] because the tasks that are performed on devices are usually heterogeneous, and resources are provided by different individuals, making such systems highly volatile [23]. When assigning resources to each task in FC, the performance difference between the different devices should be taken into account. A reasonable resource-scheduling strategy for FC will not only improve the execution efficiency of an FC system, but also considerably reduce resource consumption.
In distributed FC scenarios with a large number of nodes, such as those that are used in large factories with multiple production lines, hospital health assessments [13,15], and emergency response, the nodes are difficult to schedule and resource utilization is low. In order to improve user service quality for FC technology in Internet of Things environments, to reduce the delay in FC systems, and to improve resource utilization rates, a resource-scheduling scheme for distributed FC is presented in this paper. This scheme considers the load balancing between different fog nodes in the same fog cluster and the performance difference between the different fog clusters, avoids the limitation of a single fog cluster, and, thus, processes the task more efficiently.
The main contributions are as follows:
(1) A two-level model for task scheduling and resource allocation is proposed. This model combines task scheduling between different fog clusters and load-balancing resource allocation between fog nodes within the same fog cluster, combining the integrity of the entire distributed fog layer with the advantages of the individual fog cluster;
(2) An effective task-scheduling algorithm, i.e., an artificial bee colony (ABC) based on particle swarm optimization (PSO) and the genetic algorithm (GA), is proposed. We use PGABC to represent the proposed algorithm. This algorithm is suitable for task-scheduling problems and it reduces the total execution time and the total energy consumption of the system;
(3) We propose a resource-scheduling scheme consisting of two parts: PSO to optimize the resource allocation of the fog nodes in the same fog cluster, and PGABC to address the task-scheduling problem between the fog clusters. We use PGABC–PSO to represent the proposed resource-scheduling strategy. This scheme effectively reduces service latency and improves resource utilization, thus improving the overall task execution stability.
The rest of this paper is organized as follows: Section 2 discusses related work, Section 3 describes the FC architecture, Section 4 describes resource scheduling in FC, Section 5 proposes the resource-scheduling algorithm, Section 6 analyzes the experimental results, and Section 7 summarizes this study.

2. Related Work

With the rapid development of FC in recent years, research on resource-scheduling strategies for FC has progressed. The study of novel optimization methods to address delays or energy consumption issues in resource scheduling has become widespread. Rafique et al. [24] proposed a new bio-inspired hybrid algorithm, which combines improved PSO and improved cat swarm optimization. In this method, a modified PSO is used to perform task scheduling among fog devices, and a bio-inspired hybrid algorithm is used to perform resource management at the fog device level. This scheme improves the resource utilization and reduces the average response time by managing the available fog resources. Ghobaei et al. [25] proposed a task-scheduling algorithm that was based on moth–flame optimization (MFO), which reduces the total execution time of tasks by allocating optimal task sets to meet the service quality requirements of the network physical system applications. This algorithm achieves optimal results by considering the minimization of task execution and the transmission time as the objective function. However, the energy consumption that is associated with the system is not taken into account. Narayana et al. [26] developed an extended PSO and an additional gradient method to optimize the task-scheduling problem in the cloud–fog environment. This approach takes the time and cost of task execution as the optimization objective, compares it with other PSO methods, and obtains preferable optimization results. However, the number of fog nodes used in the cloud and fog environments is small and the limitations are considerable. Saroja et al. [27] proposed a resource-allocation algorithm that was based on a hybrid multi-objective crow search considering heterogeneity. The success rate and the safe hit rate are the objective functions. The simulation results were compared with the GA and the modified crow search algorithm based on the pivot rule in order to demonstrate the method’s effectiveness. Li et al. [28] standardized and normalized resource properties and combined fuzzy clustering and PSO to partition the resources, thus reducing the size of the resource search. Finally, according to weight matching, the resources and tasks were matched, and the final resource scheduling results were obtained in order to improve user satisfaction. The simulation results were satisfactory in terms of their user satisfaction but lacked the necessary latency and energy consumption metrics. On the basis of the classical Apriori algorithm, Liu et al. [29] proposed a classification I-Apriori algorithm for tasks in the FC environment, which improves the efficiency and the performance of classification mining. For the task-scheduling problem in the FC environment, the I-Apriori algorithm is used to construct an FC task-scheduling model with the execution time and average waiting time as the optimization objectives; thus, a modified task priority-scheduling algorithm was proposed. Experiments show that the proposed method has a superior performance; however, this study only considered time as the optimization objective and did not consider the energy consumption of the system. For FC, both latency and energy consumption are extremely important. Strategies that only target latency or energy consumption are not conducive to the sustainable utility of FC systems. The special environment of FC requires not only low latency to improve the execution efficiency of the system, but also sufficient energy to process the tasks. Therefore, in this study, we constructed a multi-objective optimization model by considering delay and energy consumption as the optimization objectives.
The ABC was proposed by Karaboga in 2005. It has the advantages of a simple structure, an excellent search performance, a strong stability, and few control parameters, and it has been successfully used to solve function optimization problems [30,31].
In recent years, the ABC has been frequently used in resource-scheduling problems. Li et al. [32] introduced Gaussian mutation and the adaptive factor to improve the ABC, taking into account the global search ability in the early stage and the local detailed search in the later stage. The adaptive crossover probability was introduced to improve the differential evolution algorithm, which takes into account the genetic diversity and the convergence speed. The two modified algorithms are used to find the optimal solution in parallel; the optimal solution and the location information are exchanged in time so that the two algorithms can quickly approach the optimal solution, therefore reducing the number of algorithm iterations and improving the convergence rate and accuracy of the algorithm. Li et al. [14] were the first to discuss the flexible task-scheduling problem in cloud computing and modeled the problem as a hybrid flow store scheduling problem. First, an improved adaptive disturbance structure was embedded into the ABC to balance the development and exploration capabilities. An effective selection and update method was used to enhance the development process. Second, in order to further improve the development capability, a deep development operator was designed. Then, a modified version of the scout bee was designed. Finally, the convergence of this algorithm was improved by designing an improved scout bee with different local search methods to find the best food source or discarded solution. The performance of the proposed algorithm was also verified. Meshkati et al. [33] proposed a hybrid scheduling framework that was based on the combination of the ABC and the PSO(HSF.ABC&PSO), which combines the global search ability of the ABC with the preferable local development ability of the PSO. When applied to the energy-aware framework of cloud computing, it reduces the energy consumption and the execution time of cloud computing.
Nevertheless, the application of the ABC in FC resource-scheduling suffers from a low optimization efficiency and a low computational accuracy. To address these issues, in this study, we make the following improvements to the ABC: we introduce the discrete search capability of the GA algorithm into the artificial bee colony algorithm in order to increase the search efficiency of the algorithm, and the PSO algorithm is introduced to increase the local search capability of the algorithm and to improve the search accuracy. In this paper, the modified ABC is called PGABC, which is proposed to solve the multi-objective problem of delay and energy consumption in task scheduling.
On the basis of existing studies, we consider the efficiency of a single fog cluster and the integrity of the entire distributed FC system. A resource-scheduling scheme based on the PSO and the PGABC algorithm (PGABC–PSO) is proposed. The PSO is used to solve the problem of optimal load balancing for each task in a single fog cluster. Then, according to the obtained load balancing results, and taking into account the transmission time, tasks are assigned to each fog cluster in a reasonable manner. The resource-scheduling problem is solved by the PGABC algorithm, with delay and energy consumption as the optimization metrics.

3. Improved Resource-Scheduling Architecture for FC

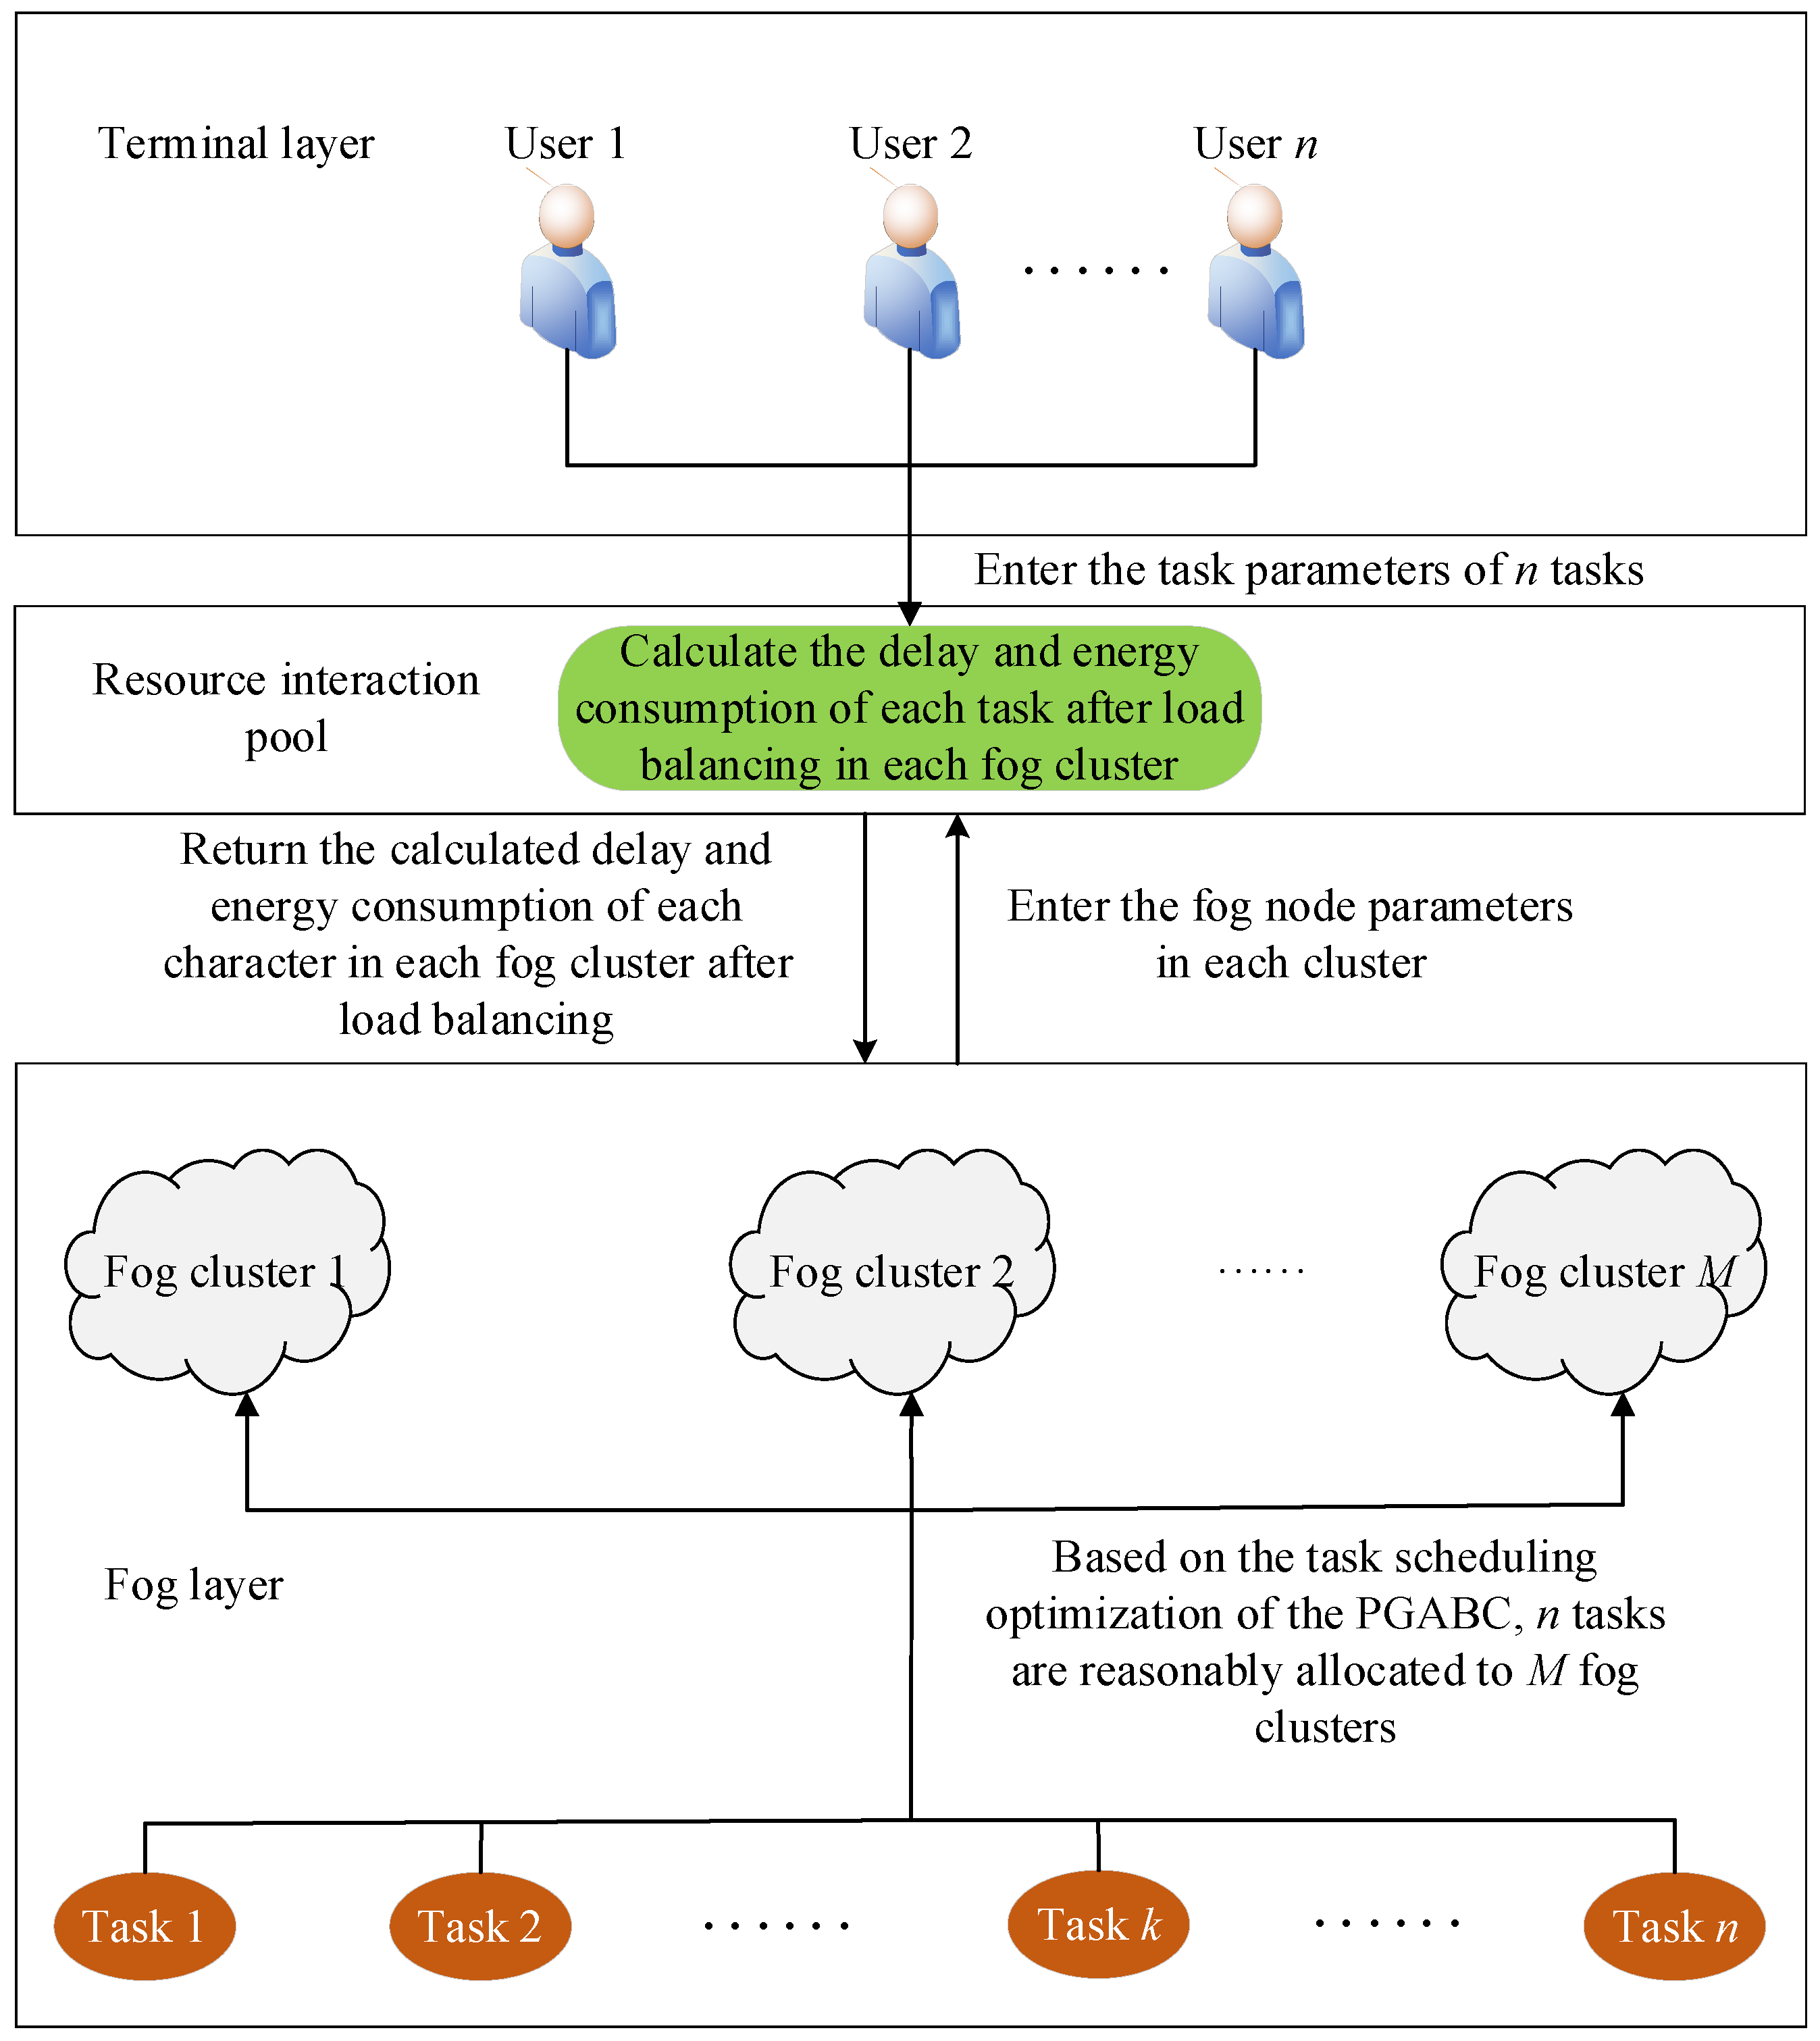
FC is usually used in cooperation with edge servers and cloud computing. Therefore, the existing FC architecture consists of the following three layers: cloud, fog, and terminal nodes [34,35]. On the basis of the three-layer cloud architecture that was proposed by Ramirez [36] and Ren et al. [37], we propose an improved FC architecture by referring to a two-level resource-scheduling model that was proposed by Sun et al. [38] and a hierarchical cloud network workload allocation scheme designed by Fan et al. [39]. The FC architecture was split into two layers, and a resource-scheduling strategy based on the two fog networks was designed, as shown in Figure 1.
In the improved three-layer FC resource-scheduling architecture, the fog layer is composed of a fog cluster layer and a fog node layer from a data processing perspective, the fog clusters are composed of fog nodes based on the principle of the geographic location, and the variance of the number of nodes between each fog cluster is as small as possible. At the fog node layer, when a service request arrives, the task is split into subtasks according to the number of fog nodes in the fog cluster. This phase focuses on how to rationally distribute the upload tasks to the nodes in the fog cluster in order to minimize the data processing load at each fog node.
At the cluster layer, each fog cluster has a manager node, which is a resource scheduler for the tasks that are submitted by the resource requesters from the terminal layer. Task scheduling between fog clusters means that when there is a task from a fog cluster, the manager nodes communicate with each other and allocate tasks. Task scheduling follows two principles: the proximity of fog clusters and resource utilization.
Although a short communication distance reduces the communication delay, the user may not tolerate the waiting time if the resource utilization of the fog cluster that is closest to the user has already reached the upper-bound threshold. Therefore, the waiting time is introduced into the model to improve the resource utilization of the entire FC layer.

4. FC Resource-Scheduling Model

The proposed resource-scheduling strategy for FC consists of two parts. The first part is represented as resource allocation in the fog cluster. According to the computational resources and bandwidth of each fog node in the cluster, it optimally allocates tasks under the load-balancing condition. The second part is formulated as task scheduling between the fog clusters, in which input tasks are rationally assigned to different fog clusters. In this paper, the n tasks with a large delay sensitivity that cannot be handled independently by the edge server are fed into the fog layer and are processed by M fog clusters that are composed of m fog nodes in the fog layer. First, the minimum delay and the minimum energy consumption of each task after optimal load balancing in different fog clusters are calculated in this part. Then, on the basis of the first part, the minimum delay and the minimum energy consumption of the system when all of the tasks have been completed are calculated. Table 1 shows the problem notation.

4.1. Load Balancing between Nodes in the Same Fog Cluster

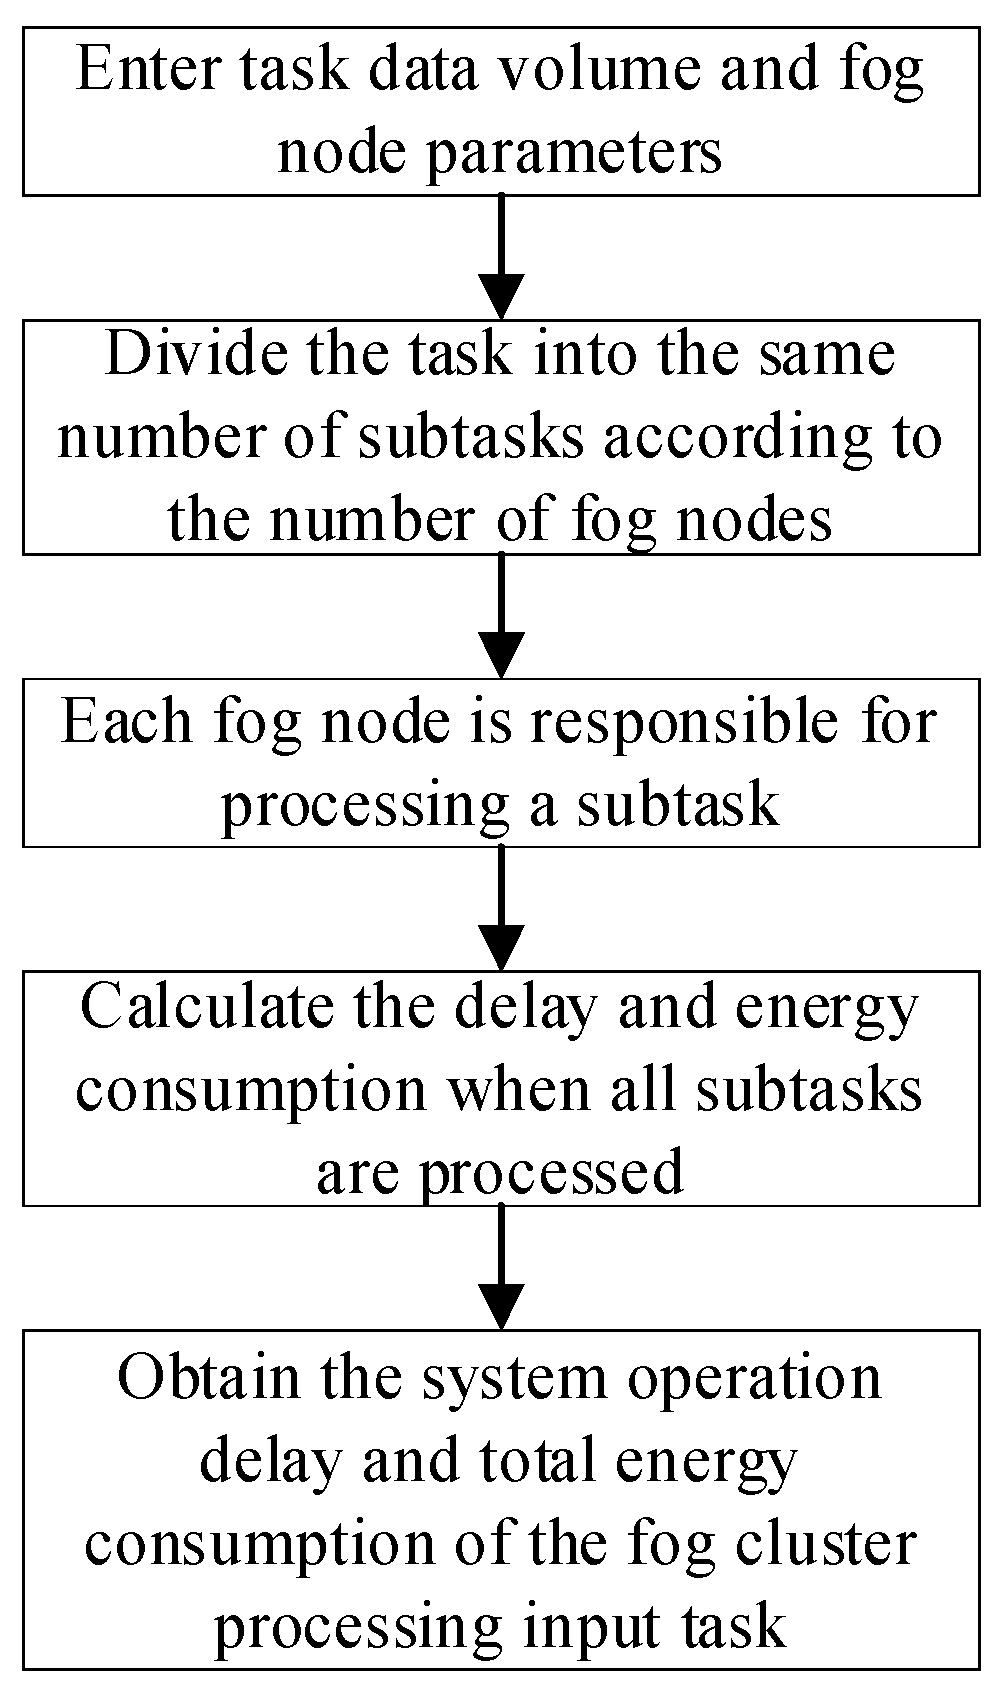
In order to balance the task load of the fog nodes in the fog cluster and to ensure a reasonable resource allocation, the delay and the energy consumption of the fog cluster processing tasks are minimized. In this study, a set of random values was preset as the initial load allocation, and then a preferable load allocation method was obtained through the load-balancing model. Finally, a set of optimal workloads was trained. The load-balancing model process is shown in Figure 2.
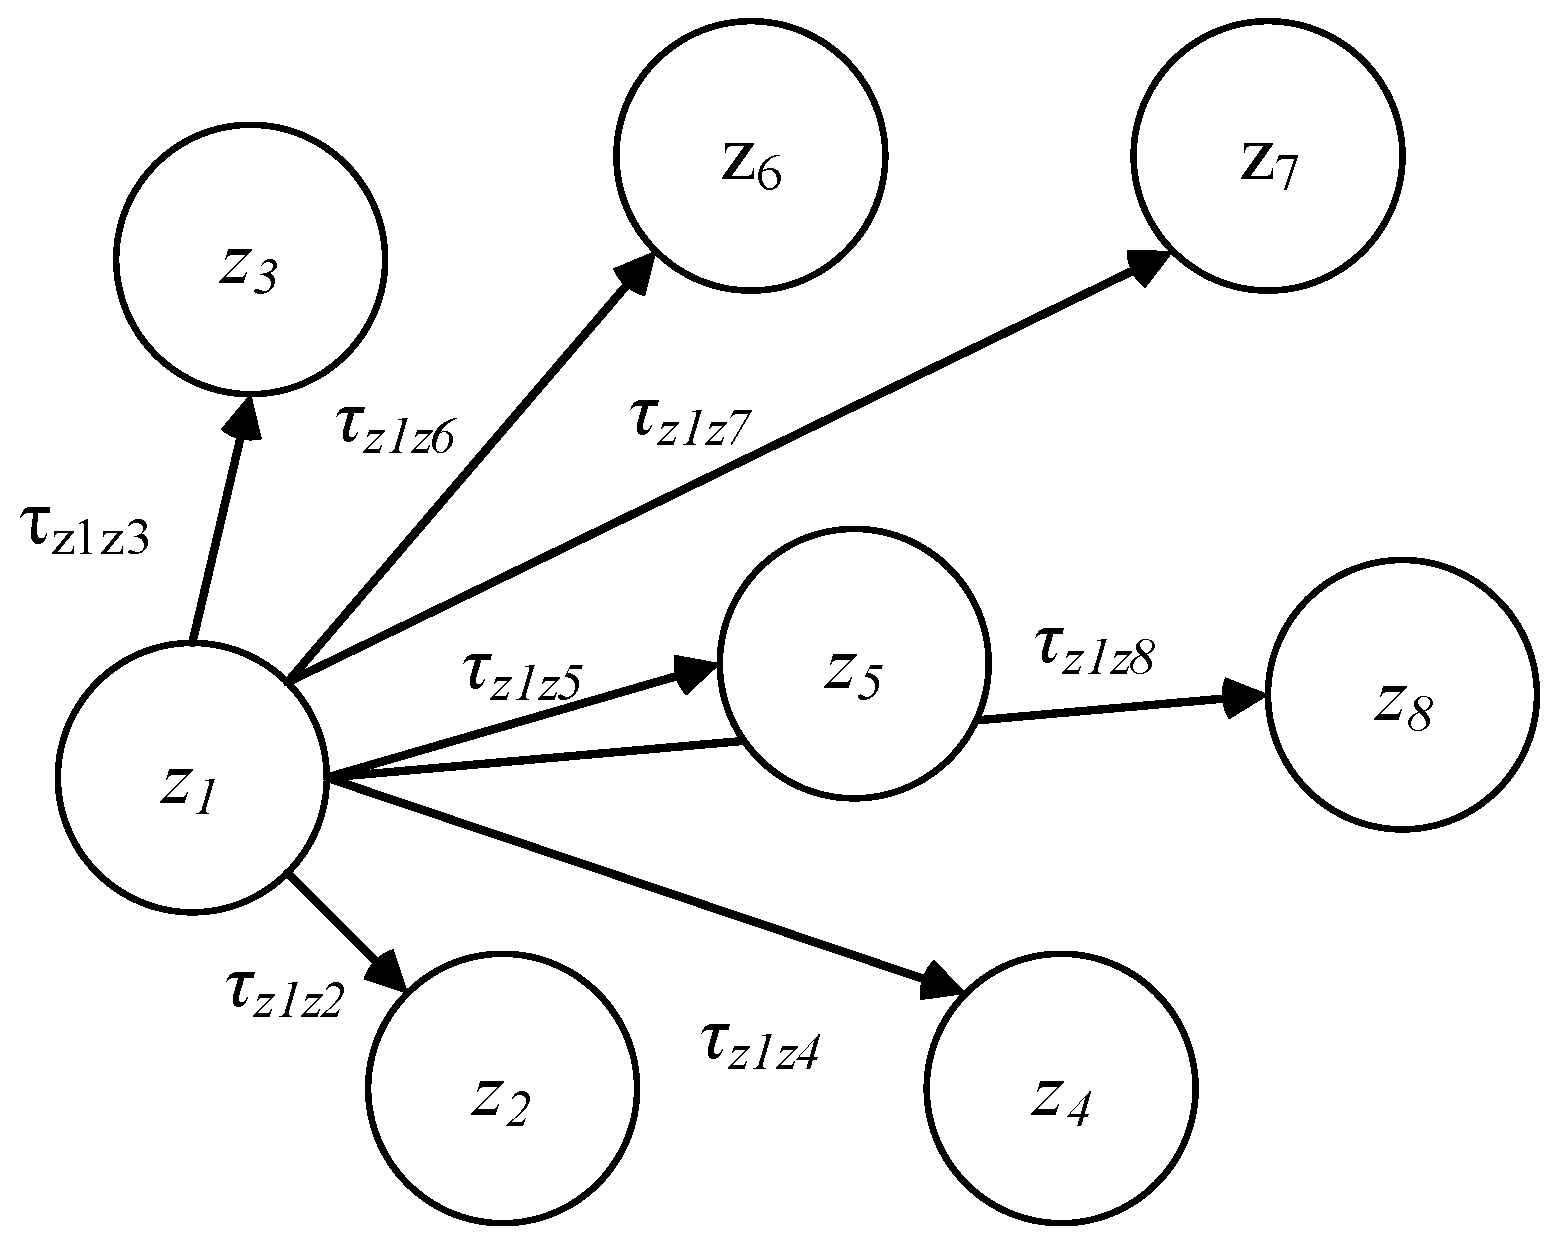
In a fog cluster, it is assumed that the q FC node devices (z1, z2, …, zq) constitute the fog cluster computing framework, and these devices have different computing capabilities. When a task from the scheduler is sent to the fog cluster, each task is denoted as X. As shown in Figure 3, it is assumed that the FC node device that is connected to the submitted task is z1 each time (z1 is the selected task manager node that is responsible for receiving the tasks and allocating the resources). Then, task X is divided into multiple subtasks, and the relationship between its subtasks is satisfied with xpg = δgX. All of the FC nodes, including z1 itself, can perform the corresponding processing computations on the subtasks.
Thus, in the fog cluster, the total processing time t of the input task in the fog layer consists of two parts: the computation delay and the communication transmission delay. This can be expressed as Equation (1).
t δ = max δ g X λ z g + δ g X τ z g z h
where λ z g represents the computing power of the FC node device; δ g X λ z g represents the time that is required for the FC device zg to process the subtask xg, i.e., the computing delay of the FC device; δ g X τ z g z h represents the time that it takes for the subtask xg to be transferred to the FC device zg; and τ z g z h represents the communication transmission speed from fog node g to fog node h (1 ≤ hm).
τ z g z h = b h × 1 + S N
where bh represents the channel bandwidth of the data transmission from fog node g to fog node h, S represents the channel power, and N represents the noise power.
In order to ensure that Equation (1) obtains an optimal solution, i.e., a set of values of δ so that t(δ) is minimized, Equation (3) is used.
min max δ g X λ z g + δ g X τ z g z h g = 1 w δ g = 1
The processing capacity of the subtask of each fog node is xg = δgX. Thus, the subtask vector that is processed by the m fog nodes is xp = [xp1, xp2, …, xpq]. The modeling of task X and time t in the fog layer is shown in Equation (4).
t x p = max x p 1 λ z 1 + x p 1 τ z 1 z 1 , , x p g λ z g + x p g τ z 1 z g , , x p q λ z q + x p q τ z 1 z q x p 0 , g = 1 q x p g = X
As with the time delay composition, the energy consumption of the entire fog cluster also mainly consists of the transmission energy consumption and the execution energy consumption. The total energy consumption of a fog cluster performing a task can be expressed as follows:
e x p = h = 1 q x p h τ z 1 z h P t r a n + h = 1 m x p h λ z h P c o m p
where Ptran is the energy consumption of the data transmission from one node to another in the system and Pcomp is the energy consumption of the fog node processing the data in the system.
In the same fog cluster, the joint optimization objective function of the delay and the energy consumption of the resource allocation is as follows:
f(xp) = min(μt(xp) + (1 − μ)e(xp))
where μ is e ( x p ) e ( x p ) + t ( x p ) .

4.2. Task Scheduling between Different Fog Clusters

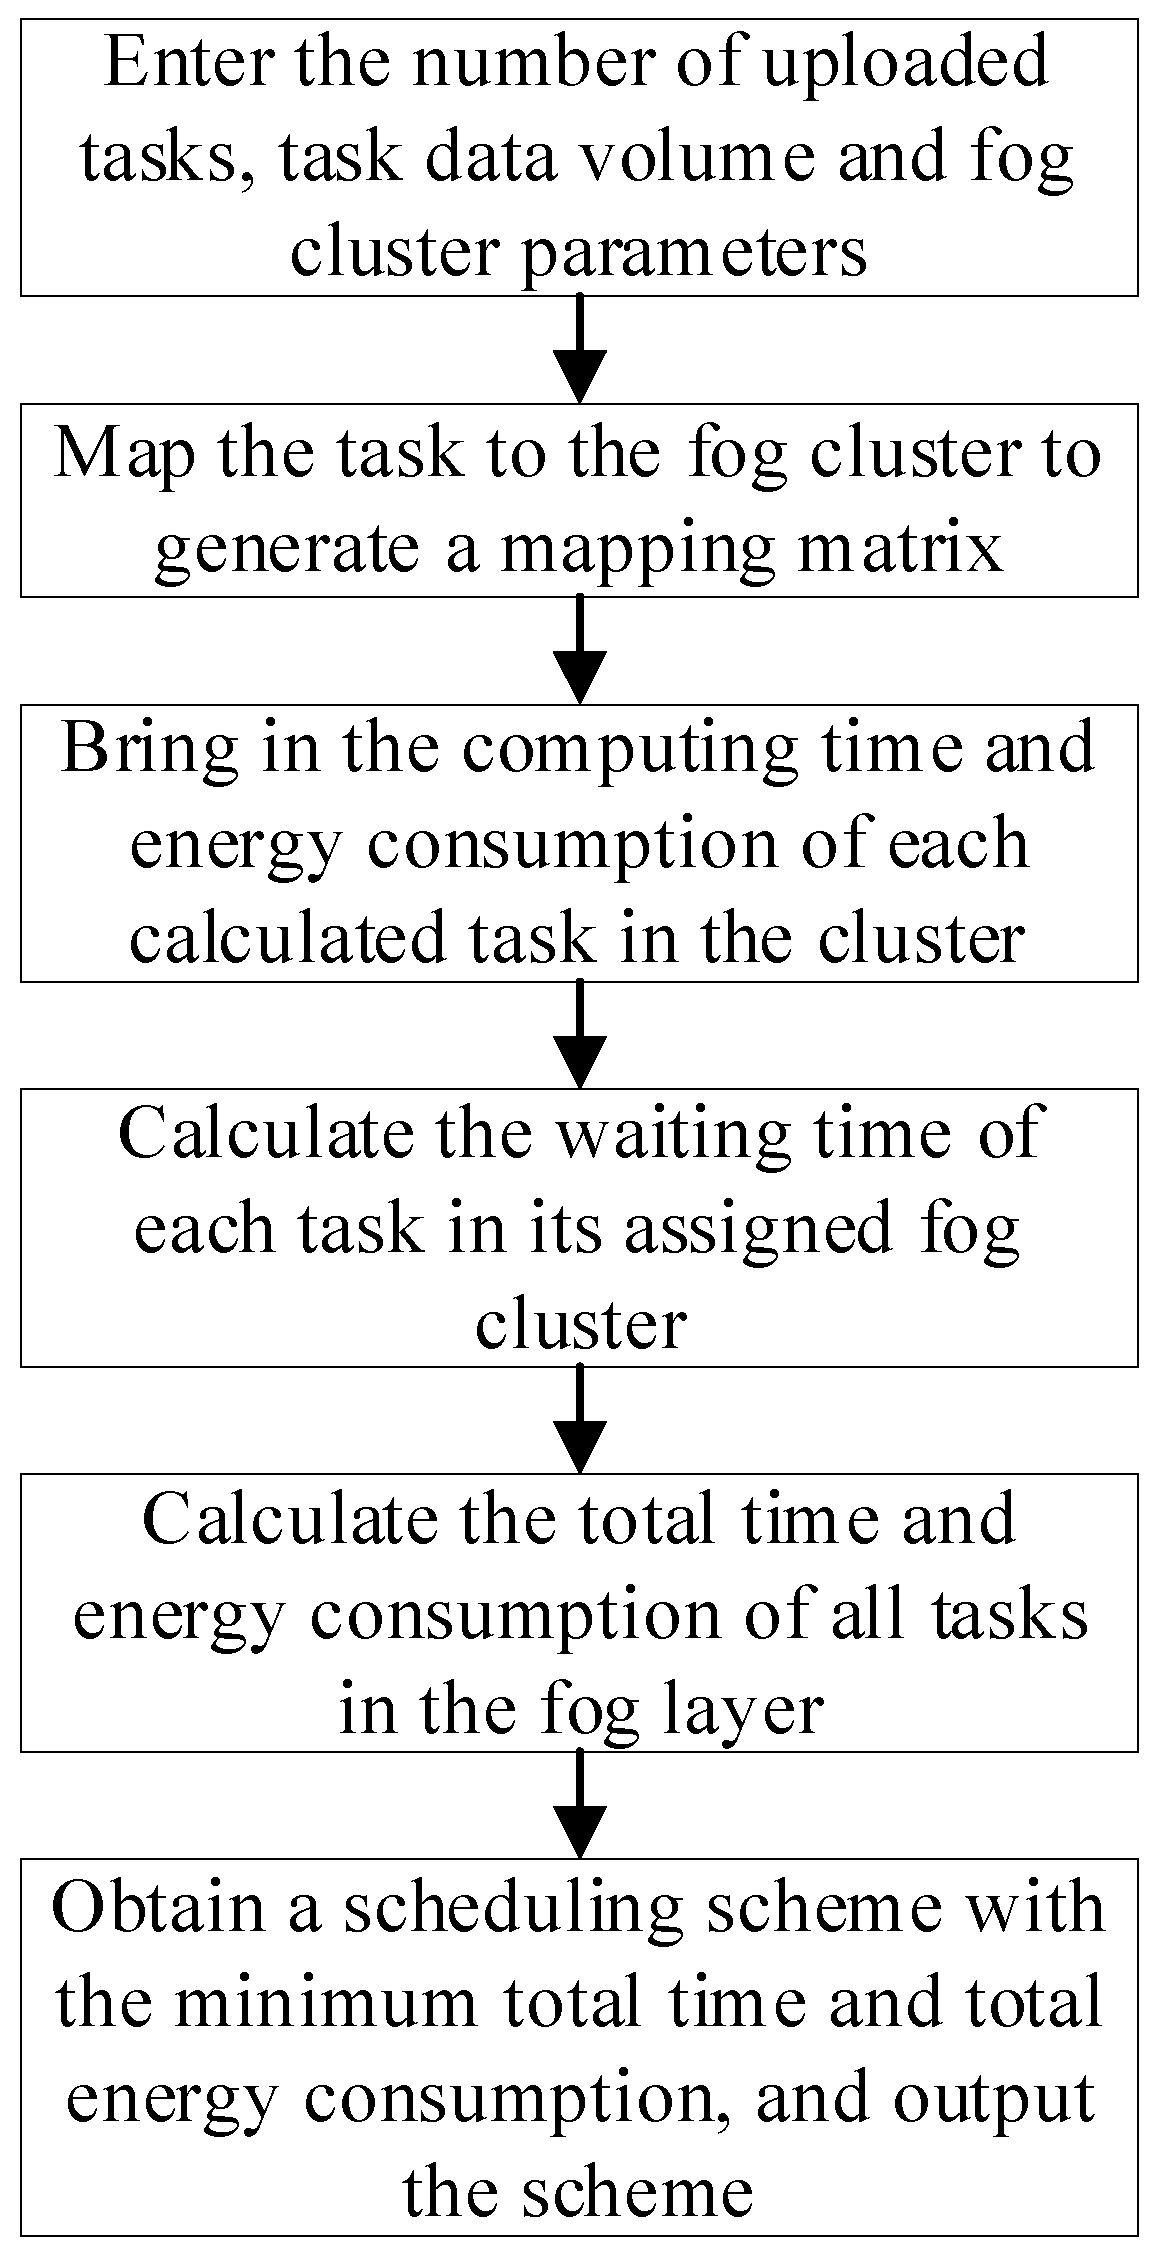
There are also performance differences between the different fog clusters. In order to fully utilize all of the fog clusters, the time and energy consumption of the FC system for processing tasks are reduced. This section introduces the waiting time into the task-scheduling model and constructs the task-scheduling model between the fog clusters by combining the processing time and the waiting time in order to represent the total completion time of a task. The task-scheduling process between the different fog clusters is shown in Figure 4.
Suppose that there are m fog nodes in the system and each fog node is represented by a quaternion. Suppose that fi(axi, oyi, bi, λi) represents the ith fog node, axi represents the abscissa of the fog node, oyi represents the ordinate of the fog node, bi represents the bandwidth of the fog node, λi represents the computing resources of the fog node, and m fog nodes are represented as follows:
f = {f1, f2, f3, …, fm}
M clusters consist of m fog nodes according to their geographical location, each represented by a binary group. FI(BI, CI) represents the Ith fog cluster, BI represents the average bandwidth of the Ith fog cluster, and CI represents the total computing resources of the fog cluster. The M fog clusters are represented as follows:
F = {F1, F2, F3, …, FM}
When n tasks are uploaded to the fog layer, each input task is represented by a binary group. Suppose that rk(k, Xk) specifies the kth task, k represents the number of the task, and Xk represents the data size of the task k. Then, n tasks are shown in Equation (9).
r = {r1, r2, r3, …, rn}
Suppose that SkI represents the kth task processed by the Ith fog cluster and there is a mapping matrix S between the task and the fog cluster, as shown in the following formula:
S = s 11 s 1 M s n 1 s n M I = 1 M S k I = 1
The execution time and the energy consumption of the n tasks in each fog cluster are calculated as in Section 4.1. tkI represents the time spent by task k in fog cluster I, without the waiting time, and ekI represents the energy consumption of task k in fog cluster I, without the energy consumption spent by the waiting time. Thus, the following delay matrix and energy consumption matrix can be obtained:
e m = e 11 e 1 M e n 1 e n M
t m = t 11 t 1 M t n 1 t n M
The tasks assigned to the M clusters can be obtained from Equation (10) as the set Mn.
M n = { n 1 , n 2 , n 3 , , n M } n I = s u m ( S ( : , I ) ) , I = 1 M n I = n
If we assume that the nI tasks need to be processed in fog cluster I, the representation of nI tasks is RI:
R I = r r 1 , r r 2 , r r 3 , r r n I
Moreover, n tasks can be expressed in another way:
R = {R1, R2, R3, …, RM}
where RI represents the Ith scheduling list and n tasks are assigned to the M fog clusters according to the M task scheduling lists. Each fog cluster processes the assigned tasks according to the corresponding task scheduling list.
The time to complete the assigned task in the Ith fog cluster can be obtained from Equations (10) and (12), without the waiting time.
T I e x e ( S ) = T I 1 e x e , , T I j e x e , , T I n I e x e T I j e x e = S ( j , : ) × t m ( : , j )
T I j w a i t (1 ≤ jnI) represents the waiting time for task j in fog cluster I. Then, T I j w a i t can be expressed as follows:
T I j w a i t = 0 j = 1 T I j 1 w a i t + T I j 1 e x e = k = 1 j 1 ( S ( k , : ) × t m ( : , k ) ) 2 j n I
The completion time of a task consists of the task waiting time T I j w a i t and the task execution time T I j e x e , which can be expressed as the total time spent on the jth task in fog cluster I.
T I j = T I j w a i t + T I j e x e
The total delay in fog cluster k is equal to the service delay time TInI of the nIth task.
T I n I = T I n I w a i t + T I n I e x e = j = 1 n I T I j e x e = j = 1 n I ( S ( j , : ) × t m ( : , j ) )
The total service delay spent by the entire fog layer processing n tasks is T:
T ( S ) = max T 1 n 1 , , T I n I , , T M n M = max { j = 1 n 1 ( S ( j , : ) × t m ( : , j ) ) , , j = 1 n M ( S ( j , : ) × t m ( : , j ) ) } I = 1 M n I = n
From the perspective of the fog cluster, the energy consumption of the entire fog layer consists mainly of the waiting energy consumption and the execution energy consumption. The total energy consumption of the fog layer can be expressed as follows:
E ( S ) = I = 1 M Q w a i t j = 1 n I ( ( k = 1 j 1 ( S ( k , : ) × t m ( : , k ) ) ) X I j ) + e m · S
where Qwait represents the task waiting energy consumption per second in the Ith fog cluster.
The objective function value is an important metric by which to evaluate the pros and cons of an individual source. In the artificial bee colony algorithm, the quality of each honey source is determined by the objective function value. The nectar source with a preferred objective function value is preferentially retained. However, as a result of the large difference in the time delay and energy consumption, the direct processing procedure produces large errors. Therefore, it is necessary to numerically standardize the two objectives.
Ft(S) = ln(T(S))
Fe(S) = ln(E(S))
According to the normalization of the above objectives, the task-scheduling objective function value F between the different fog clusters is finally obtained by summation. The final objective function can be calculated using Equation (24).
F(S) = min{ψFt(S) + γFe(S)}
where ψ and γ represent the weights of the delay and the energy consumption, respectively. The center of gravity of the optimization objectives is represented by their values, where ψ = Fe(S)/(Ft(S) + Fe(S)) and ψ + γ = 1.

5. Design of Resource-Scheduling Strategy Based on PGABC–PSO

5.1. Load Balancing between Nodes

When a task is uploaded to the FC system, the optimal load balancing is computed to minimize the computation time and the energy consumption when each task is processed by each fog cluster.
The initial load allocation of a task is represented for N q-dimensional random arrays, where q represents the number of fog nodes in the fog cluster. The traditional PSO is used to find the best load-balancing scheme. The particle search formula is as follows:
v p i , : = w p × v p i , : + c 1 p × r a n d × ( p p i , : x p i , : ) + c 2 p × r a n d × ( g b e s t p x p i , : )
yp(I,:) = xp(i,:) + vp(i,:)
where xp(i,:) represents the position of the current ith particle, yp(i,:) represents the position of the ith particle after searching, pp(i,:) represents the current extremum position of the ith particle, and gbestp represents the optimal value position of all of the current particles.
The mass of the particles is represented by Equation (6), and the particles with preferable quality are selected according to the greedy criterion. The above operation is repeated until the maximum period is reached, and the desired allocation result is output.
The pseudocode for the load-balancing Algorithm 1 in this article is as follows:
Algorithm 1: Load balancing based on PSO
Input: resource set {z1, z2, …, zq}, task set X, N, MP
Output: Processing time (t), energy consumption (e), load balancing solutions
1: initialize particle position, particle velocity
2: calculate the fitness value of the particle and record it as the best fitness value for each particle
3: obtain the current global best fitness value and global best particle position
4: for tm = 1→MP do
5:   for i = 1→N do
6:    update particle velocity and position
7:    calculate the fitness value of the new particle
8:     if (new particle fitness value < particle best fit value s) then
9:      The new particle position becomes the best position for the particle
10:    end
11:    if (particle best fit value < global best fit value) then
12:     The best position of this particle becomes the current global best particle position
13:    end
14:   end
15:  obtain the global best particle position
16: end
17: calculate processing time (t) and energy consumption (e)
18: return Load Balancing Solutions

5.2. Task-Scheduling Optimization Based on PGABC

In order to address the shortcomings of the traditional ABC, such as its poor convergence and optimization ability, and the way in which it falls into the local optimum in task-scheduling problems, we introduced the concept of chromosome coding from the genetic algorithm into the initial stage of the traditional ABC. Thus, the initialization of the bee colony is represented by chromosome coding. The chromosome crossover of the genetic algorithm was introduced into the employed bee phase. The global optimal value was introduced into each generation of the observation bee iteration stage of the ABC. The concept of variation was introduced into the scout bee phase. On the basis of the ABC, the PSO was introduced for deep optimization. Thus, an ABC optimized with PSO and the genetic algorithm (PGABC) is proposed.
The modified artificial bee colony algorithm consists of five main phases: bee colony initialization, the improved employed bee stage, the observation bee stage, the improved reconnaissance peak stage, and the particle swarm optimization stage.
(1) The bee colony initialization stage
The initial solution set is composed of D-dimensional numbers. Each number is represented by the value r (0 ≤ r ≤ 1). Each r represents a gene, and several genes form a chromosome. The chromosome represents the location information of the nectar source in the ABC. Each nectar source represents a solution, task represents the quantity of tasks input, and gene represents the quantity of genes per chromosome. The dimension of the particle is equal to the quantity of tasks multiplied by the quantity of genes in each chromosome.
D = task × gene
The quantity of nectar sources is set to nPop, i.e., the quantity of employed bees and scout bees is also nPop, the number of observer bees is n0nlooker, the maximum number of searches for nectar sources is Limit, and the maximum quantity of iterations is Maxcycle. In the initial stage, all of the bees are scout bees, and random searching produces nPop nectar sources. The solution groups are represented by nPop D-dimensional vectors. The nectar source generation formula is as follows:
xij = xminj + α(xmaxjxminj)
where xij represents the jth dimension value of the ith nectar source, i 1 , 2 , , n P o p , j 1 , 2 , , D , xmaxj and xminj represent the maximum 1 and the minimum 0 in the jth dimension space, respectively, and α denotes random numbers between 0 and 1;
(2) The improved employed bee stage
The employed bees search for new nectar sources in the vicinity of the initial nectar sources and update them according to the greedy rule. If the fitness value of the new nectar source is higher than that of the original nectar source, then the original nectar source is replaced by a new one. As a result of the large quantity of variables that is used in the destination algorithm, in order to increase the effort that is put into the search for the solution, the chromosome crossover in the genetic algorithm is combined with the neighborhood search in the traditional ABC in order to obtain the latest solution. The specific operation scheme is shown in Figure 5.
(3) The observation bee phase
When the nectar source is discovered by the bee colony, the quality of the honey source is measured by its fitness. The fitness calculation formula is as follows:
fiti = 1/Fi
where Fi represents the objective function value of xi, Fi is obtained by transforming xi into the mapping matrix that is shown in Equation (10) using Equation (24), and fiti represents the fitness value of xi.
In the observation bee stage, the observing bees select the honey source by observing the quality of the honey source. In this paper, the smaller the objective function value, the better the quality of the honey source, and the more observation bees will convene. The observing bee selects a source of honey via roulette probability. The selection probability formula is as follows:
p i = f i t i i = 1 N f i t i
where pi represents the probability that xi is selected. Then, because of the slow convergence of the algorithm, the global optimal honey source position is introduced to accelerate the convergence of the algorithm. The location update formula is as follows:
y i j = x i j + φ i j x i j x k j + x i j x b e s t 2
where yij is the new nectar source that is identified by the employed bees; xij is the current nectar source; xkj is the other nectar source that is selected, which is different from the current nectar source; k 1 , n P o p ; kI; xbest is the best nectar source position among all of the current nectar sources; and φ i j is a random number between −1 and 1;
(4) The improved scout bee stage
Because the number of genes is too large and the traditional ABC reconnaissance peak phase is not suitable, the mutation rate was introduced by referring to the variation in the genetic algorithm. Given a value Var (Var < 1) as the mutation rate, all of the nectar sources are traversed during the reconnaissance peak phase, and each nectar source randomly generates a random value rand (0,1). When Var < rand (0,1), the nectar source is mutated to obtain a new nectar source in order to avoid the algorithm solution falling into the local optimum;
(5) The particle swarm optimization stage
The current optimal solution is introduced into the PSO, and each nectar source position is used as the initial position of the particles. With the particle swarm velocity update formula and the position update formula, a new nectar source is identified near to the original nectar source. The particle velocity update formula and the position update formula are as follows:
v i , : = w × v i , : + c 1 × r a n d × ( p i , : x i , : ) + c 1 × r a n d × ( g b e s t x i , : )
x(i,:) = x(i,:) + v(i,:)
where x(i,:) represents the location information of the current ith particle (the honey source), p(i,:) represents the individual extremum position of the ith particle (the honey source), and gbest represents the optimal value position of all of the current particles.
The pseudocode for Algorithm 2 task scheduling is as follows:
Algorithm 2: Task scheduling based on PGABC
Input: resource set {F1, F2, …, FM}, task set {r1, r2, …, rn}, nPop, n0nlooker, MaxIt, em, tm, Var
Output: Total time delay, total energy consumption, scheduling results
1: initialize the nectar source location, calculate the fitness value of each nectar source
2: obtain the nectar source with the best fitness value at present
3: for it = 1→MaxIt do
4:  for i = 1→nPop do
5:   generation of new nectar positions according to chromosome crossover
6:   calculate the fitness value for the new nectar source location
7:    if (new nectar source adaptation value < old nectar source adaptation value) then
8:     new nectar source replaces old one
9:    end
10:  end
11: calculate the probability of fitness for each nectar source
12:  for i = 1→n0nlooker do
13:   honey source selection by roulette with the following bees
14:   search for new honey sources near the selected honey source
15:   calculate the fitness value for the new nectar source location
16:    if (new nectar source adaptation value < old nectar source adaptation value) then
17:     new nectar source replaces old one
18:    end
19:  end
20:  for i = 1→nPop do
21:   generate a random number between 0 and 1 represented by rand
22:    if (rand < Var) then  
23:     local variation of location information in nectar sources
24:     the new nectar source obtained replaces the original one
25:    end
26:  update the global best honey source
27:  for i = 1→nPop do
28:   search for new nectar source locations using the particle swarm algorithm search method
29:   calculate the fitness value for the new nectar source location
30:    if (new nectar source adaptation value < old nectar source adaptation value) then
31:     new nectar source replaces old one
32:    end
33:  end
34: obtain the location of the nectar source with the best fitness value
35: end
36: calculate the total time delay and energy consumption
37: return task scheduling solutions

5.3. Resource Scheduling Based on PGABC–PSO

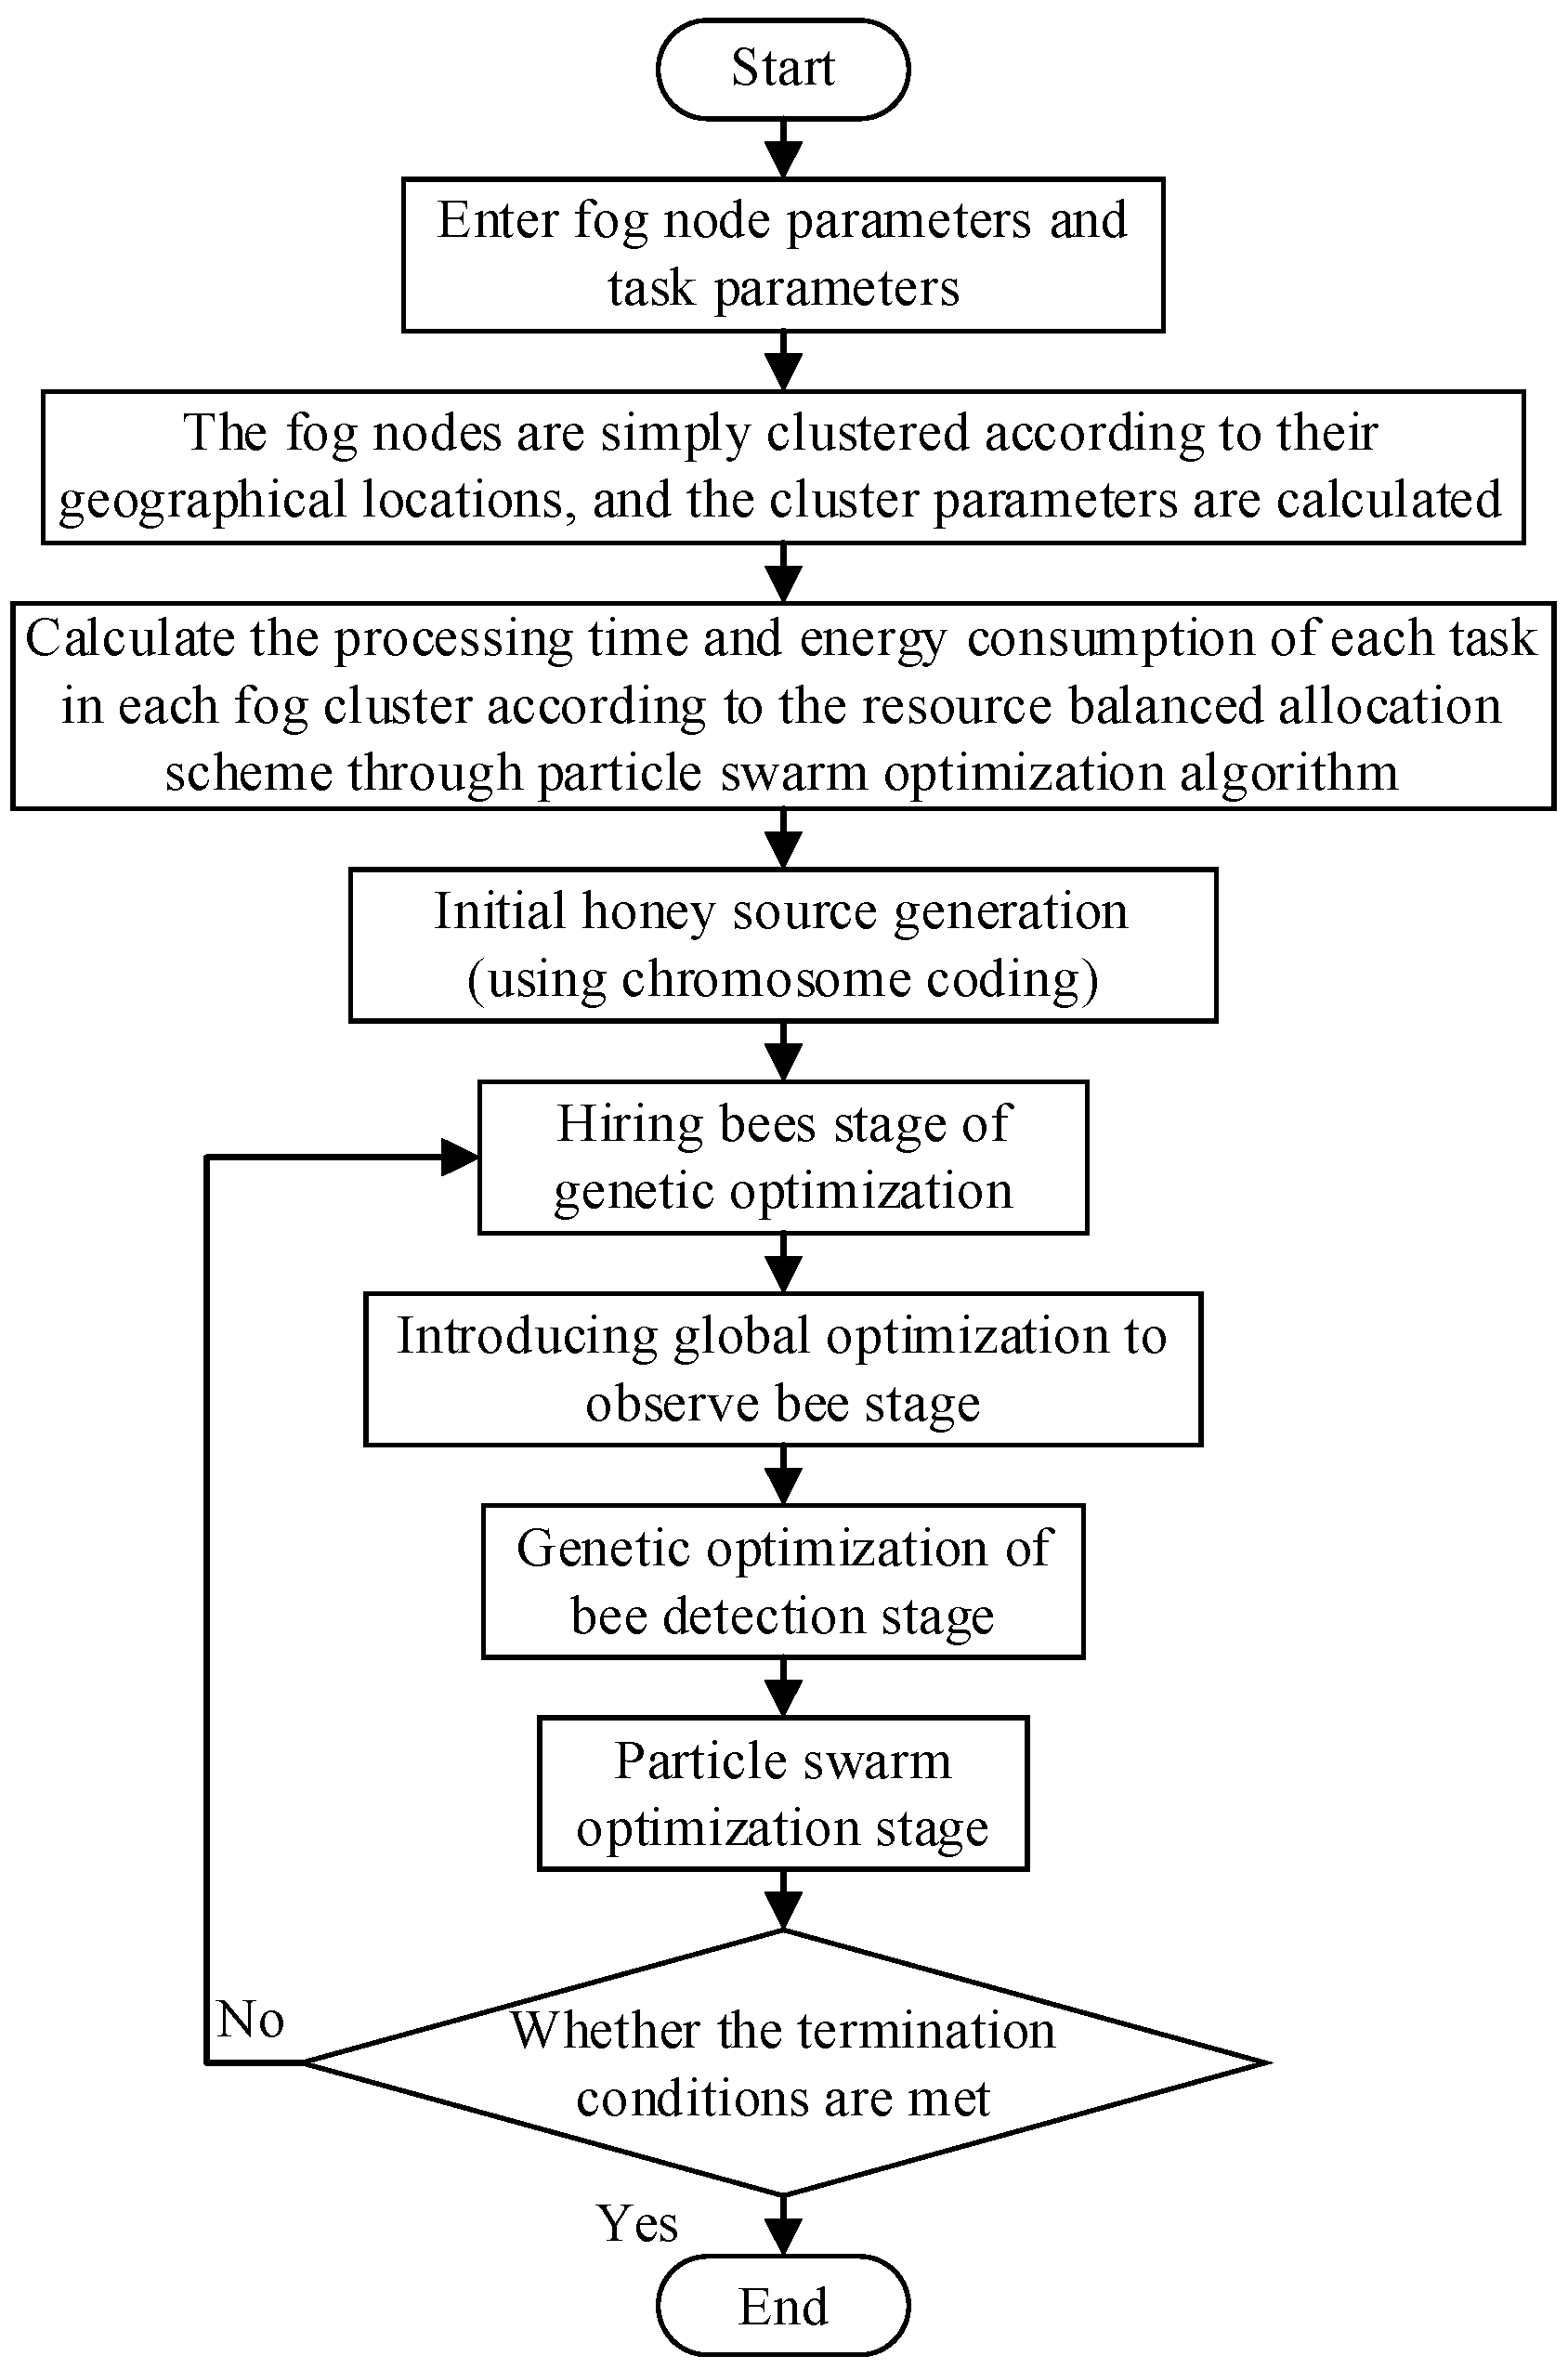
Firstly, the PSO is used to determine the load balancing in the same fog cluster, and then PGABC is used to determine the resource-scheduling scheme (PGABC–PSO) of the task-scheduling problem between the fog clusters, as shown in Figure 6.
The overall algorithm steps are as follows:
(1) Input the fog node parameters and the task parameters;
(2) The fog nodes are simply clustered according to the geographical location, and the parameters of each cluster are output;
(3) Use the classical PSO to calculate the time and the energy consumption that are required for processing all of the input fog layer tasks in each fog cluster, which are then saved in a matrix;
(4) Input the matrix that was calculated in step (1); initialize the nectar sources, the employed bees, the observed bees, and the iterations; and input the values of c, w, etc.;
(5) Calculate the objective function value of each nectar source individual, identify the current optimal nectar source position and the optimal function value, and record them;
(6) Use the employed bees after the genetic optimization to generate a new solution and calculate the fitness value;
(7) The employed bees update the nectar source according to the greedy strategy;
(8) Use Equation (29) to calculate the fitness value of the honey source according to the objective function value of the honey source and calculate the selection probability of the honey source by using Equation (30);
(9) Use the genetic optimized reconnaissance peak stage to locally mutate and update the honey source;
(10) Update the optimal nectar source position and the optimal function value;
(11) Perform further optimizations in the PSO stage to improve the computational accuracy of the proposed algorithm. Take the optimal position of the nectar source obtained in step (10) as the global optimal particle of the particle swarm, and take the latest position of all of the nectar sources obtained in step (9) as the initial particle position and the local optimal position of the particle swarm. Update the positions according to the particle swarm algorithm;
(12) Calculate the objective function value of each individual nectar source again, and update and identify the current optimal nectar source position and optimal function value;
(13) If the iteration end condition is reached, stop the iteration to output the optimal honey source position and fitness value; if not, return to step (6).

5.4. Time and Resource Complexities

In Table 2, q represents the number of fog nodes in the fog cluster, Np represents the number of particles in the particle swarm, Mp represents the total number of cycles of the particle swarm, m represents the total number of fog nodes, n represents the number of tasks, M represents the number of fog clusters in the system, nPop represents the number of employed bees, n0nlooker represents the amount of following bees, gene represents the number of genes per chromosome in the PGABC, and Maxcycle represents the total number of cycle iterations in the PGABC.
In the FC system, the number of fog nodes m and the number of fog clusters M are generally fixed, and only the number of input tasks n is variable. The other parameters in the above table are all inherent parameters of the algorithm itself. It can be seen that the data variation in the method is only related to the number of tasks n, and the other parameters can be neglected; therefore, the final time complexity is O(n) and the resource complexity is O(n). The performance of the method that was proposed in this section is good, and it does not become computationally intractable as the amount of data increases.
6. Simulation and Analysis

6.1. Simulation Parameter Design

The experimental parameters were limited in order to make the proposed PGABC–PSO strategy suitable for FC scenarios. In the simulation experiment, the experimental parameters were set as follows: The task number range was [20, 200] and the task data range was [1, 10] GB. The fog node number range was [50, 300], the fog node calculation rate range was [10, 60] MB/s, and the fog node bandwidth range was [50, 200] Hz. The fog node abscissa range was [0–1000] m, and the ordinate range was [0–1000] m. The fog cluster was divided by fog nodes according to the geographical location, and the number of fog clusters was [6, 14]. With 100 tasks and 10 fog clusters from 100 fog nodes in the experimental environment, i.e., Intel (R) Core (TM) i5-4210H CPU @ 2.90 GHz and Windows 10, 64-bit operating system, the average time to train the proposed policy was 33 s, which varied with the number of tasks and fog clusters. The remaining parameters are listed in Table 3.
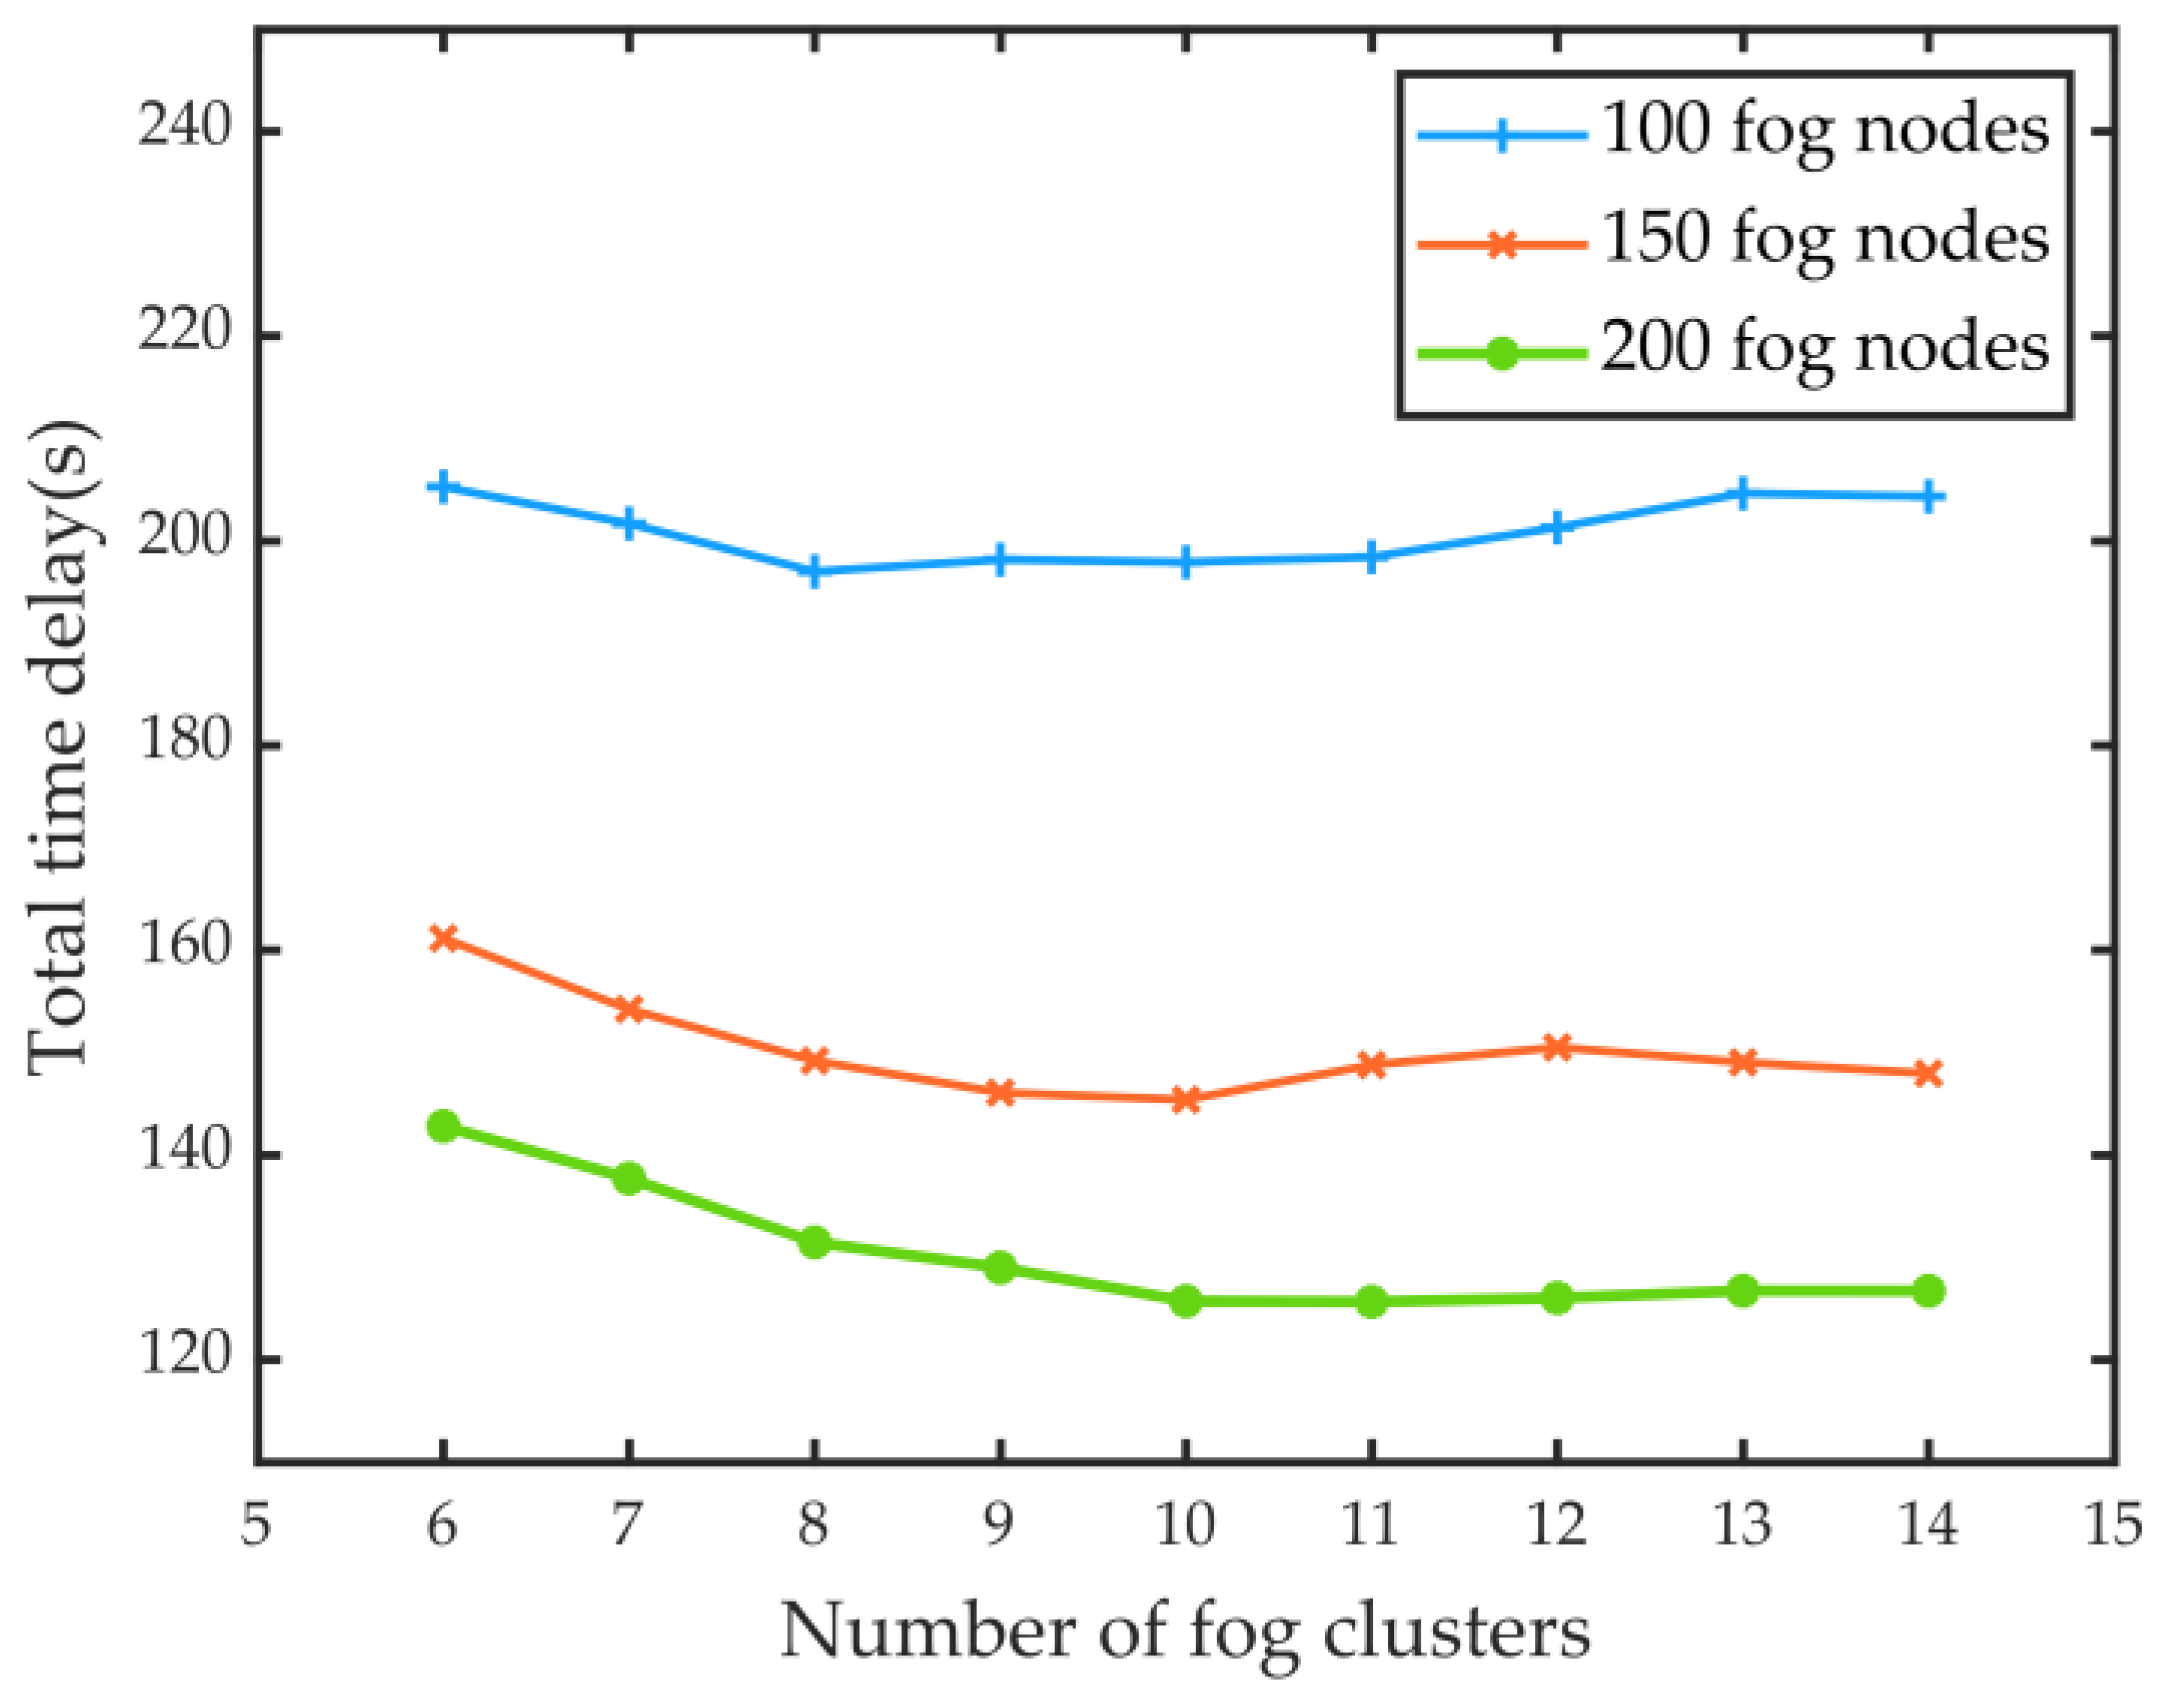
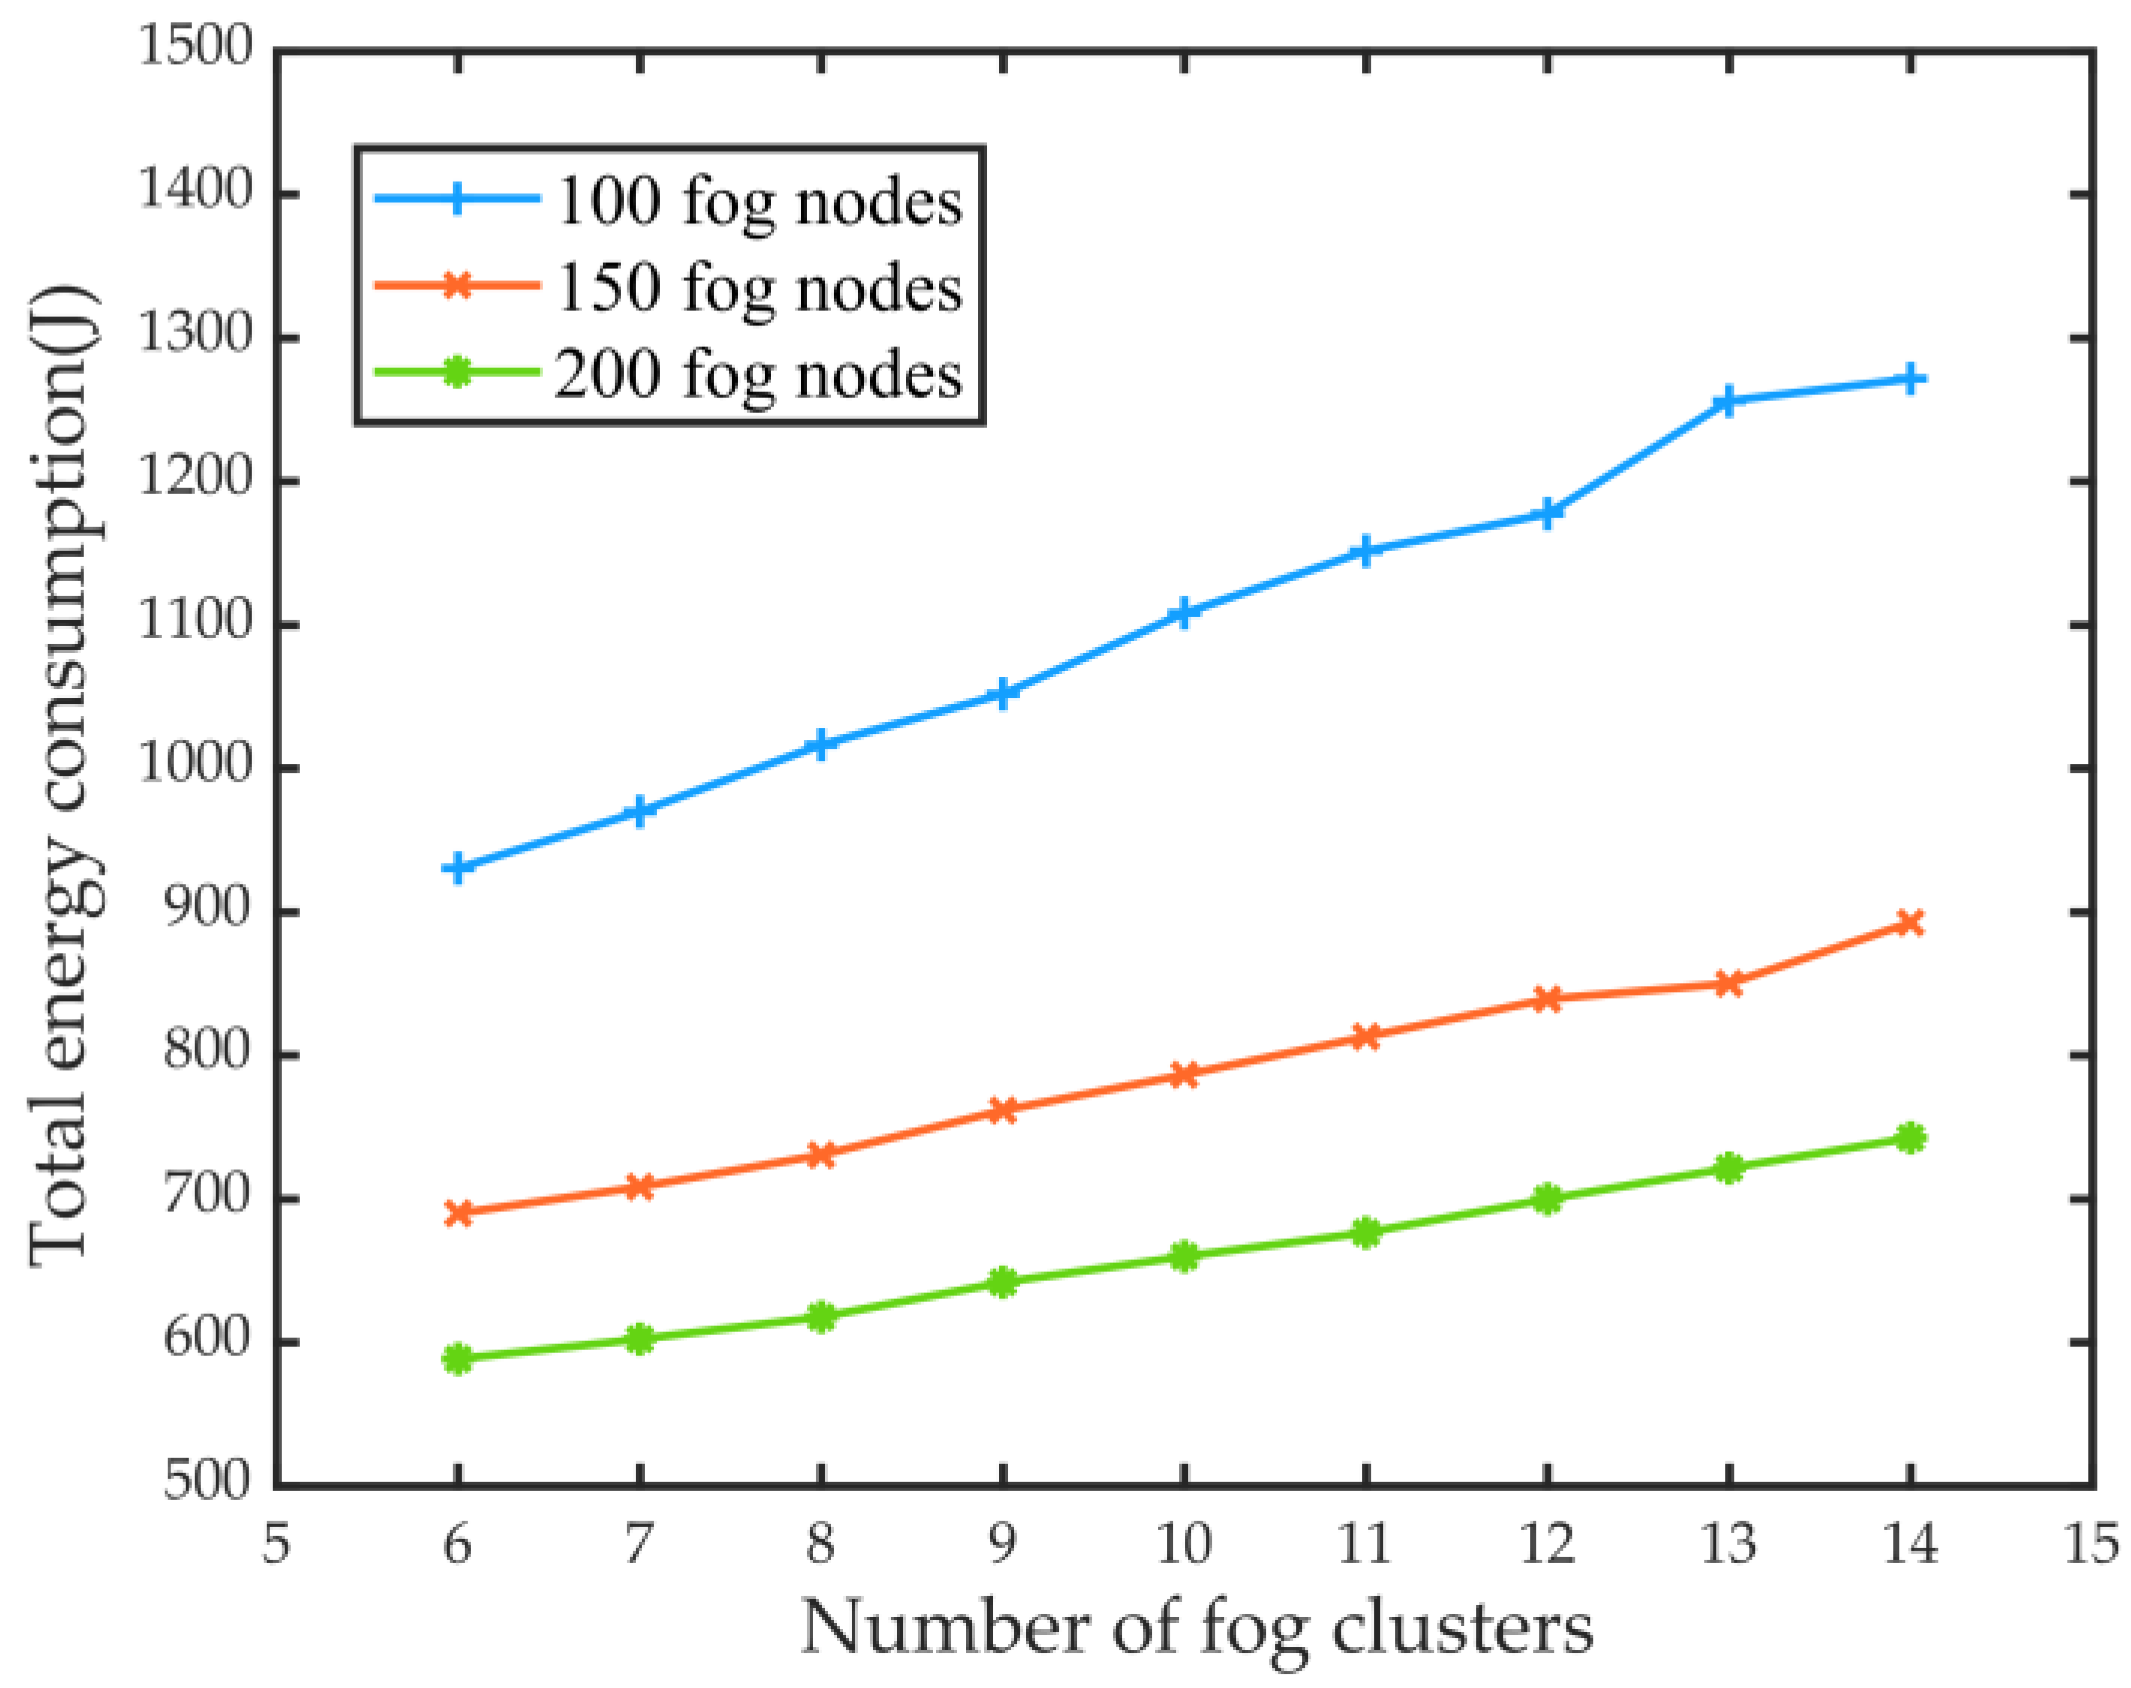
In the proposed PGABC–PSO strategy, the appropriate number of fog clusters has a large impact on resource utilization; if a small number of fog clusters is set, not all of the fog nodes are fully utilized, which increases the total latency of the system. A larger number of fog clusters increases the total energy consumption of the whole system. The results that are given in Figure 7 and Figure 8 show how we established the appropriate number of fog clusters via extensive experimentation.
It can be seen from Figure 7 and Figure 8 that, for 100, 150, and 200 fog nodes, fewer fog clusters resulted in a lower energy consumption, but larger latency. The energy consumption increased significantly with the quantity of fog clusters, and the delay decreased with the quantity of fog clusters until the delay curve plateaued after the number of fog clusters reached 10. Thus, the optimal value of the quantity of fog clusters was 10 when the quantity of fog nodes was around 100, 150, and 200. At this point, the system was most stable in terms of the processing task.

6.2. Strategy Comparison

In order to verify the effectiveness and the superiority of the proposed resource-scheduling strategy for the resource-scheduling problem in FC, the proposed strategy was tested against two performance metrics: completion time and energy consumption. The PGABC–PSO resource-scheduling strategy was compared with PGABC inter-cluster task scheduling based on random resource allocation (PGABC-R), shortest job first (SJF) inter-cluster task scheduling based on PSO for load-balancing resource allocation (SJF–PSO), the hybrid scheduling framework based on the combination of the ABC and the PSO (HSF.ABC&PSO) scheduling strategy proposed by Meshkati [35], and an efficient task-scheduling approach using the moth–flame optimization algorithm (MFO) proposed by Ghobaei [26].
First, we validated the optimization effect of the proposed scheme based on the completion time and the energy consumption for different numbers of tasks. We compared the completion time and the energy consumption of the five resource-scheduling schemes when the amount of fog nodes was fixed, and the quantity of processed tasks was different. We took the average of 30 experiments, and the quantity of tasks was set to 20, 60, 100, 140, and 200. The results are shown in Figure 9 and Figure 10.
According to Figure 9 and Figure 10, as the number of tasks increases, the total energy consumption and the total delay of the system also increase. Compared with the remaining four strategies, the proposed PGABC–PSO has an obvious optimization effect on the delay and energy consumption. The optimization effect of delay is very large. Compared with the other four strategies, the optimization effect is significantly improved. The optimization of energy consumption increases gradually with the increase in the number of tasks. It can be concluded from Table 4 that, when the quantity of tasks is 20, i.e., the minimum quantity of tasks, compared with SJF–PSO, PGABC-R, HSF.ABC&PSO, and MFO, the delay of PGABC–PSO is reduced by 31.25%, 27.8%, 27.8%, and 25.4%, respectively, and the energy consumption is reduced by 9.7%, 33.3%, 32%, and 29.6%, respectively. When the quantity of tasks is 200, i.e., the maximum quantity of tasks, compared with SJF–PSO, PGABC-R, HSF.ABC&PSO, and MFO, the delay of PGABC–PSO is reduced by 28.3%, 29.3%, 27.2%, and 21.9%, respectively, and the energy consumption is reduced by 5%, 27.9%, 26.5%, and 26.3%, respectively. Therefore, compared to the remaining four resource-scheduling strategies, the proposed strategy has a preferable optimization effect on time delay and energy consumption when the number of tasks increases, and is more suitable for resource-scheduling problems in FC. Therefore, the strategy that has been proposed in this paper is preferable to the remaining four strategies.
We validated the optimization effect of the proposed scheme on the completion time and energy consumption in environments with different numbers of fog nodes. The completion time and the energy consumption of the five task-scheduling schemes were compared when the total quantity of input tasks was fixed, and the quantity of fog node devices owned by the system was different. The quantity of fog nodes was set to 50, 100, 150, 200, and 250. The results are shown in Figure 11 and Figure 12.
According to Figure 11 and Figure 12, the total energy consumption and the total delay of the system decreased as the number of fog nodes increased. For delay optimization, the proposed strategy was far superior. Compared with PGABC-R, HSF.ABC&PSO, and MFO, concerning energy consumption optimization, PGABC–PSO was also excellent. However, when compared to SJF–PSO, there was no obvious improvement in optimization after reaching 200 fog nodes. It can be concluded from Table 5 that, when the quantity of fog nodes was 50, i.e., the quantity of fog nodes was the minimum, compared to SJF–PSO, PGABC-R, HSF.ABC&PSO, and MFO, the delay of PGABC–PSO was reduced by 25.4%, 23%, 15.4%, and 15.2%, respectively, and the energy consumption was reduced by 6.8%, 22.6%, 20.7%, and 21.2%, respectively. When the number of fog nodes was 250, i.e., the maximum number of tasks, PGABC–PSO reduced the delay by 18.5% and improved the energy consumption by only 1.1%, compared to SJF–PSO. As compared to PGABC-R, HSF.ABC&PSO, and MFO, the latency was reduced by 40.5%, 38.2%, and 34.5%, respectively, and the energy consumption was reduced by 36.5%, 36.6%, and 36.4%, respectively. Therefore, the proposed strategy exhibited a superior optimization effect for time delay and energy consumption compared to the other four strategies, but the optimization effect for energy consumption decreased as the quantity of nodes increased. Overall, the proposed strategy is superior to the other four strategies for the resource-scheduling problem.

6.3. Algorithm Performance Comparison

In order to validate the improved optimization capability and search accuracy of the proposed algorithm, it was compared with GABC, ABC, and PSO for a fixed number of fog nodes and tasks, and different numbers of fog clusters. The number of fog clusters was set to 6, 7, 8, 9, 10, 11, 12, and 13. The results are shown in Figure 13 and Figure 14.
According to Figure 13 and Figure 14, with the increase in fog cluster number, the time delay curves for the PGABC and GABC algorithms decreased and tended to be stable. Moreover, the time delay curves and the energy consumption curves for the ABC and the PSO exhibited a rising trend. However, as the number of fog clusters increased, the proposed PGABC outperformed GABC, ABC, and PSO in terms of both the optimum delay and the energy consumption, and the optimization trend also increased. According to Table 6, when the number of fog clusters was 13, the time delay of PGABC improved by 1.04%, 15.9%, and 28.5%, and the energy consumption improved by 3.9%, 6.6%, and 12.6%, as compared to GABC, ABC, and PSO, respectively. It can be seen that the improvement metrics of the traditional ABC algorithm are impressive, and the optimization effect and accuracy are better than those of the GABC, ABC, and PSO algorithms.
In summary, the proposed PGABC task-scheduling algorithm and the PGABC–PSO resource-scheduling strategy based on the proposed PGABC algorithm are suitable for addressing FC resource-scheduling problems. In addition, they produced promising results in terms of time delay and energy consumption optimization in resource-scheduling problems. The resource-scheduling policy proposed in this paper is very effective in applications with a large number of fog nodes with a wide distribution, such as those used in large factories with multiple production lines, health detection applications, emergency responses in hospitals, etc. It should be noted, however, that in this paper, we mainly focused on task scheduling in the resource-scheduling problem; thus, a more in-depth study of load balancing will be conducted in the future.

7. Conclusions

Resource scheduling in FC is crucial to improve the processing rate, the sustainable development, and the stability of FC. With the aim of addressing the difficulty of scheduling FC nodes in IoT applications, low resource utilization, and the poor application effect of the artificial bee colony algorithm in the FC resource-scheduling problem, we first optimized and improved the ABC algorithm. We then effectively applied the optimized algorithm to FC resource-scheduling to achieve optimal optimization results. Thus, we improved the scheduling scheme for FC resources in the IoT. The combination of load balancing and task scheduling reduces the latency and the energy consumption of FC network processing tasks in the context of the entire IoT network, which improves the efficiency of FC task processing in IoT applications, as well as the energy efficiency. Finally, the improved PGABC algorithm was compared with three other algorithms through simulation experiments, and the proposed PGABC–PSO strategy was compared with four other strategies. We reached the following conclusions:
(1) Genetic algorithms were introduced into the PGABC algorithm in order to prevent the traditional artificial bee colony algorithm from becoming stuck in local optima. The introduction of the PSO further improved the search accuracy based on the optimization of the genetic algorithm for the artificial bee colony algorithm. The experimental results show that the time delay that was calculated using the proposed PGABC algorithm in the given model was reduced by 1.04%, 15.9%, and 28.5%, compared to GABC, ABC, and PSO, respectively, and the energy consumption was reduced by 3.9%, 6.6%, and 12.6%, respectively. We showed that the developed algorithms produced preferable optimization results and higher accuracy. Thus, they were shown to be more suitable for the resource-scheduling scheme for FC.
(2) In the PGABC–PSO resource-scheduling strategy, the input tasks were allocated in the resource-allocation layer using the PSO algorithm for load balancing. According to the allocation results, the PGABC algorithm was used for task scheduling in the task-scheduling layer. The proposed PGABC–PSO resource-scheduling strategy reduced the delay by approximately 31.25%, 27.8%, 27.8%, and 25.4%, and the energy consumption by approximately 9.7%, 33.3%, 32%, and 29.6%, compared with SJF–PSO, PGABC-R, HSF.ABC&PSO, and MFO, respectively. It was demonstrated that the proposed strategy leads to a significant improvement in delay optimization and energy consumption optimization compared to PGABC-R, SJF–PSO, HSF.ABC&PSO, and MFO.
In this study, we optimized and improved the artificial swarm algorithm, and, combined with the PSO, it was applied to FC resource scheduling. In doing so, we achieved excellent optimization results. We also improved the resource-scheduling scheme for FC in the IoT. The combination of load balancing and task scheduling reduces the latency and the energy consumption of FC network procedures in the context of the entire IoT network and contributes to the further development of the IoT network.
However, in our study, the training data samples that were used in the scheme were small, and the application of load balancing was not sufficiently deep. Therefore, in the future, we aim to conduct a more in-depth study of load balancing and hope to produce additional optimizations based on the current work.

Author Contributions

Conceptualization, C.L. and W.L.; methodology, C.L., W.L. and A.Z.; software, C.L., Y.X. and Z.Z. (Zhen Zhang); validation, C..L, Y.X. and Z.Z. (Zhen Zhang); formal analysis, C.L. and A.Z.; investigation, C.L.; resources, C.L. and A.Z.; data curation, C.L. and Z.Z. (Zhi Zheng); writing—original draft preparation, C.L.; writing—review and editing, C.L., W.L. and Z.Z. (Zhi Zheng); supervision, C.L. and A.Z.; project administration, A.Z.; funding acquisition, W.L. and Z.Z. (Zhi Zheng) All authors have read and agreed to the published version of the manuscript.

Funding

This research was funded by the S&T Program of Hebei (22282203Z), Hebei Natural Science Foundation (E2022209086), National Natural Science Foundation of China (52004096), and the Hebei Provincial Postdoctoral Science Foundation (B2020003033).

Data Availability Statement

The data presented in this study are available upon request from the corresponding author. The data are not publicly available due to the need for our follow-up research.

Acknowledgments

To the authors and organizations mentioned in this article, we would like to offer thanks for their support in writing this article.

Conflicts of Interest

The authors declare no conflict of interest.

References

  1. Mubeen, S.; Nikolaidis, P.; Didic, A.; Pei-Breivold, H.; Sandstrom, K.; Behnam, M. Delay Mitigation in Offloaded Cloud Controllers in Industrial IoT. IEEE Access 2017, 5, 4418–4430. [Google Scholar] [CrossRef]
  2. Anna, K.; Carson, L.; Ching-Hsien, H.; Raghavendra, S.; Chang, V. Emerging trends, issues and challenges in Internet of Things, Big Data and cloud computing. Future Gener. Comput. Syst. 2018, 87, 416–419. [Google Scholar]
  3. Moura, J.; Hutchison, D. Review and analysis of networking challenges in cloud computing. J. Netw. Comput. Appl. 2016, 60, 113–129. [Google Scholar] [CrossRef] [Green Version]
  4. Bellendorf, J.; Mann, Z.Á. Classification of optimization problems in fog computing. Future Gener. Comput. Syst. 2020, 107, 158–176. [Google Scholar] [CrossRef]
  5. Singh, J.; Singh, P.; Gill, S.S. Fog computing: A taxonomy, systematic review, current trends and research challenges. J. Parallel Distrib. Comput. 2021, 157, 56–85. [Google Scholar] [CrossRef]
  6. Ni, J.; Zhang, K.; Lin, X.; Shen, X.S. Securing Fog Computing for Internet of Things Applications: Challenges and Solutions. IEEE Commun. Surv. Tutor. 2018, 20, 601–628. [Google Scholar] [CrossRef]
  7. Singh, S.P.; Nayyar, A.; Kumar, R.; Sharma, A. Fog computing: From architecture to edge computing and big data processing. J. Supercomput. 2019, 75, 2070–2105. [Google Scholar] [CrossRef]
  8. Jamil, B.; Shojafar, M.; Ahmed, I.; Ullah, A.; Munir, K.; Ljaz, H. A job scheduling algorithm for delay and performance optimization in fog computing. Concurr. Comput. Pract. Exp. 2019, 32, e5581. [Google Scholar] [CrossRef]
  9. Mutlag, A.A.; Abd, G.M.K.; Arunkumar, N.; Mohamed, M.A.; Mohd, O. Enabling technologies for fog computing in healthcare IoT systems. Future Gener. Comput. Syst. 2019, 90, 62–78. [Google Scholar] [CrossRef]
  10. Nayeri, Z.M.; Ghafarian, T.; Javadi, B. Application placement in Fog computing with AI approach: Taxonomy and a state of the art survey. J. Netw. Comput. Appl. 2021, 185, 103078. [Google Scholar] [CrossRef]
  11. Mondragón-ruiz, G.; Tenorio-trigoso, A.; CAstillo-cara, M.; Caminero, B.; Carrión, C. An experimental study of fog and cloud computing in CEP-based Real-Time IoT applications. J. Cloud Comput. 2021, 10, 32. [Google Scholar] [CrossRef]
  12. Hameed Abdulkareem, K.; Awad Mutlag, A.; Musa Dinar, A.; Frnda, J.; Abed Mohammed, M.; Hasan Zayr, F.; Lakhan, A.; Kadry, S.; Ali Khattak, H.; Nedoma, J. Smart Healthcare System for Severity Prediction and Critical Tasks Management of COVID-19 Patients in IoT-Fog Computing Environments. Comput. Intell. Neurosci. 2022, 2022, 5012962. [Google Scholar] [CrossRef]
  13. Alatoun, K.; Matrouk, K.; Mohammed, M.A.; Nedoma, J.; Martinek, R.; Zmij, P. A Novel Low-Latency and Energy-Efficient Task Scheduling Framework for Internet of Medical Things in an Edge Fog Cloud System. Sensors 2022, 22, 5327. [Google Scholar] [CrossRef]
  14. Li, Z.M.; Zhang, W. Cloud computing resource scheduling based on differential evolutionary artificial bee colony algorithm. Comput. Eng. Des. 2018, 39, 3451–3455. [Google Scholar]
  15. Mutlag, A.A.; Abd Ghani, M.K.; Mohammed, M.A.; Lakhan, A.; Mohd, O.; Abdulkareem, K.H.; Garcia Zapirain, B. Multi-Agent Systems in Fog–Cloud Computing for Critical Healthcare Task Management Model (CHTM) Used for ECG Monitoring. Sensors 2021, 21, 6923. [Google Scholar] [CrossRef]
  16. Lakhan, A.; Mohammed, M.A.; Rashid, A.N.; Kadry, S.; Abdulkareem, K.H. Deadline aware and energy-efficient scheduling algorithm for fine-grained tasks in mobile edge computing. Int. J. Web Grid Serv. 2022, 18, 168–193. [Google Scholar] [CrossRef]
  17. Rahimi, M.; Songhorabadi, M.; Kashani, M.H. Fog-based smart homes: A systematic review. J. Netw. Comput. Appl. 2020, 153, 102531. [Google Scholar] [CrossRef]
  18. Yin, L.; Luo, J.; Luo, H. Tasks Scheduling and Resource Allocation in Fog Computing Based on Containers for Smart Manufacturing. IEEE Trans. Ind. Inform. 2018, 14, 4712–4721. [Google Scholar] [CrossRef]
  19. Liu, J.; Weng, J.; Yang, A.; Chen, Y.; Lin, X. Enabling Efficient and Privacy-Preserving Aggregation Communication and Function Query for Fog Computing-Based Smart Grid. IEEE Trans. Smart Grid 2020, 11, 247–257. [Google Scholar] [CrossRef]
  20. Li, Y. Construction of U2S communications system based on edge fog computing. Comput. Commun. 2020, 153, 569–579. [Google Scholar] [CrossRef]
  21. Hui, N.; Wu, J.Z.; Yi, Q.; Liu, L.; Zhou, Z.G. Future vehicular fog computing networks. Telecommun. Sci. 2020, 36, 14–27. [Google Scholar]
  22. Dastjerdi, A.V.; Buyya, R. Fog Computing: Helping the Internet of Things Realize Its Potential. Computer 2016, 49, 112–116. [Google Scholar] [CrossRef]
  23. Li, X.; Xu, L.D. A Review of Internet of Things—Resource Allocation. IEEE Internet Things J. 2021, 8, 8657–8666. [Google Scholar] [CrossRef]
  24. Rafique, H.; Shah, M.A.; Islam, S.U.; Maqsood, T.; Maple, C. A Novel Bio-Inspired Hybrid Algorithm (NBIHA) for Efficient Resource Management in Fog Computing. IEEE Access 2019, 7, 115760–115773. [Google Scholar] [CrossRef]
  25. Ghobaei, M.; Souri, A.; Safara, F.; Norouzi, M. An efficient task scheduling approach using moth-flame optimization algorithm for cyber-physical system applications in fog computing. Trans. Emerg. Telecommun. Technol. 2019, 31, e3770. [Google Scholar] [CrossRef]
  26. Potu, N.; Jatoth, C.; Parvataneni, P. Optimizing resource scheduling based on extended particle swarm optimization in fog computing environments. Concurr. Comput. Pract. Exp. 2021, 33, e6163. [Google Scholar] [CrossRef]
  27. SUbbaraj, S.; Thiyagarajan, R.; Rengaraj, M. A smart fog computing based real-time secure resource allocation and scheduling strategy using multi-objective crow search algorithm. J. Ambient Intell. Humaniz. Comput. 2023, 14, 1003–1015. [Google Scholar] [CrossRef]
  28. Li, G.; Liu, Y.; Wu, J.; Lin, D.; Zhao, S. Methods of Resource Scheduling Based on Optimized Fuzzy Clustering in Fog Computing. Sensors 2019, 19, 2122. [Google Scholar] [CrossRef] [Green Version]
  29. Liu, L.; Wu, Y. A task scheduling algorithm for fog computing. J. Zhongshan Univ. (Nat. Sci. Ed.) 2021, 60, 166–174. [Google Scholar]
  30. Karaboga, D.; Basturk, B. A powerful and efficient algorithm for numerical function optimization: Artificial bee colony (ABC) algorithm. J. Glob. Optim. 2007, 39, 459–471. [Google Scholar]
  31. Karaboga, D. An Idea Based on Honey Bee Swarm for Numerical Optimization; Technical Report-tr06; Erciyes University, Engineering Faculty, Computer Engineering Department: Kayseri, Turkey, 2005; Volume 200, pp. 1–10. [Google Scholar]
  32. Li, J.; Han, Y. A hybrid multi-objective artificial bee colony algorithm for flexible task scheduling problems in cloud computing system. Clust. Comput. 2020, 23, 2483–2499. [Google Scholar] [CrossRef]
  33. Meshkati, J.; Safi-esfahani, F. Energy-aware resource utilization based on particle swarm optimization and artificial bee colony algorithms in cloud computing. J. Supercomput. 2019, 75, 2455–2496. [Google Scholar] [CrossRef]
  34. Hu, P.; Ning, H.; Qiu, T.; Zhang, Y.; Luo, X. Fog Computing Based Face Identification and Resolution Scheme in Internet of Things. IEEE Trans. Ind. Inform. 2017, 13, 1910–1920. [Google Scholar] [CrossRef]
  35. Stojmenovic, I.; Wen, S.; Huang, X.Y.; Luan, H. An overview of Fog computing and its security issues. Concurr. Comput. Pract. Exp. 2016, 28, 2991–3005. [Google Scholar] [CrossRef]
  36. Deng, R.; Lu, R.; Lai, C.; Tom, H.L.; Liang, H. Optimal Workload Allocation in Fog-Cloud Computing Towards Balanced Delay and Power Consumption. IEEE Internet Things J. 2016, 3, 1171–1181. [Google Scholar] [CrossRef]
  37. Ren, Z.; Lu, T.; Wang, X.; Guo, W.; Chang, S. Resource scheduling for delay-sensitive application in three-layer fog-to-cloud architecture. Peer Peer Netw. Appl. 2020, 13, 1474–1485. [Google Scholar] [CrossRef]
  38. Sun, Y.; Lin, F.; Xu, H. Multi-objective Optimization of Resource Scheduling in Fog Computing Using an Improved NSGA-II. Wirel. Pers. Commun. 2018, 102, 1369–1385. [Google Scholar] [CrossRef]
  39. Fan, Q.; Ansari, N. Workload Allocation in Hierarchical Cloudlet Networks. IEEE Commun. Lett. 2018, 22, 820–823. [Google Scholar] [CrossRef]
Figure 1. Two-layer fog computing resource-scheduling architecture based on load balancing and task scheduling.
Electronics 12 01511 g001
Figure 2. Load-balancing process.
Electronics 12 01511 g002
Figure 3. Resource allocation communication graph between nodes.
Electronics 12 01511 g003
Figure 4. Task-scheduling process between fog clusters.
Electronics 12 01511 g004
Figure 5. Chromosome crossover was performed between the original nectar source and a nearby nectar source.
Electronics 12 01511 g005
Figure 6. The detailed steps of the PGABC–PSO resource-scheduling algorithm.
Electronics 12 01511 g006
Figure 7. Total delay varies with fog cluster number in three environments.
Electronics 12 01511 g007
Figure 8. Total energy consumption versus fog cluster number in three environments.
Electronics 12 01511 g008
Figure 9. Total system delay for the five schemes varying with task number.
Electronics 12 01511 g009
Figure 10. Total system energy consumption for the five schemes varying with task number.
Electronics 12 01511 g010
Figure 11. Total system delay of five schemes varying with fog node number.
Electronics 12 01511 g011
Figure 12. Total system energy consumption of five schemes varying with fog node number.
Electronics 12 01511 g012
Figure 13. Total delay for the four algorithms varying with fog cluster number.
Electronics 12 01511 g013
Figure 14. Total energy consumption for the four algorithms varying with fog cluster number.
Electronics 12 01511 g014
Table 1. Mathematical notation.
NotationDescription
nNumber of tasks
mTotal number of fog nodes
MNumber of fog clusters
qNumber of fog nodes in a single fog cluster
XData for a task
xpThe number of subtasks that each fog node needs to handle in the fog cluster
tTime required for fog cluster to process a single task
λFog node calculation rate
bFog node bandwidth
τTransmission speed between fog nodes
eTotal energy consumption of a fog cluster processing a single task
PtranTransmission energy consumption per second between fog nodes
PcompUnit calculation energy consumption of fog node processing data
fiQuad representation of the ith fog node
FIBinary representation of the Ith fog cluster
rkTriple representation of the kth task
axiAbscissa of the ith fog node
oyiOrdinate of the ith fog node
BIAverage bandwidth of the Ith fog cluster
CIThe total computing resources of the Ith fog cluster
SMapping matrix between a task and a fog cluster
emFog cluster and task energy consumption matrix
tmFog cluster and task delay matrix
MnSet of tasks assigned by M fog clusters
T I e x e Computation time of the set of tasks assigned on the Ith cluster
T I j w a i t Waiting time of the jth task in fog cluster I
TIjTotal time from uploading to completion of task j in fog cluster I
TnIThe time it takes fog cluster I to process the assigned task
TTotal time for the entire fog system to complete all tasks
EEnergy consumption of the entire fog system for all tasks
QwaitUnit waiting energy consumption of tasks
Table 2. Time and resource complexities of methods.
AlgorithmTime ComplexityResource Complexity
PSOO(Max(q Np, Np, MP NP))O(q Np)
PGABCO(Max(nPop, Maxcycle nPop n, Maxcycle n0nlooker n))O(n gene nPop + 2M + n)
PGABC–PSO O(Max(q Np m n, Np m n, MP NP m n, nPop, Maxcycle nPop n, Maxcycle n0nlooker n))O(2n + 4m + 2M)+ O(m n q Np) + O(n gene nPop + 2M + n) + O(n)
Table 3. Resource-scheduling algorithm simulation parameter settings.
Parameter SymbolValue RangeDefinition
n[20, 200]Number of tasks
m[50, 250]Number of fog nodes
b[50, 200] MHzFog node bandwidth
λ[10, 60] MB/sFog node calculation rate
M[6, 14]Number of fog clusters
wp0.65Inertial weight
c1p0.8Individual learning factor
c2p1.7Social learning factor
N40Number of particles in PSO
MP40Iterations of PSO
nPop40Employed bee/scout bee
n0nlooker20Observation bee
c11Individual learning factor
c22Social learning factor
w0.2Inertial weight
a0.95Acceleration factor
Var0.01Mutation probability
Maxcycle500Iteration times
Ptran0.2 J/sUnit transmission energy consumption
Pcomp0.05 J/sUnit calculated energy consumption
Qwait0.01 J/(s·MB)Unit waiting energy consumption
Table 4. The delay and energy consumption of the five strategies when the number of tasks was 20 or 200 and the fog node was 100.
AlgorithmNumber of TasksTime Delay/sEnergy Consumption/J
PGABC–PSO 2044140
2003673057
SJF–PSO2064155
2005123217
PGABC-R2061210
2005194240
HSF.ABC&PSO2061206
2005044161
MFO2059199
2004704148
Table 5. The delay and energy consumption calculated using the five strategies when the number of fog nodes was 50 and 250.
AlgorithmNumber of Fog NodesTime Delay/sEnergy Consumption/J
PGABC–PSO 503782290
25097531
SJF–PSO505072457
250119525
PGABC-R504912959
250163836
HSF.ABC&PSO504472888
250157837
MFO504462906
250148835
Table 6. The optimization results of each algorithm for the delay and energy consumption when the quantity of fog clusters was 13.
AlgorithmTime Delay/sEnergy Consumption/J
PGABC1911205
GABC1931254
ABC2271290
PSO2671378
Disclaimer/Publisher’s Note: The statements, opinions and data contained in all publications are solely those of the individual author(s) and contributor(s) and not of MDPI and/or the editor(s). MDPI and/or the editor(s) disclaim responsibility for any injury to people or property resulting from any ideas, methods, instructions or products referred to in the content.