Article

UAV Abnormal State Detection Model Based on Timestamp Slice and Multi-Separable CNN

School of Computer Science, China West Normal University, Nanchong 637002, China
*
Author to whom correspondence should be addressed.
Electronics 2023, 12(6), 1299; https://doi.org/10.3390/electronics12061299
Submission received: 2 February 2023 / Revised: 1 March 2023 / Accepted: 7 March 2023 / Published: 8 March 2023
(This article belongs to the Special Issue Advances in Intelligent Data Analysis and Its Applications)

Abstract

:
With the rapid development of UAVs (Unmanned Aerial Vehicles), abnormal state detection has become a critical technology to ensure the flight safety of UAVs. The position and orientation system (POS) data, etc., used to evaluate UAV flight status are from different sensors. The traditional abnormal state detection model ignores the difference of POS data in the frequency domain during feature learning, which leads to the loss of key feature information and limits the further improvement of detection performance. To deal with this and improve UAV flight safety, this paper presents a method for detecting the abnormal state of a UAV based on a timestamp slice and multi-separable convolutional neural network (TS-MSCNN). Firstly, TS-MSCNN divides the POS data reasonably in the time domain by setting a set of specific timestamps and then extracts and fuses the key features to avoid the loss of feature information. Secondly, TS-MSCNN converts these feature data into grayscale images by data reconstruction. Lastly, TS-MSCNN utilizes a multi-separable convolution neural network (MSCNN) to learn key features more effectively. The binary and multi-classification experiments conducted on the real flight data, Air Lab Fault and Anomaly (ALFA), demonstrate that the TS-MSCNN outperforms traditional machine learning (ML) and the latest deep learning methods in terms of accuracy.

1. Introduction

With the development of unmanned aerial vehicles (UAVs), their applications in civilian and military fields have expanded, including agriculture [1], transportation [2], and fire protection [3]. However, as UAVs play an increasingly important role, their flight safety problems have become more prominent [4]. Network attacks can lead to UAV failures, and physical component failures such as elevators and rudders can also affect UAV flight safety. For example, in June 2020, a US Air Force MQ-9 “Death” UAV crashed in Africa, causing a loss of USD 11.29 million [5]. In February 2022, a DJI civilian UAV crashed out of control, resulting in a personal economic loss of up to 16,300 RMB [6]. According to the Civil Aviation Administration of China, the number of registered UAVs in China alone has reached 8.3 million [7]. Therefore, it is necessary to establish a UAV safety detection model to ensure the safety and reliability of UAV flights. Improving the flight safety of UAVs has become a major research topic in the field of UAVs. Currently, a common method to ensure UAV flight safety is to monitor UAV flight data for anomalies [8]. Abnormal flight data indicates that the UAV may have hardware failure or misoperation, and timely identification of the cause of the failure can effectively prevent UAV flight accidents. Figure 1 shows the main components of a typical UAV anomaly detection system.
UAV flight data is mainly extracted from attitude estimation data of different UAV sensors [9,10], which include the POS data and the system status (SS) data. These data enable the detection of UAV flight status. The POS data consists of a triple of values in the x, y, and z directions, while the SS data contains only a single value. Additionally, these data are closely related to UAV guidance, navigation, and control (GNC) [11,12]. The early UAV anomaly detection method was based on flight data rules; however, the rule-based anomaly detection method has a low detection performance [13]. To better ensure the flight safety of UAVs, ML and deep learning methods have been introduced into the research field of UAV safety. The development of these methods has opened up new ideas for the research of UAV anomaly detection. However, the traditional anomaly detection method ignored the difference between POS data and SS data used to evaluate the flight status of UAVs in the frequency domain, resulting in the loss of some key feature information in-flight data. This limitation restricts the performance of UAV anomaly detection models. To address these problems, this paper proposes a method of extracting frequency domain information by setting timestamp slices and proposes a UAV anomaly detection model based on a multi-separable convolution neural network fusion method. It should be noted that this paper takes the time of UAV failure as the dividing point and does not consider the recovery process.
In the next part of this paper, Section 2 describes the related research. Section 3 introduces the processing method of the ALFA dataset [14] and proposes the TS-MSCNN anomaly detection model. Section 4 carries out experiments from various angles and analyzes the experimental results of binary and multi-class classification. The final section provides a summary and conclusion of this paper.

2. Related Works

This section provides a review of research related to UAV anomaly detection, covering rule-based algorithms and those based on ML and deep learning methods.
Regarding rule-based algorithms, Chen et al. [15] investigated the impact of attackers’ behavior on the effectiveness of malware detection technology and proposed a specification-based intrusion detection system that showed effective detection with high probability and low false positives. Mitchell et al. [16] considered seven threat models and proposed a specification-based intrusion detection system with specific adaptability and low runtime resource consumption. Sedjelmaci et al. [17] studied four attacks—false information propagation, GPS deception, jamming, and black hole and gray hole attacks—and designed and implemented a new intrusion detection scheme with an efficient and lightweight response, which showed high detection rates, low false alarm rates, and low communication overhead. This scheme was also able to detect attacks well in situations involving many UAVs and attackers.
In terms of the UAV anomaly detection model based on traditional ML methods, Liu et al. [18] proposed a real-time UAV anomaly detection method based on the KNN algorithm for the UAV flight sensor data stream in 2015, which has high efficiency and high accuracy. In 2016, Senouci et al. [19] focused on the two main problems of intrusion detection and attacker pop-up in the UAV-assisted network. The Bayesian game model was used to balance the intrusion detection rate and intrusion detection resource consumption. This method achieved a high detection rate and a low false positive rate. In 2019, Keifour et al. [20] released an initial version of the ALFA dataset [13] and proposed a real-time UAV anomaly detection model using the least squares method. This method does not need to assume a specific aircraft model and can detect multiple types of faults and anomalies. In 2021, Shrestha et al. [21] simulated a 5G network and UAV environment through the CSE-CIC-IDS-2018 network dataset, established a model for intrusion detection based on the ML algorithm, and also implemented the model based on ML into ground or satellite gateways. This research proves that the ML algorithm can be used to classify benign or malicious packets in UAV networks to enhance security.
However, some outliers can be difficult to detect using traditional machine learning (ML) techniques [22]. To address this challenge, deep learning (DL) methods have been increasingly used to improve the detection accuracy of UAV anomalies, especially when processing high-dimensional UAV flight data. In 2021, Park et al. [23] proposed a UAV anomaly detection model using a stacking autoencoder to address the limitations of the current rule-based model. This model mainly judges the normal and abnormal conditions of data through the loss of data reconstruction. The experimental results on different UAV data demonstrate the effectiveness of the proposed model. In 2022, Abu et al. [24] proposed UAV intrusion detection models in homogeneous and heterogeneous UAV network environments based on a convolutional neural network (CNN) using three types of UAV WIFI data records. The final experimental results demonstrate the effectiveness of the proposed model. Dudukcu et al. [25] utilized power consumption data and simple moving average data of the UAV battery sensor as the multivariate input of the time-domain convolution network to identify the anomaly of the instantaneous power consumption of the UAV battery. The simulation results show that the time-domain convolutional network can achieve good results in instantaneous power consumption prediction and anomaly detection when combining simple moving average data and UAV sensor data. In addition, some studies have explored the use of probability models, time series data, and data dimensions for anomaly detection, achieving effective results [26,27,28], which have important implications for this study.
All of the previously mentioned methods have been successful in detecting anomalies, but they have not taken into account the differences between the POS data and SS data used to evaluate UAV flight status in the frequency domain. This has resulted in the loss of some key feature information in the flight data, which limits the improvement of anomaly detection model performance. The differences in the frequency domain can be seen in two aspects: first, the feature information amount of the POS data and the SS data in the frequency domain is inconsistent in the same time domain; second, the data structure is different. The feature of POS data in the frequency domain is triple, while SS data is a single value. When the amount of feature information is inconsistent, a feature vector with variable length is generated, which leads to the loss of key feature information in the model training process. Additionally, the difference in data structure causes POS data and SS data to lose some key information due to the confusion of feature information during the anomaly detection model’s feature extraction process.
To address the issues mentioned above, this paper proposes several solutions. Firstly, a specific timestamp size is set, and the frequency domain information of UAV data is divided and extracted to fuse key feature information, addressing the problem of inconsistency between POS data and SS data in the frequency domain. Secondly, POS and SS data are reconstructed into grayscale images. Lastly, the MSCNN is utilized to learn and fuse the key features of POS and SS data, overcoming the problem of key feature information loss caused by the structural differences between POS data and SS data. The following sections will provide a detailed description of these solutions.

3. TS-MSCNN Model Design

Taking into account the analysis presented above, this section proposes a TS-MSCNN anomaly detection model, which consists of two main components: a time stamp slice-based frequency domain information processing method for extracting and fusing key features of UAV flight data, and an MSCNN-based anomaly detection method for learning and fusing flight data features. The processing flow of the TS-MSCNN model is illustrated in Figure 2. The subsequent section will provide a detailed description of the model design.

3.1. UAV Flight Data Processing Methods

3.1.1. Analysis of ALFA Dataset

The ALFA dataset comprises the original flight log of a fixed-wing UAV that operated in a real flight environment and can be roughly classified into five categories: no failure, engine failure, rudder failure, elevator failure, and aileron failure. The UAV was flown at Pittsburgh Airport in the United States. The dataset includes two types of data: SS data with only one numerical dimension and POS data with three numerical dimensions. The POS data contains latitude, longitude, elevation, heading angle (Phi), pitch angle (Omega), and roll angle (Kappa) data obtained during the UAV flight, which are mainly represented by different values in the X, Y, and Z directions. The original UAV flight log contains a multitude of features, which are not conducive to model training. Therefore, this paper uses the feature selection method in [23] to obtain the key features of UAV flight data shown in Table 1.

3.1.2. Frequency Domain Information Extraction and Fusion Method Based on Timestamp Slices

The frequency domain information of the original UAV data in the same time domain is different, so the fixed length feature vector cannot be formed, which leads to the loss of key feature information in the model training process. Suppose that at time t, by observing the temperature information of the UAV battery, ftemperature can be expressed as a binary, that is, ftemperature = {temp1, temp2}. At different times, the value of the ftemperature binary is different. According to the above representation, other flight data information from UAV, such as fluid pressure and magnetic field value, can be expressed as corresponding characteristic tuples, namely fpressure = {pre1, pre2, pre3, pre4}, fmagnetic = {mag1, mag2, mag3, mag4, mag5, mag6}. These feature tuples are marked with inconsistent frequency domain feature information at the same time (as shown in Figure 3a). During the calculation process, features with more frequency domain information will cover other feature information values, leading to the loss of key information. Therefore, this paper will process based on the following methods.
Step 1: Feature information extraction in the frequency domain.
select(feature)= {vij| when t = tk and (index (vij & tk) ≠ index (vij & tk−1))}
where vij represents the characteristic value, i represents the characteristic number, j represents the characteristic value number, index() represents the index of the characteristic value in the frequency domain, and tk represents the time.
Step 2: Frequency domain information fusion.
v = {select(feature0)∪select(feature1)…∪select(featuren)|when t = tk}
where n represents the characteristic number and tk represents the time.
Figure 3b illustrates the results of information extraction and fusion at different time points. It shows that the same feature has different index positions in different timestamps, which preserves the differences between features in different time domains and enables the maximum amount of information to be obtained. In real UAV log data, POS data and other values change significantly, and there are more characteristic data in the same timestamp than in the SS data. Therefore, this paper extracts and fuses flight log data based on Equations (1) and (2), using the time span of the feature with the least amount of data as the time stamp unit. This approach ensures the difference between different features, as well as the consistency of frequency domain information of different features in the time domain, and the frequency domain difference of the same feature in different time domains.

3.1.3. Unbalanced Data Processing

Based on the idea presented in Section 1, this paper performed information extraction and fusion on the ALFA UAV flight dataset, and the results are shown in Figure 4a. The dataset had a serious data imbalance, with the largest percentage of abnormal data for engines being 58% of the entire dataset, the minimum percentage of abnormal data for elevators being 4%, and only 12% of the data being normal. This imbalance can lead to learning deviations in the anomaly detection model, causing the model to learn the features of the data with a high proportion while only learning a few features from the data with a low proportion. Therefore, this paper balanced the data distribution using the down-sampling method, and the resulting balanced data distribution is shown in Figure 4b.

3.1.4. Validation of Flight Data

To demonstrate the effectiveness of the obtained UAV flight data, this paper reproduces normal flight and flight with elevator failure using a UAV flight simulator. The configuration of the main parameters is shown in Table 2, and the flight path is illustrated in Figure 5. During the flight, when the elevator fails at a specific time, the UAV cannot complete the ascent and descent, so it can only maintain the same flight altitude. The trouble-free UAV completes the difficult flight activities by lifting and lowering. This paper simulates the flight trajectory of UAVs using the obtained data, and the trajectory has a noticeable difference in 2D and 3D space, thus demonstrating the difference of abnormal data of different UAVs and the effectiveness of the proposed UAV data processing method in this paper.

3.2. Design of Anomaly Detection Model

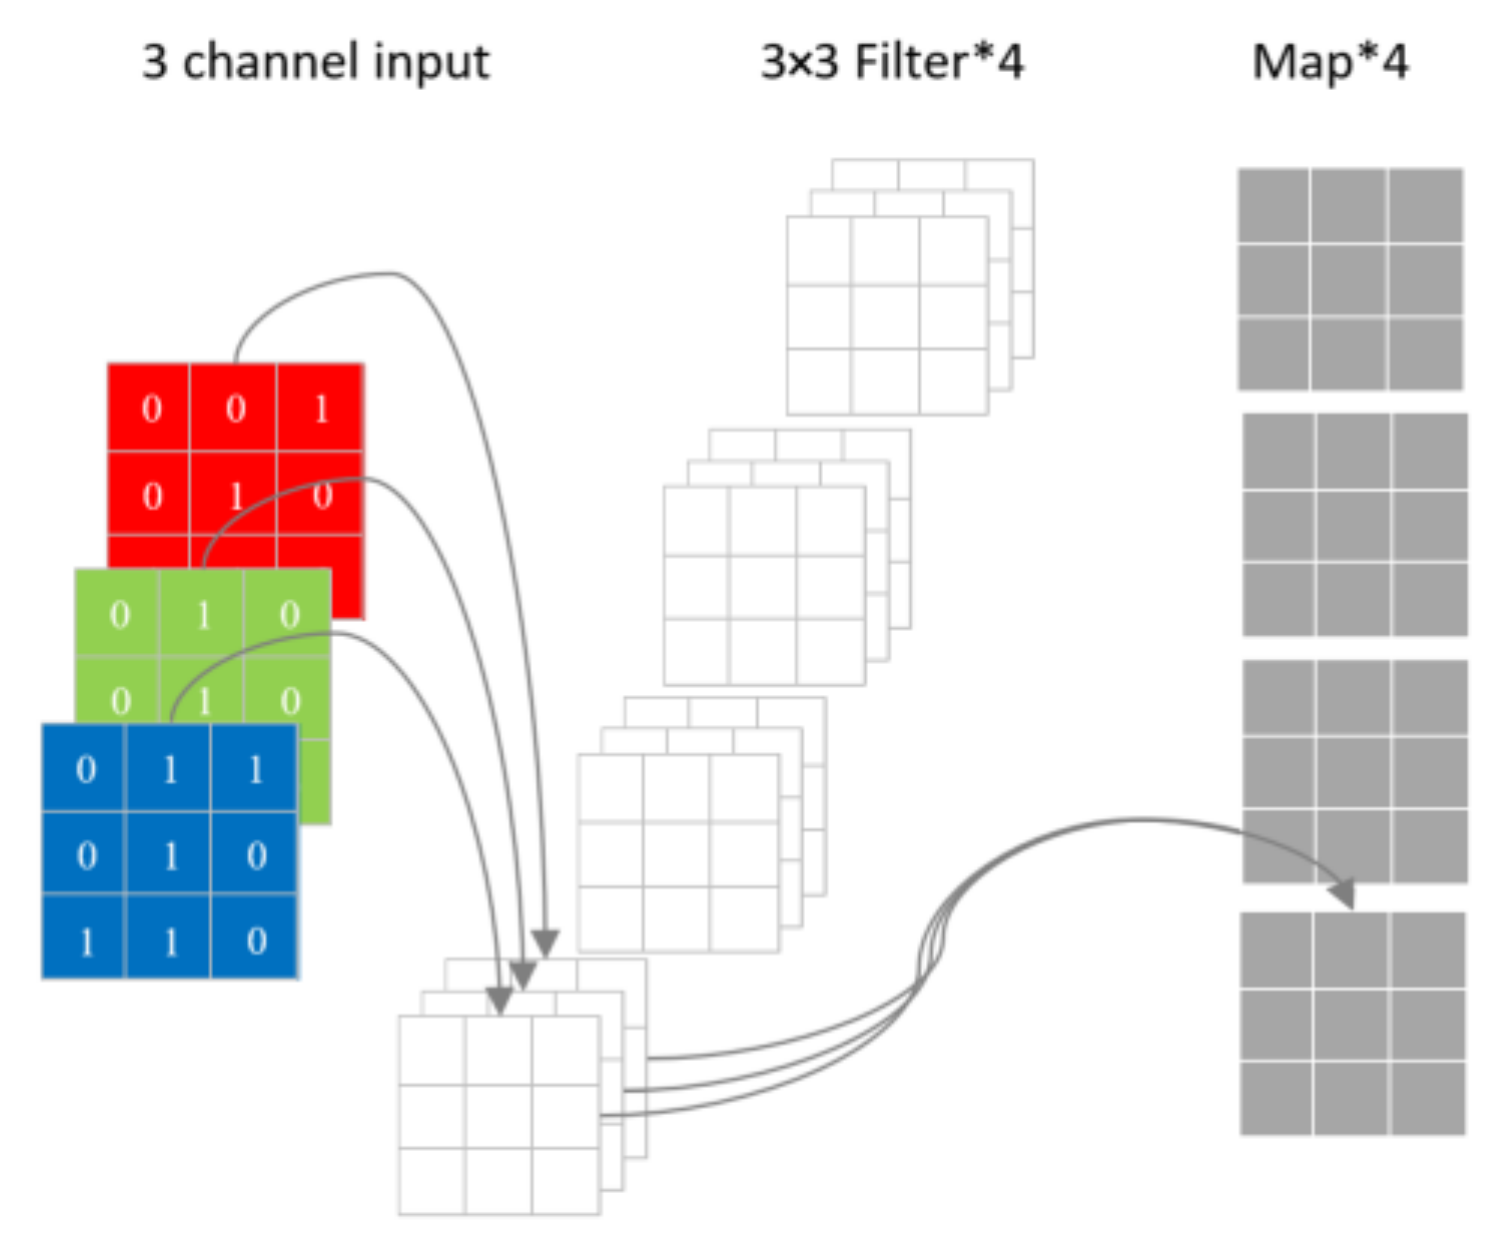
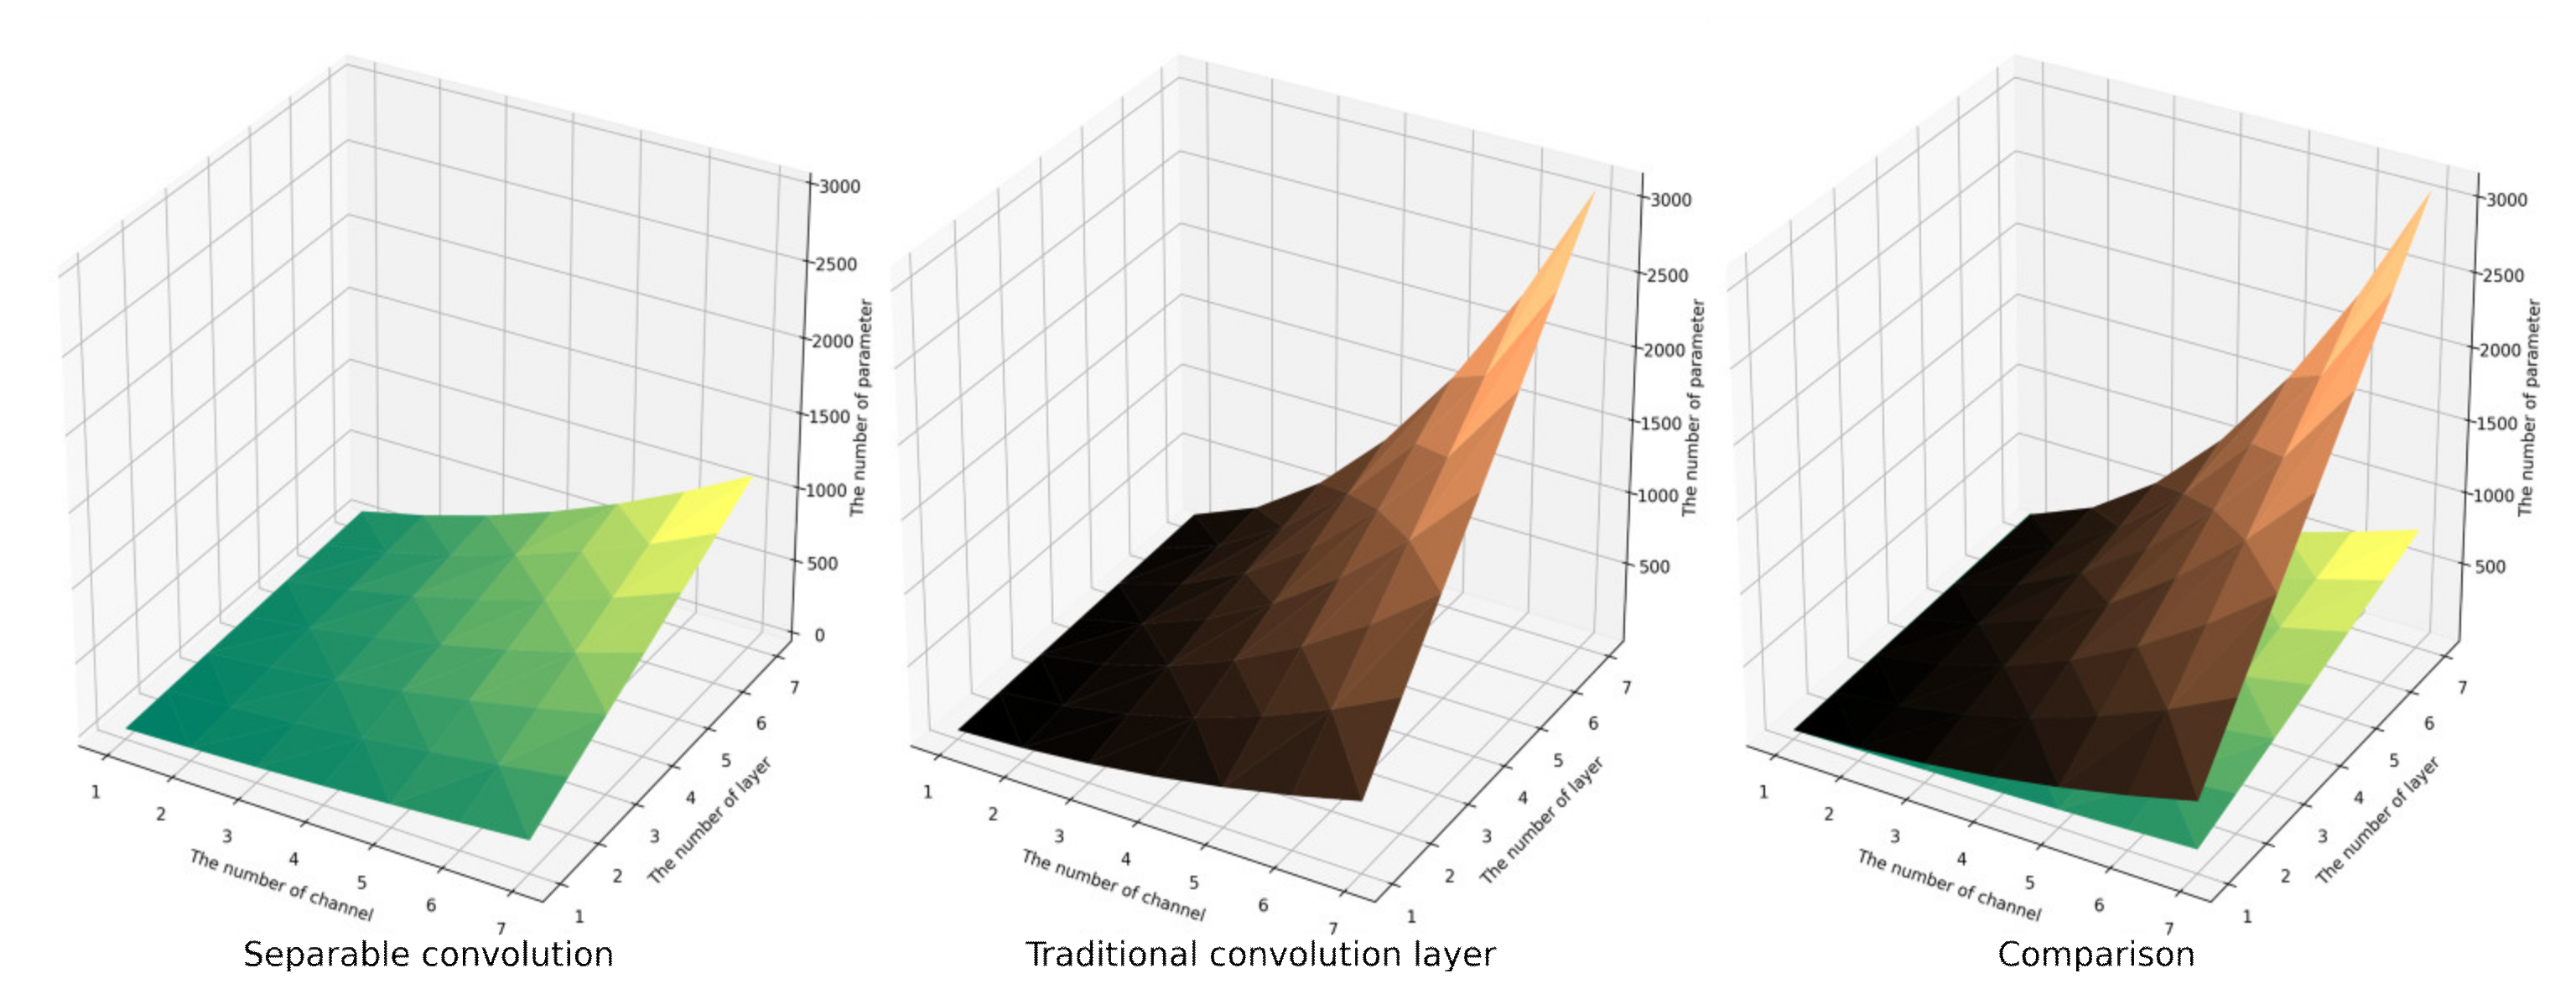
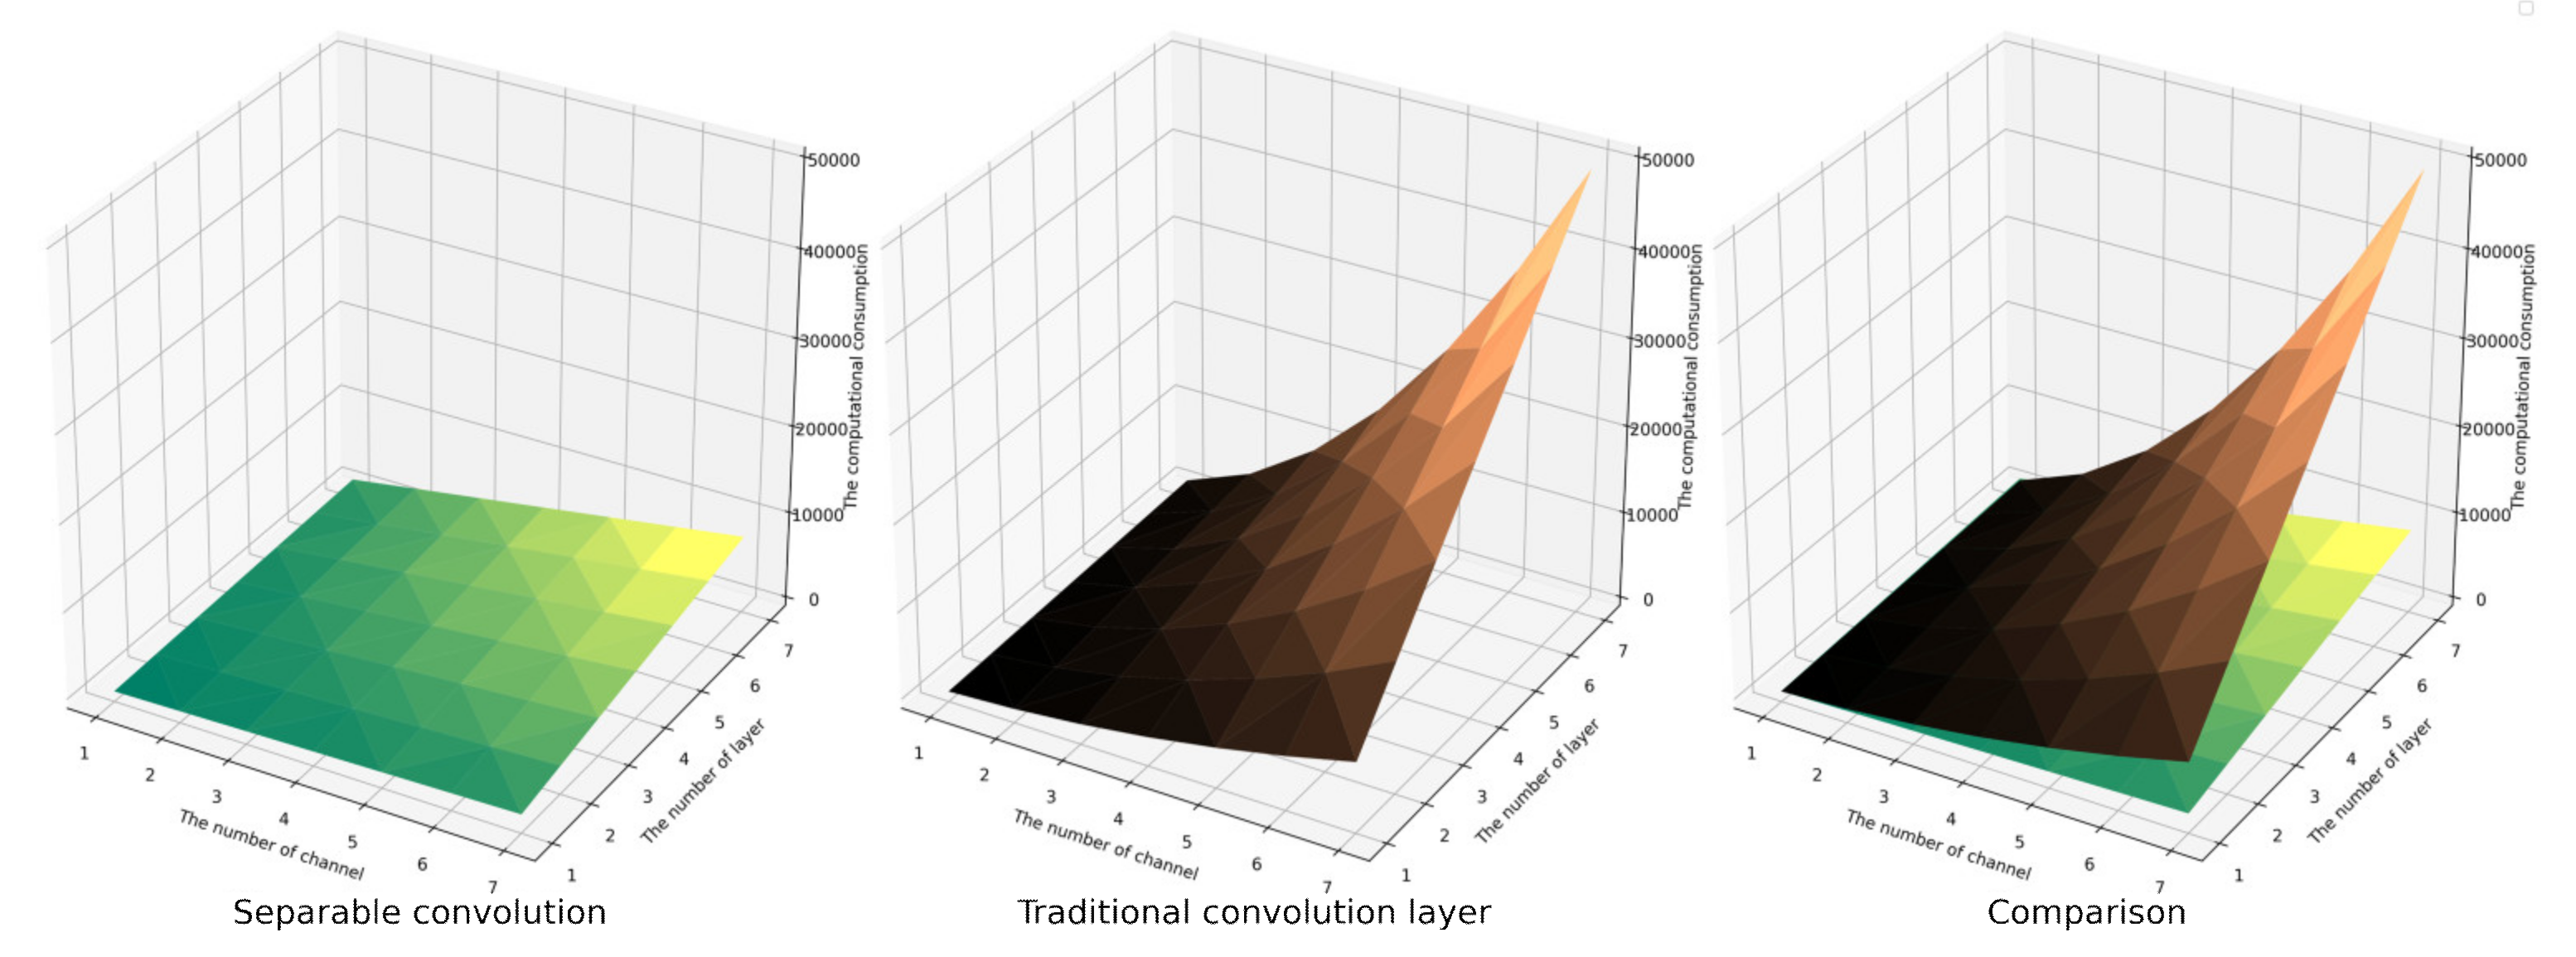
3.2.1. Separable Convolutional

The separable convolution technique offers several advantages, including fewer parameters and lower computational cost, while also exhibiting high expressiveness in the field of texture image recognition [29]. Its primary structure consists of a channel convolution kernel that has the same size as the input image and a 1 × 1 convolution kernel used to fuse the channel convolution information, as shown in Figure 6a. The structure of the separable convolutional neural network (SCNN) is shown in Figure 6b. Compared to traditional convolutional neural networks, separable convolution networks require fewer parameters and consume less computational resources while maintaining classification accuracy, as illustrated in Figure 7.
Set the input as M channels, the image size as Df_in × Df_in, the convolution kernel as N × (M × Dk × Dk), and the output feature map as N channels and size Df_out × Df_out. So, the parameters of the separable convolution are Dk × Dk × M + M × N; the parameter quantity of the conventional convolution is Dk × Dk × M × N. The calculation consumption of the separable convolution is M × Dk × Dk × Df_out × Df_out +1 × 1 × N × Df_out × Df_out; the calculation consumption of the conventional convolution is M × Dk × Dk × Df_out × Df_out × N. The comparison of parameter quantity and computational consumption between separable convolution and conventional convolution is presented in Figure 8 and Figure 9. It is evident that as the number of channels and convolution layers increases, the parameter quantity and computational consumption of the conventional convolution layer are much higher than those of the separable convolution layer, and the increase of the conventional convolution is exponential. This illustrates that the separable convolution layer can save more parameters and computational consumption than the conventional convolution layer and has a faster calculation speed. Consequently, this paper will devise an efficient model based on separable convolution.

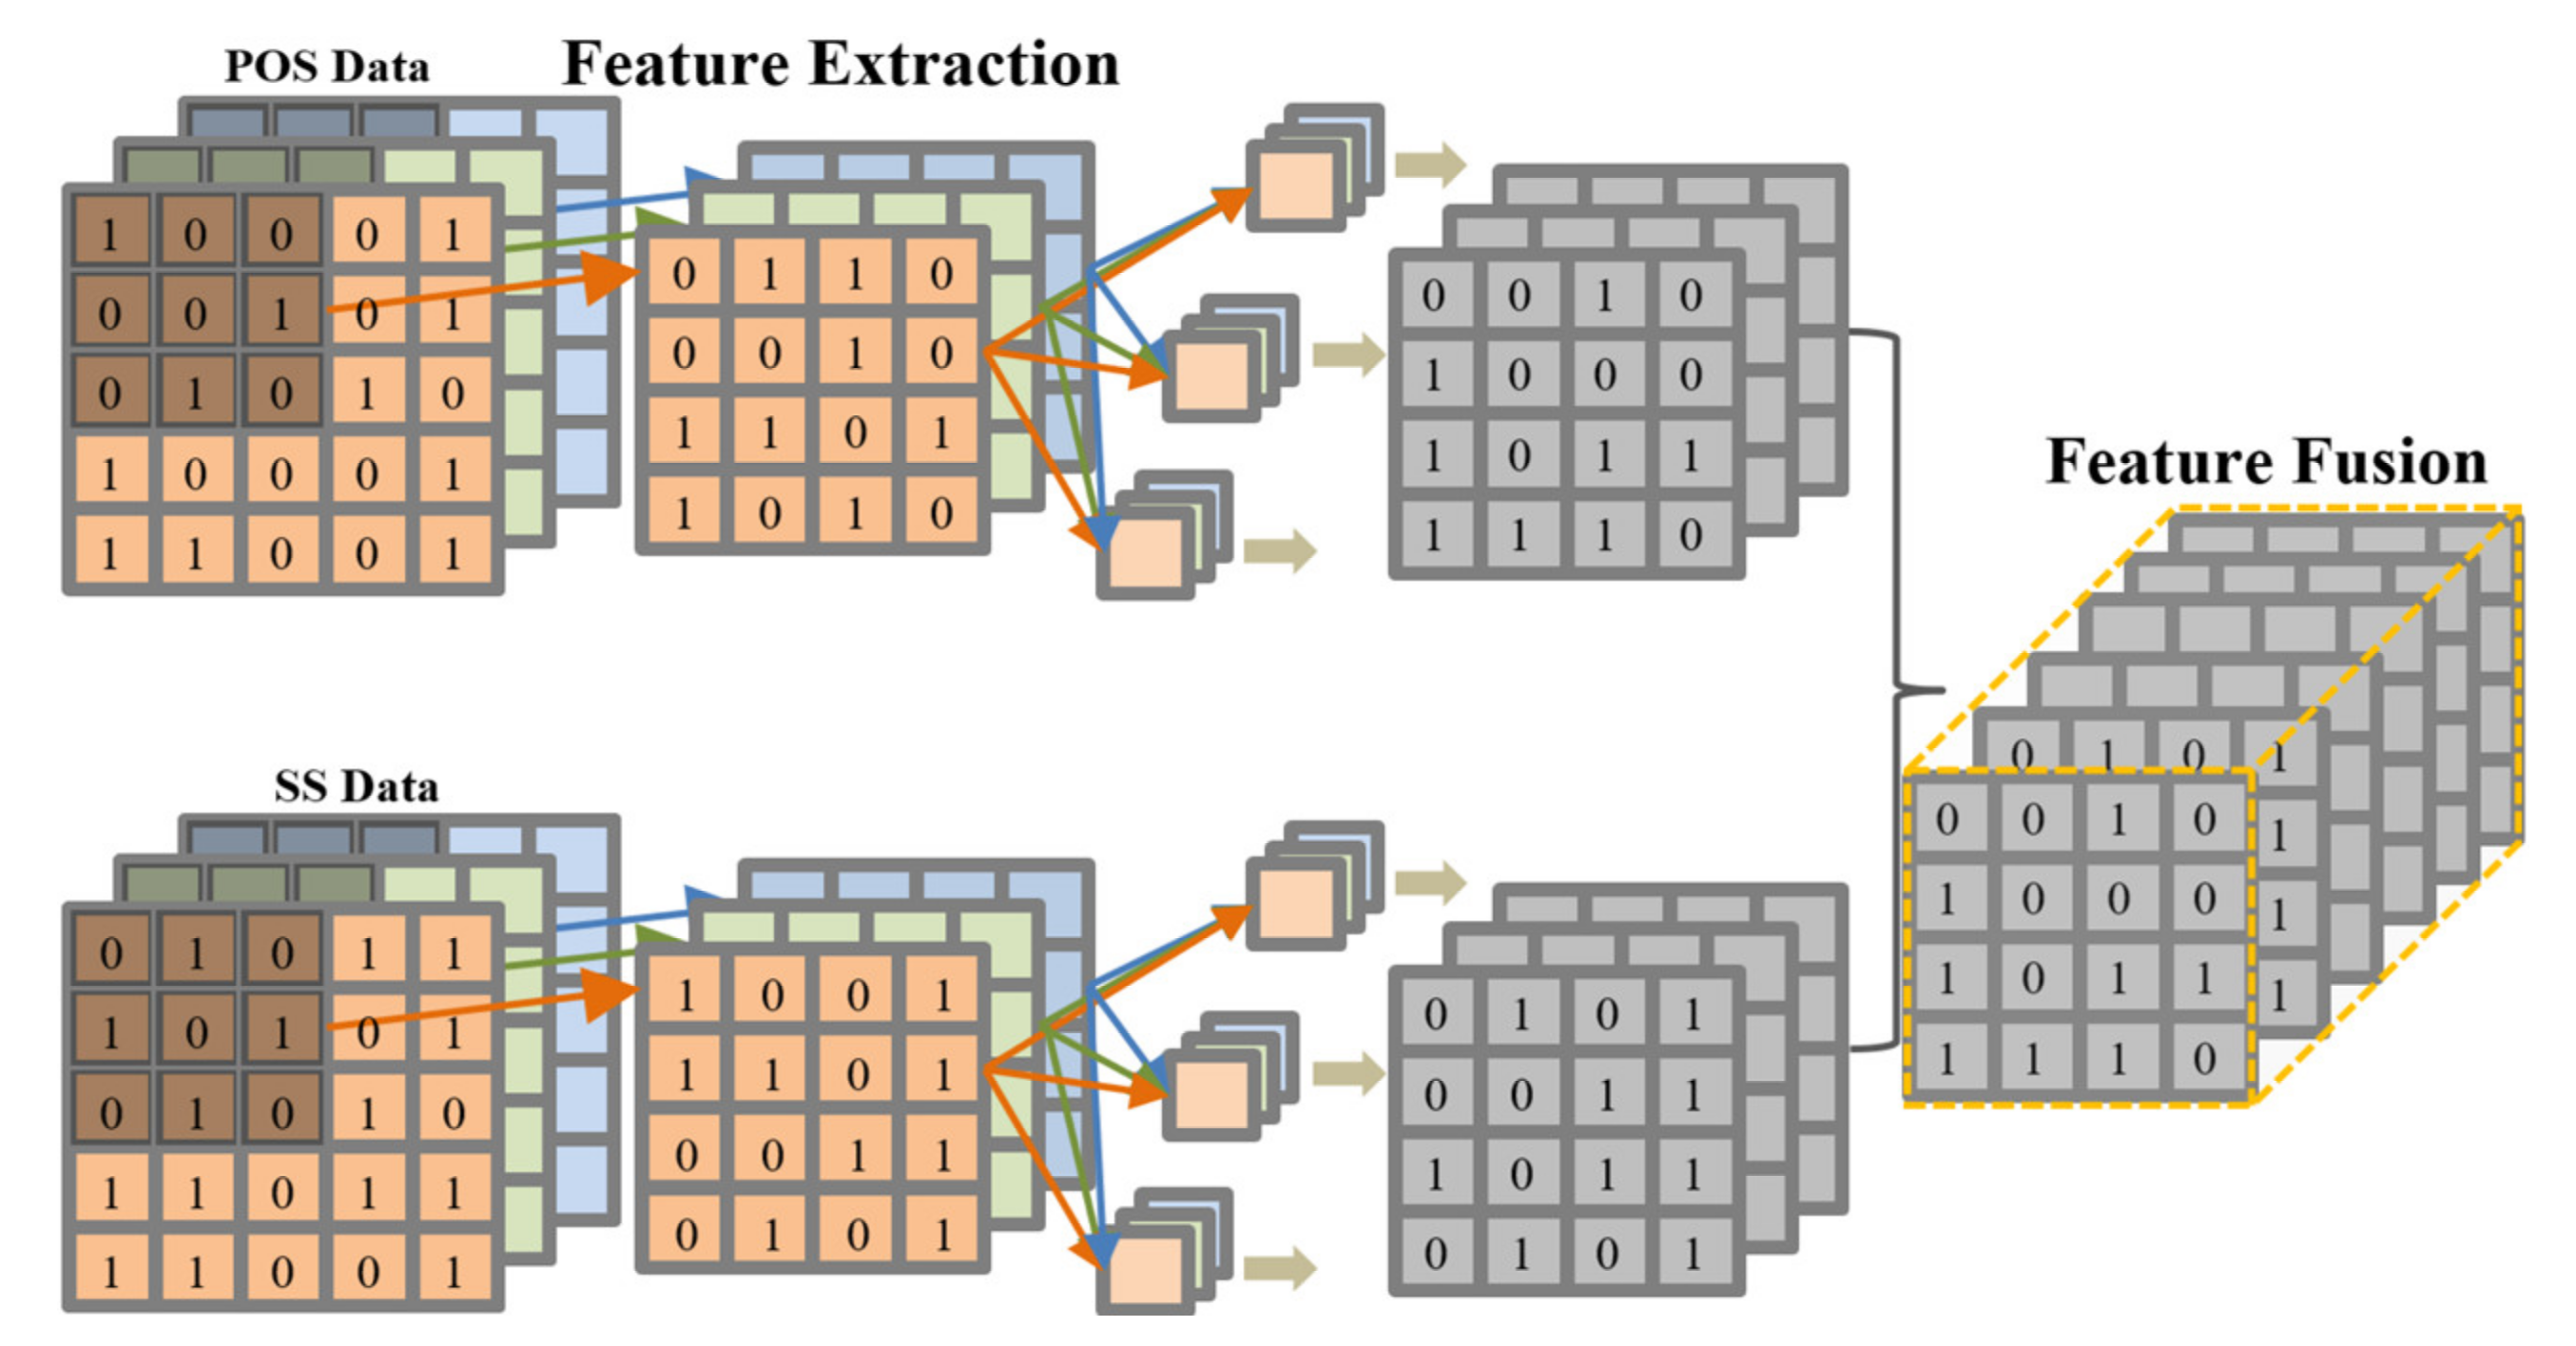
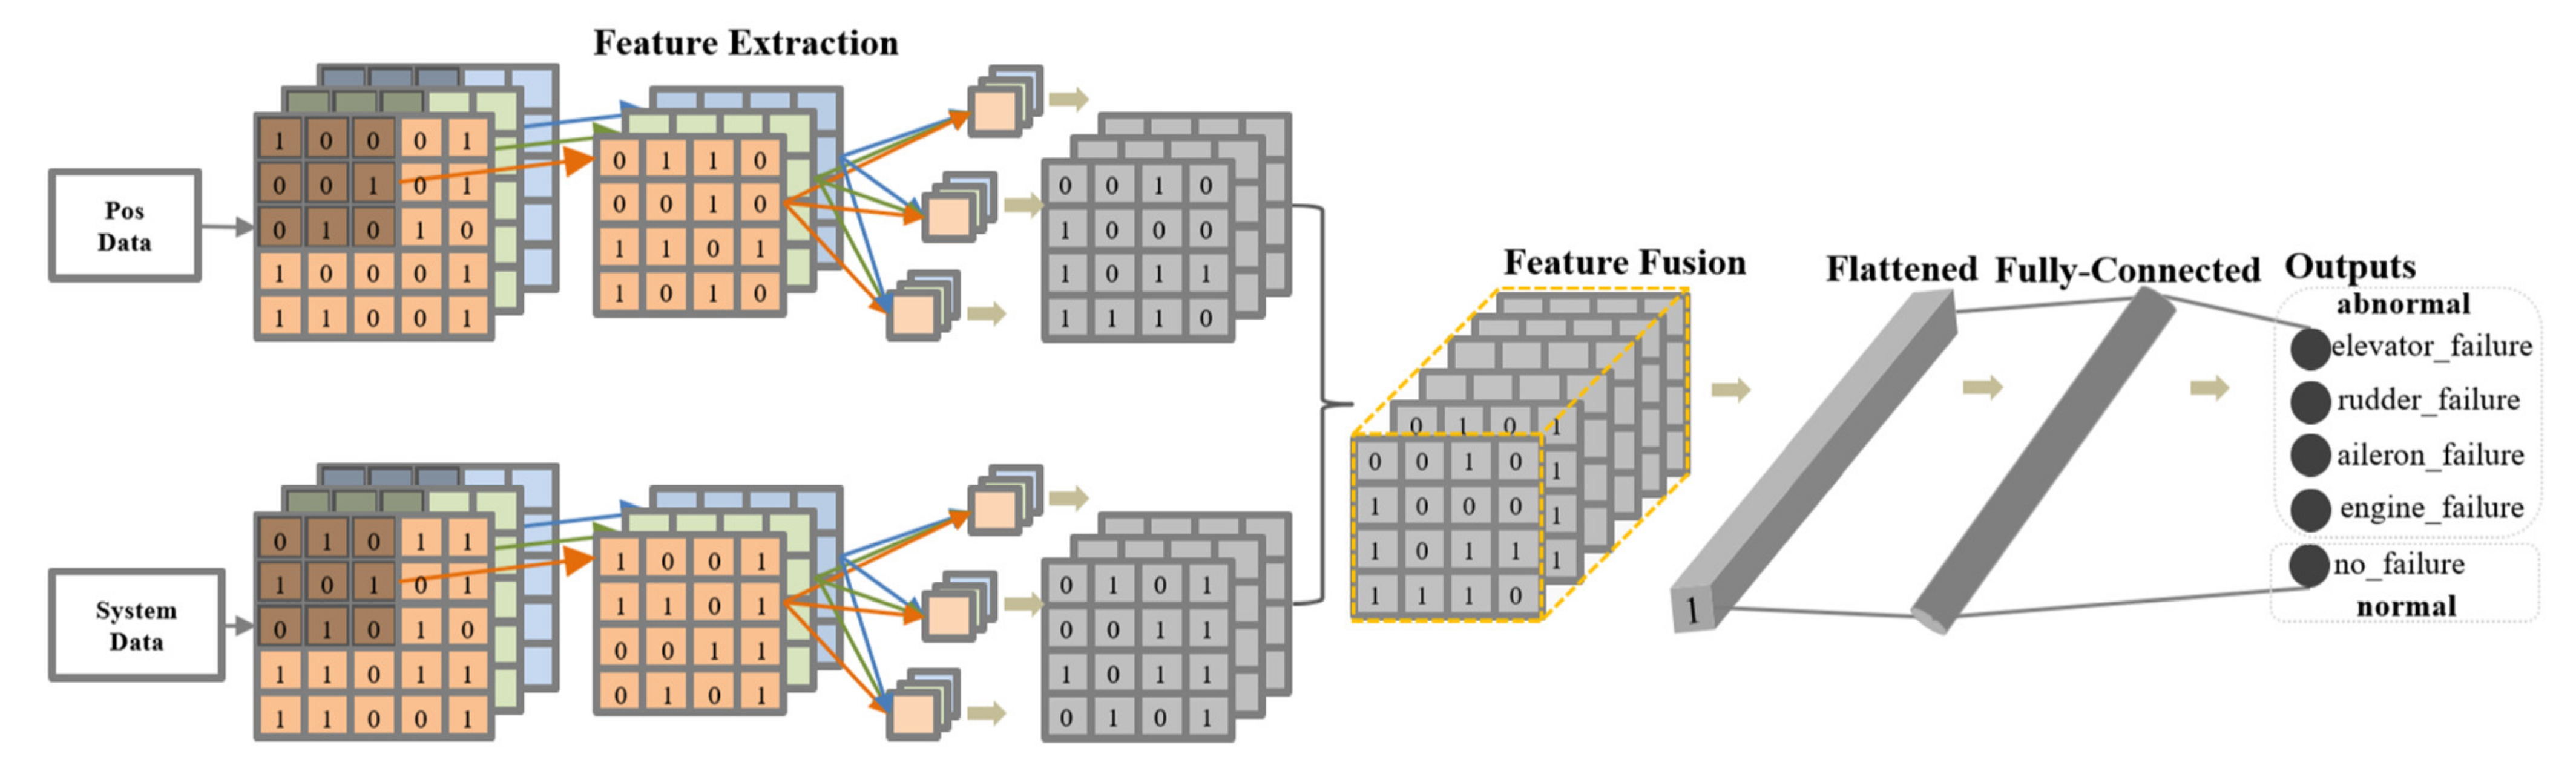
3.2.2. Feature Extraction and Fusion Layer

Based on the analysis above, this section presents the design of the feature extraction and fusion layer (FEF) for POS data and SS data in UAV flight data using separable convolution, as illustrated in Figure 10. FEF mainly consists of multi-layer parallel separable convolutions and a feature fusion layer, and the number of separable convolution layers varies for each data image. The main methods of feature extraction and fusion calculations are as follows:
f = k = 1 p m a x w c 2 k T max l = 1 c 1 k w l T x i , j + b c 1 k , 0 + b c 2 k , 0
where (i, j) is the pixel index in the feature map, xi,j is the input slice centered on the position (i, j), c is the channel index in the feature map, and p is the separable convolutional parallel number.
The FEF layer is designed to extract features from the grayscale image corresponding to the POS and SS data, and then fuse the two extracted features. The main fusion method involves concatenating the two feature maps. For instance, if there are 3 feature maps from the convolution layer for each of the POS and SS data, the resulting feature map size after fusion will be 6.

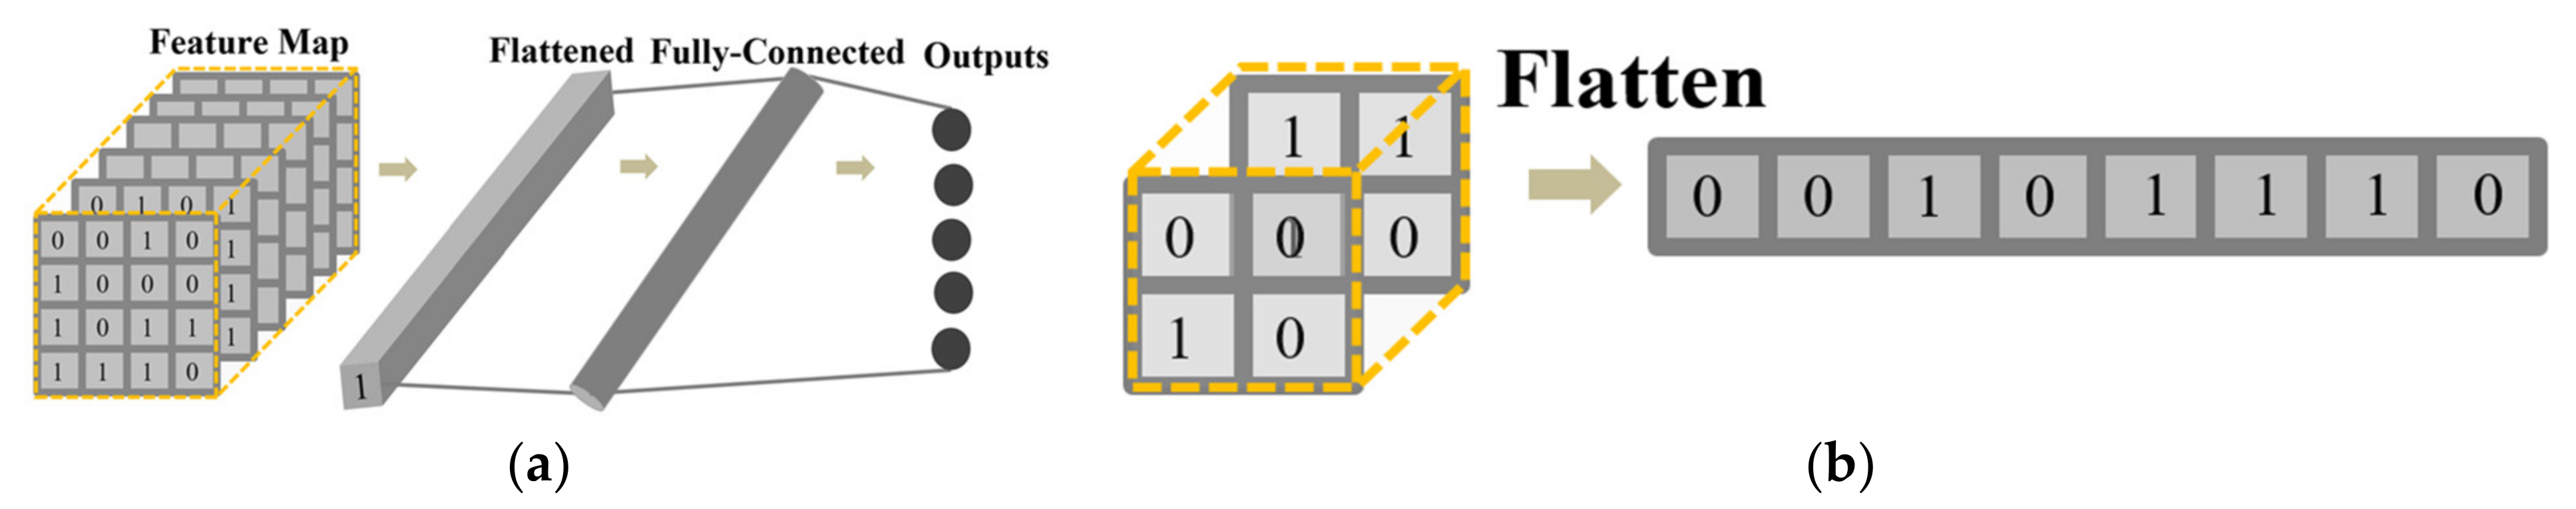
3.2.3. Feature Mapping and Classification Layer

Based on the fusion feature map of the FEF layer, this paper requires an effective feature mapping to the sample classification space. Therefore, this paper designed a Feature Mapping and Classification (FMC) layer, as illustrated in Figure 11a. The FMC layer is composed of three layers, namely the Flatten layer, the Fully Connected layer, and the Output layer. The Flatten layer maps the obtained feature map to a one-dimensional space. The Fully Connected layer acts as a classifier by fusing local information of features. The Output layer mainly uses the softmax function to map the calculated values of neurons to a probability space with a sum of 1. The working mode of the flattened layer is shown in Figure 11b. The classification calculation equation is as follows:
c l a s s = max e max w T f + b , 0 i j = 1 k e max w T f + b , 0 j | i = 1 , , k
where f’ represents one-dimensional characteristic data and k represents the number of sample categories.

3.2.4. TS-MSCNN Model Design

The complete design of the TS-MSCNN model is illustrated in Figure 12. During the training process, the model is validated using the verification set to ensure the accuracy of the training process. The loss rate threshold is set as the termination condition for the model training. Finally, the trained model is used to detect the test set and output the evaluation metrics. The process of the TS-MSCNN model, from training to anomaly detection, involves three main stages: forward propagation, backward propagation, and model testing, which can be broken down into the following six steps.
Step 1: Feature data extraction and fusion. Set the timestamp slice, extract and fuse the UAV frequency domain information through Equations (1) and (2), and obtain the fixed length UAV flight data feature vector.
Step 2: Data to image. The POS and SS data of UAV are transformed into two-dimensional grayscale images by data reconstruction to adapt to model input.
Step 3: Feature extraction and fusion. The grayscale image features of UAV POS data and SS data are extracted and fused using the FEF layer pass-through Equation (3).
Step 4: Feature mapping and classification. The feature map from the FEF layer is flattened into one-dimensional data, and then the one-dimensional feature data is mapped to the sample category space using Equation (4) to achieve classification.
Step 5: Backpropagation and parameter updating. After classification, the cross-entropy loss function is first used to calculate the loss between the predicted and actual values. The cross-entropy loss function is given as Equation (5) (where p(si) and q(si), respectively, represent the real and predicted distributions of sample i, and H represents the final loss value. Backpropagation is then carried out according to the loss value. The Adam optimizer is adopted for the backward propagation to update the weight and bias of each layer.):
H p , q = i = 1 k p c i l o g q c i
Step 6: Model testing. Input test data into the model to test the effect of the model.

4. Experiment

This study employs the PyTorch [30] deep learning library to train the TS-MSCNN and conventional CNN models. The experiments were conducted on an HP-Z480 workstation equipped with an Intel Xeon ® CPU and 64 GB of RAM. In this section, we will first introduce the evaluation metrics of the model and then demonstrate the performance of the TS-MSCNN model in binary and multi-classification tasks. We compare our model with conventional machine learning algorithms, conventional CNNs, and other relevant research results to verify its effectiveness. It should be noted that to adapt the convolutional structure for feature extraction, we convert the UAV flight data into a two-dimensional grayscale image using a data reconstruction method. Figure 13 displays the data reconstruction method and UAV image data, where the ‘ALL’ chart shows the image data used for the single model structure. The detailed experimental process will be discussed in the next section.

4.1. Evaluation Metrics

The main performance metric used in this paper is accuracy, followed by Recall, F1-score, and Precision. TPs (true positive) refers to the number of abnormal records identified as abnormal. True negative (TNs) is the number of normal records that are considered normal. False positives (FPs) are the number of normal records identified as abnormal. False negatives (FNs) are the number of abnormal records identified as normal. The performance metrics used in this paper are defined as follows.
Accuracy: the percentage of the number of correctly classified records to the total number of records, as shown in Equation (6).
Accuracy = (TP + TN)/(TP + TN + FP + FN)
Recall: Measure how many positive examples in the sample are correctly predicted, that is, the proportion of all positive examples correctly predicted, as shown in Equation (7).
Recall = TP/(TP + FN)
Precision: It is used to measure how many samples with positive prediction are real positive samples, that is, the proportion of real positive samples in the results with positive prediction, as shown in Equation (8).
Precision = TP/(TP + FP)
F1-score: The F1-score measures the harmonic mean of the precision and recall, which serves as a derived effectiveness measurement, as shown in Equation (9).
F 1 = 2 × P r e c i s i o n × R c a l l P r e c i s i o n + R c a l l

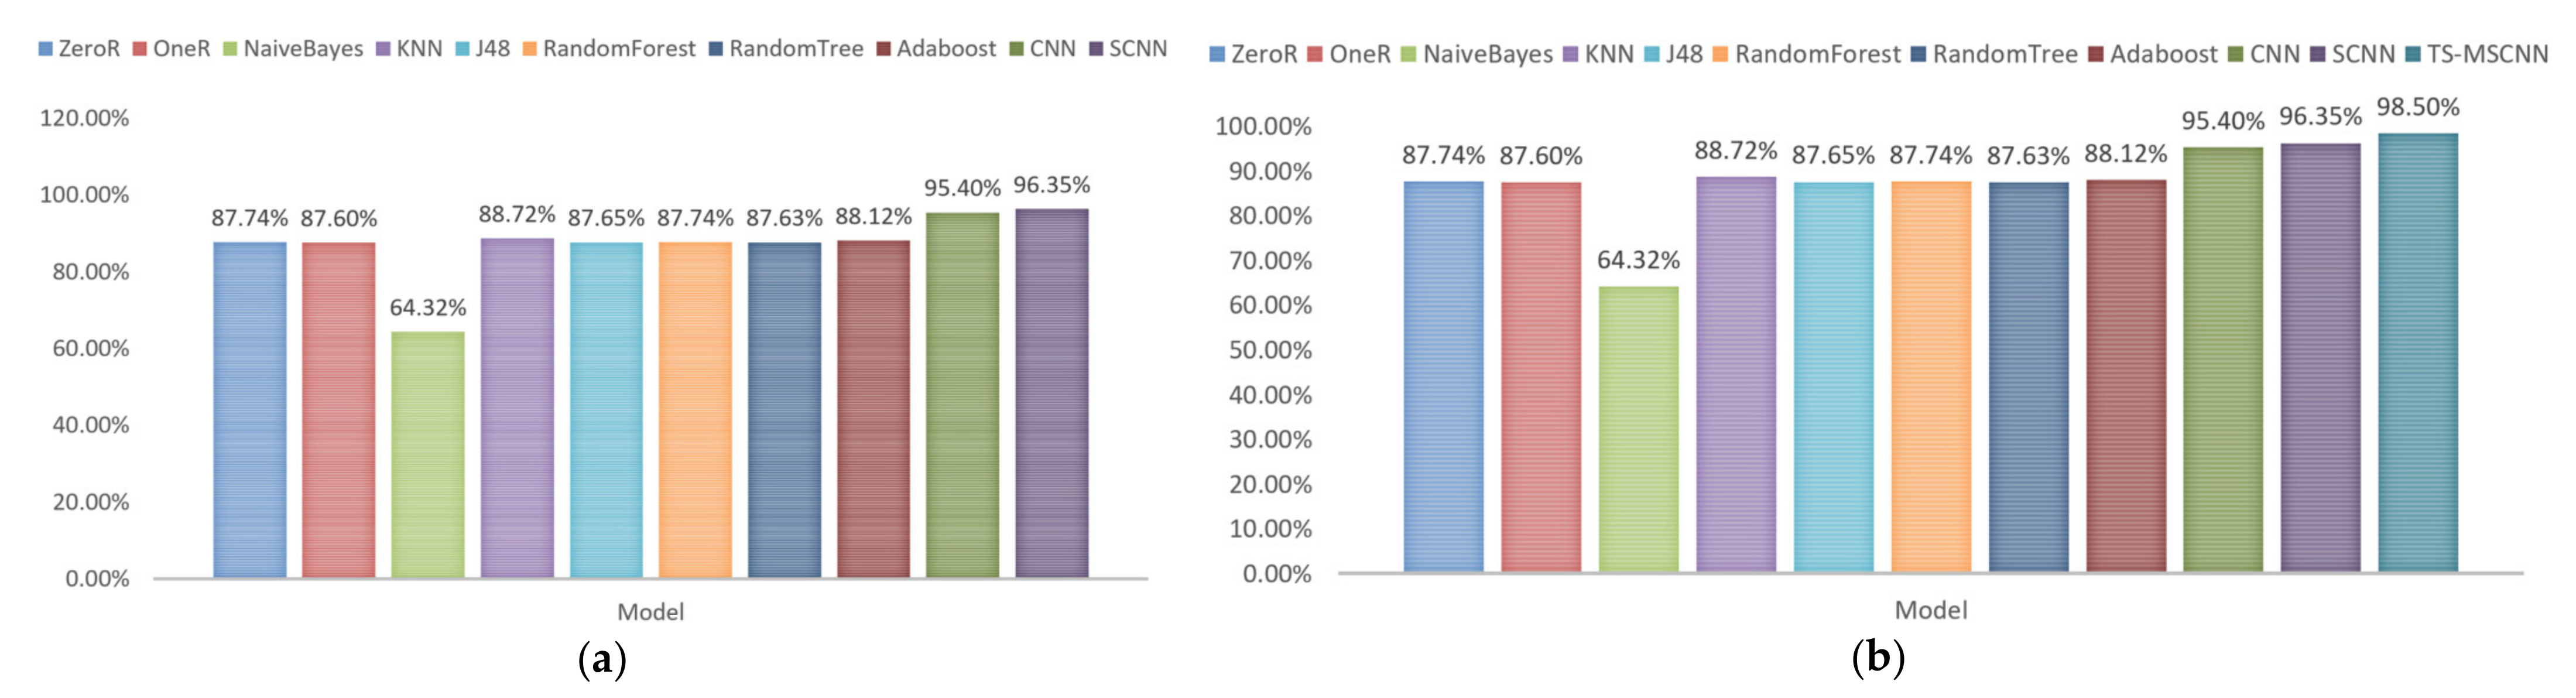
4.2. Single SCNN Model for Binary Classification

In previous research, UAV flight data has been imaged. In this section, traditional CNN and SCNN models of a single model will be trained based on UAV image data. To better train the model, this paper sets the learning rate to 0.001 and the termination loss rate of model training to 0.001. Divide the processed ALFA dataset into a training set, test set and verification set according to the ratio of 6:3:1, and classify the data set into abnormal and normal. In addition, the number of convolution layers in various models is both designed as 3. Table 3 shows the experimental result of the CNN model and SCNN model and it also shows that separable convolution ensures the validity of the model while optimizing the model parameters and computing consumption.
Next, this paper will use conventional ML methods to detect binary anomalies based on UAV flight data. Among them, the main algorithms used are ZeroR, OneR, NaiveBayes [31], KNN [32], J48 [33], RandomForest [34], RandomTree [35], and Adaboost [36]. Figure 14a shows the comparison between traditional ML algorithms and CNN and SCNN models. Additionally, the SCNN model is the best, with 96.35%. Obviously, the CNN model has great potential for detecting UAV anomalies, and it can accurately learn features from data. At the same time, the SCNN model based on separable convolution has higher accuracy.

4.3. Multi-SCNN Fusion Model for Binary Classification

To enhance the accuracy of the UAV binary anomaly detection model, this paper proposes a TS-MSCNN model that leverages the characteristics of UAV flight data. Table 4 presents the performance of CNN, SCNN, and TS-MSCNN models in terms of binary classification. The TS-MSCNN model outperforms CNN and SCNN in all metrics. Furthermore, Figure 14b compares the TS-MSCNN model with other models, showing that the TS-MSCNN model achieves superior accuracy to other comparison algorithms, with the highest accuracy rate of 98.50%. The results demonstrate that the TS-MSCNN model effectively extracts and fuses features from UAV flight data and accurately detects anomalies.

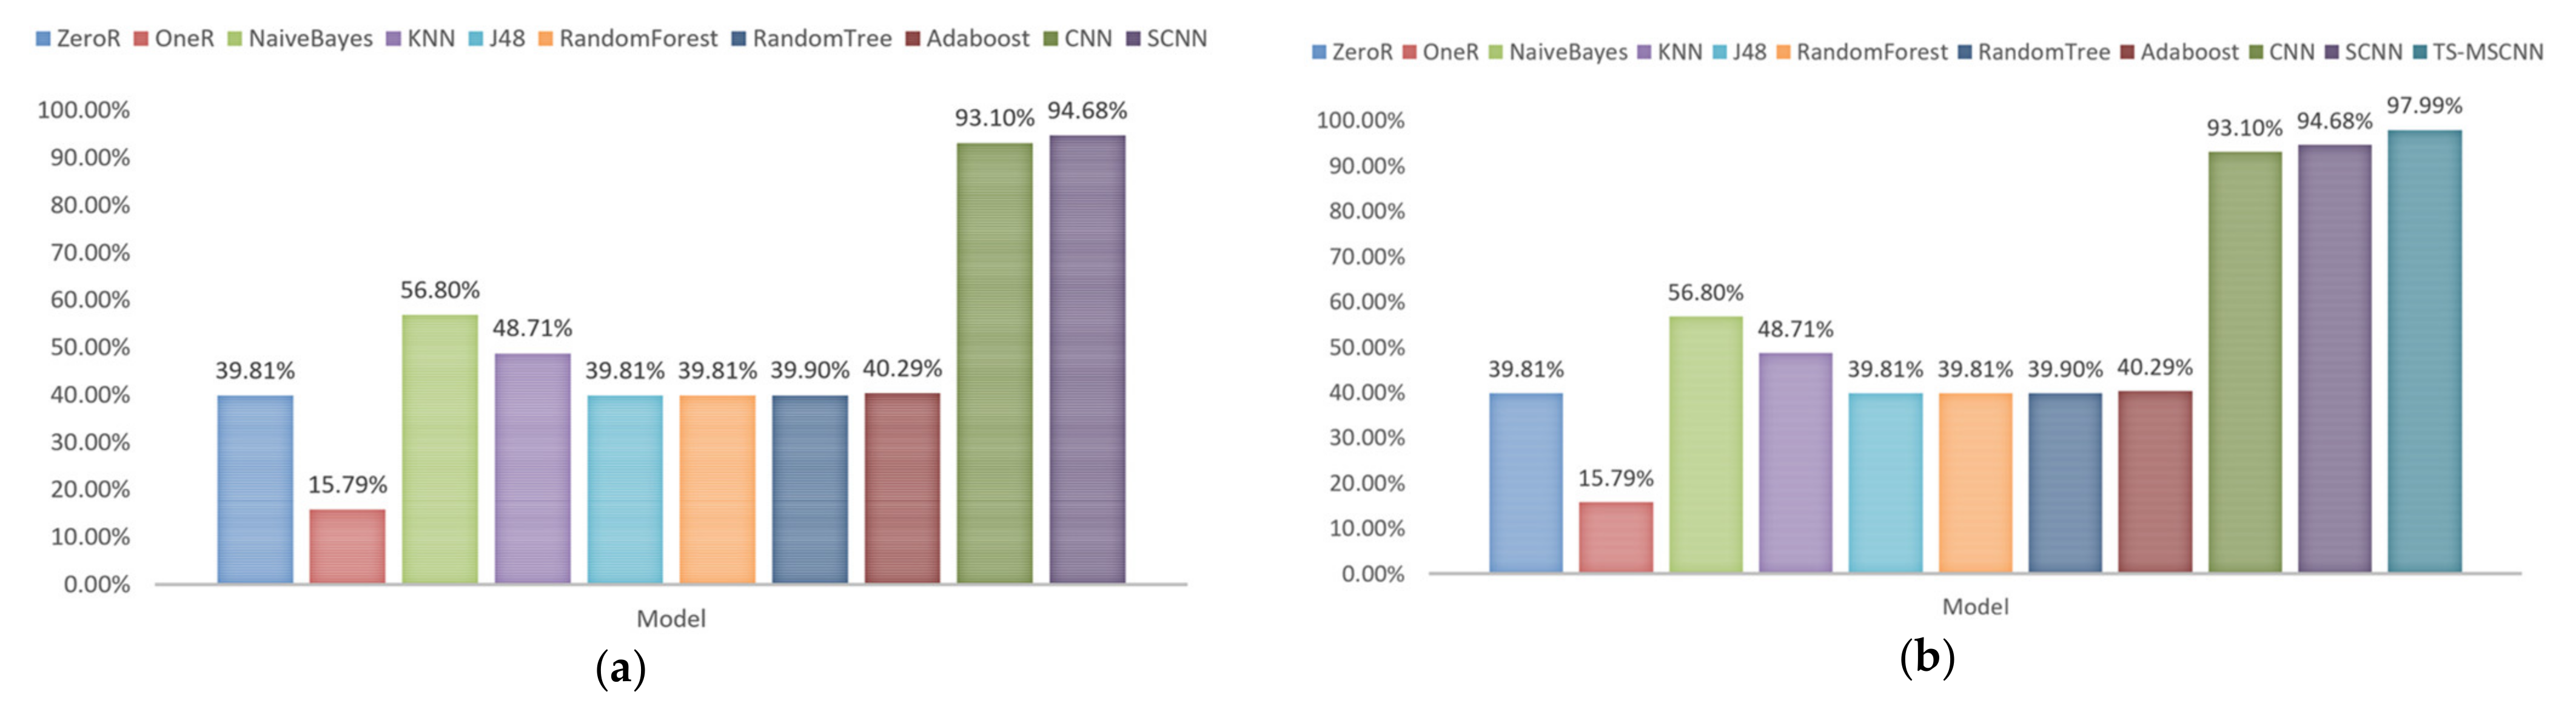
4.4. Single SCNN Model for Multiclass Classification

The objective of UAV anomaly detection is to identify UAV faults and prevent potential losses. This paper conducts a multi-class anomaly detection experiment using the ALFA dataset, which includes multiple classes of objects. The dataset contains four types of abnormal flight data and one type of normal flight data. In this section, we implement a multi-classification experiment using a single-model SCNN and present the specific experimental results in Table 5. The results show that, in the case of multi-classification, the SCNN not only optimizes the convolution structure parameters and computational consumption but also ensures the effectiveness of the model and accurately detects anomalies across multiple classes.
Furthermore, this paper also employs traditional ML methods, consistent with those used above, to detect anomalies. Figure 15a presents the experimental results. Among them, the SCNN model achieved the best performance, with 94.68%. These results indicate that the SCNN model has advantages over traditional ML methods in processing high-dimensional UAV data. Moreover, the OneR algorithm obtains the lowest accuracy rate, as it only uses a specific feature in the training data as the classification basis.

4.5. Multi-SCNN Fusion Model for Multiclass Classification

In the case of multi-classification, it has been shown that the single-structure anomaly detection model has limitations. To address this issue, this paper proposes using the feature fusion method described above to enhance the accuracy of the convolution-based anomaly detection model. The training and test sets used are consistent with those described above. Table 6 presents the detailed performance of the CNN, SCNN, and TS-MSCNN models in multi-classification. The TS-MSCNN model outperforms the CNN and SCNN models in all metrics. Furthermore, Figure 15b shows a comparison between the TS-MSCNN model and other models, where the TS-MSCNN model performs better than other comparison algorithms with the highest accuracy rate being 97.99%.
In addition, this paper compares the anomaly detection results of multi-classification and binary classification, as shown in Figure 16. It can be inferred that due to the more detailed classification of anomaly types, there are significant differences among the data types, which increases the challenge of model classification and leads to better experimental results in binary classification than in multi-classification. For the TS-MSCNN model, the results of the binary classification experiment are only 0.51 higher than those of the multi-classification experiment, which further verifies the effectiveness of the proposed TS-MSCNN model and demonstrates that it can accurately extract UAV flight data characteristics in both multi-classification and binary classification scenarios.
The research in [20] and [23] are similar to the research conducted in this paper. In order to compare the experimental results, Table 7 is presented. It is important to note that while [23] evaluates the area under the curve (AUC) of the receiver operating characteristic curve (ROC), this section supplements the AUC results for multiple classifications. The authors of [20] utilized a reduced version of the ALFA dataset, whereas [23] employed the same full version of the ALFA dataset as used in this paper. The experimental model proposed in this paper outperforms the other comparison algorithms. Overall, the experimental results show that the TS-MSCNN model proposed in this paper has achieved the desired purpose and is ready to be used for UAV flight anomaly detection.

5. Conclusions

UAV flight anomaly detection is a common safety measure to ensure the safety of UAV flights by identifying abnormal UAV flight data. However, the conventional anomaly detection model neglects the difference in POS data used to evaluate UAV flight status in the frequency domain, resulting in the loss of some crucial feature information that limits the improvement of the UAV anomaly detection model’s accuracy. Therefore, without considering the recoverable operation of UAV, this paper proposes a TS-MSCNN anomaly detection model based on timestamp slice and the MSCNN. Firstly, by setting a specific timestamp size, this paper extracts and fuses the frequency domain key features of POS data and SS data in the UAV flight log time domain. Then, the POS data and SS data are transformed into two-dimensional grayscale images to serve as the input data of the TS-SCNN model through data reconstruction. Finally, the TS-SCNN model accurately learns and fuses UAV grayscale image data features. The final experimental results demonstrate that the TS-SCNN model outperforms the comparative algorithm in the experimental results of binary classification and multi-classification, which validates the effectiveness of the TS-SCNN model proposed in this paper.
The deep learning model used in anomaly detection has a high time complexity, and UAVs typically have limited resources. Therefore, in future research, the authors of this paper will investigate a lightweight UAV anomaly detection model, taking into account both the timeliness of the anomaly detection model and the computational resources required by the model. The goal is to develop an anomaly detection model that can meet the resource constraints of UAV-embedded systems.

Author Contributions

Conceptualization, J.C. and T.Y.; methodology, J.C., T.Y. and H.D.; writing—original draft, J.C. and Y.L; validation, J.C., T.Y., H.D. and Y.L.; writing—review and editing, J.C., T.Y., H.D. and Y.L.; data curation, T.Y., H.D. and Y.L.; supervision, Y.L.; project administration, J.C and Y.L. All authors have read and agreed to the published version of the manuscript.

Funding

This work was supported by the Sichuan Science and Technology Program under Grant No. 2022YFG0322, China Scholarship Council Program (Nos. 202001010001 and 202101010003), Sichuan Science and Technology Program under Grant No. 2020JDRC0075, the Innovation Team Funds of China West Normal University (No. KCXTD2022-3), the Nanchong Federation of Social Science Associations Program under Grant No. NC22C280, and the China West Normal University 2022 University-level College Student Innovation and Entrepreneurship Training Program Project under Grant No. CXCY2022285.

Data Availability Statement

Not applicable.

Acknowledgments

This paper was completed by the Key Laboratory of the School of Computer Science, China West Normal University. We thank the school for its support and help.

Conflicts of Interest

The authors declare that they have no conflicts of interest to report regarding this present study.

References

  1. Kulbacki, M.; Segen, J.; Knieć, W.; Klempous, R.; Kluwak, K.; Nikodem, J.; Kulbacka, J.; Serester, A. Survey of drones for agriculture automation from planting to harvest. In Proceedings of the 2018 IEEE 22nd International Conference on Intelligent Engineering Systems (INES), Las Palmas de Gran Canaria, Spain, 21–23 June 2018; pp. 000353–000358. [Google Scholar]
  2. Puri, A. A survey of unmanned aerial vehicles (UAV) for traffic surveillance. Dep. Comput. Sci. Eng. Univ. S. Fla. 2005, 1–29. [Google Scholar]
  3. Innocente, M.S.; Grasso, P. Self-organising swarms of firefighting drones: Harnessing the power of collective intelligence in decentralised multi-robot systems. J. Comput. Sci. 2019, 34, 80–101. [Google Scholar] [CrossRef]
  4. Choudhary, G.; Sharma, V.; You, I.; Yim, K.; Chen, R.; Cho, J.H. Intrusion detection systems for networked unmanned aerial vehicles: A survey. In Proceedings of the 2018 14th International Wireless Communications & Mobile Computing Conference (IWCMC), Limassol, Cyprus, 25–29 June 2018; pp. 560–565. [Google Scholar]
  5. Available online: www.popularmechanics.com (accessed on 15 December 2022).
  6. Jimu News. Available online: http://www.ctdsb.net/ (accessed on 10 December 2022).
  7. Civil Aviation Administration of China. Available online: www.caac.gov.cn (accessed on 20 December 2022).
  8. Puranik, T.G.; Mavris, D.N. Identifying instantaneous anomalies in general aviation operations. In Proceedings of the 17th AIAA Aviation Technology, Integration, and Operations Conference, Atlanta, GA, USA, 25–29 June 2017; p. 3779. [Google Scholar]
  9. Hamel, T.; Mahony, R. Attitude estimation on SO [3] based on direct inertial measurements. In Proceedings of the 2006 IEEE International Conference on Robotics and Automation, 2006. ICRA 2006, Orlando, FL, USA, 15–19 May 2006; pp. 2170–2175. [Google Scholar]
  10. Garraffa, G.; Sferlazza, A.; D’Ippolito, F.; Alonge, F. Localization Based on Parallel Robots Kinematics as an Alternative to Trilateration. IEEE Trans. Ind. Electron. 2021, 69, 999–1010. [Google Scholar] [CrossRef]
  11. Kendoul, F. Survey of advances in guidance, navigation, and control of unmanned rotorcraft systems. J. Field Robot. 2012, 29, 315–378. [Google Scholar] [CrossRef]
  12. Alonge, F.; D’Ippolito, F.; Fagiolini, A.; Garraffa, G.; Sferlazza, A. Trajectory robust control of autonomous quadcopters based on model decoupling and disturbance estimation. Int. J. Adv. Robot. Syst. 2021, 18, 1729881421996974. [Google Scholar] [CrossRef]
  13. Koubâa, A.; Allouch, A.; Alajlan, M.; Javed, Y.; Belghith, A.; Khalgui, M. Micro air vehicle link (mavlink) in a nutshell: A survey. IEEE Access 2019, 7, 87658–87680. [Google Scholar] [CrossRef]
  14. Keipour, A.; Mousaei, M.; Scherer, S. Alfa: A dataset for uav fault and anomaly detection. Int. J. Robot. Res. 2021, 40, 515–520. [Google Scholar] [CrossRef]
  15. Mitchell, R.; Chen, I.R. Specification based intrusion detection for unmanned aircraft systems. In Proceedings of the First ACM MobiHoc Workshop on Airborne Networks and Communications, Hilton Head, SC, USA, 11 June 2012; pp. 31–36. [Google Scholar]
  16. Mitchell, R.; Chen, R. Adaptive intrusion detection of malicious unmanned air vehicles using behavior rule specifications. IEEE Trans. Syst. Man Cybern. Syst. 2013, 44, 593–604. [Google Scholar] [CrossRef]
  17. Sedjelmaci, H.; Senouci, S.M.; Ansari, N. A hierarchical detection and response system to enhance security against lethal cyber-attacks in UAV networks. IEEE Trans. Syst. Man Cybern. Syst. 2017, 48, 1594–1606. [Google Scholar] [CrossRef] [Green Version]
  18. Liu, Y.; Ding, W. A KNNS based anomaly detection method applied for UAV flight data stream. In Proceedings of the 2015 Prognostics and System Health Management Conference (PHM), Beijing, China, 21–23 October 2015; pp. 1–8. [Google Scholar]
  19. Sedjelmaci, H.; Senouci, S.M.; Ansari, N. Intrusion detection and ejection framework against lethal attacks in UAV-aided networks: A Bayesian game-theoretic methodology. IEEE Trans. Intell. Transp. Syst. 2016, 18, 1143–1153. [Google Scholar] [CrossRef]
  20. Keipour, A.; Mousaei, M.; Scherer, S. Automatic real-time anomaly detection for autonomous aerial vehicles. In Proceedings of the 2019 International Conference on Robotics and Automation (ICRA), Montreal, QC, Canada, 20–24 May 2019; pp. 5679–5685. [Google Scholar]
  21. Shrestha, R.; Omidkar, A.; Roudi, S.A.; Abbas, R.; Kim, S. Machine-learning-enabled intrusion detection system for cellular connected UAV networks. Electronics 2021, 10, 1549. [Google Scholar] [CrossRef]
  22. Chowdhury MM, U.; Hammond, F.; Konowicz, G.; Xin, C.; Wu, H.; Li, J. A few-shot deep learning approach for improved intrusion detection. In Proceedings of the 2017 IEEE 8th Annual Ubiquitous Computing, Electronics and Mobile Communication Conference (UEMCON), New York, NY, USA, 19–21 October 2017; pp. 456–462. [Google Scholar]
  23. Park, K.H.; Park, E.; Kim, H.K. Unsupervised fault detection on unmanned aerial vehicles: Encoding and thresholding approach. Sensors 2021, 21, 2208. [Google Scholar] [CrossRef] [PubMed]
  24. Abu Al-Haija, Q.; Al Badawi, A. High-performance intrusion detection system for networked UAVs via deep learning. Neural Comput. Appl. 2022, 34, 10885–10900. [Google Scholar] [CrossRef]
  25. Dudukcu, H.V.; Taskiran, M.; Kahraman, N. Unmanned Aerial Vehicles (UAVs) Battery Power Anomaly Detection Using Temporal Convolutional Network with Simple Moving Average Algorithm. In Proceedings of the 2022 International Conference on INnovations in Intelligent SysTems and Applications (INISTA), Biarritz, France, 8–12 August 2022; pp. 1–5. [Google Scholar]
  26. Zhang, C.; Li, D.; Liang, J.; Wang, B. MAGDM-oriented dual hesitant fuzzy multigranulation probabilistic models based on MULTIMOORA. Int. J. Mach. Learn. Cybern. 2021, 12, 1219–1241. [Google Scholar] [CrossRef]
  27. Xie, H.; Hao, C.; Li, J.; Li, M.; Luo, P.; Zhu, J. Anomaly Detection for Time Series Data Based on Multi-granularity Neighbor Residual Network. Int. J. Cogn. Comput. Eng. 2022, 3, 180–187. [Google Scholar] [CrossRef]
  28. Khan, W.; Haroon, M. An unsupervised deep learning ensemble model for anomaly detection in static attributed social networks. Int. J. Cogn. Comput. Eng. 2022, 3, 153–160. [Google Scholar] [CrossRef]
  29. Sifre, L.; Mallat, S. Rigid-motion scattering for texture classification. arXiv 2014, arXiv:1403.1687. [Google Scholar]
  30. Pytorch. Available online: https://pytorch.org/ (accessed on 1 December 2022).
  31. GJohn, P.L. Estimating continuous distributions in Bayesian classifiers. In Proceedings of the Eleventh Conference on Uncertainty in Artificial Intelligence, Montreal, QC, Canada, 18–20 August 1995; pp. 338–345. [Google Scholar]
  32. Peterson, L.E. K-nearest neighbor. Scholarpedia 2009, 4, 1883. [Google Scholar] [CrossRef]
  33. Quinlan, J.R. C4. 5: Programs for Machine Learning; Elsevier: Amsterdam, The Netherlands, 2014. [Google Scholar]
  34. Breiman, L. Random forests. Mach. Learn. 2001, 45, 5–32. [Google Scholar] [CrossRef] [Green Version]
  35. Aldous, D. The continuum random tree. II. An overview. Stoch. Anal. 1991, 167, 23–70. [Google Scholar]
  36. Schapire, R.E. Explaining adaboost. In Empirical Inference: Festschrift in Honor of Vladimir N. Vapnik; Springer: Berlin/Heidelberg, Germany, 2013; pp. 37–52. [Google Scholar] [CrossRef]
Figure 1. Main components in the UAV anomaly detection system.
Electronics 12 01299 g001
Figure 2. The block diagram of the proposed TS-MSCNN.
Electronics 12 01299 g002
Figure 3. (a) Distribution of various features. (b) Extraction of the features in the timestamp.
Electronics 12 01299 g003
Figure 4. (a) The data distribution of ALFA. (b) The balanced ALFA.
Electronics 12 01299 g004
Figure 5. (a) The normal flight data. (b) The flight data of elevator failure.
Electronics 12 01299 g005
Figure 6. (a) The separable convolutions. (b) The separable convolutional neural network.
Electronics 12 01299 g006
Figure 7. Traditional CNN convolution layers.
Electronics 12 01299 g007
Figure 8. The influence of model structure on the number of parameters.
Electronics 12 01299 g008
Figure 9. The influence of model structure on computational overhead.
Electronics 12 01299 g009
Figure 10. The feature extraction and fusion layer.
Electronics 12 01299 g010
Figure 11. (a) Feature mapping and classification layer. (b) The way the feature flattens out.
Electronics 12 01299 g011
Figure 12. The structure of TS-MSCNN model.
Electronics 12 01299 g012
Figure 13. Two-dimensional UAV flight data.
Electronics 12 01299 g013
Figure 14. (a) Performance of the single model. (b) Performance of the TS-MSCNN and other models.
Electronics 12 01299 g014
Figure 15. (a) Performance of the single model. (b) Performance of the TS-MSCNN and other models.
Electronics 12 01299 g015
Figure 16. Comparison between the binary classification and the multiclass classification.
Electronics 12 01299 g016
Table 1. Features selected from the ALFA.
CategoryFeature NameDescription
POS DataMagnetic Field (x, y, z)The value of the magnetic field at axis x, y and z
Linear Acceleration (x, y, z)The linear acceleration at axis x, y and z
Angular Velocity (x, y, z)An angular velocity at axis x, y and z
Velocity (x, y, z)Measured velocity of axis x, y and z
System status DataFluid PressureThe value of the pressure using fluid pressure sensors
TemperatureThe temperature of the battery
Altitude ErrorThe error value of current altitude
Airspeed ErrorThe error value of current airspeed
Tracking Error (x)The tracking error at x axis
WP DistanceThe distance between ideal location and current location
Table 2. Parameter configuration of the simulator.
SITL ParameterDefaultDescription
SIM_RC_FAIL0.000000Force RC failure
SIM_ACCEL_FAIL0.000000Force IMU ACC failure
SIM_ENGINE_MUL1.000000-
SIM_MAG1_DEVID97,539.0000001st Compass (0 to remove)
SIM_SPEEDUP1.000000Allows running sim SPEEDUP times faster
SIM_WIND_TURB0.000000Not implemented
SIM_GYR_FAIL_MSK0.000000Bitmask for setting a Gyro 1, 2, and/or 3 failure
Table 3. The accuracy of the single model.
ModelAccuracy
CNN95.40%
SCNN96.35%
Table 4. The detailed performance of CNN, SCNN, and TS-MSCNN.
ModelAccuracyClassRecallPrecisionF1-Score
CNN95.40%No_failure99.50%95.41%97.41%
failure67.56%95.27%79.06%
SCNN96.35%No_failure98.35%96.53%97.43%
failure76.06%87.18%81.24%
TS-MSCNN98.50%No_failure99.24%98.98%99.11%
failure93.06%94.76%93.91%
Table 5. The accuracy of the single model.
ModelAccuracy
CNN93.10%
SCNN94.68%
Table 6. The detailed performance of CNN, SCNN, and TS-MSCNN.
ModelAccuracyClassRecallPrecisionF1-Score
CNN93.10%aileron_failure94.33%93.42%93.87%
elevator_failure77.11%90.14%83.12%
engine_failure98.01%96.19%97.09%
no_failure91.50%93.59%92.53%
rudder_failure84.07%88.95%86.44%
SCNN94.68%aileron_failure95.44%93.50%94.46%
elevator_failure75.90%86.90%81.03%
engine_failure97.91%96.57%97.24%
no_failure_failure91.28%92.10%91.69%
rudder_failure82.42%90.91%86.46%
TS-MSCNN97.99%aileron_failure99.72%96.39%98.03%
elevator_failure90.36%94.94%92.59%
engine_failure98.98%99.08%99.03%
no_failure96.20%97.07%96.63%
rudder_failure91.76%97.66%94.62%
Table 7. The accuracies of the TS-MSCNN and the other latest algorithm in multiclass classification.
ModelAUCACC
Aileron_FailureElevator_FailureEngine_FailureRudder_Failure
TS-MSCNN99.75%98.35%99.77%98.14%97.99%
Autoencoder [23]75.09%80.76%76.46%93.21%/
Recursive Least Squares [20]////88.23%
Disclaimer/Publisher’s Note: The statements, opinions and data contained in all publications are solely those of the individual author(s) and contributor(s) and not of MDPI and/or the editor(s). MDPI and/or the editor(s) disclaim responsibility for any injury to people or property resulting from any ideas, methods, instructions or products referred to in the content.

