Abstract
Plasma antenna systems consisting of discharge elements have great practical application prospects due to their ability to quickly adjust parameters over a wide range. In this work, the radiation patterns of a 30 mm long linear antenna surrounded by 16 standard T8 fluorescent lamps were measured by using a spectrum analyzer with a tracking generator. The radiation pattern of the system is measured by connecting the output of the spectrum analyzer tracking generator to a linear antenna and connecting the input of the spectrum analyzer to the receiving broadband horn antenna. The work features experimental measurements over a wide frequency range of 0.5 to 1.5 GHz and a wide discharge with current values from 35 to 200 mA. The specific frequency band and uniquely selected geometry allowed for the investigation of both the in-phase and out-of-phase antenna modes, while some modes were found to have a narrow directional radiation pattern, within 50 degrees, with a beam width of −3 dB. The parameters of the gas-discharge plasma were also evaluated using drift theory, as well as using the microwave transmission of the 20 GHz signal. The electron density value corresponding to the used discharge currents was approximately from 4 × 10¹¹ to 7 × 1010 cm−3.
1. Introduction
The use of various ranges of radio waves to ensure communication, navigation, operation of wireless devices, etc., is an integral part of modernity. Progress in the development of devices for transmitting and receiving signals is largely due to the development of new types of receiving and transmitting antennas. Recently, many new antenna designs have been proposed. For example, one of the latest advances in this field is the development of antenna systems based on metamaterials, which have a number of advantages over conventional ones [1,2,3]. Another direction is the development of plasma antennas. The plasma antenna differs from the conventional antenna because it uses discharge plasma as the conductor instead of metal. This feature allows for easier changes to the antenna parameters by changing the discharge current. From individual plasma antennas, whole plasma antenna systems can be formed, which can easily change the radiation pattern and change the operating frequency band. If necessary, such a plasma antenna system can be completely turned off while being almost completely radio-transparent. Although the interest in such antenna systems has existed for many years, interesting new findings in this area are still important and relevant.
Numerous plasma antenna designs have been proposed and investigated, some of which have been reviewed theoretically and experimentally [4,5,6]. One of the simplest designs of a plasma antenna system is a linear plasma antenna [7,8,9,10,11,12], which can be made by using readily available low-pressure discharge tubes (for example, fluorescent lamps) [8,10,11,12]. In some theoretical works devoted to the numerical analysis of linear plasma antennas, the problem of surface wave propagation in a plasma cylinder and the existence of noise and energy losses in the discharge plasma have been discussed [7,9,13].
Another area of the plasma antennas is the creation of plasma antenna arrays by combining several discharge elements with different geometries to allow for the possibility of changing the antenna’s parameters (e.g., the radiation pattern and bandwidth). The simplest array is a two-element plasma antenna system [14]. Other examples of such devices include a plasma antenna array [15], corner system [16], and nested plasma antenna [17]. The characteristic feature of the nested plasma antenna is that it can transmit, receive, and reflect low frequency signals while remaining transparent to high frequency signals that are impossible for a metal antenna to perceive. Another interesting example of the plasma antenna system is the gas-discharge Yagi-Uda antenna [18,19]. Similar to its metal counterpart, this antenna allows for the formation of a highly directed beam via the use of many Yagi-Uda directors and reflectors.
A symmetric round plasma antenna system is particularly interesting in that it can shift radiation patterns from omnidirectional to unidirectional without being turned [20,21,22,23,24,25]. This type of plasma antenna system consists of a central element surrounded by others in one or more concentric rows [23]. By switching on selected elements of the antenna system, the radiation pattern can be changed and rotated around the axis. Despite the relative simplicity of the analysis of such symmetrical antenna systems, they were studied for only a few specifically selected modes (with one value of the operating frequency or discharge current). Nevertheless, further studies of the plasma antenna systems with a cylindrical configuration have occurred.
This work is devoted to the analysis of a short linear antenna around which gas-discharge tubes are located. In our first work [24], an antenna system with a similar geometry was investigated for different values of the discharge current and only for two frequency values. In that work, it was noted that the radiation power is affected by the ratio between the wavelength and the distance from the central antenna to the gas-discharge fluorescent lamps. In our second work [25], we continued the analysis of a similar antenna system, but the frequency range was widened to 0.5 to 1.5 GHz. This frequency range corresponds to two different modes of operation of the plasma antenna system, namely (1) when the distance from the linear antenna to each of the fluorescent lamps is significantly less than the wavelength (in-phase mode) and (2) when this distance is close to the wavelength (out-of-phase mode). The distance from the central short antenna to the discharge tubes was specifically chosen to be equal to a quarter of the wavelength at a frequency of about 1 GHz (the middle of the frequency range). This paper presents a more detailed analysis of this antenna system. A large amount of experimental data are presented here for different configurations of fluorescent lamps and different values of discharge current. In addition, the electron density of the discharge plasma is estimated here by using two different methods. The first method is based on a drift approximation, using data known from the literature for the velocity of electrons in a mixture of argon and mercury under various conditions. In the second method, the method of microwave transmission with a 20 GHz signal is used to evaluate plasma parameters of the fluorescent lamps.
2. Description of the Experimental Setup
The antenna system under study (Figure 1 and Figure 2) consists of a round conductive base (1) with a diameter of 500 mm, where a small antenna (2) with a length of 30 mm is installed in the center. The use of a short antenna, which is not necessarily effective, is explained by the fact that its characteristics do not depend much on frequency, which means it will not greatly affect the frequency response of the entire system. Around this antenna, there are 16 standard T8 fluorescent lamps, with each having a length of 550 mm and a diameter of 28 mm (3). The distance from the linear antenna to the axis of the fluorescent lamps is 95 mm. These lamps are connected, in four separate groups (four lamps in each of the groups), to the power supply. Each group of lamps could be independently switched on using jumpers (5) and a switchboard (6). This switching method was chosen to ensure the same and stable value of the discharge current in the lamps when connected to a single power source. In addition, with this method of switching on the lamps, the supply wires do not affect the radiation pattern of the antenna system. There were four discharge current values selected in the range of 35 to 200 mA (35, 50, 100, and 200 mA). Figure 1 on the right shows the detail of the connection diagram of one of the lamp groups.
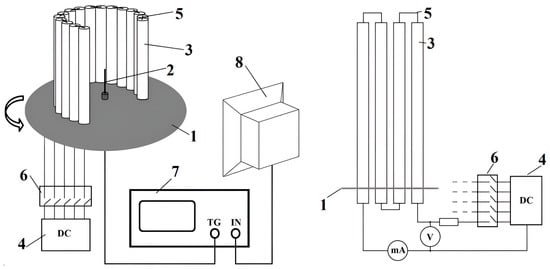
Figure 1.
Plasma antenna system: 1—metal plate generator; 2—short linear antenna; 3—fluorescent lamps; 4—DC power supply; 5—connecting jumpers; 6—switchboard; 7—Rigol DSA815-TG spectrum analyzer; 8—Ocean Microwave OBH-1080 broadband horn antenna.
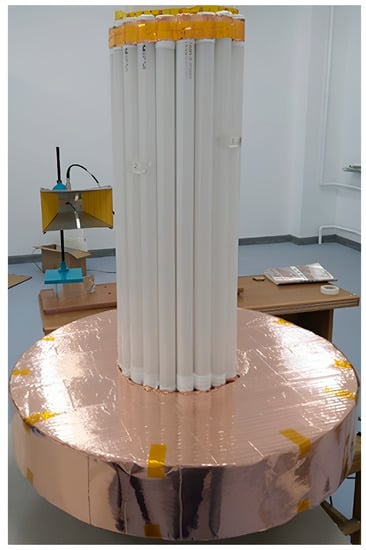
Figure 2.
Picture of the plasma antenna system.
Lamps of a large diameter (standard size T8) were used in the system, which made it possible to achieve lower electron density values than when using thinner discharge tubes [23]. This is because the loss of electrons on the walls of the lamp significantly decreases with an increase in tube diameter [26]. The radiation pattern was measured only in the horizontal plane, while the system rotated at an angle of up to 360 degrees in increments of 10 degrees (a total of 37 measurement points). To measure the radiation pattern in the selected frequency range, from 0.5 to 1.5 GHz, the spectral characteristics are measured at each step using a Rigol DSA815-TG spectrum analyzer (7). This spectrum analyzer contains a tracking generator whose output was connected by a coaxial cable to a central short antenna equipped with an SMA connector. The input of the spectrum analyzer was connected to a receiving Ocean Microwave OBH-1080 broadband horn antenna (8). The minimum frequency value was limited to 500 MHz, as the influence of the near-field region will be significant at frequencies below this value, and the sensitivity of the receiving antenna would decrease. The maximum frequency was limited by the specifications of the spectrum analyzer used in the experiment. According to the measured spectral characteristics, the relative power flux was determined as a function of the rotation angle for each of the lamp combinations and each value of the discharge current. The dimensionless power flux, at a certain frequency for a certain lamp configuration and discharge current, is defined as the ratio of the power flux to the average by angle of the power flux for a free (i.e., no discharge) antenna at the same frequency value:
where is the number of measurement points. Although this normalization method is not generally accepted, in this work, it is used for the convenience of quantitatively comparing the field of a free antenna and the antenna system with the lamps turned on.
Figure 3 shows the geometry of the mutual arrangement of the antenna system and the schematic diagram of experimental measurements, as well as four combinations of switching on lamps. The receiving antenna was located at the polar angle θ of 80 degrees, which did not change, since the dependence of the field of the antenna system changed slightly based on the parameters of the system.
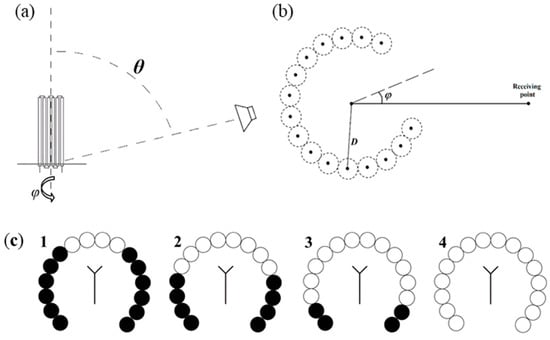
Figure 3.
(a) Geometry of the location of the antenna system under study and (b) the schematic diagram of experimental measurements (top); (c) various combinations (1–4) of turned-on (indicated by white) and turned-off (indicated by black) lamp groups (below).
According to the Figure 3, in the first case, only four lamps were switched on, in the second case there were eight lamps, in the third case there were twelve lamps, and in the fourth case, all 16 lamps were switched on. In each of these four cases, the radiation pattern measurements were measured for the four discharge current values indicated above. In addition, for each of the four configurations and for each of the four values of the discharge current, the directivity of the antenna system was determined as the ratio of the maximum power flux of the antenna system, in the direction of the angle , to the average power flux value for each considered case:
3. Experimental Results for Different Lamp Configurations and Current Values
3.1. Combination 1
Figure 3 shows the radiation patterns of the antenna system at different values of frequency and discharge current for the first lamp configuration. Table 1 shows the directional values of the antenna system for the cases presented in Figure 3. As seen from Figure 4, the radiation pattern depends on the discharge current and the frequency. At low frequencies, the power flux is significantly less than that of the free linear antenna because the distance between the linear antenna and the lamps is small compared to the wavelength [26]. With increased frequency, a radiation pattern with a clearly defined direction was formed in which the power flux was significantly greater. Moreover, the increased frequency further established a two-lobe radiation pattern.

Table 1.
Antenna system directivity (dB) for the first lamp configuration.
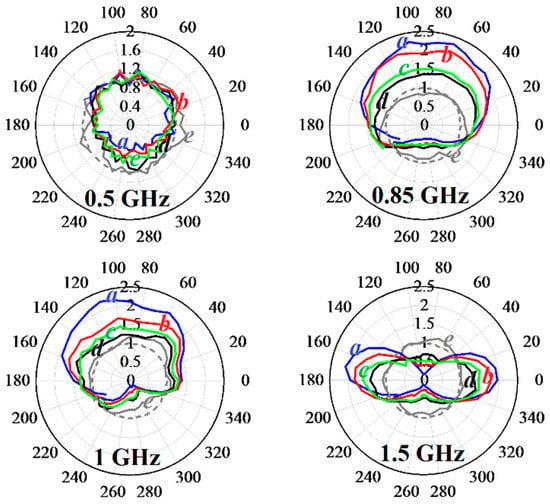
Figure 4.
Radiation patterns for the first lamp configuration at different frequencies and discharge current values: a (blue curves) 200 mA; b (red curves)—100 mA; c (green curves)—50 mA; d (black curves)—35 mA; e (gray solid curves)—free linear antenna (no discharge).
3.2. Combination 2
Figure 5 and Table 2 present the radiation patterns and antenna system directivity for the second lamp configuration. While the radiation patterns shown in this figure are similar to those in Figure 4, a more directional radiation pattern was formed in this case. In contrast to the case presented in Figure 4, the two-lobe radiation pattern was found to be less well-formed.
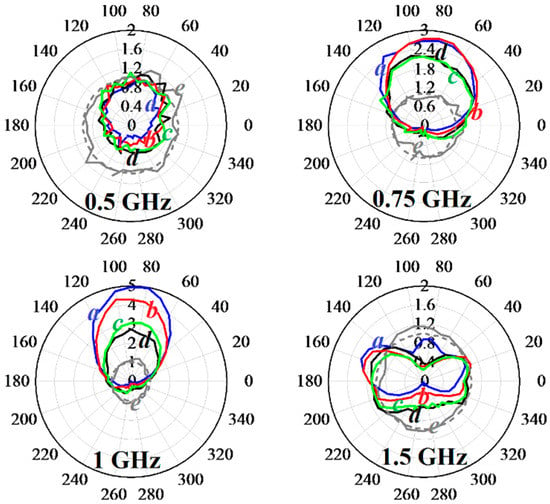
Figure 5.
Radiation patterns for the second lamp configuration at different frequencies and discharge currents. The curve designations (a–e) correspond to those in Figure 4.

Table 2.
Antenna system directivity (dB) for the second lamp configuration.
3.3. Combination 3
Figure 6 and Table 3 show the radiation patterns for the third lamp configuration. As can be seen from Figure 6, the radiation patterns for this lamp configuration were found to be even more directional, but a two-lobe radiation pattern was not formed at a frequency of 1.5 GHz.
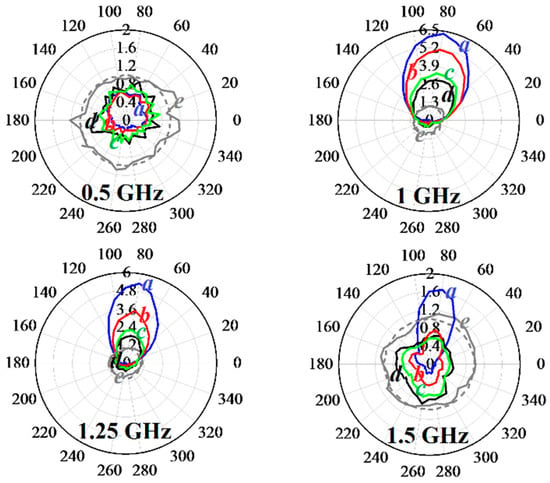
Figure 6.
Radiation patterns for the third lamp configuration at different frequencies and discharge currents. The curve designations (a–e) correspond to those in Figure 4.

Table 3.
Antenna system directivity (dB) for the third lamp configuration.
3.4. Combination 4
Figure 7 and Table 4 shows the radiation patterns for the fourth lamp configuration. As in the previous three cases, the maximum intensity occurred at a frequency of 1 GHz, at which the power flux was more than seven times that of the free linear antenna. However, as the frequency increased to 1.5 GHz, the power flux rapidly decreased, and the radiation pattern became less directional.
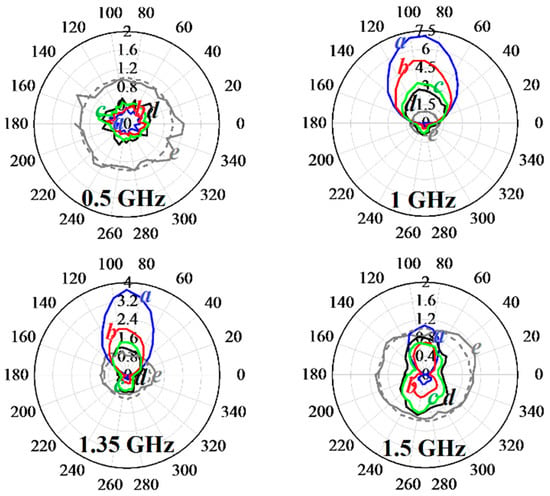
Figure 7.
Radiation patterns for the fourth lamp configuration at different frequencies and discharge currents. The curve designations (a–e) correspond to those in Figure 4.

Table 4.
Antenna system directivity (dB) for the fourth lamp configuration.
As expected, the measured radiation patterns of the antenna system shown in Figure 4, Figure 5, Figure 6 and Figure 7 show a strong dependence on both the number of switched-on lamps and the discharge current. In some cases, it is possible to obtain an acute radiation pattern. For example, in Figure 6 and Figure 7, when frequency is greater than 1 GHz, the beam width at the level of −3 dB is less than 50 degrees. It should be noted that the total radiation power also changes, which is due to the change in the impedance of the antenna system when the lamps are turned on. This issue can be analyzed in more detail via measurements taken by a directional coupler. Based on the measured radiation patterns presented, the greatest maximum intensity is formed at a frequency of about 1 GHz (especially for lamp combinations 2–4). At this frequency, the distance from the central antenna to the discharge tubes corresponds to a quarter of the wavelength, which leads to a sharp increase [26].
4. Plasma Parameter Estimation
4.1. Drift Approximation
The parameters of a gas-discharge plasma can be estimated approximately using a known drift approximation. The equation for the average electron motion can be written as [26]:
where is the elementary charge, is the electron mass, is the electron collision frequency, is the lamp electric field, and the dot notation above the average electron velocity on the left side of the equation denotes time deviation. After integrating Equation (3) and accounting for a constant average velocity over a long time period, the drift velocity of the electrons can be expressed as the following [27]:
The current can be expressed through the motion of electrons:
where is the cross-sectional area of the fluorescent lamp and is the electron density. The electric field of the lamp, in this particular case, is determined by the ratio of the applied voltage to its length.
To determine the electron density and collision frequency, we obtain the drift velocity in an Ar–Hg mixture by considering the reduced electric field [28], which is expressed as the ratio of the electric field to the density of neutral particles . Considering a standard temperature of 300 K and a pressure of approximately 400 Pa in fluorescent lamps, the density of neutral particles can be estimated at about 1023 m−3. The voltage drop on fluorescent lamps weakly depends on the discharge current and is 140 V, according to the dependence presented in [28], so the electron drift velocity is about 5 × 10³ m/s. For the four discharge current values, the four estimated electron density values are approximately 4 × 10¹¹, 2 × 10¹¹, 1 × 10¹¹, and 7 × 1010 cm−3. The effective frequency of electron collisions is independent of the discharge current and remains 1010 Hz.
4.2. Microwave Measurement
The microwave transmission method is also used to characterize the electron density at the operating frequency of 20 GHz [27]. The technical implementation of the method is quite similar to that described in [29,30]. Figure 8 illustrates the measuring system containing a network analyzer, Ceyear 3672B-S (1), connected to two identical horn antennas, XBG-42-20K, which function as a transmitting antenna (2) and a receiving antenna (3), respectively. An assembly of six identical lamps of the standard size T8 in series (4) is fixed between the above antennas as the target to be characterized, and the measurement was performed at two different discharge current values of 100 and 200 mA.
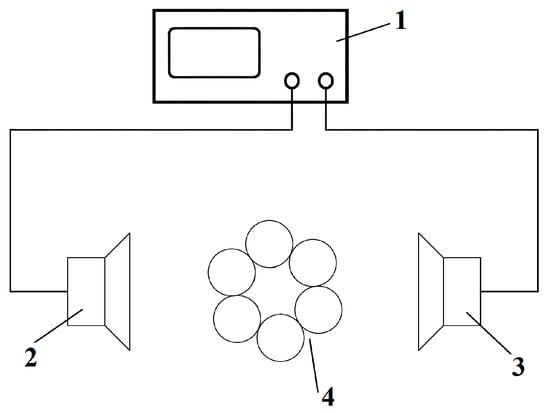
Figure 8.
The microwave measurement system: 1—network analyzer; 2, 3—horn antennas; 4—six identical lamps of the standard size T8 connected in series.
The antennas were connected to two ports of a vector network analyzer to form a dual-port network, thus four S parameters are obtained. For the proposed case of electromagnetic wave transmission through a lamp assembly, the S12 or S21 parameter is of interest and reciprocal. The changes in the amplitude and phase of the parameter S12 (S21) exactly reflect the corresponding changes of the electromagnetic wave passed through the lamp assembly. The wavelength of the 20 GHz signal is much smaller than the transverse size of the lamp assembly, providing a narrowly directed beam. In addition, the frequency value of the electron density of gas-discharge plasma in lamps is several times less than the critical value of the electron density (about 1012 cm−3) [31], resulting in a small level of signal attenuation of not more than a few percent. All of the above factors make it possible to use the well-known method of microwave transmission to characterize the studied plasma region.
By measuring the change in the relative amplitude and phase shift of the transmitted electromagnetic wave through a structure of fluorescent lamps with a transverse dimension , the absorption index and the refractive index can be determined:
using known ratios for the permittivity and conductivity of the plasma [31]:
where is the frequency of the electromagnetic field, is the vacuum permittivity, and is the speed of light. This method is described in more detail in [29,30].
Figure 9 shows the time dependencies of the amplitude and phase of the 20 GHz signal for 100 and 200 mA discharge current values. Such a temporary representation is good because it shows the random variation of the parameters of the gas-discharge plasma in fluorescent lamps.
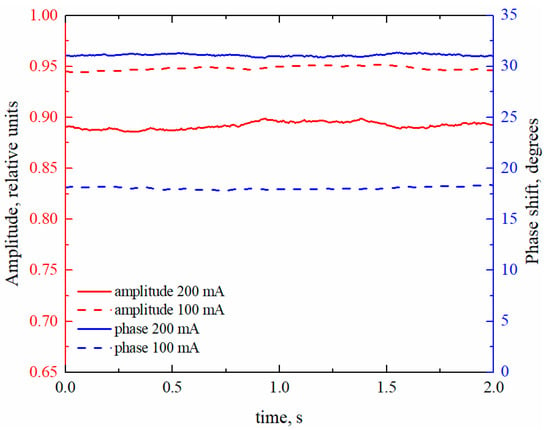
Figure 9.
Time dependencies of the amplitude and phase of the 20 GHz signal for 100 and 200 mA discharge current values.
By using Formulas (6)–(9), it is possible to determine the corresponding dependences of the electron collision frequency and electron density (Figure 10) for 100 and 200 mA discharge current values.
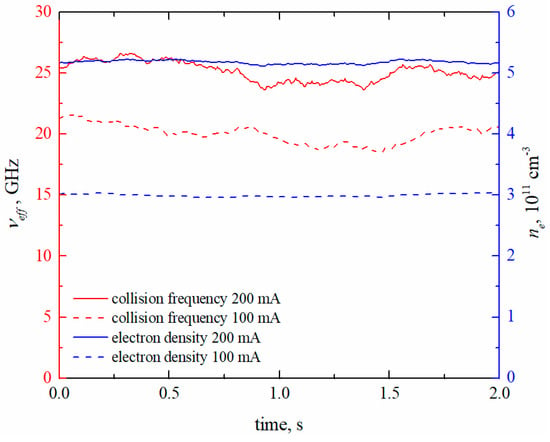
Figure 10.
Time dependencies of the electron collision frequency and electron density for 100 and 200 mA discharge current values.
As seen from Figure 10, the values obtained are consistent with the estimates of the drift approximation, showing the same order of magnitude. Moreover, the electron density increases almost linearly with increasing current, whereas the effective frequency does not increase as much. The results obtained by the two methods are not only qualitatively consistent but also agree with the known data by orders of magnitude [29,30,31]. However, the two approaches significantly differ quantitatively, especially the results for the frequency of electron collisions. As seen from Figure 10, this difference is about two times.
5. Conclusions
The measured radiation pattern of a short linear antenna surrounded by 16 fluorescent lamps is represented. The influence of a sequentially forming cylindrical plasma reflector on the radiation pattern of a short linear antenna was studied. Measurements were carried out in the frequency range of 0.5 to 1.5 GHz, with discharge currents from 35 to 200 mA. The modes of the antenna system were identified, in which a highly directional radiation pattern out 50 degrees with a beam width of −3 dB is formed. It is shown that the largest maximum is formed at a frequency when the distance from the central antenna to the discharge tubes is approximately equal to a quarter of the wavelength, and its value increases with increasing discharge current. The parameters of the gas-discharge plasma are estimated using two different approaches. The qualitatively consistent result is given by the estimates of the plasma parameters by using drift approximation and microwave diagnostics. The electron density was about from 4 × 10¹¹ to 7 × 1010 cm−3 for the used discharge current values, while the electron collision frequency was about 10 GHz and weakly depended on the discharge current. Some significant differences between the two approaches are explained by the approximately selected value of the transverse size of the measured lamp structure and some instability of the discharge current during microwave measurements. The obtained plasma characteristics are in satisfactory agreement with the existing data for the used fluorescent lamps.
Author Contributions
Conceptualization, H.W. and J.Y.; methodology, X.L. and A.M.A.; validation, H.W., A.M.A. and H.-P.L.; formal analysis, A.M.A.; writing—original draft preparation, H.W. writing—review and editing, A.M.A.; visualization, X.L.; supervision, H.-P.L. All authors have read and agreed to the published version of the manuscript.
Funding
This research received no external funding.
Data Availability Statement
The data presented in this study are available upon request from the corresponding author.
Acknowledgments
The authors thank Jinming Li (Harbin Institute of Technology, Harbin) for helpful work to perform the experiments.
Conflicts of Interest
The authors declare no conflict of interest.
References
- Althuwayb, A.A. MTM- and SIW-Inspired Bowtie Antenna Loaded with AMC for 5G mm-Wave Applications. Int. J. Antennas Propag. 2021, 2021, 6658819. [Google Scholar] [CrossRef]
- Althuwayb, A.A. Low-Interacted Multiple Antenna Systems Based on Metasurface-Inspired Isolation Approach for MIMO Applications. Arab. J. Sci. Eng. 2022, 47, 2629–2638. [Google Scholar] [CrossRef]
- Alibakhshikenari, M.; Virdee, B.S.; See, C.H.; Abd-Alhameed, R.A.; Falcone, F.; Limiti, E. Super-Wide Impedance Bandwidth Planar Antenna for Microwave and Millimeter-Wave Applications. Sensors 2019, 19, 2306. [Google Scholar] [CrossRef] [PubMed]
- Anderson, T. Plasma Antenna; Artech House: Norwood, MA, USA, 2011. [Google Scholar]
- Alexeff, I.; Anderson, T.; Parameswaran, S.; Pradeep, E.; Hulloli, J. Experimental and theoretical results with plasma antennas. IEEE Trans. Plasma Sci. 2006, 34, 166–172. [Google Scholar] [CrossRef]
- Alexeff, I.; Anderson, T.; Farshi, E.; Karnam, N.; Pulasani, N.R. Recent results for plasma antennas. Phys. Plasmas 2008, 15, 057104. [Google Scholar] [CrossRef]
- Bogachev, N.N.; Bogdankevich, I.L.; Gusein-Zade, N.G.; Rukhadze, A.A. Surface wave and linear operating mode of a plasma antenna. Plasma Phys. Rep. 2015, 41, 792–798. [Google Scholar] [CrossRef]
- Naito, T.; Yamaura, S.; Yamamoto, K.; Tanaka, T.; Chiba, H.; Ogino, H.; Takahagi, K.; Kitagawa, S.; Taniguchi, D. Theoretical and experimental investigation of plasma antenna characteristics on the basis of gaseous collisionality and electron density. Jpn. J. Appl. Phys. 2015, 54, 016001. [Google Scholar] [CrossRef]
- Russo, P.; Primiani, V.M.; Cerri, G.; De Leo, R.; Vecchioni, E. Experimental Characterization of a Surfaguide Fed Plasma Antenna. IEEE Trans. Antennas Propag. 2011, 59, 425–433. [Google Scholar] [CrossRef]
- Kumar, R.; Bora, D. Wireless communication capability of a reconfigurable plasma antenna. J. Appl. Phys. 2011, 109, 063303. [Google Scholar] [CrossRef]
- Zali, H.M.; Ali, M.T.; Pasya, I.; Ya’acob, N.; Halili, N.A.; Ja’afar, H.; Azlan, A.A. A monopole fluorescent tube antenna with Wi-Fi Router. In Proceedings of the 21st International Conference on Telecommunications (ICT), Lisbon, Portugal, 4–7 May 2014; pp. 358–362. [Google Scholar]
- Kumar, V.; Mishra, M.; Joshi, N.K. Study of a fluorescent tube as plasma antenna. Prog. Electromagn. Res. Lett. 2011, 24, 17–26. [Google Scholar] [CrossRef]
- Ye, H.Q.; Gao, M.; Tang, C.J. Radiation Theory of the Plasma Antenna. IEEE Trans. Antennas Propag. 2011, 59, 1497–1502. [Google Scholar] [CrossRef]
- Sadeghikia, F.; Hodjat-Kashani, F. A two element plasma antenna array. Eng. Technol. Appl. Sci. Res. 2013, 3, 516–521. [Google Scholar] [CrossRef]
- Kumar, R.; Kumar, P. Study of array plasma antenna parameters. AIP Adv. 2018, 8, 045306. [Google Scholar] [CrossRef]
- Jusoh, M.T.; Lafond, O.; Colombel, F.; Himdi, M. Performance and radiation patterns of a reconfigurable plasma corner-reflector antenna. IEEE Antennas Wireless Propag. Lett. 2013, 12, 1137–1140. [Google Scholar] [CrossRef]
- Nasr, N.; Mehdian, H.; Hajisharifi, K.; Hasanbeigi, A. Analysis of nested design of plasma antenna based on the azimuthally symmetric surface waves: UHF and SHF bands. Phys. Plasmas 2017, 24, 103304. [Google Scholar] [CrossRef]
- Sadeghikia, F.; Hodjat-Kashani, F.; Rashed-Mohassel, J.; Lotfi, A.A.; Ghayoomeh-Bozorgi, J. A Yagi-Uda Plasma Monopole Array. J. Electromagn. Waves Appl. 2012, 26, 885–894. [Google Scholar] [CrossRef]
- Armaki, F.S.M.; Armaki, S.A.M. Design and Fabrication of Plasma Yagi–Uda Array Antenna with Beamforming. IEEE Trans. Plasma Sci. 2019, 47, 2567–2570. [Google Scholar] [CrossRef]
- Jusoh, M.T.; Lafond, O.; Colombel, F.; Himdi, M. Performance of a reconfigurable reflector antenna with scanning capability using low cost plasma medium. Micro Opt. Tech. Lett. 2013, 55, 2869–2874. [Google Scholar] [CrossRef]
- Ja’afar, H.; Ali, M.T.B.; Dagang, A.N.B.; Zali, H.M.; Halili, N.A. A Reconfigurable Monopole Antenna with Fluorescent Tubes Using Plasma Windowing Concepts for 4.9-GHz Application. IEEE Trans. Plasma Sci. 2015, 43, 815–820. [Google Scholar] [CrossRef]
- Ja’afar, H.; Ali, M.T.B.; Dagang, A.N.B.; Ibrahim, I.P.; Halili, N.A.; Zali, H.M. Reconfigurable Plasma Antenna Array by Using Fluorescent Tube for Wi-Fi Application. Radioengineering 2016, 25, 275–282. [Google Scholar] [CrossRef]
- Melazzi, D.; De Carlo, P.; Trezzolani, F.; Manente, M.; Capobianco, A.; Boscolo, S. Beam-forming capabilities of a plasma circular reflector antenna. IET Microw. Antennas Propag. 2018, 12, 2301–2306. [Google Scholar] [CrossRef]
- Li, J.; Astafiev, A.M.; Kudryavtsev, A.A.; Yuan, C.; Yao, J.; Zhou, Z.; Wang, X. Monopole Antenna with Reconfigurable Quarter Wavelength Plasma Reflector. IEEE Trans. Plasma Sci. 2020, 48, 364–368. [Google Scholar] [CrossRef]
- Astafiev, A.M.; Kudryavtsev, A.A.; Chtrtsov, A.S.; Yuan, C.; Yao, J.; Zhou, Z. Characteristics of a short linear antenna with a cylindrical plasma reflector. In Proceedings of the 2021 13th International Symposium on Antennas, Propagation and EM Theory (ISAPE), Zhuhai, China, 1–4 December 2021; pp. 1–3. [Google Scholar]
- Raizer, Y.P. Gas Discharge Physics; Springer: Berlin/Heidelberg, Germany, 1991. [Google Scholar]
- Balanis, C.A. Antenna Theory Analysis and Design, 2nd ed.; John Wiley & Sons, Inc.: New York, NY, USA, 1997. [Google Scholar]
- Golyatina, R.I.; Maiorov, S.A. Characteristics of Electron Drift in an Ar–Hg Mixture. Plasma Phys. Rep. 2018, 44, 453–457. [Google Scholar] [CrossRef]
- Ginzburg, V.L. The Propagation of Electromagnetic Waves in Plasmas; Pergamon Press: Oxford, UK, 1970. [Google Scholar]
- Howlader, M.; Yang, Y.; Roth, J.R. Time-resolved measurements of electron number density and collision frequency for a fluorescent lamp plasma using microwave diagnostics. IEEE Trans. Plasma Sci. 2005, 33, 1093–1099. [Google Scholar] [CrossRef]
- Liu, Y.; Hou, Z. Diagnostics of plasma electron density and collision frequency of fluorescent lamp using microwave transmission diagnostics. J. Phys. Conf. Ser. 2019, 1324, 012073. [Google Scholar] [CrossRef]
Disclaimer/Publisher’s Note: The statements, opinions and data contained in all publications are solely those of the individual author(s) and contributor(s) and not of MDPI and/or the editor(s). MDPI and/or the editor(s) disclaim responsibility for any injury to people or property resulting from any ideas, methods, instructions or products referred to in the content. |
© 2023 by the authors. Licensee MDPI, Basel, Switzerland. This article is an open access article distributed under the terms and conditions of the Creative Commons Attribution (CC BY) license (https://creativecommons.org/licenses/by/4.0/).