Communication

One-Step, In Situ Hydrothermal Fabrication of Cobalt-Doped ZnO/CdS Nanosheets for Optoelectronic Applications

by
Lakshmiprasad Maddi
1,
Khidhirbrahmendra Vinukonda
2,
Thirumala Rao Gurugubelli
1,* and
Ravindranadh Koutavarapu
3,*
1
Physics Division, Department of Basic Sciences and Humanities, GMR Institute of Technology, Rajam 532 127, Andhra Pradesh, India
2
Department of Physics, Sri GCSR Degree College, Rajam 532 127, Andhra Pradesh, India
3
Department of Robotics Engineering, College of Mechanical and IT Engineering, Yeungnam University, Gyeongsan 38541, Republic of Korea
*
Authors to whom correspondence should be addressed.
Electronics 2023, 12(5), 1245; https://doi.org/10.3390/electronics12051245
Submission received: 9 February 2023 / Revised: 28 February 2023 / Accepted: 3 March 2023 / Published: 5 March 2023

Abstract

:
An in-situ hydrothermal process was used to create Co-doped ZnO/CdS nanosheets in order to examine the effects of the divalent impurity (Co) ions on the structural, morphological, optical, and magnetic characteristics of the test material. For both ZnO and CdS, XRD verified the development of a hexagonal wurtzite structure. SEM, TEM, and HR-TEM studies produced sheet-like morphology. Elemental mapping and XPS examination verified the presence of essential elements (S, Cd, O, Co, and Zn). Co-doping dramatically increased the nanosheets’ ability to absorb light in the visible area. Comparing the bandgap energy to pure ZnO and ZnO/CdS nanocomposites, the bandgap energy (2.59 eV) was well-regulated. The PL spectrum at 577 nm showed a prominent yellow emission band that was attributed to the 4A2g(F) → 4T1g(F) transition. Improvement in the room temperature ferromagnetic properties was observed due to doping of Co2+ ions. Warm white light harvesting was confirmed by the estimated CCT value (3540 K). The test material appears to be suitable for the creation of next-generation optoelectronic devices.

1. Introduction

The growing demand for next-generation optoelectronic devices has prompted substantial study into infinite solar energy conversion [1]. Broad-ranging research has been made possible by recent improvements in optoelectronics devices through the production of wide-bandgap semiconductor nanocomposites. The need for light-emitting devices is increasing daily as a result of economic progress. As such, the development of new-age luminescent materials has drawn considerable attention from researchers all over the world [2]. Zinc oxide (ZnO) has emerged as a leader among the semiconductor nanostructures due to its excellent electronic conductivity, nontoxicity, and low cost of synthesis [3]. The wide bandgap of ZnO (3.37 eV) limits the optical absorption solely to the ultraviolet light spectrum, restricting its potential. Several attempts have been made to increase the visible light absorption capability of ZnO via noble metal deposition, doping, semiconductor coupling, etc. [4,5,6].
At present, increasing efforts are being made towards the creation of heterostructures with wide bandgap materials. Recent research has suggested that a number of heterostructures, including ZnO/CdS, ZnO/ZnS, ZnO/SnS, ZnO/SnO2, ZnO/WO3, etc., may be candidate materials for improved energy conversion systems [7,8,9,10,11]. Comparably, ZnO/CdS composites fare better due to their various attributes, viz., affordability, environmental sustainability, and enhanced light usage [12]. ZnO/CdS nanocomposites have been thoroughly explored for numerous applications in the field of optoelectronics as photocatalysts, supercapacitors, photovoltaic cells and spintronics due to the mismatch in the band gap (ZnO—3.37 eV, CdS—2.42 eV) yet similar crystal structures (hexagonal wurtzite) of CdS and ZnO [13]. The ability to absorb visible light, favorable optoelectronic characteristics, and appropriate band alignment with ZnO make CdS the best material for the creation of a heterojunction [7,14]. The ability of CdS to effectively photosensitize ZnO and extend the absorption edge into the visible light area has also been well established in the literature. The resulting ZnO/CdS heterostructures may greatly extend the photo-response range tino the visible light area for the acceptable band gap (2.4 eV) of CdS [15]. Simultaneously, their complementary energy-band topologies may encourage the separation of photo-generated electron–hole pairs, significantly improving optical characteristics, particularly under the visible spectrum [4].
Numerous methods have been employed to develop the ZnO/CdS heterostructures including hydrothermal [14], co-precipitation [7], heteroepitaxial growth [16], green synthesis [1], the SILAR method [12,15], chemical bath deposition [17], microwave irradiation [18], and the in situ hydrothermal method [19]. Among these, the in situ hydrothermal route was recognized as a suitable method due to its simple process and high crystallinity and purity. The in situ hydrothermal approach not only produces very uniform nanostructures but also aids in tuning their characteristics. It is generally known that appropriate materials can be doped into nanomaterials to modify their characteristics required for device applications [20]. Doping improves the photoconversion efficiency of semiconductor nanocrystals by introducing atomic impurities into the host nanostructure to change its electrical and photophysical properties [21]. Doping also results in the creation of quasi-stable energy states, thereby reframing the band structure. Transition-metal-ion doping has been used to modify the structural and morphological aspects of semiconductor nanostructures, greatly enhancing the qualities needed for future applications [22,23,24].
A typical transition metal element with many energy levels in the electron structure is cobalt (Co). The magnetic property of Co also helps in the development of diluted magnetic semiconductors (DMS) in the emerging field of spintronics [25,26]. Due to its abundance of electronic states and apparent suitability for modifying the electronic structure without causing appreciable distortions in the host network, cobalt is one of the most successful doping species. Further, the inclusion of cobalt ions also increases the amount of defect states in the host lattice, which typically results in the successful separation of photogenerated charge carriers. Also, addition of cobalt reportedly altered the morphology and bandgap energy [22,27]. Hence, it is anticipated that the dopants play a clear role in altering the optical and magnetic properties of the nanostructures. The present study involves the fabrication of Co doped ZnO/CdS nanosheets through a simple, in situ hydrothermal technique and the study of their structural, optical, and magnetic properties. The Co-doped ZnO/CdS nanosheets offered excellent photoluminescence and magnetic properties when compared with pure ZnO and an undoped ZnO/CdS nanocomposite. As a result, new avenues for the development of novel magneto-optoelectronic devices are now accessible [23].

2. Materials and Methods

A single-step, in situ hydrothermal process was used to produce the Co-doped ZnO/CdS nanosheets. Initially, 0.2 mol of zinc acetate and an equal molar concentration of NaOH, cadmium acetate, and Na2S were dissolved separately in 25 mL of a 1:1 ratio of deionized water and ethanol matrix. The NaOH solution was then added to the zinc solution dropwise while being constantly stirred. A white homogeneous precipitate (sol. A) was obtained, which indicated the formation of ZnO. Subsequently, the Na2S solution was added drop by drop into the cadmium solution and a yellow precipitate (sol. B) was obtained, indicating the formation of CdS. Both the solutions (Sol. A and B) were mixed together after 30 min of individual stirring. The mixture solution was then stirred for another 30 min. Later, 20 mL of 3 mol% cobalt nitrate solution was dropped into the aforementioned mixture and agitated for 60 min. The obtained solution was poured into the autoclave and treated at 200 °C for 12 h. The obtained products are washed thrice and dried overnight at 80 °C after being naturally cooled to room temperature. The obtained test material was then ground and used for further characterization. Other descriptions concerned with reagents, characterization, and photocatalysis are provided in the supplementary material.

3. Results and Discussion

3.1. Structural Analysis

Figure 1 displays the XRD patterns of the Co-doped ZnO/CdS nanosheets. Diffraction peaks of ZnO for the planes of (1 0 0), (0 0 2), (1 0 1), (1 0 2), (1 1 0), (1 0 3), (2 0 0), (1 1 2), (2 0 1), (0 0 4), and (2 0 2) were observed in accordance with JCPDS 36–1451 (hexagonal wurtzite structure of ZnO). Simultaneously, diffraction peaks of CdS recorded at (1 0 0), (0 0 2), (1 0 1), (1 1 0), and (1 1 2) were in accordance with JCPDS 65–3414 (hexagonal CdS structure). The most intense peak of the ZnO was observed at 36.16°, while that of the CdS was noted at 26.43°. From Figure 1, it is clear that the doping of Co did not result in any variation in the peak positions. The absence of characteristic peaks of Co may be due to the low concentration of the dopant (0.01 mol), which proved to be inadequate for compound formation. As such, Co was assumed to have substituted in the lattice structure of ZnO or CdS. However, the measured values of the ionic radii of Co2+, Cd2+, and Zn2+, viz., 0.65 Ǻ, 0.97 Ǻ, and 0.74 Ǻ [5,27], indicating the possible replacement of Zn2+ by Co2+ ions. The smaller (marginally) size of Co2+ might be responsible for the contraction of crystal lattice, which also led to the reduction in average crystallite size. Using Scherrer’s formula, the average crystallite size was calculated as D = 0.9 λ/βcosθ (where, λ = 1.54 Ǻ). Lattice strain was evaluated according to the formula ε = (βcosθ)/4. The dislocation density was measured as (δ = 1/D2). Table 1 reveals the reduction in the average crystallite size compared to the ZnO-CdS composite. The accompanying strain and dislocation density were also found to increase for the Co-doped ZnO/CdS composite.

3.2. Morphological Analysis

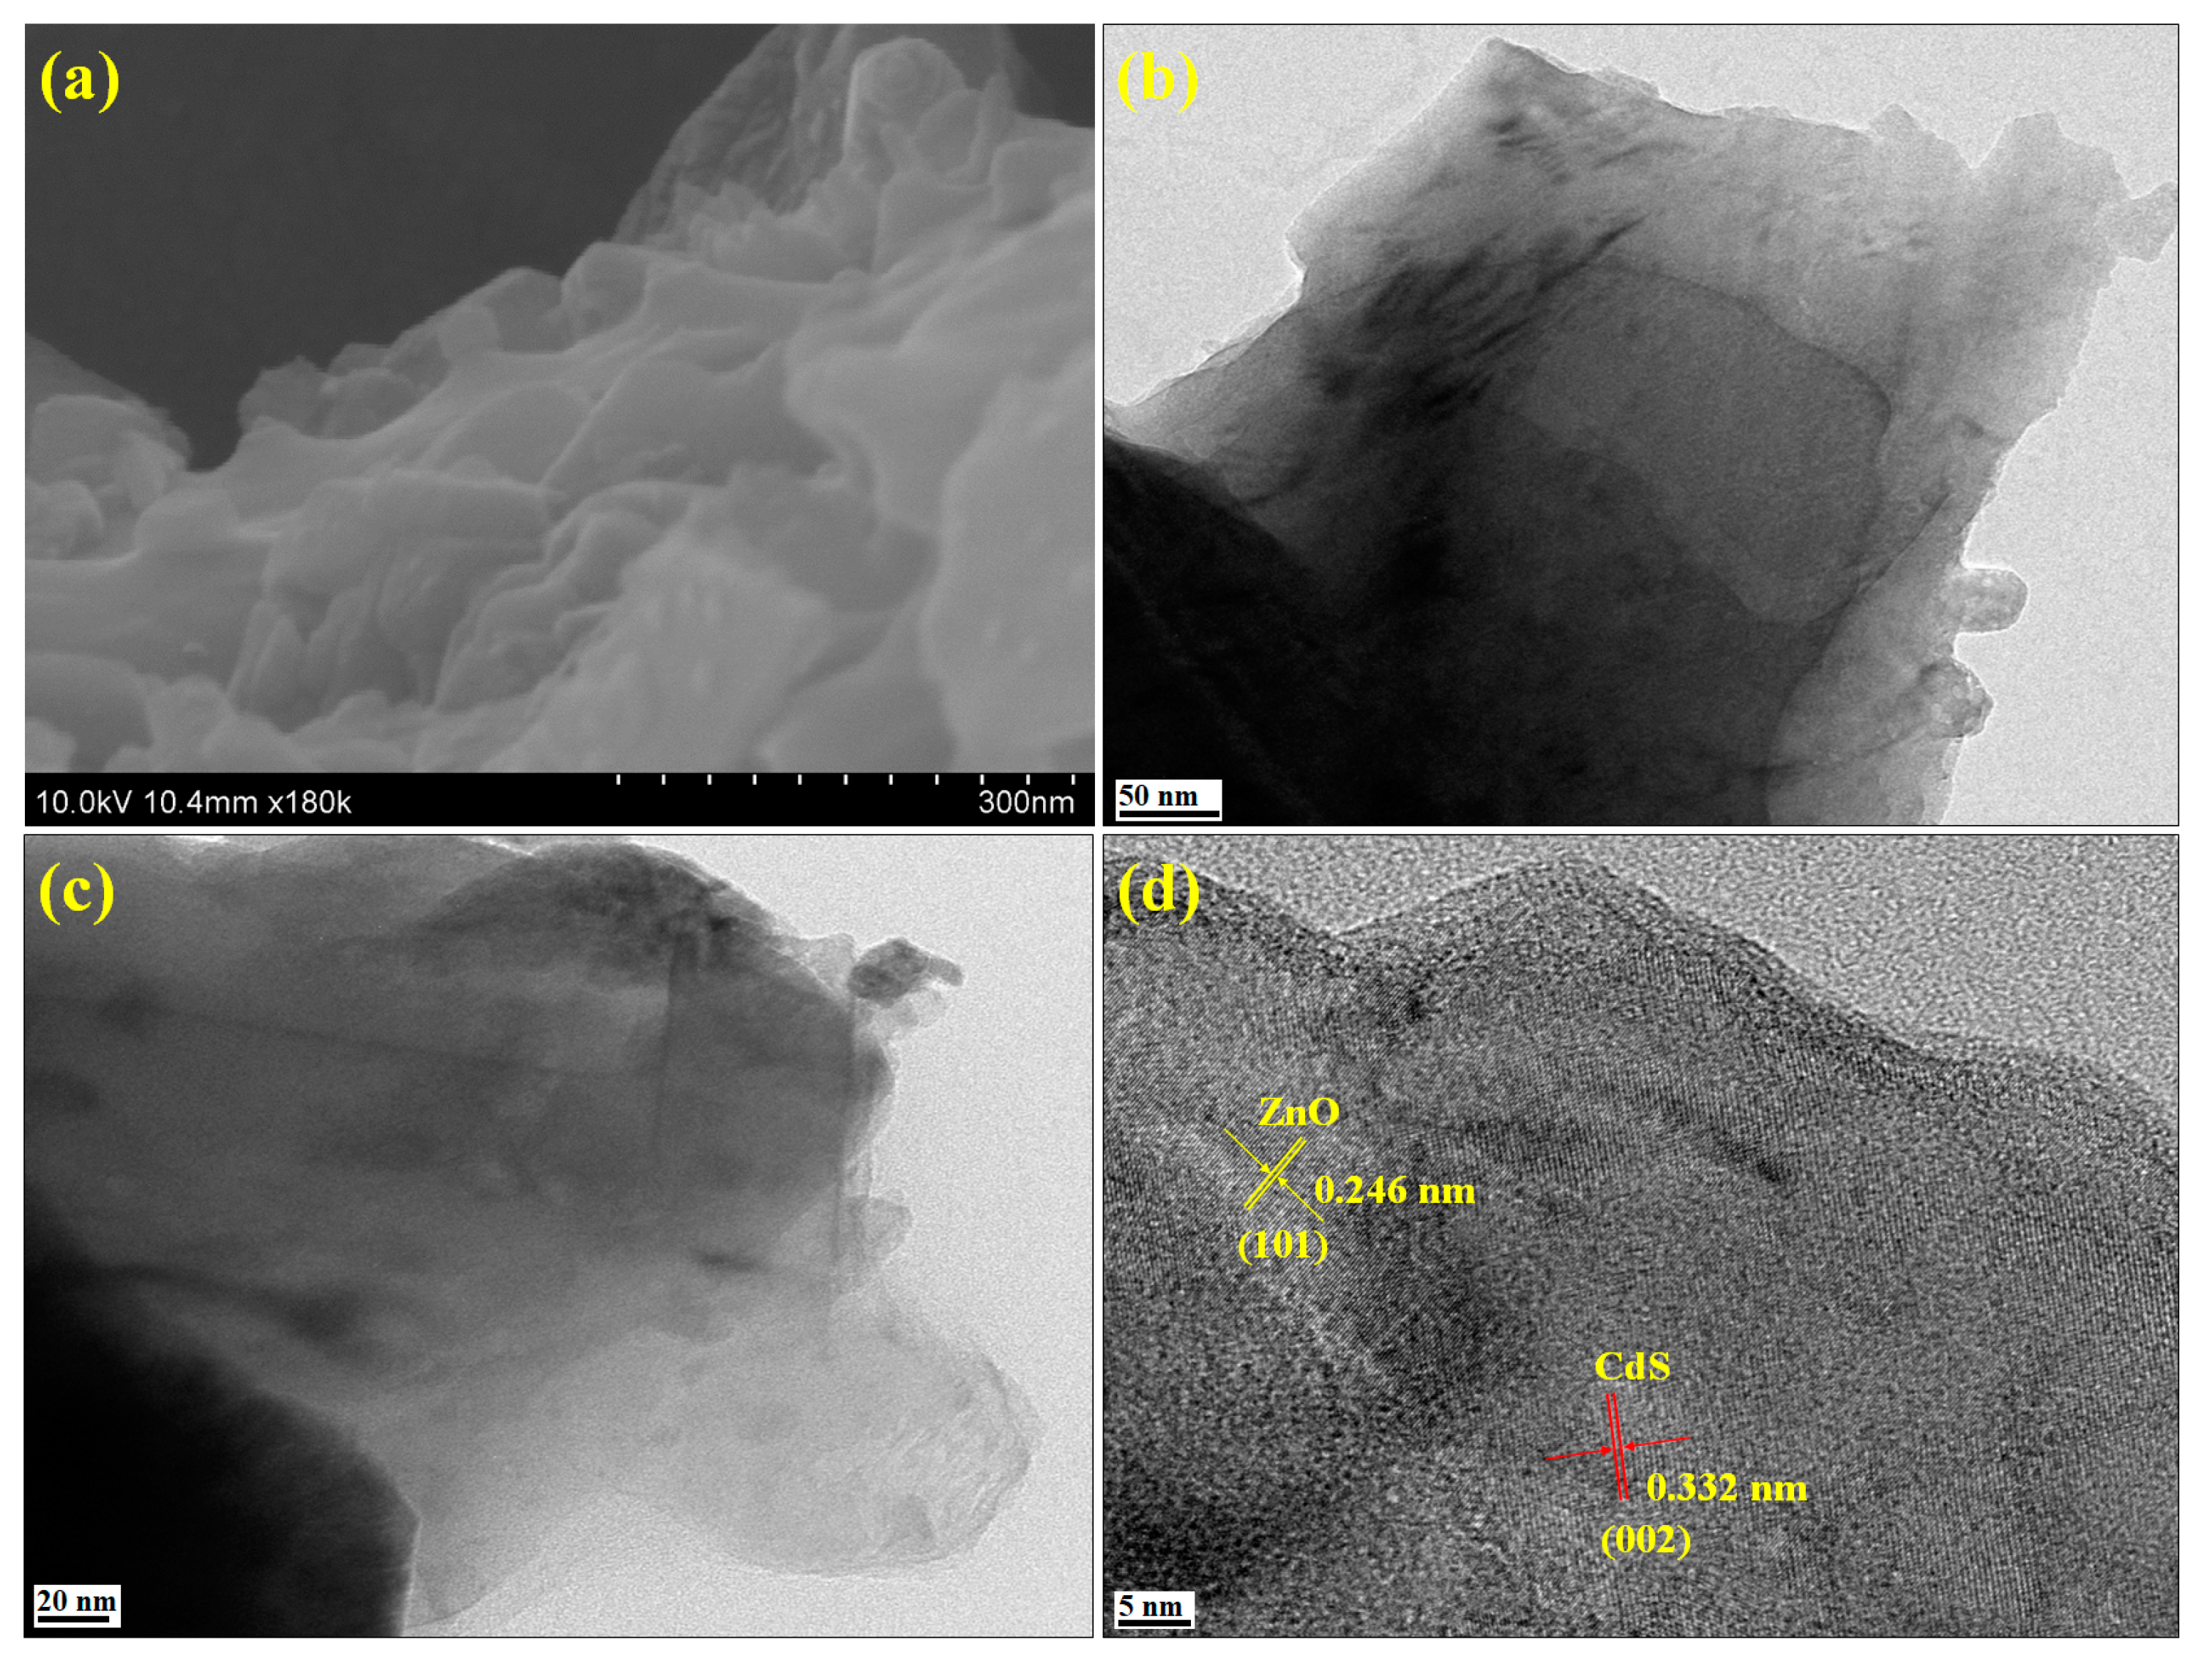
The morphology of the as-synthesized nanostructures was examined using SEM and TEM techniques. SEM micrographs of the Co-doped ZnO/CdS heterostructures exhibited sheet-like structure, as shown in Figure 2a. A similar morphology was obtained from TEM, as displayed in Figure 2b. For further confirmation, an HR-TEM analysis was performed, and these results are illustrated in Figure 2c. These results confirm the formation of 2D–2D, sheet-like structures for both ZnO and CdS in the ZnO/CdS heterostructure. Darker portions in the HR-TEM image are indicative of the sheets perpendicular to the image (out of the plane), and brighter portions indicate the in-plane imaging. The average inter-planar spacing was calculated in ZnO to be 0.246 nm (Figure 2d). This may be attributed to the (1 0 1_0) plane of wurtzite ZnO. A similar observation was made by He et al. [29]. Hence, (1 0 1_0) side facets along with (0 0 0 1) top facets were confirmed to be the basic building blocks of the ZnO nanosheets. Additionally, the inter-planar distance in CdS was measured to be 0.332 nm, which matches that of the (2 0 0) plane of hexagonal CdS.

3.3. Elemental Analysis

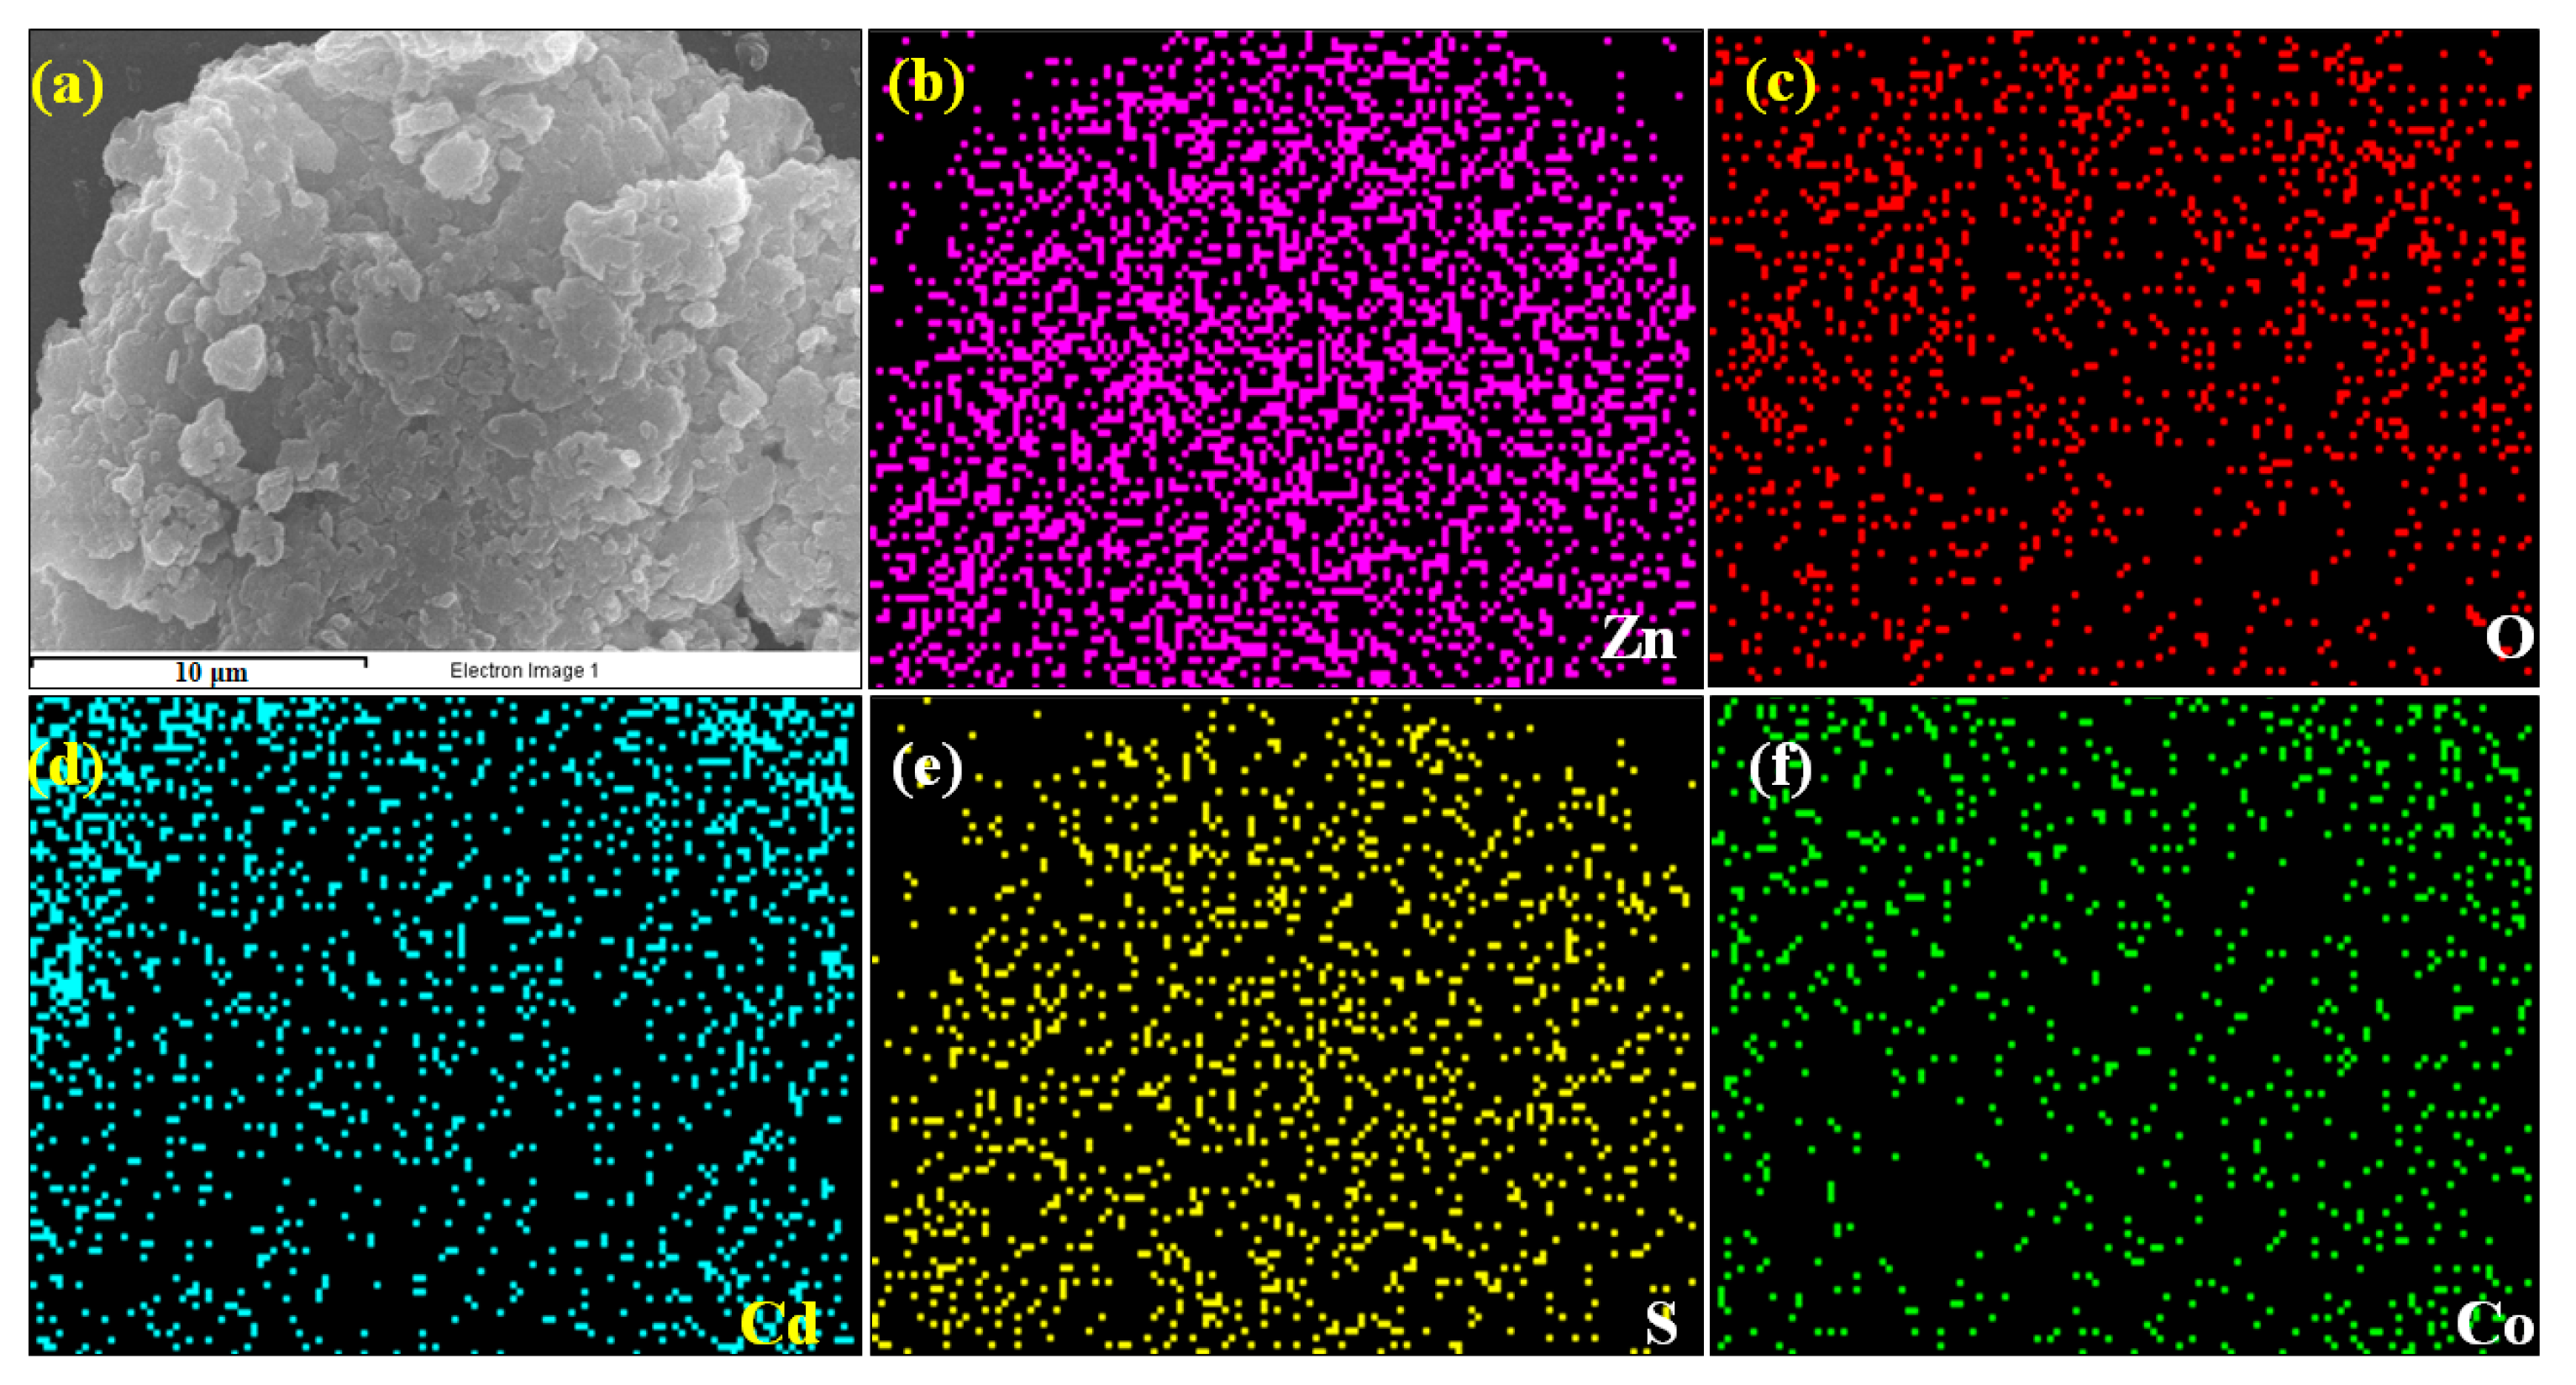
An EDS analysis was performed in order to determine the elemental composition. The EDS elemental mapping of the Co-doped ZnO/CdS nanosheets is displayed in Figure 3. The as-synthesized sample contained five elements of S, Cd, O, Co, and Zn in the test material. The presence of a uniform contrast indicates the uniform distribution of all the elements throughout the sample. Moreover, the weight and atomic percentages are provided in Figure S1.
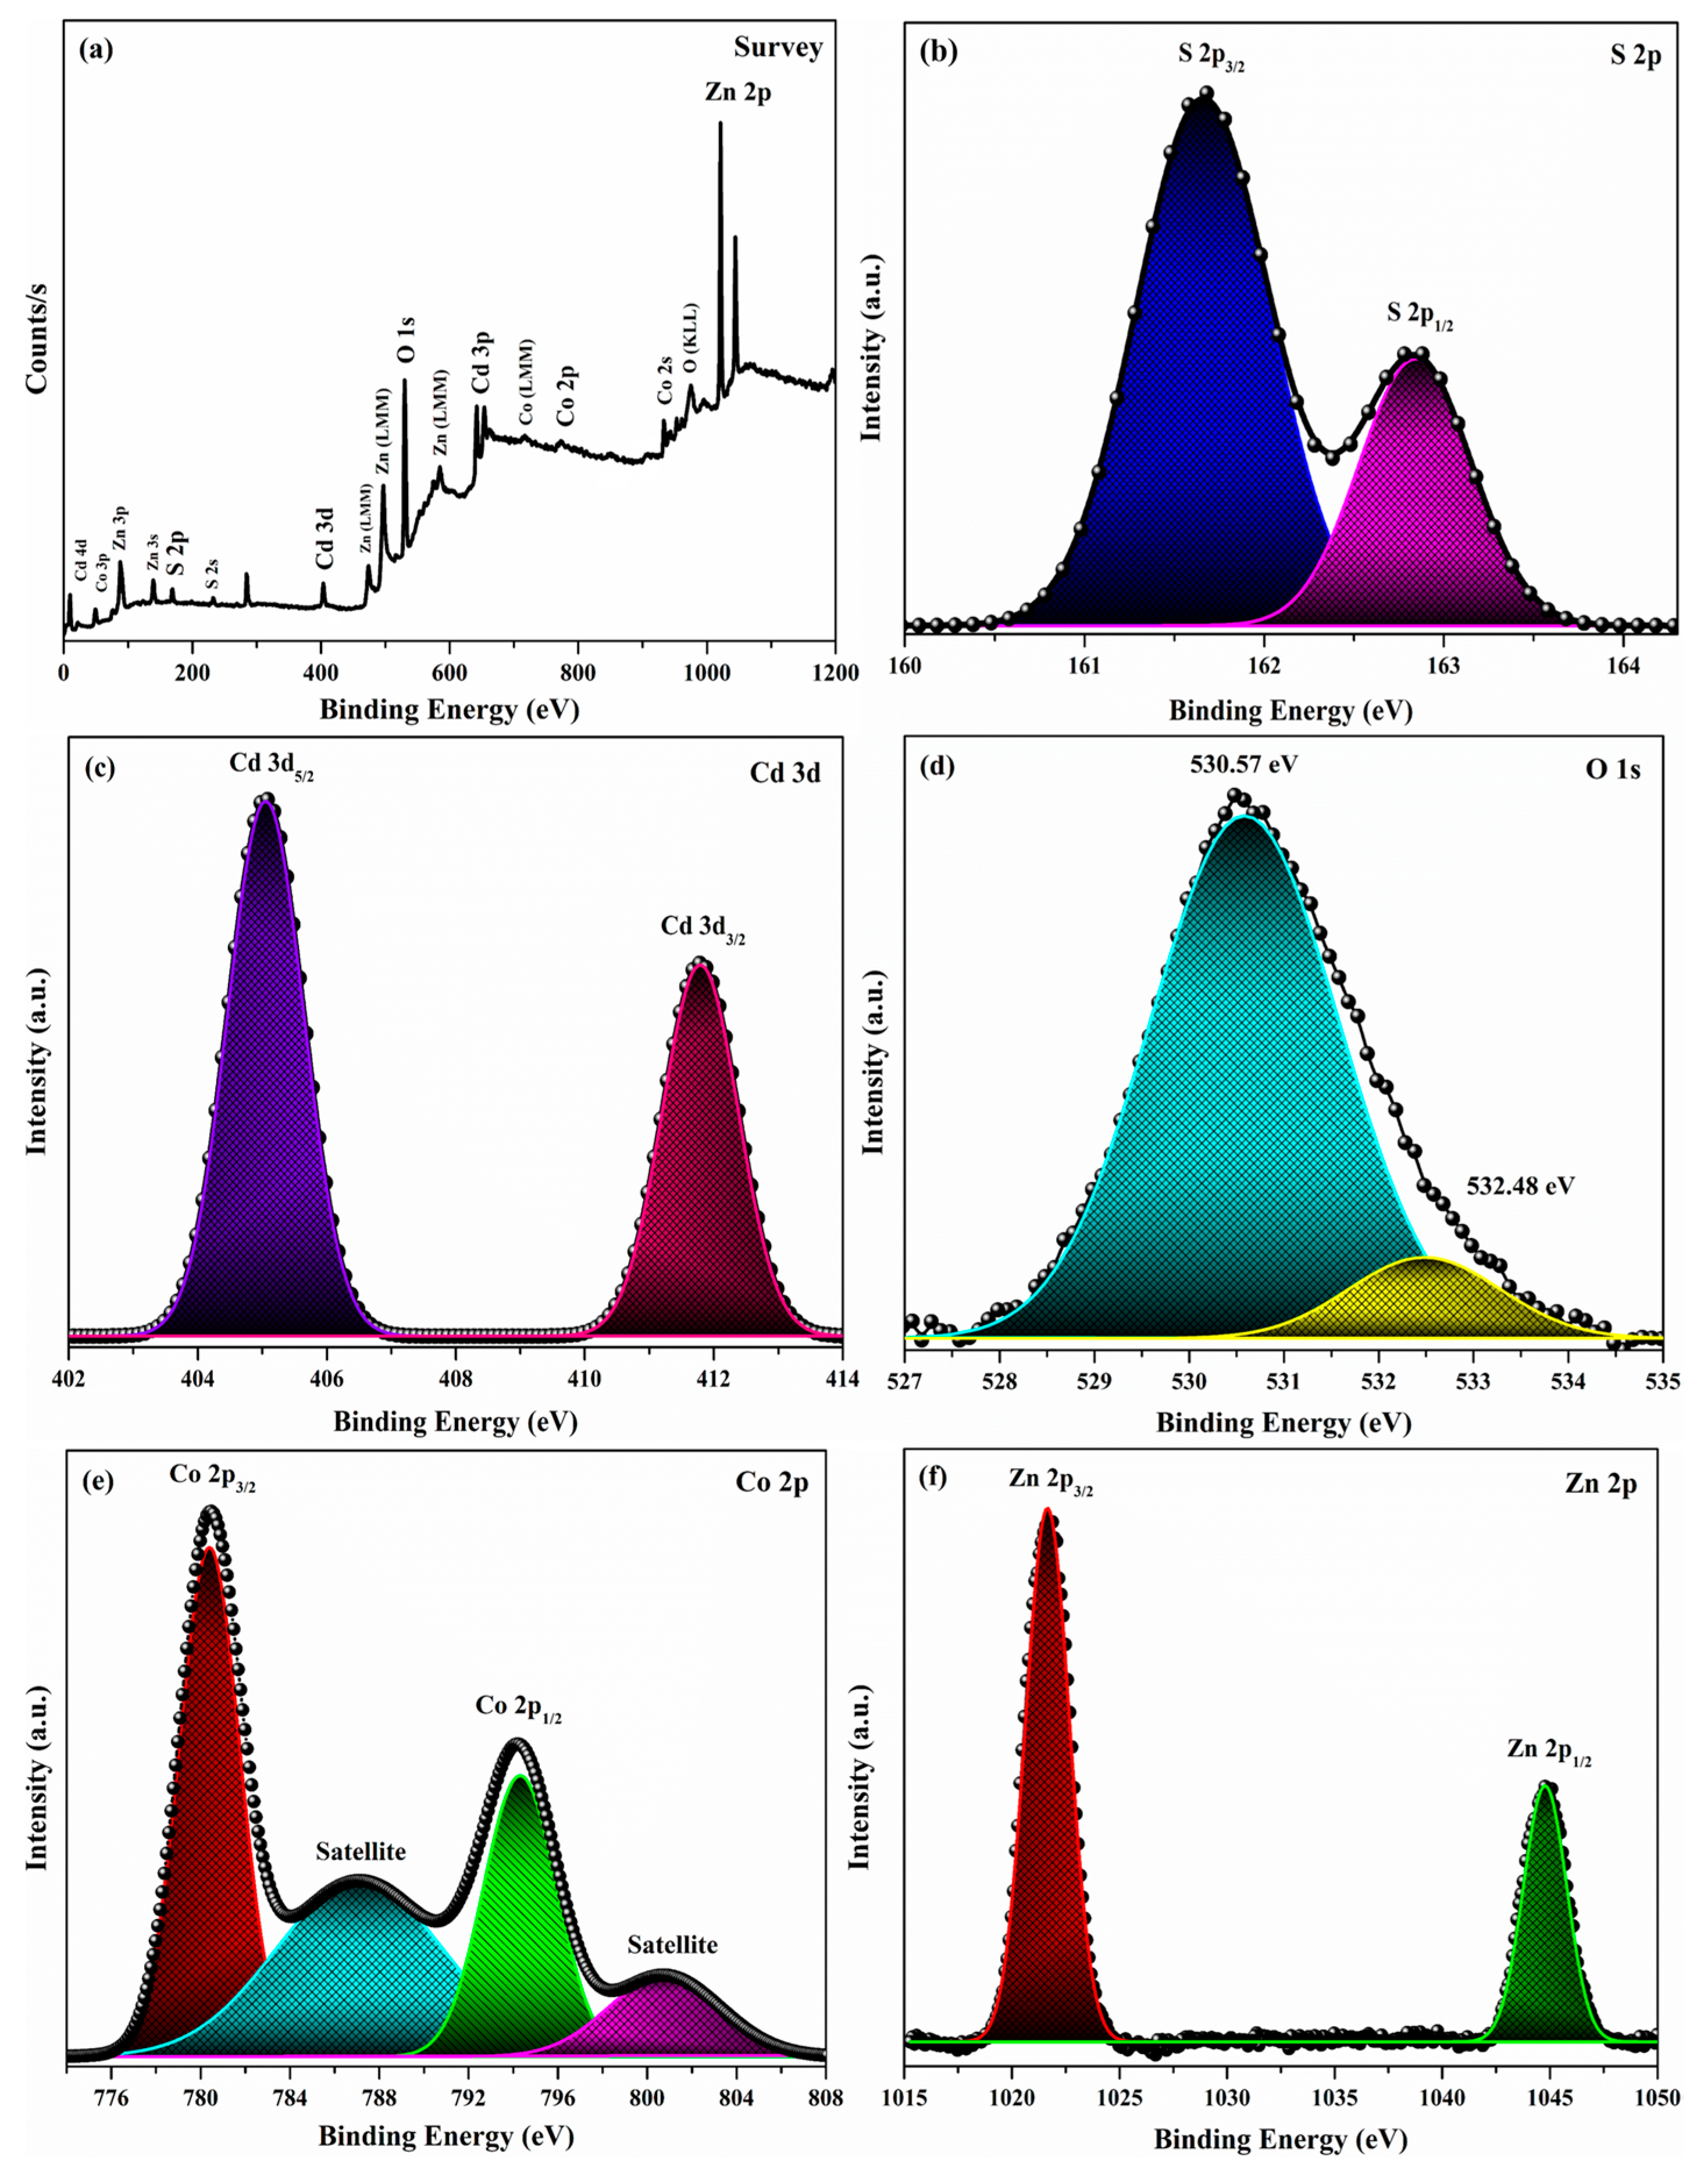
Further, the elemental conformation, oxidation states, and bonding features of Co-doped ZnO/CdS nanosheets were obtained by XPS analysis and are illustrated in Figure 4. As displayed in Figure 4a, the XPS survey scan of the Co-doped ZnO/CdS nanosheets indicated the presence of S 2p, Cd 3d, O 1s, Co 2p, and Zn 2p elements. The binding energies positioned at 161.67 and 162.83 eV demonstrate the presence of a S2– state in the Cd-S bond, as depicted in Figure 4b [14]. Figure 4c displays the characteristic peaks of Cd located at 404.94 and 411.84 eV, which are ascribed to the Cd 3d5/2 and Cd 3d3/2, respectively. The difference in their binding energies was noted to be 6.74 eV, which affirms the existence of Cd2+ in CdS [16]. In Figure 4d, the sharp peak centered at 530.57 eV demonstrates the existence of O2– in Zn-O and the shoulder peaks at 532.48 eV are attributed to the absorbance of atmospheric oxygen (O-H) [14]. As depicted in Figure 4e, the sharp peaks located at 780.41 and 794.33 eV and satellite peaks at 787.10 and 801.05 eV represent the Co 2p3/2 and Co 2p1/2, respectively. The energy difference of 14 eV proves the existence of Co in a 2+ oxidation state [27]. Figure 4f shows the binding energies of Zn centered at 1021.67 and 1044.74 eV, which are ascribed to Zn 2p3/2 and Zn 2p1/2, respectively. The difference in the binding energies of 23.07 eV confirms the presence of Zn ions in a 2+ oxidation state in ZnO [16].

3.4. Optical Studies

To explore the absorption characteristics of the Co-doped ZnO/CdS nanosheets, the DRS analysis was performed as displayed in Figure 5. From Figure 5a, it can be clearly observed that the absorption edge was strongly shifted towards the higher wavelengths when compared with the bulk ZnO and undoped ZnO/CdS nanostructures [28]. The significant redshift in the absorption edge indicates the successful growth of the ZnO/CdS heterostructure. Further, the incorporation of the Co ions significantly altered the absorption characteristics by forming intermediate energy levels, extending the absorption capacity to the visible region. The energy bandgap of the as-prepared nanosheets was calculated using Tauc method, as shown in Figure 5b. The bandgap energy value was found to be 2.59 eV, which is greatly reduced when compared to that of the pristine ZnO and pure ZnO/CdS [28].
In order to understand the photoemissions related to various defects created in tje Co-doped ZnO/CdS nanosheets, PL measurements were carried out and are depicted in Figure 6. The PL spectrum consists of four peaks located at 368, 426, 507, and 577 nm. The diminished peak positioned at 369 nm is ascribed to the NBE emission, which ascends from the recombined electrons and the holes of the conduction and valance bands, respectively. The other three peaks in the visible spectrum correspond to violet-blue (425 nm), blue-green (507 nm), and yellow (576 nm) emissions respectively. The emission band at 425 nm is associated with the zinc vacancies (VZn) [5]. The minute serrations in the region of 500–520 nm demonstrates the defects corresponding to cadmium and sulphur [6]. A sharp yellow emission peak observed at 576 nm is attributed to the 4A2g(F) → 4T1g(F) electric dipole transition of Co2+ ions [30].

3.5. Magnetic Studies

Figure 7 shows the distinct hysteresis loops observed during the VSM analysis of the Co-doped ZnO/CdS nanosheets. The saturation magnetization (Ms) was recorded as 17.07 × 10⁻³ emu/g, and the retentivity (Mr) was measured to be 1.834 × 10⁻³ emu/g. Earlier work by the authors of [31] was concerned with studying the ferromagnetic behavior of a pure ZnO-CdS composite wherein the ferromagnetic properties of the nanoscale ZnO were attributed to the electron transfer between the zinc and oxygen vacancies for which the defect energy levels due to Zn vacancies were occupied by the p electrons of oxygen. As is evident from Table 2, the Co-doped ZnO/CdS displayed considerably better values of saturation magnetization and retentivity. The doping of Cobalt might have induced (i) compound formation, (ii) the generation/increase of defects such as VO, Zin, VZn, and Oin, and (iii) the incorporation of Co2+ ions into the host lattice. However, no compound formation was detected in the XRD studies, while some PL peaks were attributed to vacancies. Thus, in the present study, mechanisms (ii) and (iii) were said to contribute towards the improved magnetic behavior. The interaction of the Co2+ ions with the defects resulted in the formation of polarons that are responsible for the improved ferromagnetic behavior in the dilute magnetic semiconductor (DMS) system. According to the bound magnetic polaron (BMP) model, a BMP includes a polaron generated from a defect and some magnetic dopant ions located within its strain field, resulting in a bound state responsible for ferromagnetism [32].

3.6. Chromaticity Analysis

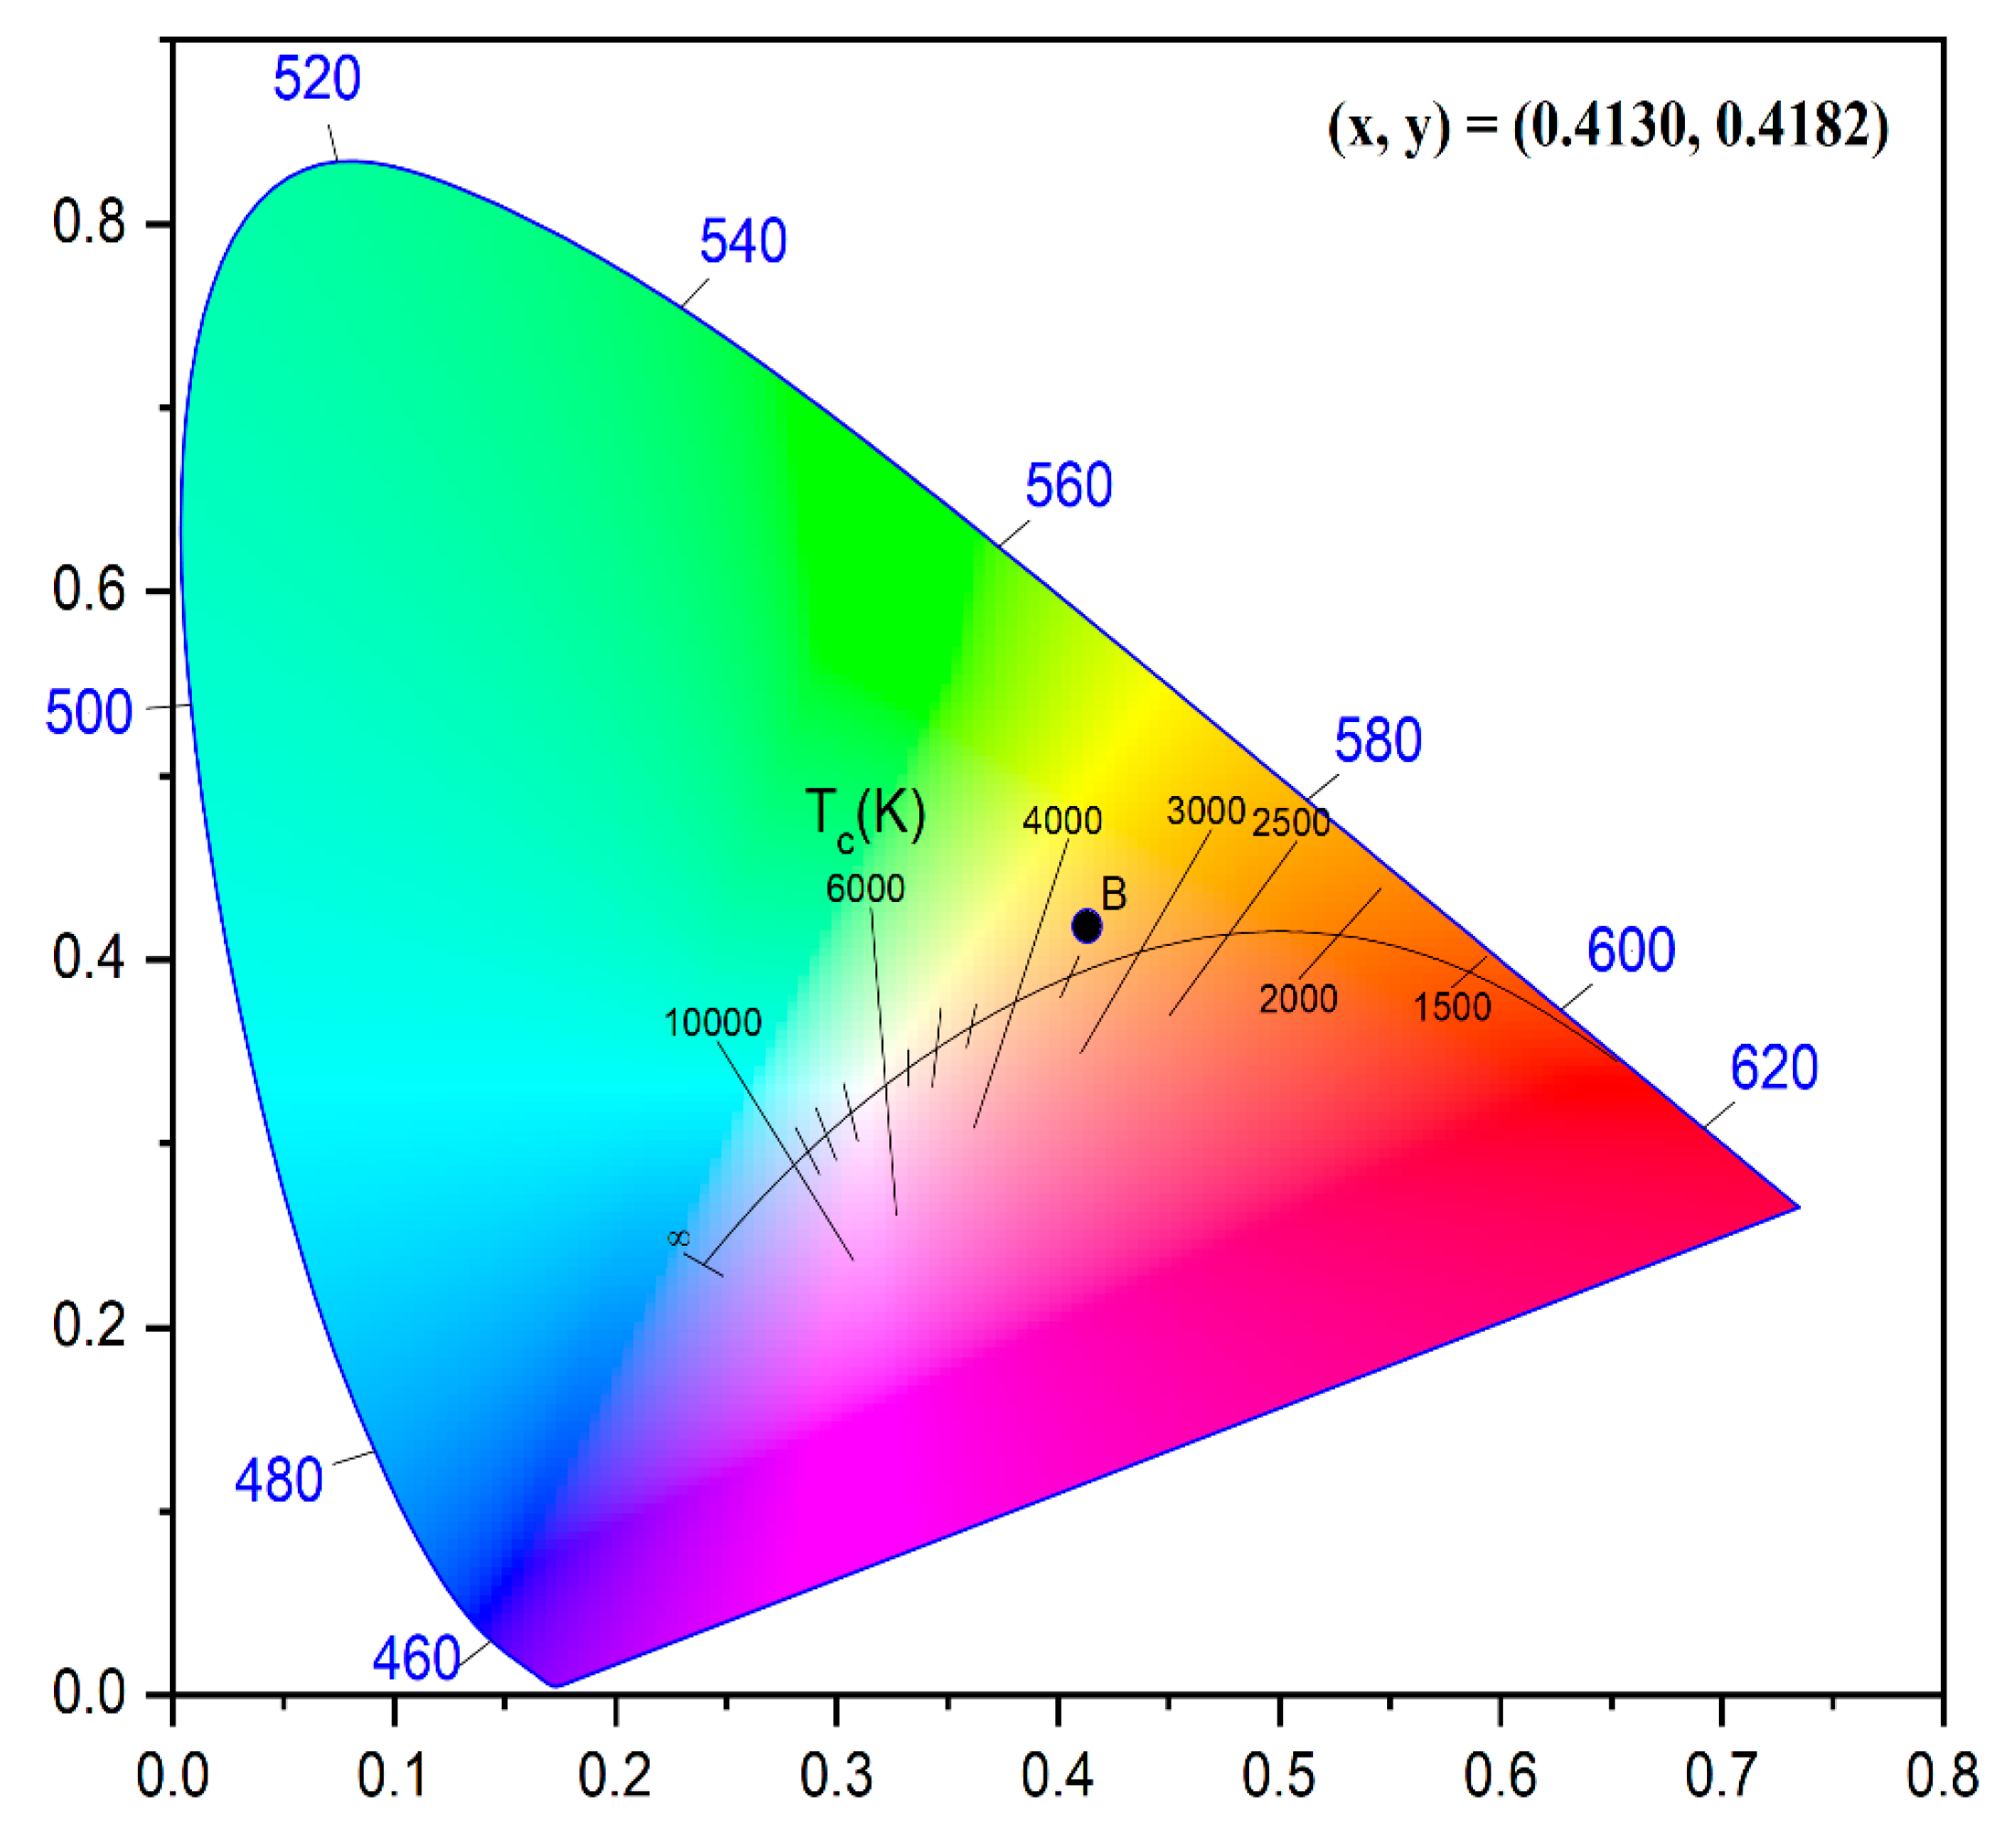
The emission color of the test material plays a vibrant role in optoelectronics and display devices [33]. Figure 8 displays the CIE 1931 chromaticity diagram of Co-doped ZnO/CdS nanosheets. CIE graphic uses the coordinates (x = 0.4130, y = 0.4182), calculated from PL data, to display the emission color of nanosheets. The yellowish orange emission of the Co-doped ZnO/CdS nanosheets was confirmed by the CIE diagram. Therefore, the Co-doped ZnO/CdS nanosheets may be beneficial for a variety of applications, such as in display devices and optoelectronics. By employing the chromaticity coordinates (x, y), the correlated color temperature (CCT) was computed using the McCamy equation [31].
C C T = 449   n 3 + 3525   n 2 6823.3   n + 5520.33
where the inverse slope line n = ( x x e ) / ( y y e ) has x e = 0.3320 and y e = 0.1858 . The CCT is a measure of how colourful the light seems to be. The CCT in the current investigation was estimated to be 3540.58 K, which corresponds to a yellowish orange emission.

4. Conclusions

Herein, Co-doped ZnO/CdS nanosheets were synthesized by a simple, in situ hydrothermal route in order to investigate the influence of divalent impurity ions on the structural, morphological, optical and magnetic properties of test material. XRD confirmed the formation of a hexagonal wurtzite structure for both ZnO and CdS. A sheet-like morphology was obtained from SEM, TEM, and HR-TEM analyses. The presence of essential elements (S, Cd, O, Co, and Zn) was confirmed by elemental mapping and XPS analysis. The absorption capacity of ZnO/CdS was significantly extended into the visible region by Co-doping. The bandgap energy (2.59 eV) was also tuned well when compared with the pure ZnO and undoped ZnO/CdS nanostructures. A strong yellow emission band was observed in the PL spectrum at 577 nm which was attributed to the 4A2g(F) → 4T1g(F) electric dipole transition. The saturation magnetization and retentivity improved by 28 and 20%, respectively, due to the enhanced defects/vacancies and interaction through polarons. The estimated CCT value (3540.58 K) proposes a warm white light emission. These results suggest that the test materials are suitable for the development of next-generation optoelectronic devices.

Supplementary Materials

The following supporting information can be downloaded at: https://www.mdpi.com/article/10.3390/electronics12051245/s1, Figure S1: EDS spectrum of Co-doped ZnO/CdS nanosheets.

Author Contributions

Conceptualization and methodology, data acquisition, writing—original draft preparation, L.M.; Formal analysis, writing—original draft preparation, K.V.; conceptualization and methodology, writing—original draft preparation and editing, funding acquisition, T.R.G.; Conceptualization, formal analysis, writing—editing, R.K. All authors have read and agreed to the published version of the manuscript.

Funding

This research received no external funding.

Data Availability Statement

Not applicable.

Acknowledgments

The authors, G.T.R. and M.L.P., would like to thank the GMR Institute of Technology for the financial assistance provided under the SEED grant.

Conflicts of Interest

The authors have no conflict of interest to declare that are relevant to the content of this article.

References

  1. Radhika, P.; Achary, K.M.R.; Sreekanth, M. A study of tunable optical properties of zno/cds heterostructures with varying shell thickness structures. Mater. Today Proc. 2021, 46, 903–907. [Google Scholar] [CrossRef]
  2. Gao, H.; Wang, Y.; Wang, S.; Yang, H.; Yi, Z. A simple fabrication, microstructure, optical, photoluminescence and supercapacitive performances of MgMoO4/MgWO4 heterojunction micro/nanocomposites. Solid State Sci. 2022, 129, 106909. [Google Scholar] [CrossRef]
  3. Li, X.; Liu, S.; Fan, K.; Liu, Z.; Song, B.; Yu, J. Mof-based transparent passivation layer modified zno nanorod arrays for enhanced photo-electrochemical water splitting. Adv. Energy Mat. 2018, 8, 1800101. [Google Scholar] [CrossRef]
  4. Cai, L.; Du, Y.; Guan, X.; Shen, S. Cds nanocrystallites sensitized zno nanorods with plasmon enhanced photoelectrochemical performance. Chin. Chem. Lett. 2019, 30, 2363–2367. [Google Scholar] [CrossRef]
  5. Gurugubelli, T.R.; Ravikumar, R.V.S.S.N.; Koutavarapu, R. Structural, optical, and luminescence properties of Ni2+-doped ZnO-CdS nanocomposite: Synthesis and investigations for green light emission. Chem. Pap. 2022, 76, 557–566. [Google Scholar] [CrossRef]
  6. Gurugubelli, T.R.; Ravikumar, R.V.S.S.N.; Koutavarapu, R. Structural, optical, and photoluminescence properties of Cr3+ ion-doped ZnO-CdS nanocomposite: Synthesis and investigations for yellow emission. J. Electron. Mater. 2022, 51, 1876–1883. [Google Scholar] [CrossRef]
  7. Arun, V.; Manikandan, V.; AlSalhi, M.S.; Devanesan, S.; Priyadharsan, A.; Ramesh, K.K.A.; Maadeswaran, P. An efficient optical properties of sn doped ZnO/CdS based solar light driven nanocomposites for enhanced photocatalytic degradation applications. Chemosphere 2022, 300, 134460. [Google Scholar] [CrossRef]
  8. Gao, R.; Zhang, X.; Wu, Y.; Gao, S.; Liu, L.; Xu, Y.; Cheng, X.; Zheng, M.; Zhou, X.; Huo, L. In-situ controllable assembly of 3d zno-zns heterojunction nanotube arrays for enhancing NO2-sensing performance at low energy consumption and sensing mechanism. Sens. Actuators B 2023, 380, 133304. [Google Scholar] [CrossRef]
  9. Sun, H.; Park, S.-J. Highly efficient reduction of aqueous Cr(vi) with novel zno/sns nanocomposites through the piezoelectric effect. J. Environ. Sci. 2022, 118, 57–66. [Google Scholar] [CrossRef]
  10. Bai, M.; Chen, M.; Li, X.; Wang, Q. One-step cvd growth of ZnO nanorod/SnO2 film heterojunction for NO2 gas sensor. Sens. Actuators B 2022, 373, 132738. [Google Scholar] [CrossRef]
  11. Tsai, C.-K.; Lee, Y.-C.; Nguyen, T.T.; Horng, J.-J. Levofloxacin degradation under visible-led photo-catalyzing by a novel ternary Fe–ZnO/WO3 nanocomposite. Chemosphere 2022, 298, 134285. [Google Scholar] [CrossRef]
  12. Wang, S.; Liu, P.; Meng, C.; Wang, Y.; Zhang, L.; Pan, L.; Yin, Z.; Tang, N.; Zou, J.-J. Boosting photoelectrochemical water splitting by Au@Pt modified ZnO/CdS with synergy of au-s bonds and surface plasmon resonance. J. Catal. 2022, 408, 196–205. [Google Scholar] [CrossRef]
  13. Khan, Z.R.; Alshammari, A.S.; Shkir, M.; AlFaify, S. Linear, third order nonlinear optical and photoluminescence properties of Cd0.99Zn0.09S/ZnO nanocomposite thin films for optoelectronics applications. Surf. Interf. 2020, 20, 100561. [Google Scholar] [CrossRef]
  14. Zhou, Q.; Li, L.; Xin, Z.; Yu, Y.; Wang, L.; Zhang, W. Visible light response and heterostructure of composite CdS@ZnS–ZnO to enhance its photocatalytic activity. J. Alloys Compd. 2020, 813, 152190. [Google Scholar] [CrossRef]
  15. Kolaei, M.; Tayebi, M.; Masoumi, Z.; Lee, B.-K. A novel approach for improving photoelectrochemical water splitting performance of ZnO-CdS photoanodes: Unveiling the effect of surface roughness of zno nanorods on distribution of cds nanoparticles. J. Alloys Compd. 2022, 906, 164314. [Google Scholar] [CrossRef]
  16. Guo, X.; Liu, X.; Yan, J.; Liu, S. Heteroepitaxial growth of core-shell zno/cds heterostructure for efficient and stable photocatalytic hydrogen generation. Int. J. Hydrogen Energy 2022, 47, 34410–34420. [Google Scholar] [CrossRef]
  17. Zhang, C.; Li, N.; Chen, D.; Xu, Q.; Li, H.; He, J.; Lu, J. The ultrasonic-induced-piezoelectric enhanced photocatalytic performance of ZnO/CdS nanofibers for degradation of bisphenol a. J. Alloys Compd. 2021, 885, 160987. [Google Scholar] [CrossRef]
  18. Revathi, M.; Jeyakumari, A.P.; Saravanan, S. Design and fabrication of ZnO/CdS heterostructured nanocomposites for enhanced hydrogen evolution from solar water splitting. Inorg. Chem. Commun. 2021, 134, 109056. [Google Scholar] [CrossRef]
  19. Zhong, Y.; Yang, S.; Fang, Y.; Wang, K.; Sun, J.; Wu, W. In situ constructing ni foam supported ZnO-CdS nanorod arrays for enhanced photocatalytic and photoelectrochemical activity. J. Alloys Compd. 2021, 868, 159187. [Google Scholar] [CrossRef]
  20. Khan, A.; Shkir, M.; Manthrammel, M.; Ganesh, V.; Yahia, I.; Ahmed, M.; El-Toni, A.M.; Aldalbahi, A.; Ghaithan, H.; AlFaify, S. Effect of Gd doping on structural, optical properties, photoluminescence and electrical characteristics of cds nanoparticles for optoelectronics. Ceram. Int. 2019, 45, 10133–10141. [Google Scholar] [CrossRef]
  21. Sheng, P.; Yao, L.; Yang, P.; Yang, D.; Lu, C.; Cao, K.; Li, W. The origin of enhanced photoelectrochemical activity in metal-ion-doped ZnO/CdS quantum dots. J. Alloys Compd. 2020, 822, 153700. [Google Scholar] [CrossRef]
  22. Ravichandran, A.T.; Karthick, R. Enhanced photoluminescence, structural, morphological and antimicrobial efficacy of Co-doped ZnO nanoparticles prepared by co-precipitation method. Results Mater. 2020, 5, 100072. [Google Scholar] [CrossRef]
  23. Djerdj, I.; Jagličić, Z.; Arčon, D.; Niederberger, M. Co—doped ZnO nanoparticles: Minireview. Nanoscale 2010, 2, 1096–1104. [Google Scholar] [CrossRef]
  24. Dietl, T. A ten-year perspective on dilute magnetic semiconductors and oxides. Nat. Mater. 2010, 9, 965–974. [Google Scholar] [CrossRef] [PubMed] [Green Version]
  25. Krishnanunni, A.; Kompa, A.; Kekuda, D.; Murari, M.; Rao, K.M. Ferromagnetic ordering in Co-Sm co-doped ZnO prismoids grown by co-precipitation method. Inorg. Chem. Commun. 2022, 144, 109857. [Google Scholar] [CrossRef]
  26. Demircan, G.; Yalcin, S.; Alivi, K.; Ceyhan, G.; Acikgoz, A.; Balak, M.V.; Aktas, B.; Das, R. The effect of Co and Mn co-doping on structural and optical properties of ZnO thin films. Opt. Mater. 2022, 126, 112163. [Google Scholar] [CrossRef]
  27. Gurugubelli, T.R.; Babu, B.; Yoo, K. Structural, optical, and magnetic properties of cobalt-doped ZnAl2O4 nanosheets prepared by hydrothermal synthesis. Energies 2021, 14, 2869. [Google Scholar] [CrossRef]
  28. Gurugubelli, T.R.; Ravikumar, R.V.S.S.N.; Koutavarapu, R. Enhanced photocatalytic activity of ZnO/CdS composite nanostructures towards the degradation of rhodamine b under solar light. Catalysts 2022, 12, 84. [Google Scholar] [CrossRef]
  29. He, Y.; Hu, H.; Wang, J.; Wang, X.; Sun, M.; Tian, C.; Deng, C. Fabrication of multi-scale CdS/ZnO heteroarchitectures with boosted dual photocatalytic activities for hydrogen generation and organic dye degradation under solar light. Mater. Res. Bull. 2023, 162, 112180. [Google Scholar] [CrossRef]
  30. Ravindranadh, K.; Babu, B.; Rao, M.C.; Shim, J.; Reddy, C.V.; Ravikumar, R.V.S.S.N. Structural and photoluminescence studies of Co2+ doped Ca–Li hydroxyapatite nanopowders. J. Mater. Sci. Mater. Electron. 2015, 26, 6667–6675. [Google Scholar] [CrossRef]
  31. Rao, G.T.; Stella, R.J.; Babu, B.; Ravindranadh, K.; Reddy, C.V.; Shim, J.; Ravikumar, R. Structural, optical and magnetic properties of Mn2+ doped ZnO-CdS composite nanopowder. Mater. Sci. Eng. B 2015, 201, 72–78. [Google Scholar] [CrossRef]
  32. Singh, G.P.; Aman, A.K.; Singh, R.K.; Roy, M.K. Effect of low co-doping on structural, optical, and magnetic performance of ZnO nanoparticles. Optik 2020, 203, 163966. [Google Scholar] [CrossRef]
  33. Dharmana, G.; Rao, M.P.S.; Potukuchi, D.M. Visible light driven robust photocatalytic activity in vanadium-doped ZnO/SnS core-shell nanocomposites for decolorization of MB dye towards wastewater treatment. Inorg. Nano-Met. Chem. 2022, 52, 1059–1076. [Google Scholar] [CrossRef]
Figure 1. X-ray diffraction pattern of Co-doped ZnO/CdS nanosheets.
Electronics 12 01245 g001
Figure 2. (a) SEM, (b) TEM, (c) HRTEM, and (d) lattice fringe pattern of Co-doped ZnO/CdS nanosheets.
Electronics 12 01245 g002
Figure 3. Elemental mapping of Co-doped ZnO/CdS nanosheets. (a) Mapping region, (b) Zn, (c) O, (d) Cd, (e) S, and (f) Co.
Electronics 12 01245 g003
Figure 4. XPS spectra of Co-doped ZnO/CdS nanosheets. (a) Survey, (b) S 2p, (c) Cd 3d, (d) O 1s, (e) Co 2p, and (f) Zn 2p.
Electronics 12 01245 g004
Figure 5. (a) DRS spectrum and (b) Tauc plot of Co-doped ZnO/CdS nanosheets.
Electronics 12 01245 g005
Figure 6. Photoluminescence spectrum of Co-doped ZnO/CdS nanosheets.
Electronics 12 01245 g006
Figure 7. Magnetic hysteresis curve of Co-doped ZnO/CdS nanosheets.
Electronics 12 01245 g007
Figure 8. 1931 CIE diagram of Co-doped ZnO/CdS nanosheets.
Electronics 12 01245 g008
Table 1. Average crystallite size, microstrain, and dislocation density of Co-doped ZnO/CdS nanosheets.
MaterialAverage Crystallite Size (D) nmLattice Strain
(ε × 10−3)
Dislocation Density
(δ × 1015/m2)
ZnO/CdS [28]261.261.48
Co doped ZnO/CdS231.5051.89
Table 2. Coercivity, saturation magnetization and retentivity of Co-doped ZnO/CdS nanosheets.
ParameterZnO/CdSCo Doped ZnO/CdS
Coercivity119.32 Oe117.47 Oe
Saturation Magnetization13.35 × 10−3 emu/g17.07 × 10−3 emu/g
Retentivity1.52 × 10−3 emu/g1.83 × 10−3 emu/g
Disclaimer/Publisher’s Note: The statements, opinions and data contained in all publications are solely those of the individual author(s) and contributor(s) and not of MDPI and/or the editor(s). MDPI and/or the editor(s) disclaim responsibility for any injury to people or property resulting from any ideas, methods, instructions or products referred to in the content.