1. Introduction
Cyber-attacks and threats caused about USD 1 trillion in damage to the global economy in 2020 [
1]. This threat is projected to grow more than tenfold by 2025, with 10.5 trillion (in USD) in damage to the global economy [
2]. To mitigate the global economic loss of a cyber-related threat, timely and effective analysis of cyber-related data using deep learning (DL) is required. Previous research has demonstrated the use of the DL technique on network traffic data for generating cyber situational awareness [
3,
4]. DL techniques such as anomaly detection were also used on simulated sensor data, as shown in [
5]. Other than analyzing network traffic data or simulated sensor data, primary data collected through surveys or questionnaires can also provide intelligence on cyber threats [
6]. However, cyber threat intelligence derived from critical DL-based analysis of social media data has never been demonstrated within existing studies [
3,
4,
5,
6,
7,
8,
9].
Recent research works on social media-based analysis have demonstrated dynamic creation of threat indexes using keyword-based extraction [
10,
11]. However, research shown in [
10,
11] provided threat intelligence on different dimensions of COVID-19. While study [
10]. did not use any DL techniques, DL was used in [
11]. This paper used keyword-based extraction of targeted social media information for generating cyber threat indexes and used DL-based anomaly detection on the time-series index (similar to techniques demonstrated in [
11]). Available cyber-related studies such as [
12,
13] only provide cyber defence capability on a personal or organizational level.
According to the literature and to best of my knowledge, existing studies do not report DL-based analytical capability on global countrywide (i.e., national level) cyber threats. However, this paper reports the first study that generates and analyzes time-series indexes on cyber threat analysis. Time-series-based analysis of cyber threat intelligence (depicted in this study) provides in-depth countrywide cyber threat awareness. Using countrywide cyber threat intelligence, strategic decision makers of any country can adjust their cyber preparedness to mitigate the detrimental damages afflicted by cyber criminals. The ability to effectively defend against or launch cyber threats can provide a significant advantage on the battlefield as well.
The innovative methods described within this study were tested and evaluated on a live Twitter feed from 14 October 2022 to 27 December 2022. During these 75 days, global social media posts related to cyber were captured and analyzed with artificial intelligence (AI)-based services such as language detection, translation, and sentiment analysis. By performing data manipulations on 15,983 tweets from 15,315 users (in 47 different languages), cyber threat index for 6 different countries were produced. Finally, convolutional neural network (CNN)-based anomaly detection (a deep learning method) was used to automatically identify anomalies on cyber threat indexes for China, Australia, Russia, Ukraine, Iran, and India. Unlike [
14,
15,
16], this work was evaluated on a mobile environment. It should be mentioned that these countries were not selected in a random manner. They were selected by considering a range of factors such as the
number of social media users (i.e., the US and India have a huge number of Twitter users [
17]), the
concerns of the social media users (i.e., US Twitter users perceiving China and Russia as a cyber threat [
18,
19]), and
current issues (e.g., Russia-Ukraine cyber war, cyber-attacks in Australia [
20,
21,
22,
23] etc.).
CNN was chosen as opposed to other deep learning methods such as the recurrent neural network (RNN), since CNN have reportedly been used in mobile platforms for solving different research problems [
16]. RNN, long short-term memory networks (LSTMs), and other DL implementations are not supported on low-code mobile platforms [
16].
3. Results and Discussion
The presented method was tested and evaluated from 14 October 2022 to 27 December 2022 with a live Twitter feed. During that time, about 15,983 tweets from 15,315 users in 47 different languages were identified by our data gathering process. A range of AI-based analyses, such as language detection, translation, and sentiment analyses were performed on these tweets. In addition, 3718 translations were performed on non-English messages followed by sentiment analysis. For testing each step of the presented method, different technological components were used, as depicted in
Table 5. As seen from
Table 5, the “data gathering and preprocessing” stage mainly used Microsoft Power Automate [
64] along with Azure Cognitive Services [
66] The “data manipulation stage” predominantly used Microsoft SQL Server and Microsoft Power BI desktop-based technologies [
11]. Then, the “deep learning” stage was implemented with a CNN-based anomaly detection algorithm along with an NLP [
71]-based root cause analysis. The deep learning stage was validated using the Microsoft Power BI Desktop. Finally, the real-time visualization aspect of the presented methods was deployed and validated using both the Microsoft Power BI Desktop and Microsoft Power BI Services. As seen from
Table 2, the visualization stage covered the Windows-based dashboard, the Web interface, the iOS app, as well as the Android app on different form factors.
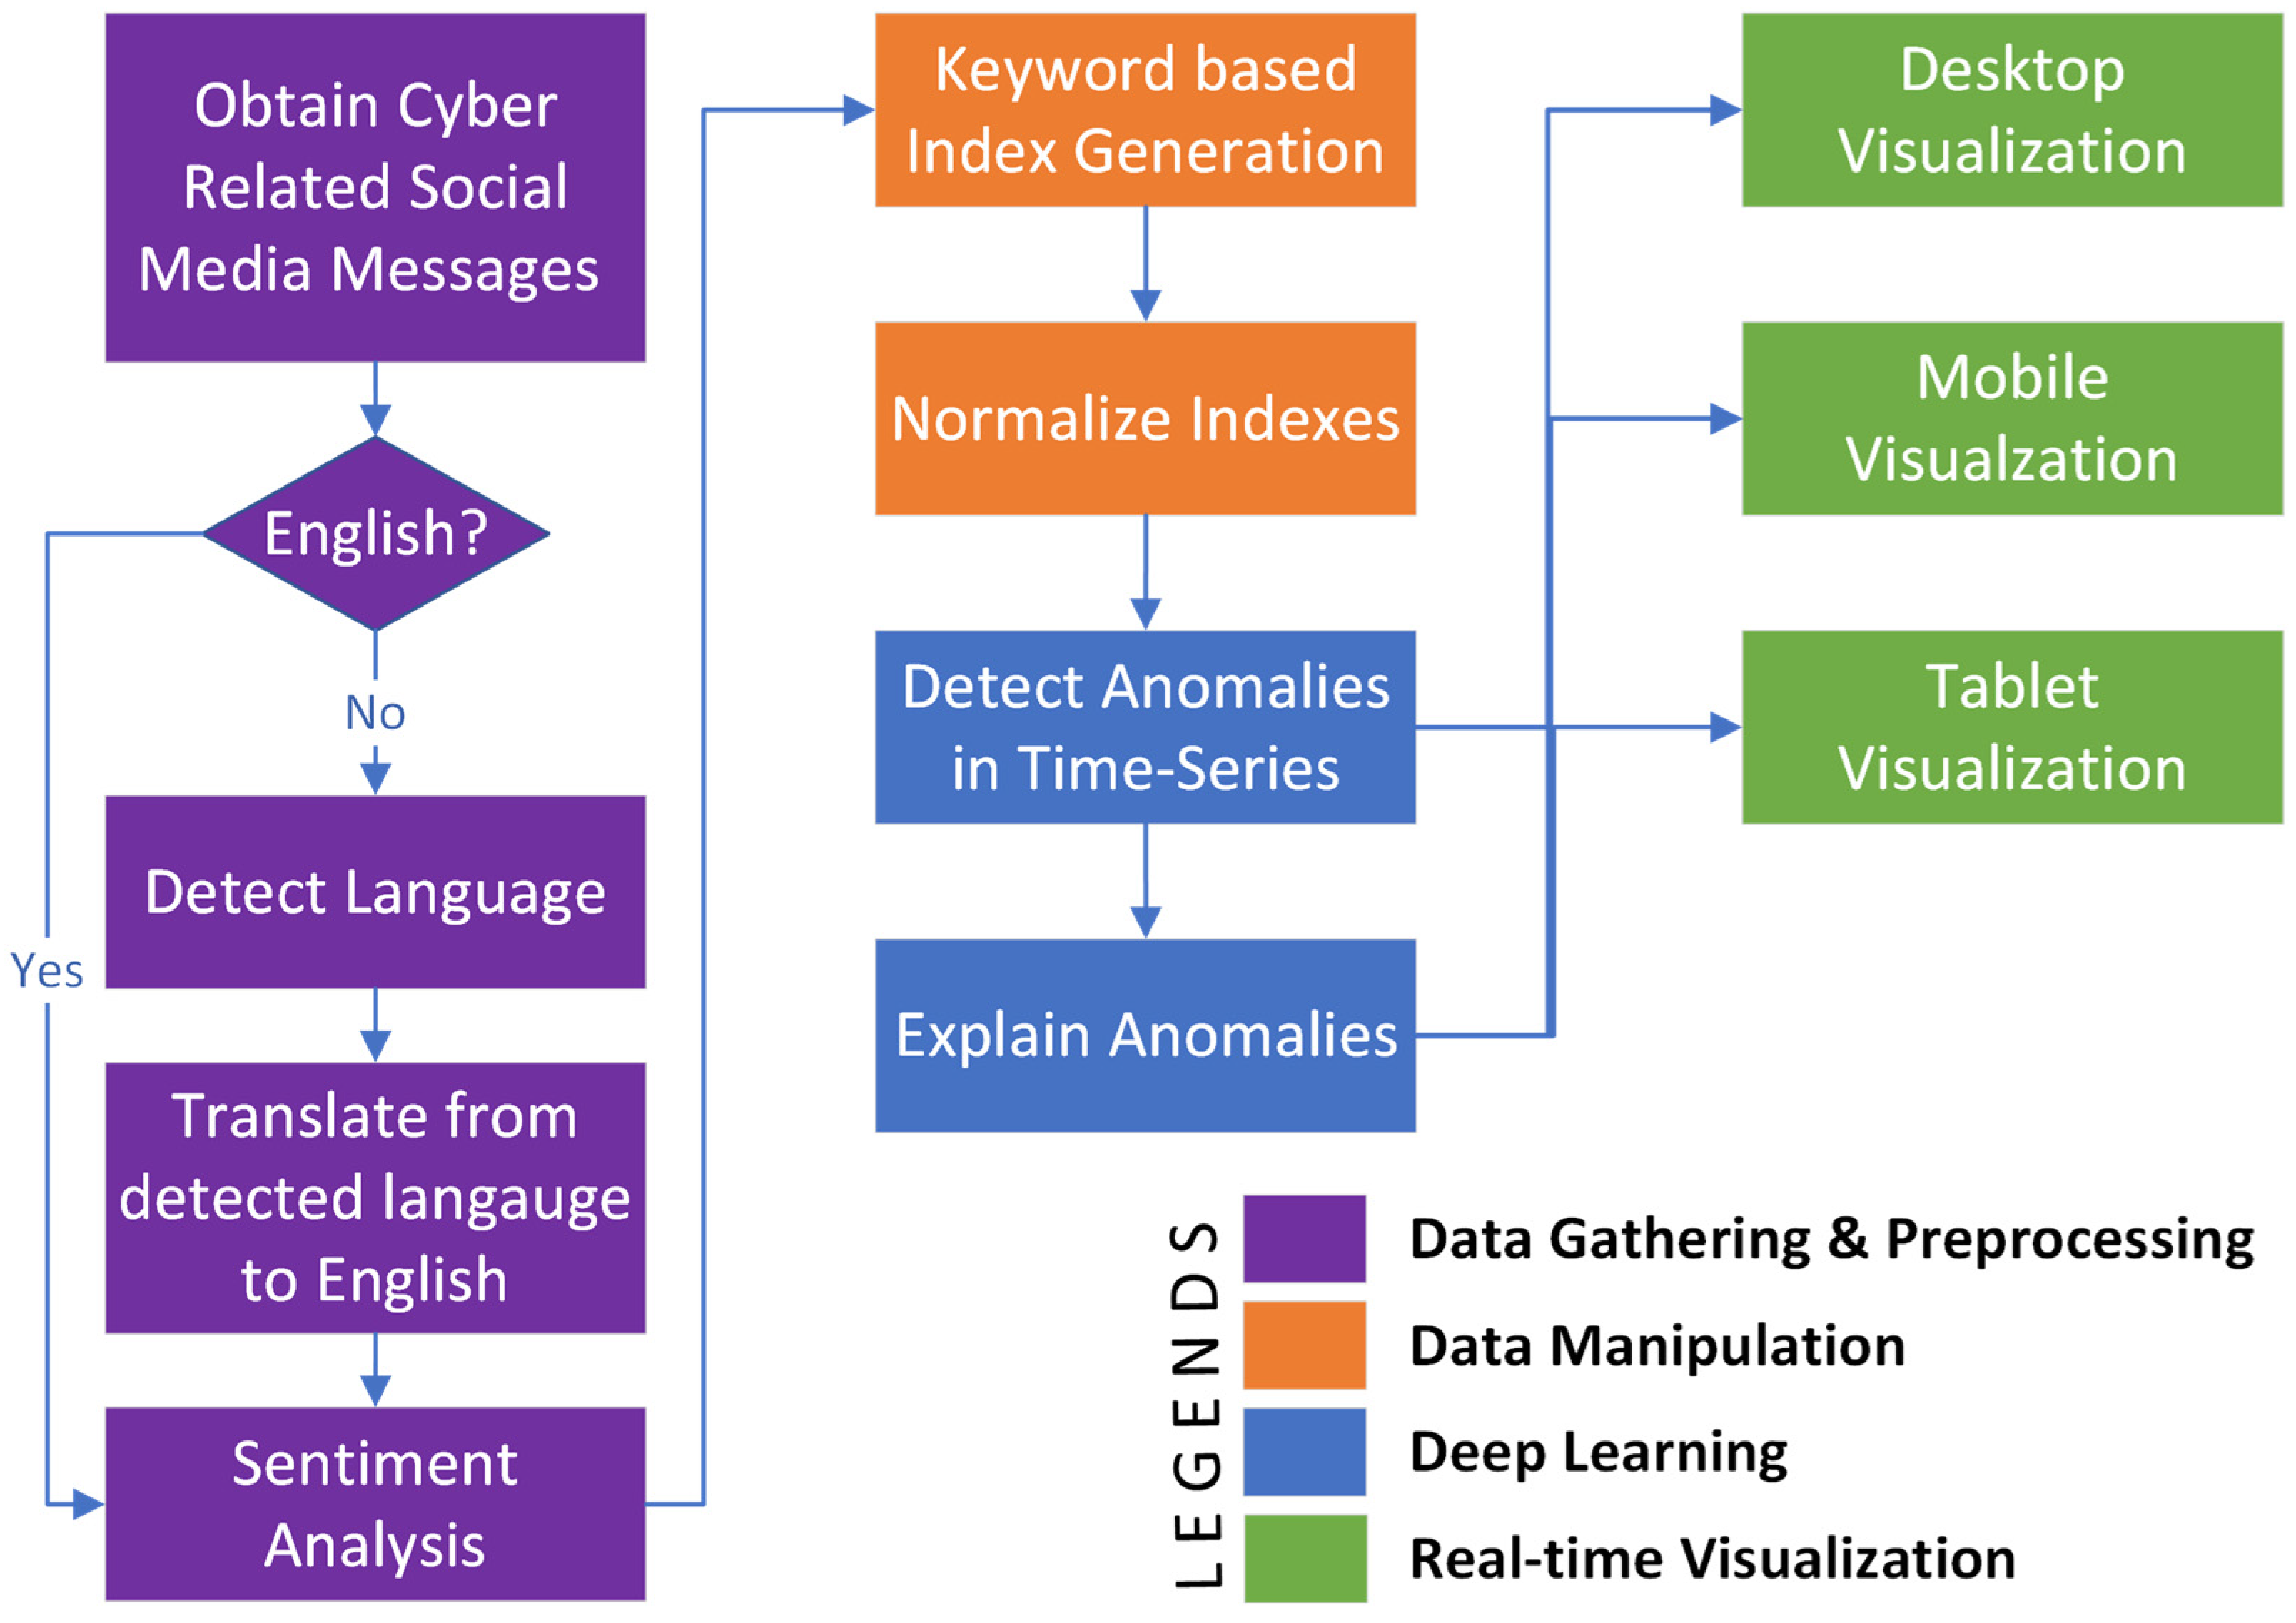
Table 6 demonstrates the method validity for the “data gathering and prepressing” stage (of
Figure 1). As seen in
Table 6, the daily average of sentiment reveals that social media users were most negative (i.e., concerned and critical) about cyber-related issues on 8 November 2022, with an average negative sentiment confidence of 0.477. Using a named entity detection (NER) process, the reason for this social media outcry on the cyber issue could be drilled down into. Moreover, questions such as where cyber concerns are generated could also be found from the identified location. However,
Table 6 reports this location at an aggregated manner, maintaining the privacy of the social media users.
Table 7 demonstrates the method validity for the “data manipulation” stage of
Figure 2. As seen in
Table 7, cyber indexes for six different countries (i.e., China, Australia, Russia, Ukraine, Iran, and India) for 75 days were generated (from 14 October 2022 to 27 December 2022). For generating these indexes, data gathered and prepared at the earlier stage was utilized. Fluctuations of these index values provide an understanding of cyber-related concerns for a particular country on a specific day. Higher index values correspond to a higher level of cyber-related concerns for the selected country. As seen in
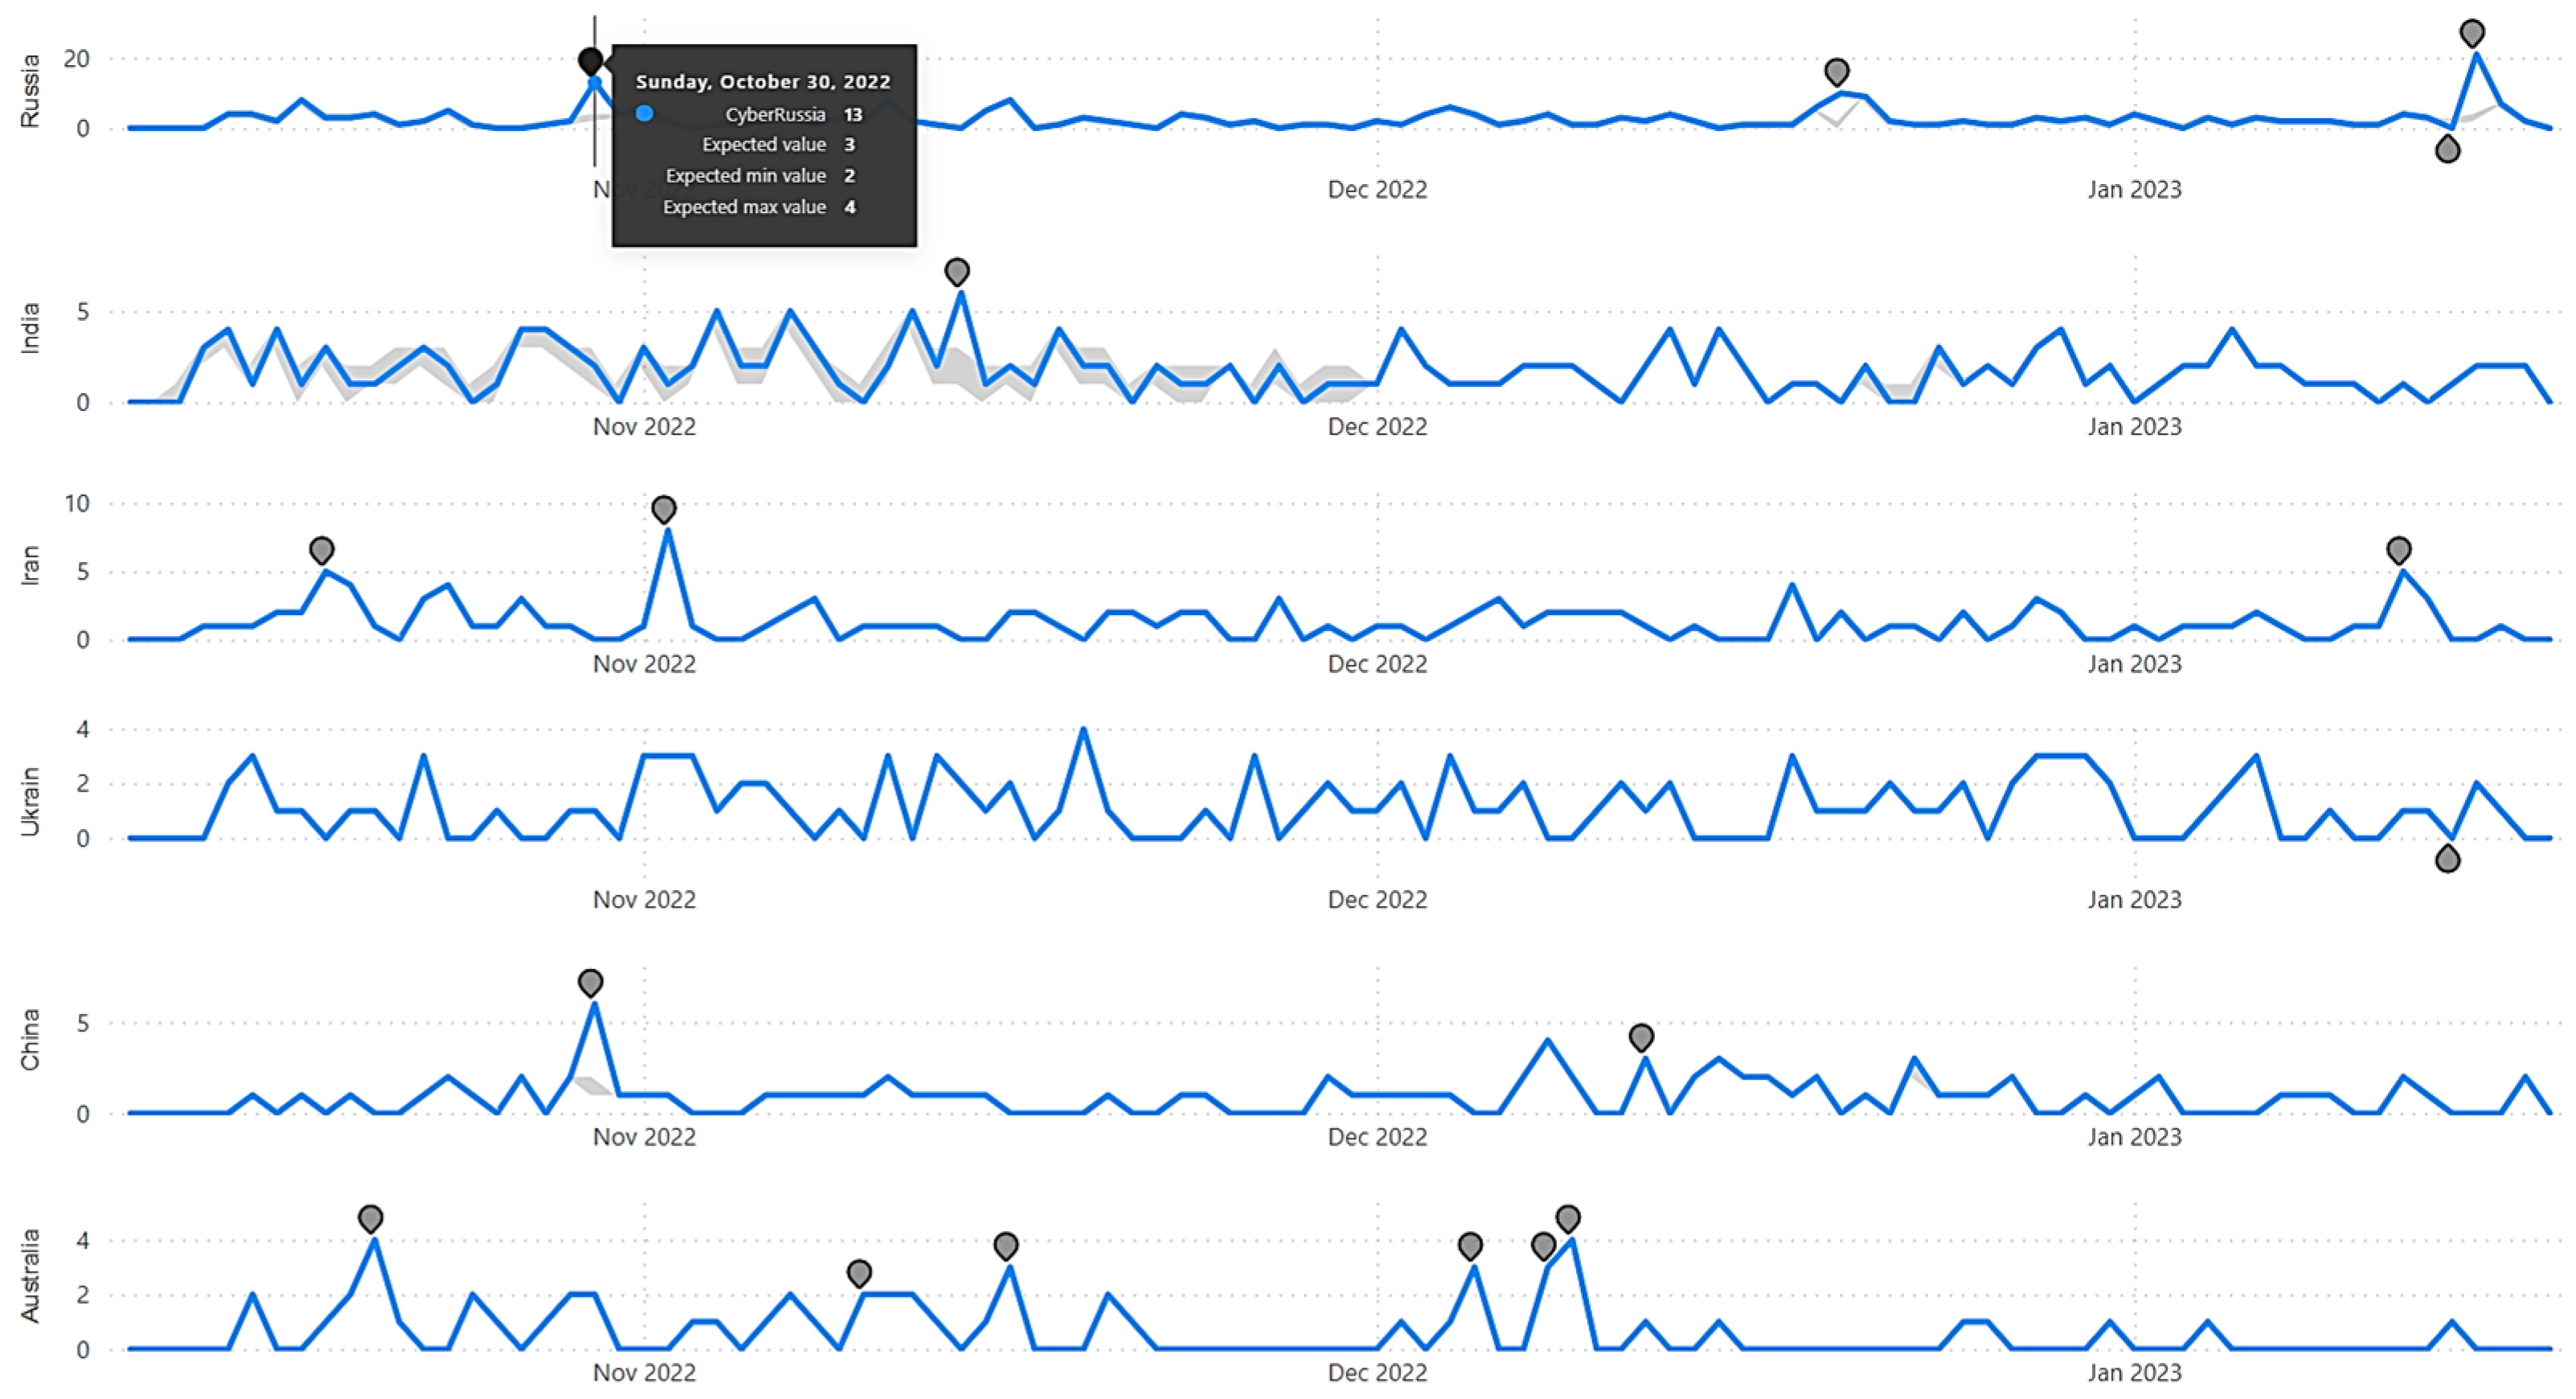
Table 8, with the monitored period (i.e., from 14 October 2022 to 27 December 2022), cyber-related concerns for Russia was at its highest on 30 October 2022 (with the value of the cyber index for Russia being 13 on 30 October 2022). This particular index was also highlighted as an anomaly by the subsequent deep learning process, as depicted in
Figure 3. Using this information, strategic decision makers can adjust their national cyber posture to mitigate the cyber threat on the specific days that were automatically highlighted as anomalies. Using the same process, time-series indexes could be generated on any unit of time (e.g., daily, monthly, quarterly, or yearly). As seen from
Table 5, the index-generation process could use either a SQL Server (with SQL statements) or Microsoft Power BI (with DAX expression). Code snippets displayed within Code 1 and Code 2 demonstrates the keyword-based index-generation process in SQL Statements as well as in DAX expressions. The “data manipulation” subsection of the “method details” section highlights that, apart from creating countrywide cyber indexes, cyber indexes on any other concerns could be created by the methodologies described within this paper. For example, to create a global index on cyber-attack related concerns, keywords such as “attack”, “threat”, “crisis”, “problem”, and “warfare” could be used. Code 3 demonstrates the necessary SQL statement to create such an index. Thus, individual indexes representing different concerns could be generated (e.g., Code 3).
Once the cyber threat indexes are generated, the deep learning stage performs CNN-based anomaly detection, as shown in
Figure 3. As shown in
Figure 3, anomaly detection highlights a number of anomalies for all index values for the six selected countries shown in
Table 7. China, Australia, Russia, Ukraine, Iran, and India had 2, 4, 3, 2, 3, and 1 anomalies detected by the anomaly detection algorithm with 70% sensitivity. By adjusting to a higher level of sensitivity, a higher number of anomalies could be observed by the anomaly detection algorithm, as seen in
Table 8. For example, even though four anomalies were detected for Australia with 70% sensitivity (as shown in
Figure 2), six anomalies were detected with 100% sensitivity (shown in
Table 8). It should be noted that changes in sensitivity did not have any impact on the cyber threat indexes for Iran and India. Both Iran and India retained the same number of anomalies through sensitivity parameterization of 70%, 80%, 90%, and 100%.
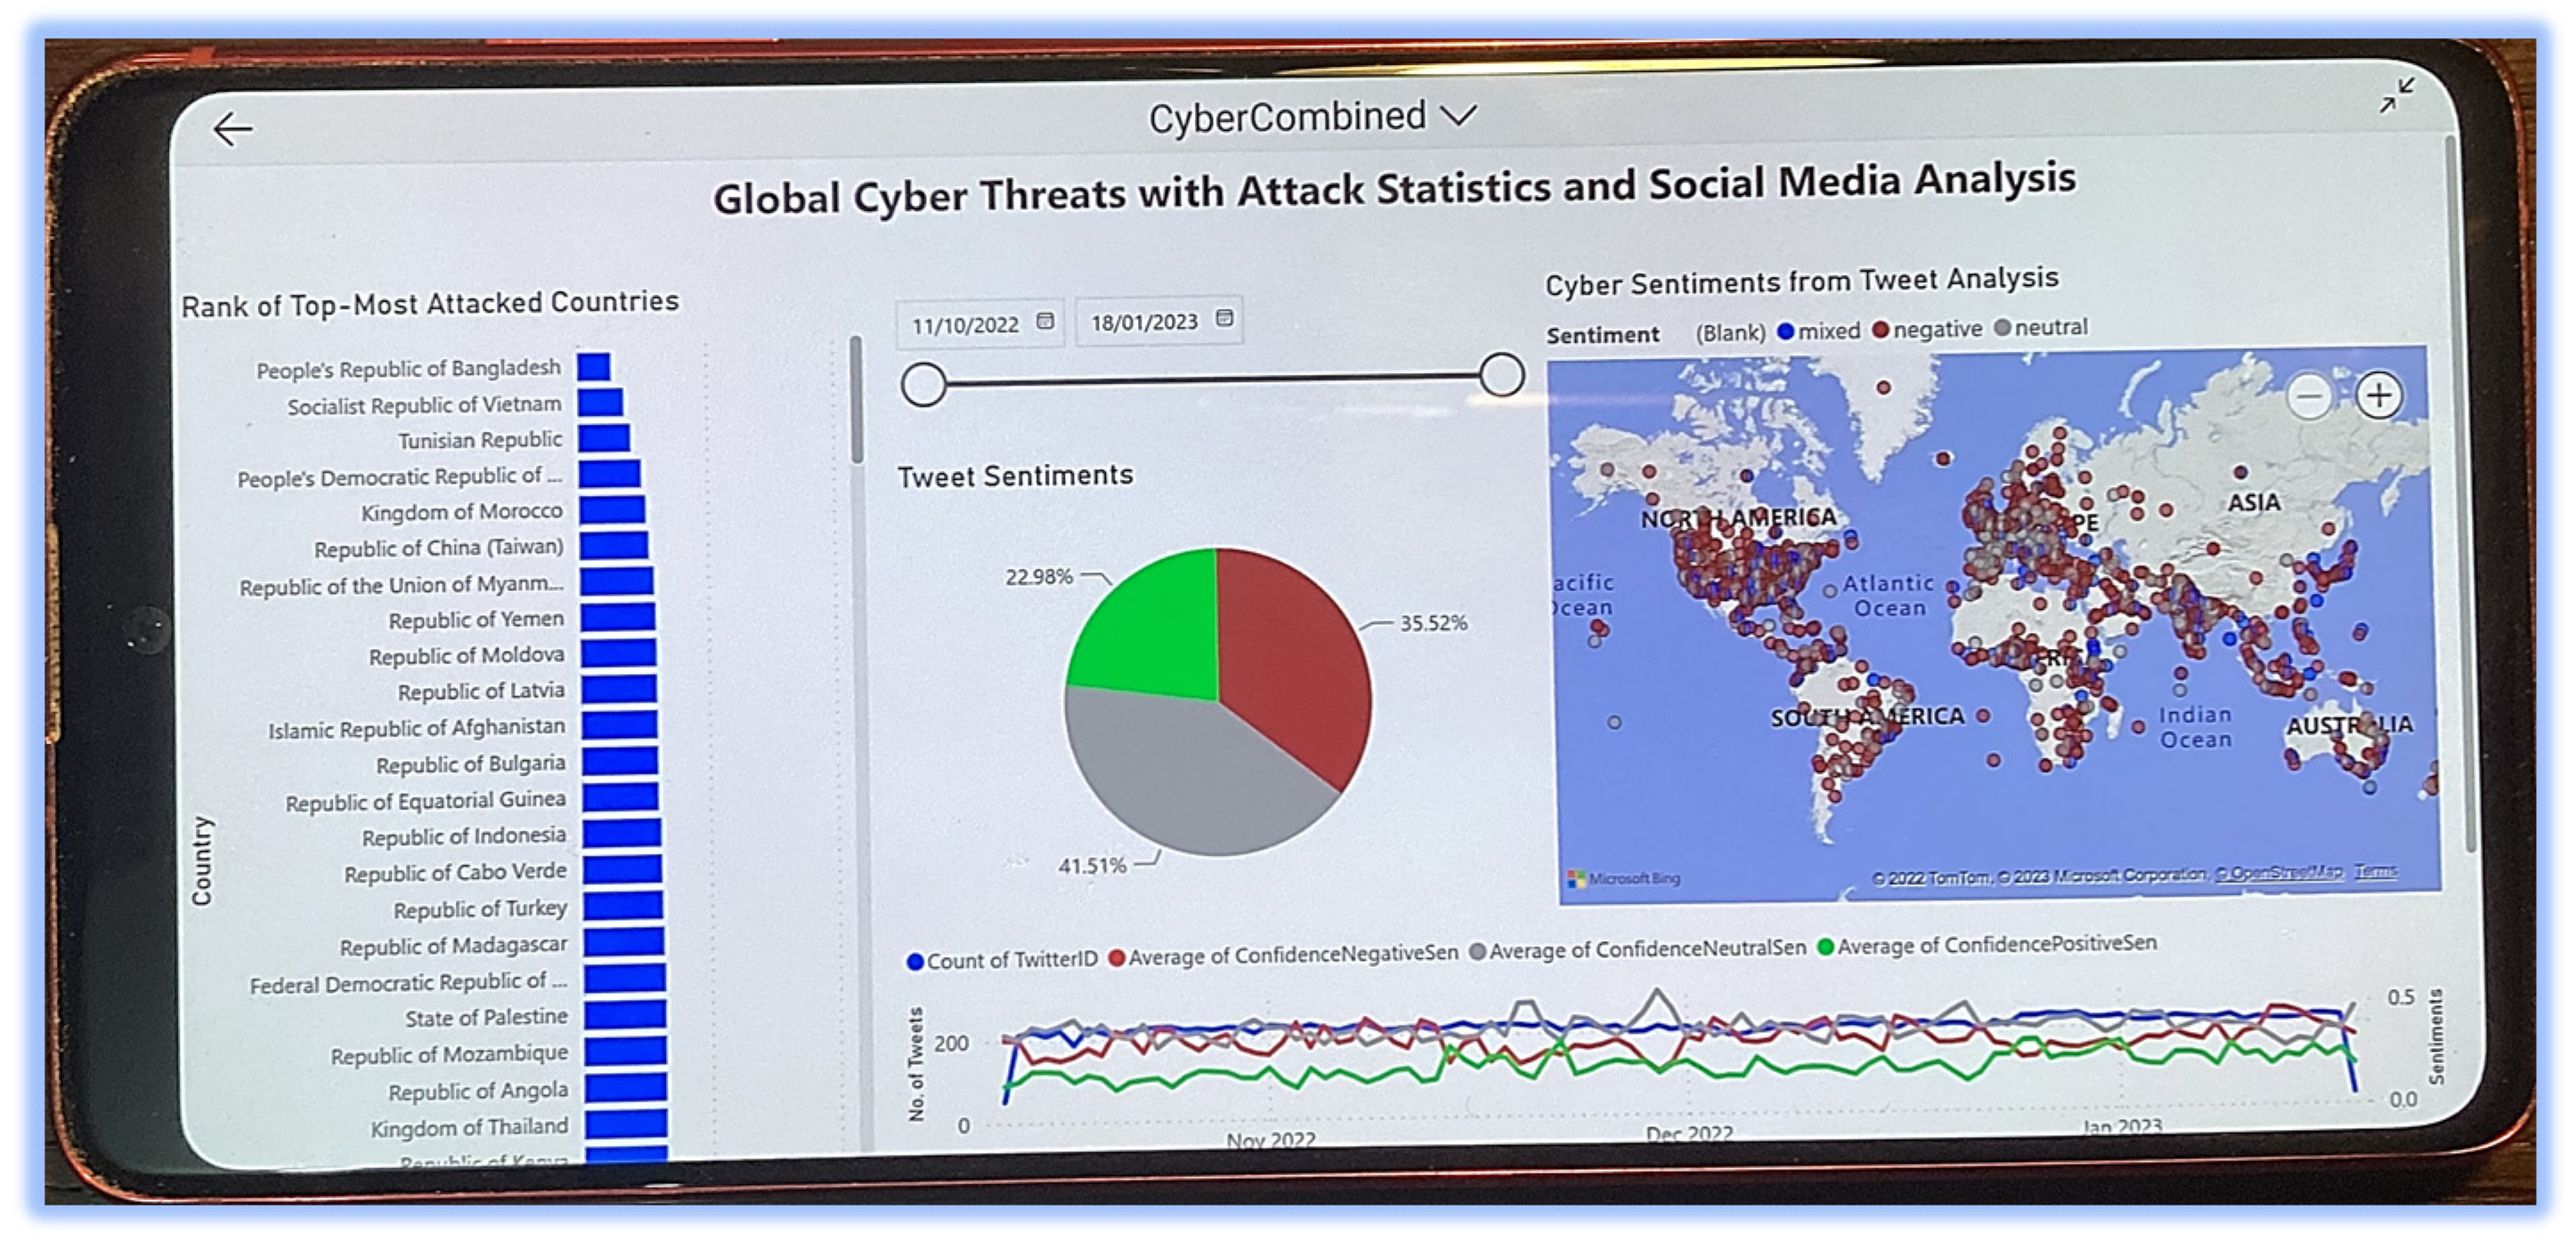
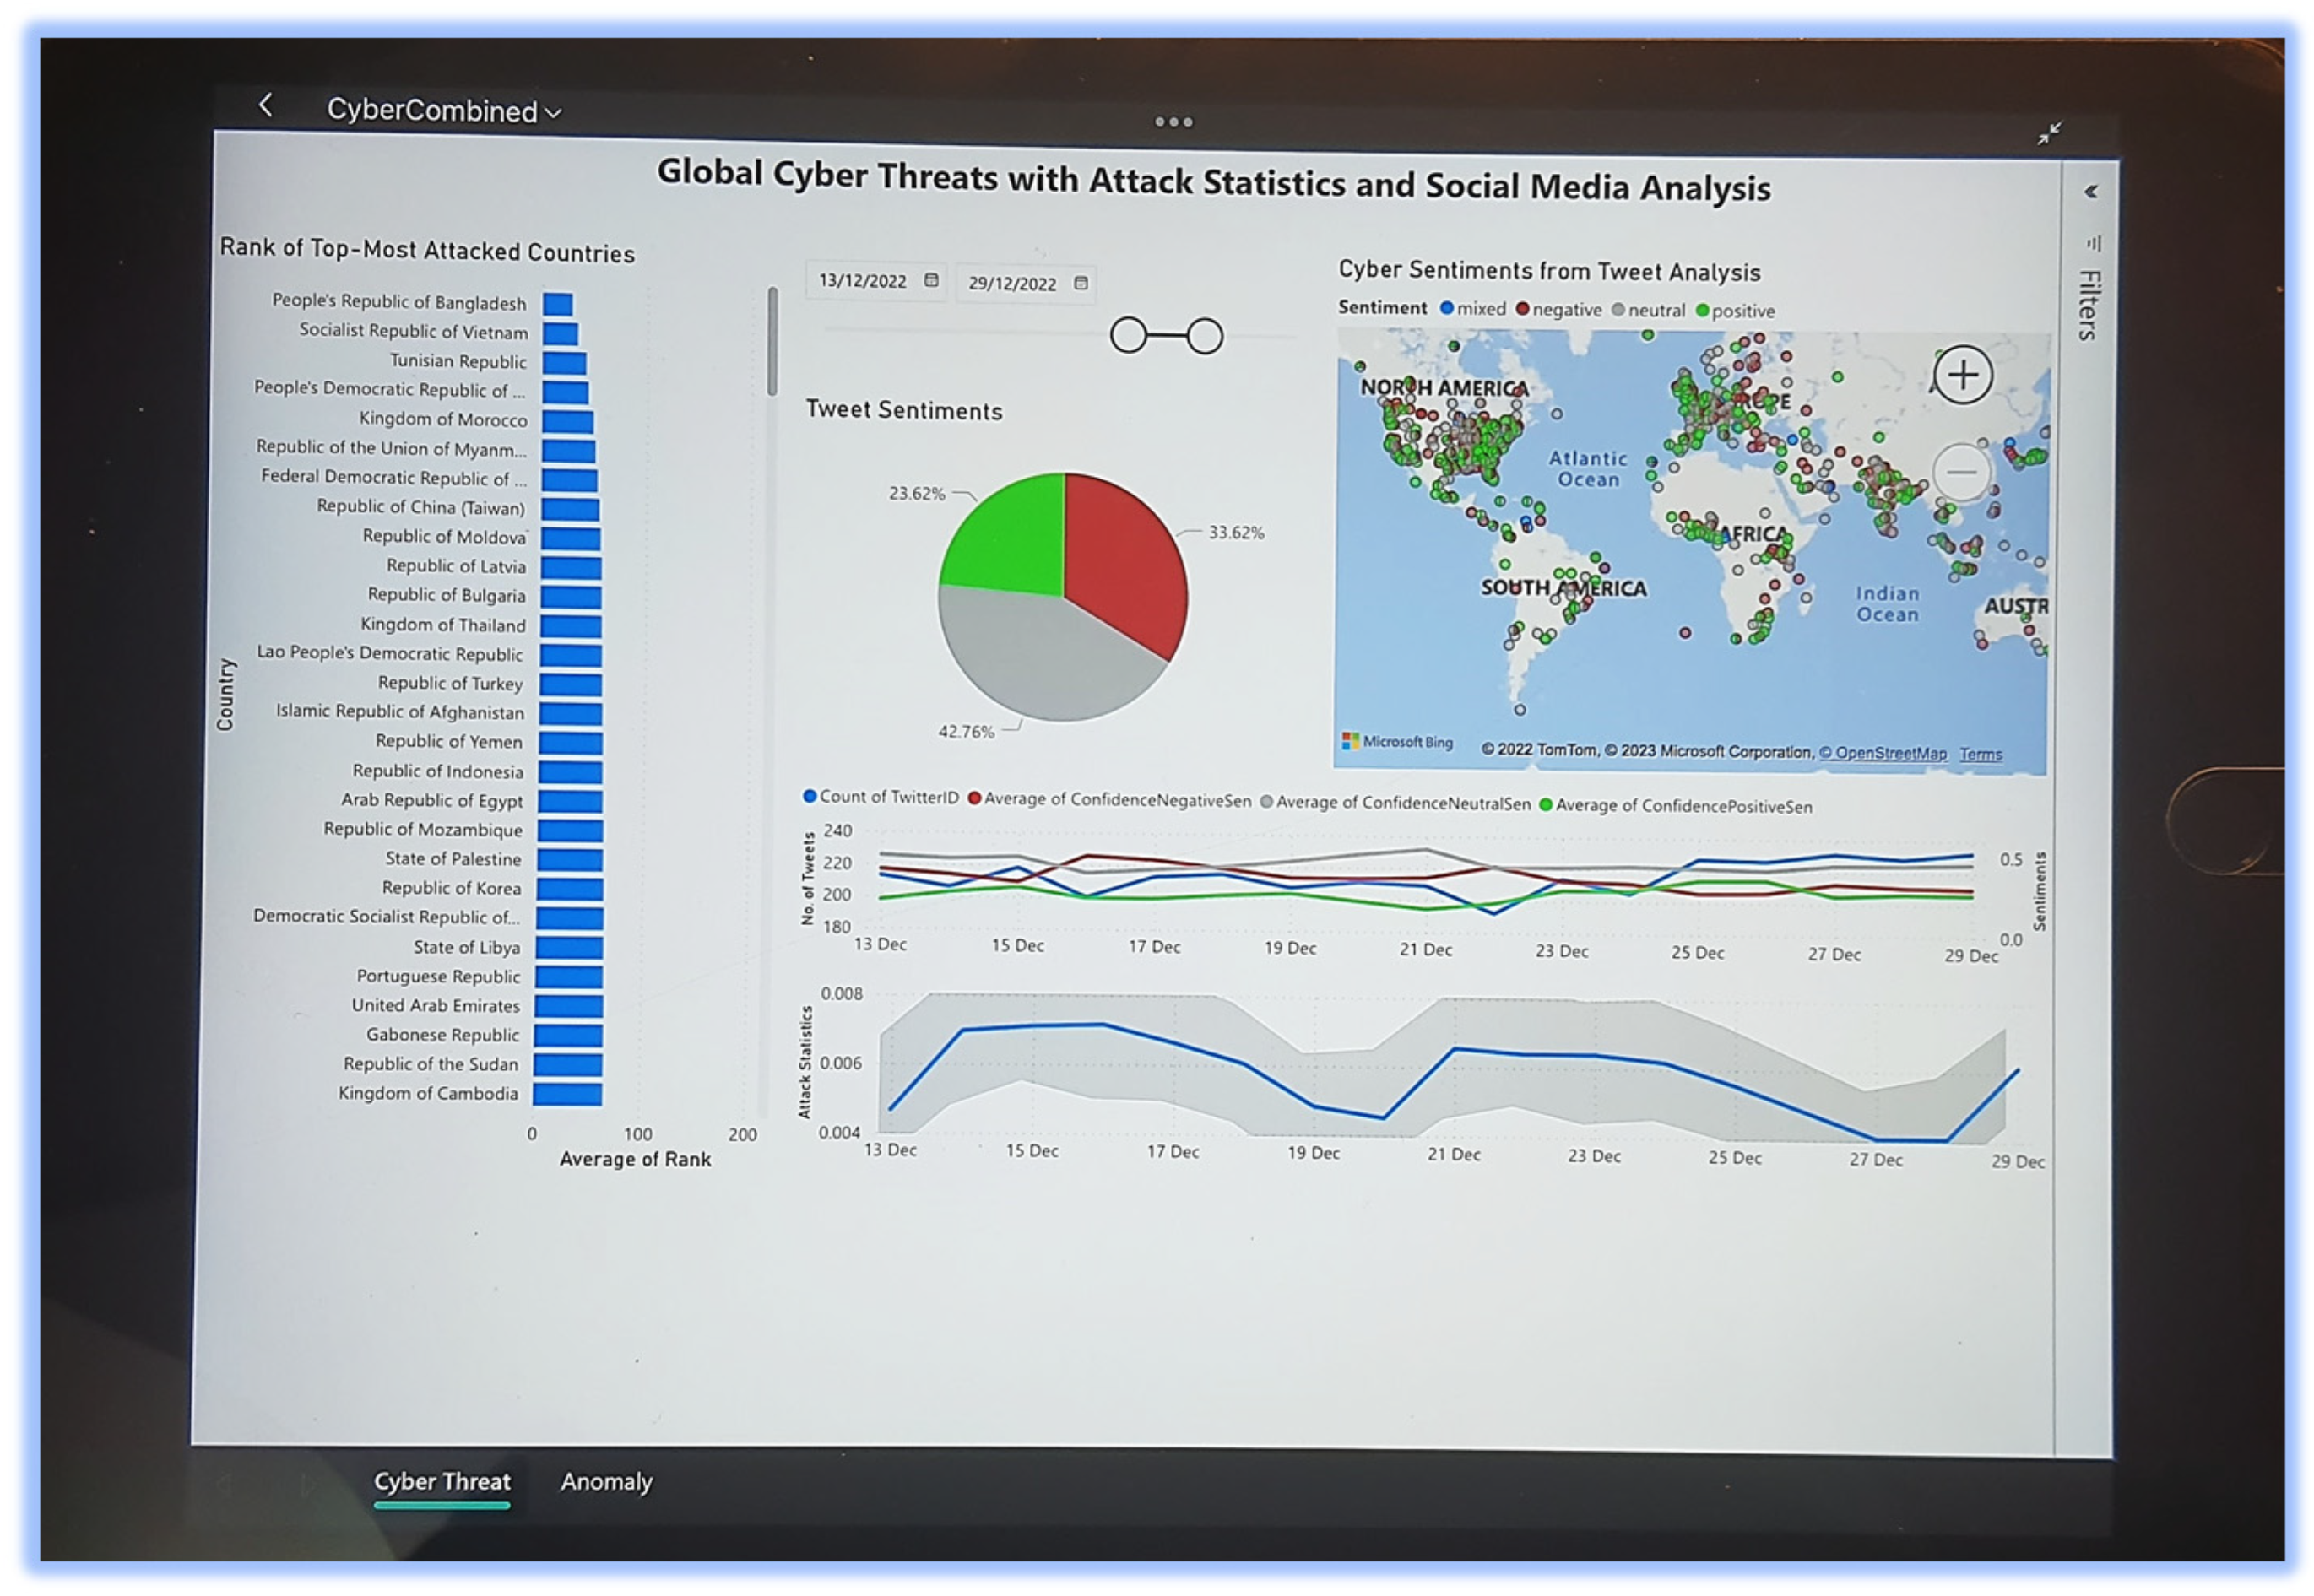
Figure 3 demonstrates deployment on the Windows desktop. The real-time visualizations were also deployed as an Android app (i.e.,
Figure 4) and an iOS app (i.e.,
Figure 5). As seen from both
Figure 4 and
Figure 5, the deployed app provides interactive decision-making capabilities, as the strategic user can select any time duration and the cyber threat concerns are directly updated in the dashboard according to the selected timeframe. While
Figure 4 shows deployment through the Power BI Mobile App in the Android environment,
Figure 5 depicts deployment within the iOS environment. Since both
Figure 4 and
Figure 5 show deployment on different mobile platforms, the contents might be difficult for viewing. Hence, a publicly accessible web link is available at
https://app.powerbi.com/view?r=eyJrIjoiYWJjOGY5YTUtZDBlNy00MTg1LWFkMTMtM2RmYzYzODQ1NzE1IiwidCI6IjBkMWI4YmRlLWZmYzEtNGY1Yy05NjAwLTJhNzUzZGFjYmEwNSJ9&pageName=ReportSection, accessed on 19 February 2023.
| Code 1: Cyber Index for Russia with SQL Statement |
| | SELECT * FROM [dbo].Tweets WHERE TweetSourceType=‘CYBER’ AND (TweetText LIKE ‘%RUSSIA%’ OR TranslatedText LIKE ‘%RUSSIA%’ ) ORDER BY Time |
| Code 2: Cyber Index for Russia with DAX Expression |
| | CyberRussia = IF(COUNTROWS(FILTER(CyberSocial, OR(CONTAINSSTRING(CyberSocial[TweetText], “Russia”), CONTAINSSTRING(CyberSocial[TranslatedText], “Russia”))))=BLANK(), 0, COUNTROWS(FILTER(CyberSocial, OR(CONTAINSSTRING(CyberSocial[TweetText], “Russia”), CONTAINSSTRING(CyberSocial[TranslatedText], “Russia”))))) |
| Code 3: Index Focusing on Cyber-Related Threats/Crisis/Issue SQL Statement |
| | SELECT * FROM [dbo].Tweets WHERE TweetSourceType=‘CYBER’ AND ((TweetText LIKE ‘%crisis%’ or TweetText LIKE ‘%threat%’ or TweetText LIKE ‘%issue%’ or TweetText LIKE ‘%problem%’ or TweetText LIKE ‘%crime%’ or TweetText LIKE ‘%attack%’ or TweetText LIKE ‘%warfare%’ or TweetText LIKE ‘%alert%’or TweetText LIKE ‘%warn%’) OR (TranslatedText LIKE ‘%crisis%’ or TranslatedText LIKE ‘%threat%’ or TranslatedText LIKE ‘%issue%’ or TranslatedText LIKE ‘%problem%’ or TranslatedText LIKE ‘%crime%’ or TranslatedText LIKE ‘%attack%’ or TranslatedText LIKE ‘%warfare%’ or TranslatedText LIKE ‘%alert%’or TweetText LIKE ‘%warn%’)) ORDER BY Time |
It should be reiterated that CNN was implemented with low-code solutions provided by the Microsoft Power Platform [
65]. This low-code application of CNN allows seamless mobile deployment of CNN (as shown in
Figure 4 and
Figure 5) without writing any device-specific codes (i.e., targeting iOS or Android). As a result, CNN has been popularly used to solve deep learning problems in the areas of landslides, tornadoes, global events, and social media analysis, as shown in [
11,
58,
59,
60,
61,
67,
68,
69,
70].
4. Conclusions
This paper proposed a methodological approach of applying AI-based algorithms with CNN-based anomaly detection to perform the following:
Autonomously identify, analyze, and report a new cyber threat index for any countries;
Autonomously identify, analyze, and report global cyber threat anomalies;
The presented methodology was validated with live Twitter feeds for 75 consecutive days starting from 14 October 2022 to 27 December 2022;
AI-based language detection, translation, and sentiment analysis on 15,983 tweets in 47 different languages (unlike [
14,
15,
16], which only worked in a single language);
75 days of daily cyber threat indexes generated for China, Australia, Russia, Ukraine, Iran, and India;
CNN-based anomaly detection automatically detecting 2, 4, 3, 2, 3, and 1 anomaly for China, Australia, Russia, Ukraine, Iran, and India, respectively;
CNN-based anomaly detection validated under hyper parameterization of sensitivity percentages at 70%, 80%, 90%, and 100%;
Interactive cyber threat analysis solution deployed on desktop, mobile, and tablet environments with Windows, iOS, and Android apps (unlike [
14,
15,
16], which only worked on desktops and laptops).
The concept of a countrywide cyber threat index is innovative and would allow instant understanding of the overall level of cyber threat being experienced by a country on any given timeframe (i.e., day, month, year, etc.). The methodology presented within this study would allow strategic decision makers to adjust national-level cyber posture with informed and evidence-based decisions.
However, since the methodology described within this study explicitly relies on social media data for creating the index (and normalizing the indexes with Equation (1)), any threats to social media platforms or infrastructure would be a threat to the presented system. For example, if the Twitter platform is under cyber-attack, this presented system would fail. In another example, if a group of people or organization conducts an information operation by generating a huge number of fake posts (i.e., related to cyber), then that would also be a threat to the presented system.
In the future, we would endeavor to create more cyber-related indexes focusing on cyber offence, cyber defence, and other cyber dimensions. Moreover, we would apply a wide variety of DL methods, such as the recurrent neural network (RNN), generative adversarial network (GAN), radial basis function network (RBFN), and others, on multiple dimensions of cyber indexes.


