Article

A Novel Fiducial Point Extraction Algorithm to Detect C and D Points from the Acceleration Photoplethysmogram (CnD)

School of Innovation, Design and Engineering, Mälardalen University, P.O. Box 883, 721 23 Västerås, Sweden
*
Author to whom correspondence should be addressed.
Electronics 2023, 12(5), 1174; https://doi.org/10.3390/electronics12051174
Submission received: 27 January 2023 / Revised: 24 February 2023 / Accepted: 27 February 2023 / Published: 28 February 2023

Abstract

:
The extraction of relevant features from the photoplethysmography signal for estimating certain physiological parameters is a challenging task. Various feature extraction methods have been proposed in the literature. In this study, we present a novel fiducial point extraction algorithm to detect c and d points from the acceleration photoplethysmogram (APG), namely “CnD”. The algorithm allows for the application of various pre-processing techniques, such as filtering, smoothing, and removing baseline drift; the possibility of calculating first, second, and third photoplethysmography derivatives; and the implementation of algorithms for detecting and highlighting APG fiducial points. An evaluation of the CnD indicated a high level of accuracy in the algorithm’s ability to identify fiducial points. Out of 438 APG fiducial c and d points, the algorithm accurately identified 434 points, resulting in an accuracy rate of 99%. This level of accuracy was consistent across all the test cases, with low error rates. These findings indicate that the algorithm has a high potential for use in practical applications as a reliable method for detecting fiducial points. Thereby, it provides a valuable new resource for researchers and healthcare professionals working in the analysis of photoplethysmography signals.

1. Introduction

Photoplethysmography (PPG) is a non-invasive technique for measuring vital signs, whose principle of work is detecting changes in blood volume in the microvasculature of the skin through the absorption of light [1]. PPG has been explored in a number of studies as a tool for monitoring heart rate, blood pressure, and respiratory rate [2,3,4,5], as well as for the identification of individuals with disease risk [6,7,8,9]. However, extracting relevant features from the PPG signal is a challenging task, and various feature extraction methods have been proposed in the literature [10,11,12].
The PPG waveform has been widely studied for decades and is now commonly used in various wearable devices [13]. However, despite the wide range of applications, there is a lack of agreement on an appropriate pre-processing framework that can be used without limitations for applications [14]. Researchers have employed a wide range of techniques for sensor interfacing, data recording, segmentation, filtration, and smoothing, from the choice of location for PPG signal acquisition to the features that can be extracted from the signal [15].
PPG signal processing has been investigated in both the time and frequency domain, and the use of PPG derivatives has also been reported upon in the literature [16,17,18]. The first PPG derivative represents the velocity photoplethysmography (VPG), while the second derivative is known as the acceleration photoplethysmography (APG). Elgendi et al. [10] have attempted to standardize the PPG fiducial points by utilizing VPG and APG signals in order to enhance the extraction of diagnostic features. However, as reported by Suboh et al. [19], the use of the third and fourth derivatives of the PPG waveform has also been studied and applied in extracting fiducial points for individuals with ischemic heart disease. Despite the identification of fiducial points [10,11,12,13,20], there is a lack of consistency in the terminology used to refer to these waveform types and their corresponding fiducial points. Therefore, this article follows the fiducial point name-convention identified by Elgendi et al. [10] as shown in Figure 1.
APG signal analysis is a subject of importance for clinicians and researchers [18,21,22,23]. The c and d fiducial points of the APG are known to be sensitive indicators of arterial stiffness [24], with the c point corresponding to the onset of the reflected wave and the d point representing the end of the reflected wave [16,18]. The amplitude and the timing of the c and d points have been found to provide important information about the aging process and in assessing cardiovascular disease [16,18,22,24,25,26]. Currently, there is no widely accepted standard for the automatic detection of the c and d points in APG signals, which can make it difficult to compare results across different studies.
In this work, a novel CnD algorithm has been introduced for the automatic detection of c and points to eliminate the need for human intervention and eradicate the error in detecting the presence of APG fiducial c and d points in APG waveforms without the need of generating a block of interest as previously proposed by Li et al. [27] and Elgendi et al. [23]. The performance evaluation of the CnD algorithm has been carried out using the publicly available PPG-BP Database [28].
The rest of the article is organized as follows: The database selection is presented in Section 2, the detailed explanation of the CnD algorithm can be found in Section 3, and the performance evaluation is presented in Section 4 followed by the Discussion and Conclusion.

2. Materials

Database Selection

Few available online databases offer a variety of PPG signals, i.e., PPG signals collected from both healthy and sick volunteers. The University of Queensland Vital Signs dataset [29] provides a wide range of patient monitoring data and vital signs gathered during 32 surgical instances where patients underwent anesthesia at the Royal Adelaide Hospital, Australia. Another database, the MIMIC II Database from PhysioNet [30] includes 121 segments of 10 min recordings of ECG, respiratory rate, arterial blood pressure, and PPG signals from 90 intensive care unit patients. In the MIMIC II Database, systolic peak annotations are provided, but they are only available for selected records.
In this work, we used the publicly available PPG-BP Database [28]. The database integrates the identified, comprehensive clinical data of patients admitted to the Guilin People’s Hospital, Guilin, China. The openness of the data allows researchers to explore and improve the understanding of relationships between cardiovascular health and PPG signals, with the goal of creating an effective non-invasive and wearable detection technology that is easy to use. The dataset includes data collected from 219 subjects, aged between 21–86 years, with a median age of 58 years, and the distribution of the data between male and female is 48% and 52%, respectively. The dataset covers several diseases including hypertension, diabetes, cerebral infarction, and insufficient brain blood supply. During the signal acquisition, Liang et al. [28] used a sampling frequency of 1 kHz, and three PPG segments were recorded and saved per subject. Each segment included 2100 sampling points. During the 3 min data collection phase, every PPG segment of a particular subject scored a Skewness SQI (Ssqi) value; values greater than zero [28] were saved in the PPG-BP Database, while the user was prompted to retake the PPG signal if the value was less than zero. This step was implemented to reduce the inclusion of segments with a high proportion of noise and motion artifacts [28].

3. Detection Method

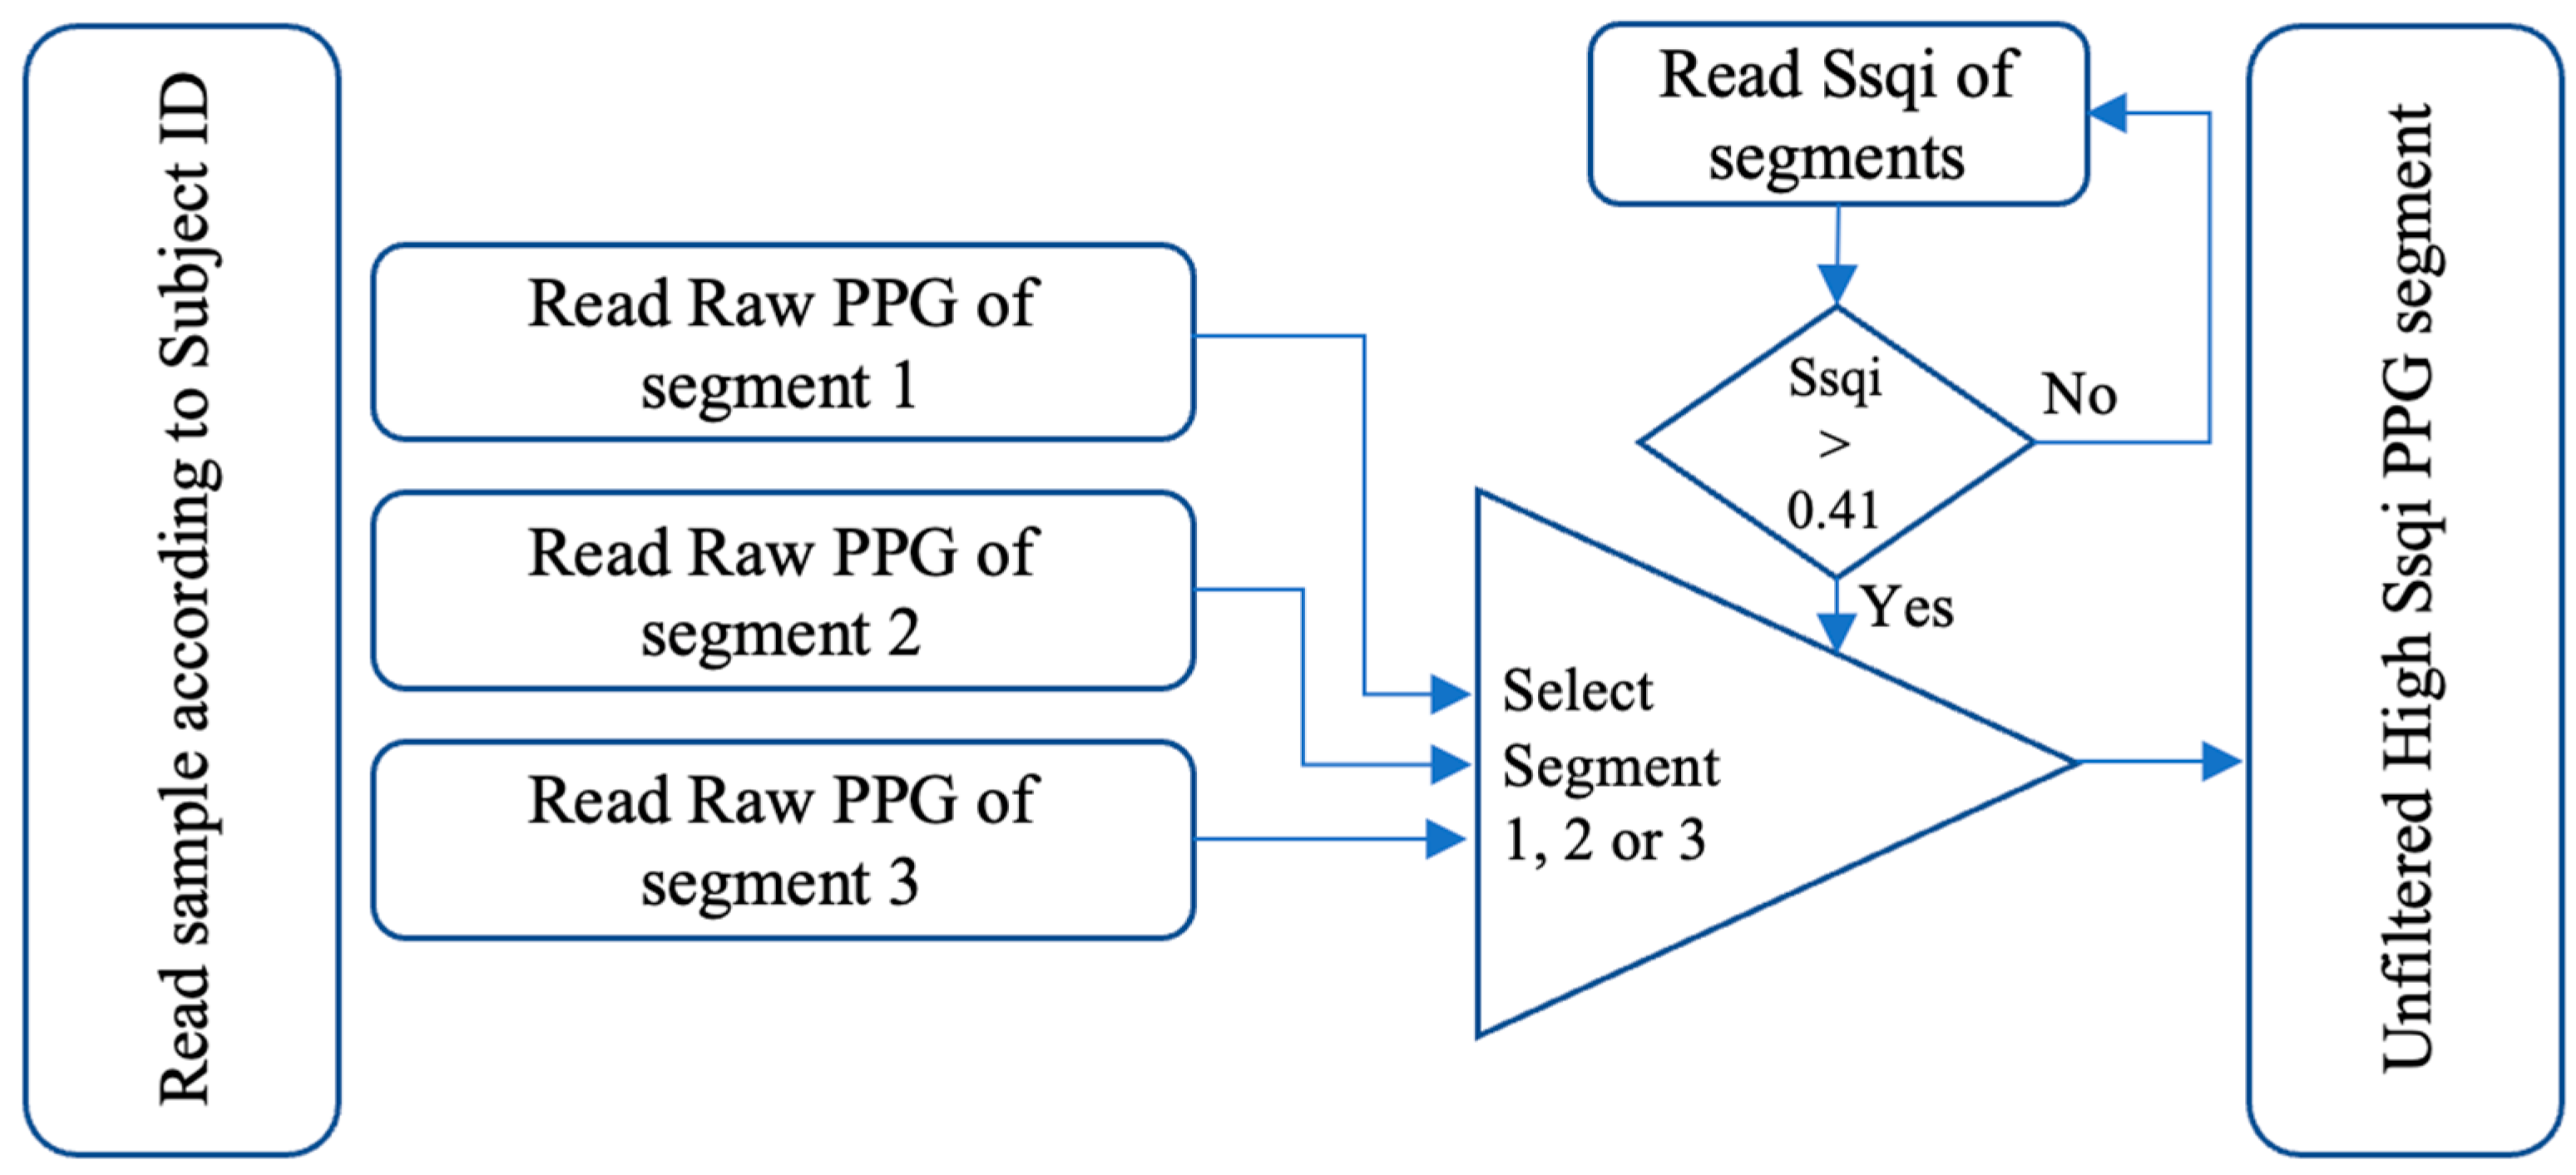
3.1. Data Preparation

Figure 2 presents the necessary elements to select the most accurate raw PPG segments with acceptable Ssqi values [28]. Out of the three PPG segments for each subject in the database, the PPG segments with a Ssqi value exceeding the threshold of 0.41 were selected and their corresponding raw values were stored in a new matrix. This process was then repeated for all subjects and two matrices were generated. The first matrix contains the raw values of the segments for each subject with Ssqi higher than 0.41, and the second matrix contains the Ssqi values and subject IDs for data recording purposes.

3.2. Pre-Processing

Previous studies in the field of PPG signal analysis have extensively discussed the selection of suitable filters and the corresponding bandpass frequency ranges necessary for the analysis of various segments of the PPG waveform [31,32,33,34,35,36]. In the study by Liang et al. [32], the authors aimed to determine the optimal filter and filter order to be used for PPG signal processing. Nine types of filters with ten different filter orders were used to filter short PPG signals. Results of this study indicate that the 4th order Chebyshev II filter with 20 dB configuration can more effectively improve the PPG signal quality compared to other types of filters. The proposed CnD algorithm incorporates the same filter design for the purpose of APG fiducial point extraction, where a 4th order, 20 dB, Chebyshev II filter with a bandpass frequency range of 0.4–8 Hz was applied to the selected PPG data to remove high- and low-frequency noise. A moving average filter was then applied using the MATLAB function movmean to further reduce random noise and improve the quality of the signal. The governing mathematical Equation (1) of the moving average can be written as follows:
y i = 1 / N i = 0 n x i + j
where x is the raw PPG signal; y denotes the filtered PPG signal; and N denotes the average number of points.

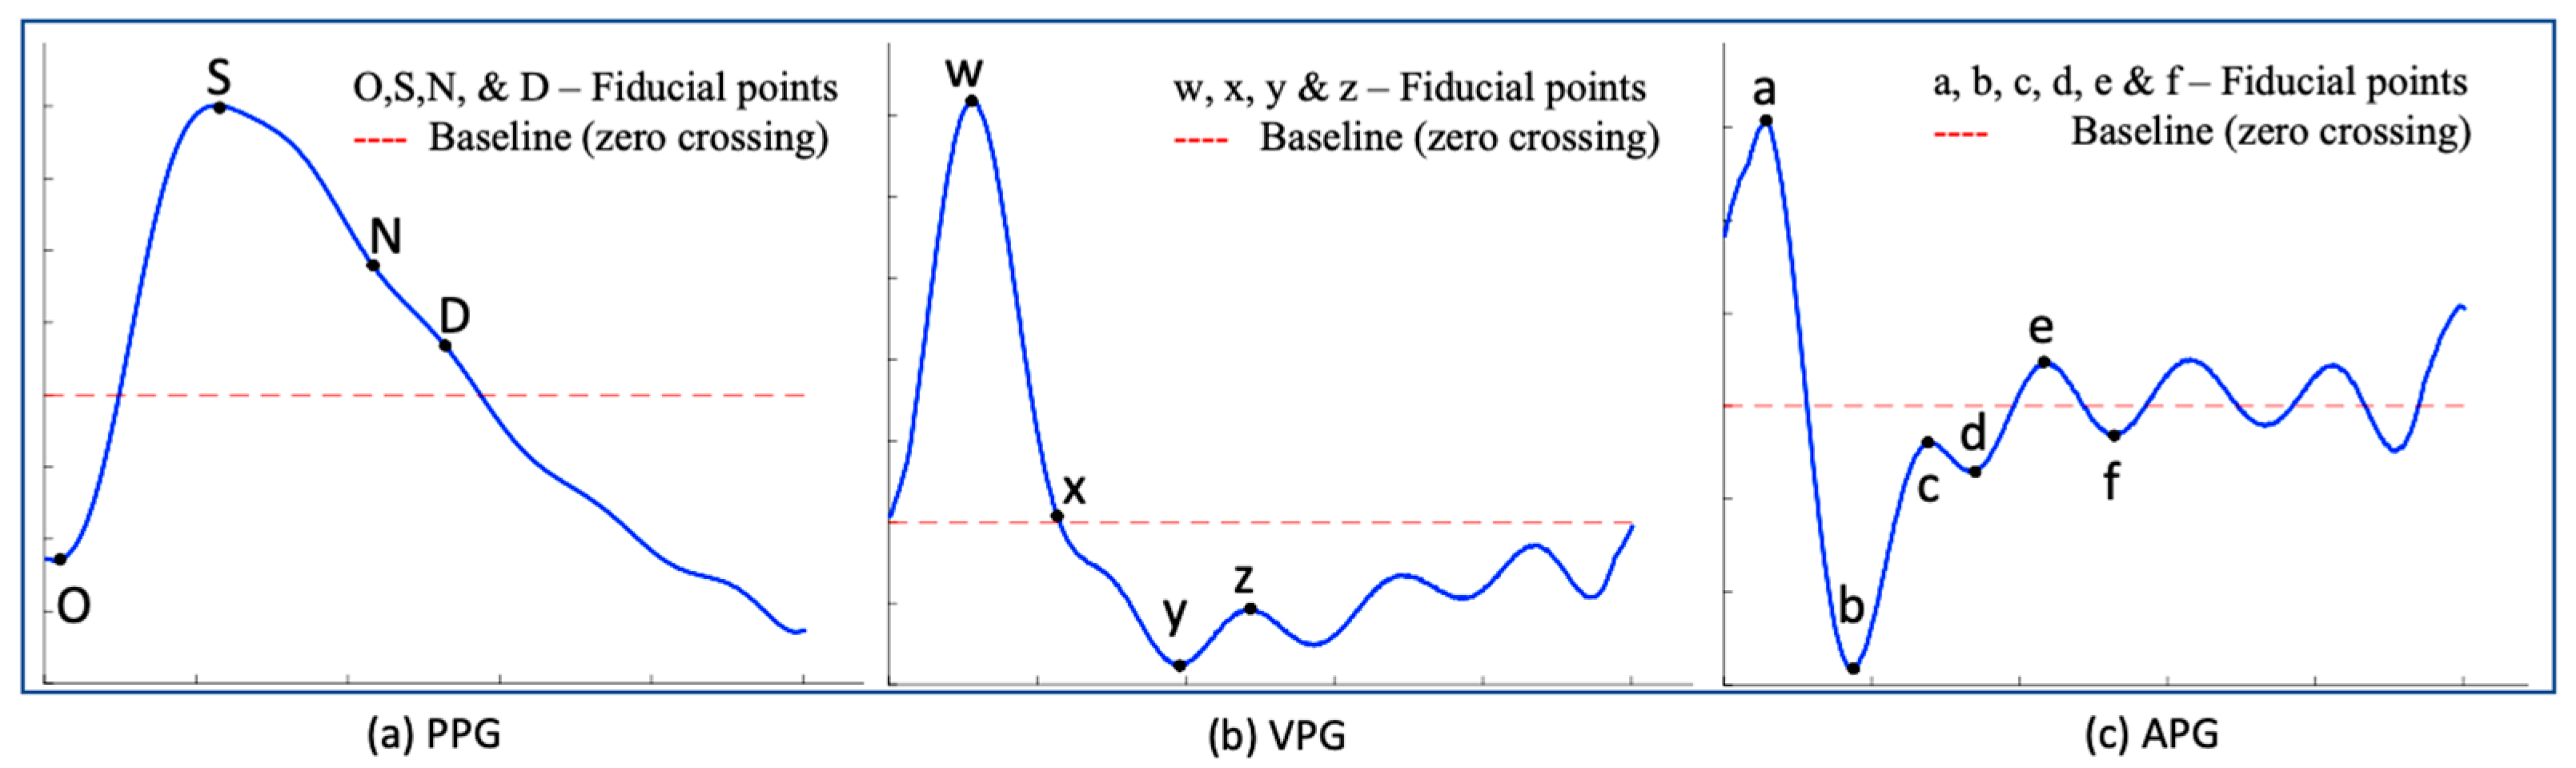
3.3. PPG Derivatives (VPG, APG, JPG)

The derivatives of PPG up to the third level are calculated using governing Equations (2)–(4), where y(t) is a filtered PPG signal, y(t − 1) and y(t + 1) represent the previous and the next sample, respectively. The VPG, APG and JPG of the denoised PPG signal are calculated using the MATLAB diff function, which follows Equations (2)–(4):
VPG = d d t PPG = d d t y t + 1 y t
APG = d d t VPG = d d t y t + 1 + y t 1 2 y t
JPG = d d t APG = d d t y t + 2 2 y t + 1 + 2 y t y t 1
Typically, the first derivative of a signal is thought to be comparable to a high pass filter. It boosts the high slope areas of the signal and improves the detection accuracy of various characteristics points in addition to eliminating any low-frequency components of the signal.

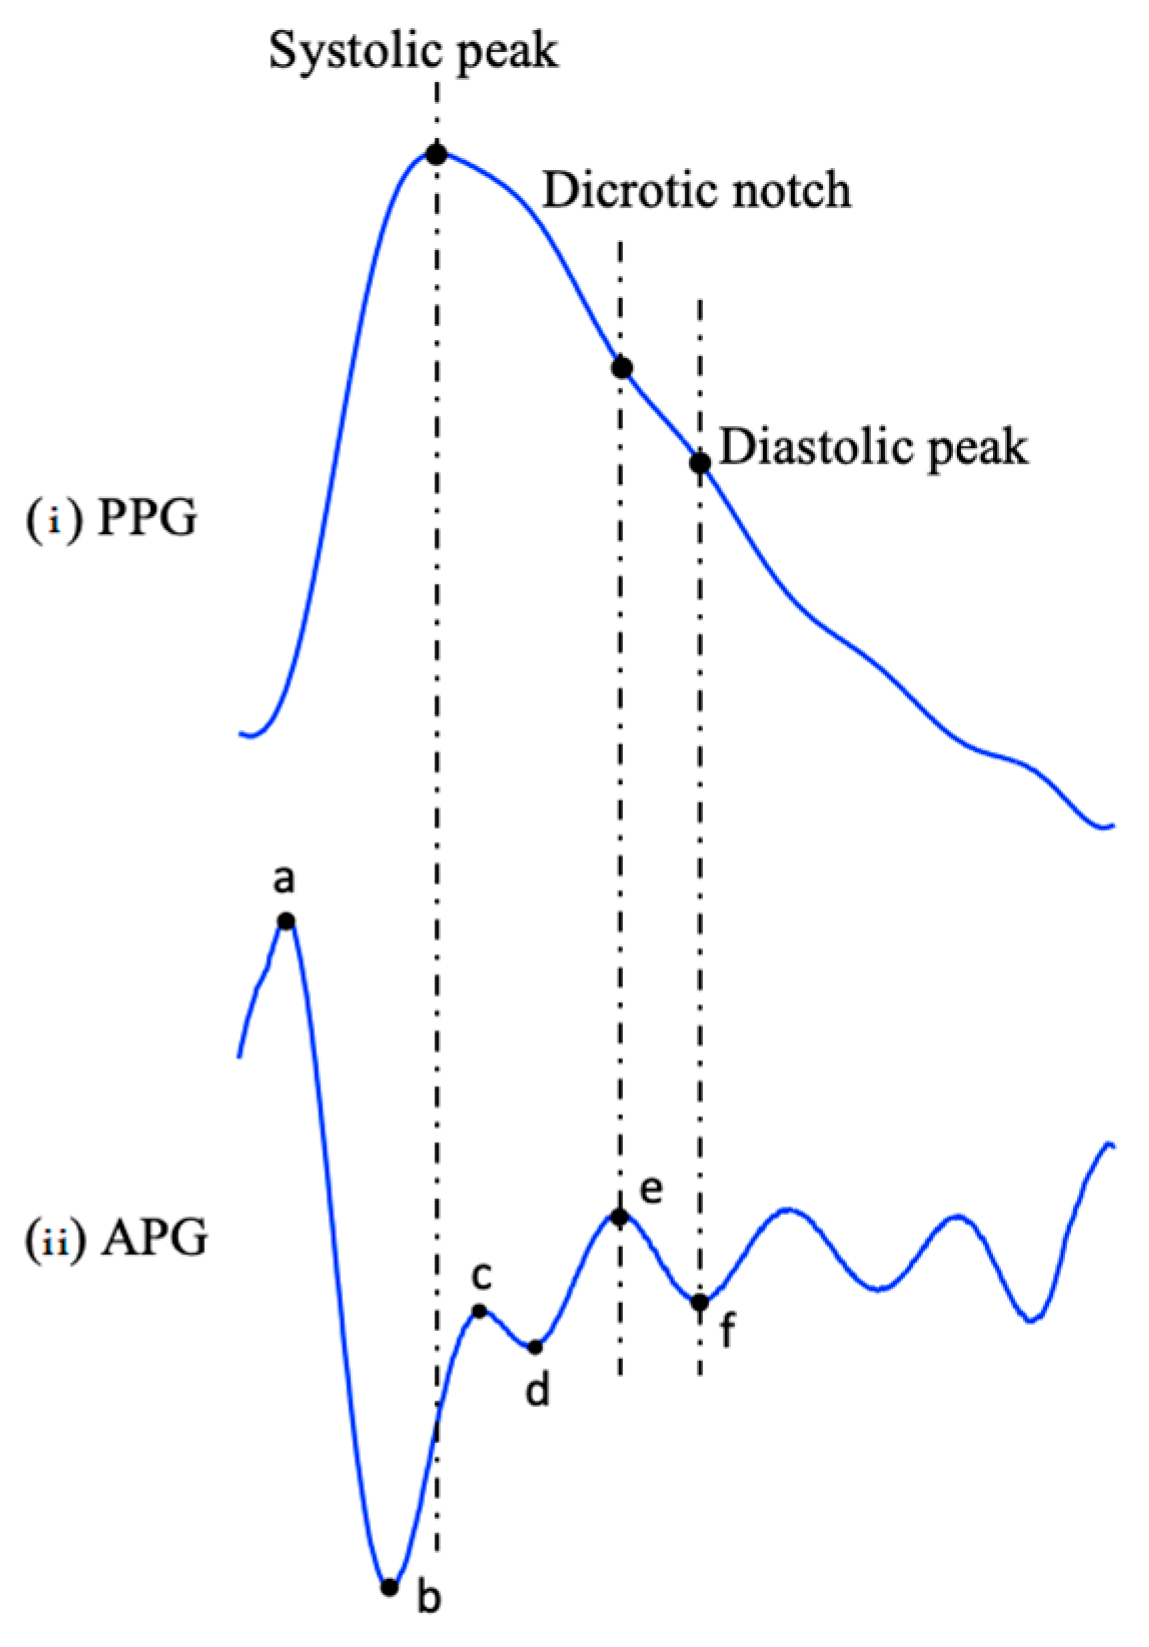
3.4. Fiducial Points

The waveforms shown in Figure 3 provide additional information related to the PPG waveform in Figure 3a, by including four prominent points in the systolic phase (a–d) and two in the diastolic phase (e and f) as shown in Figure 3b. These points correspond to the points of maximum acceleration in the waveform during the systolic and diastolic phases, respectively, they also provide additional information about the dynamics of blood flow during these phases of the cardiac cycle [37].

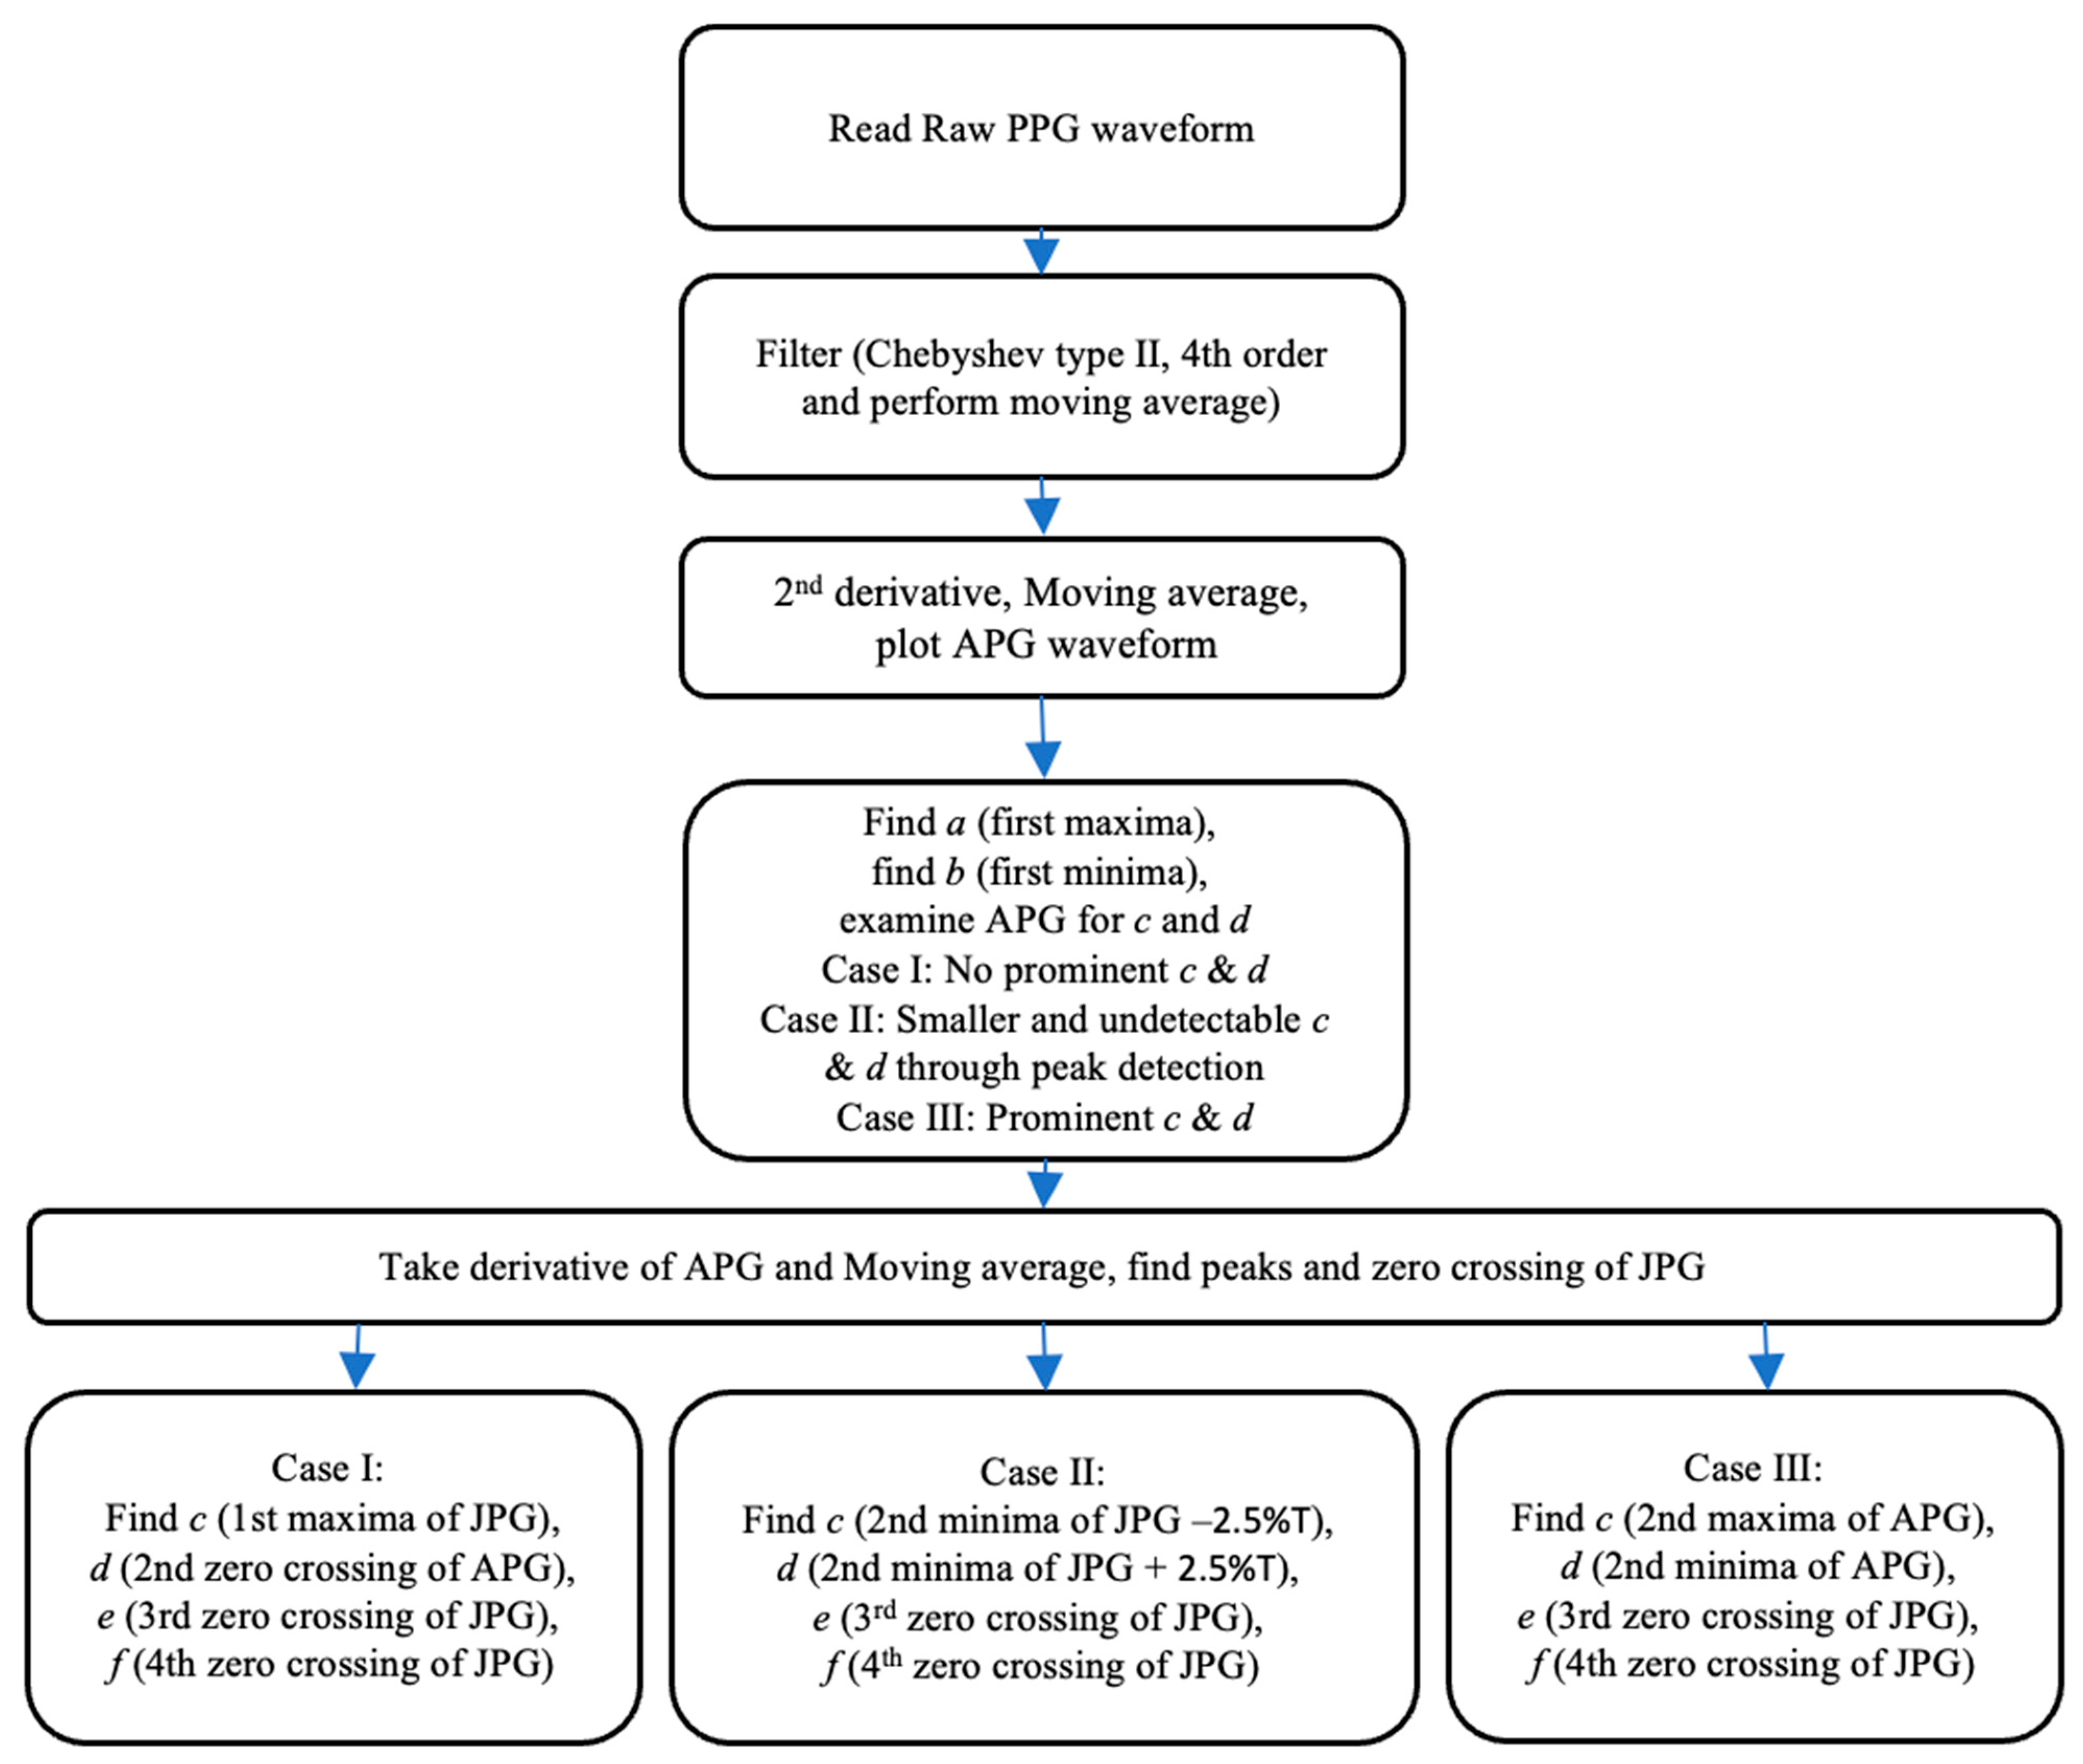
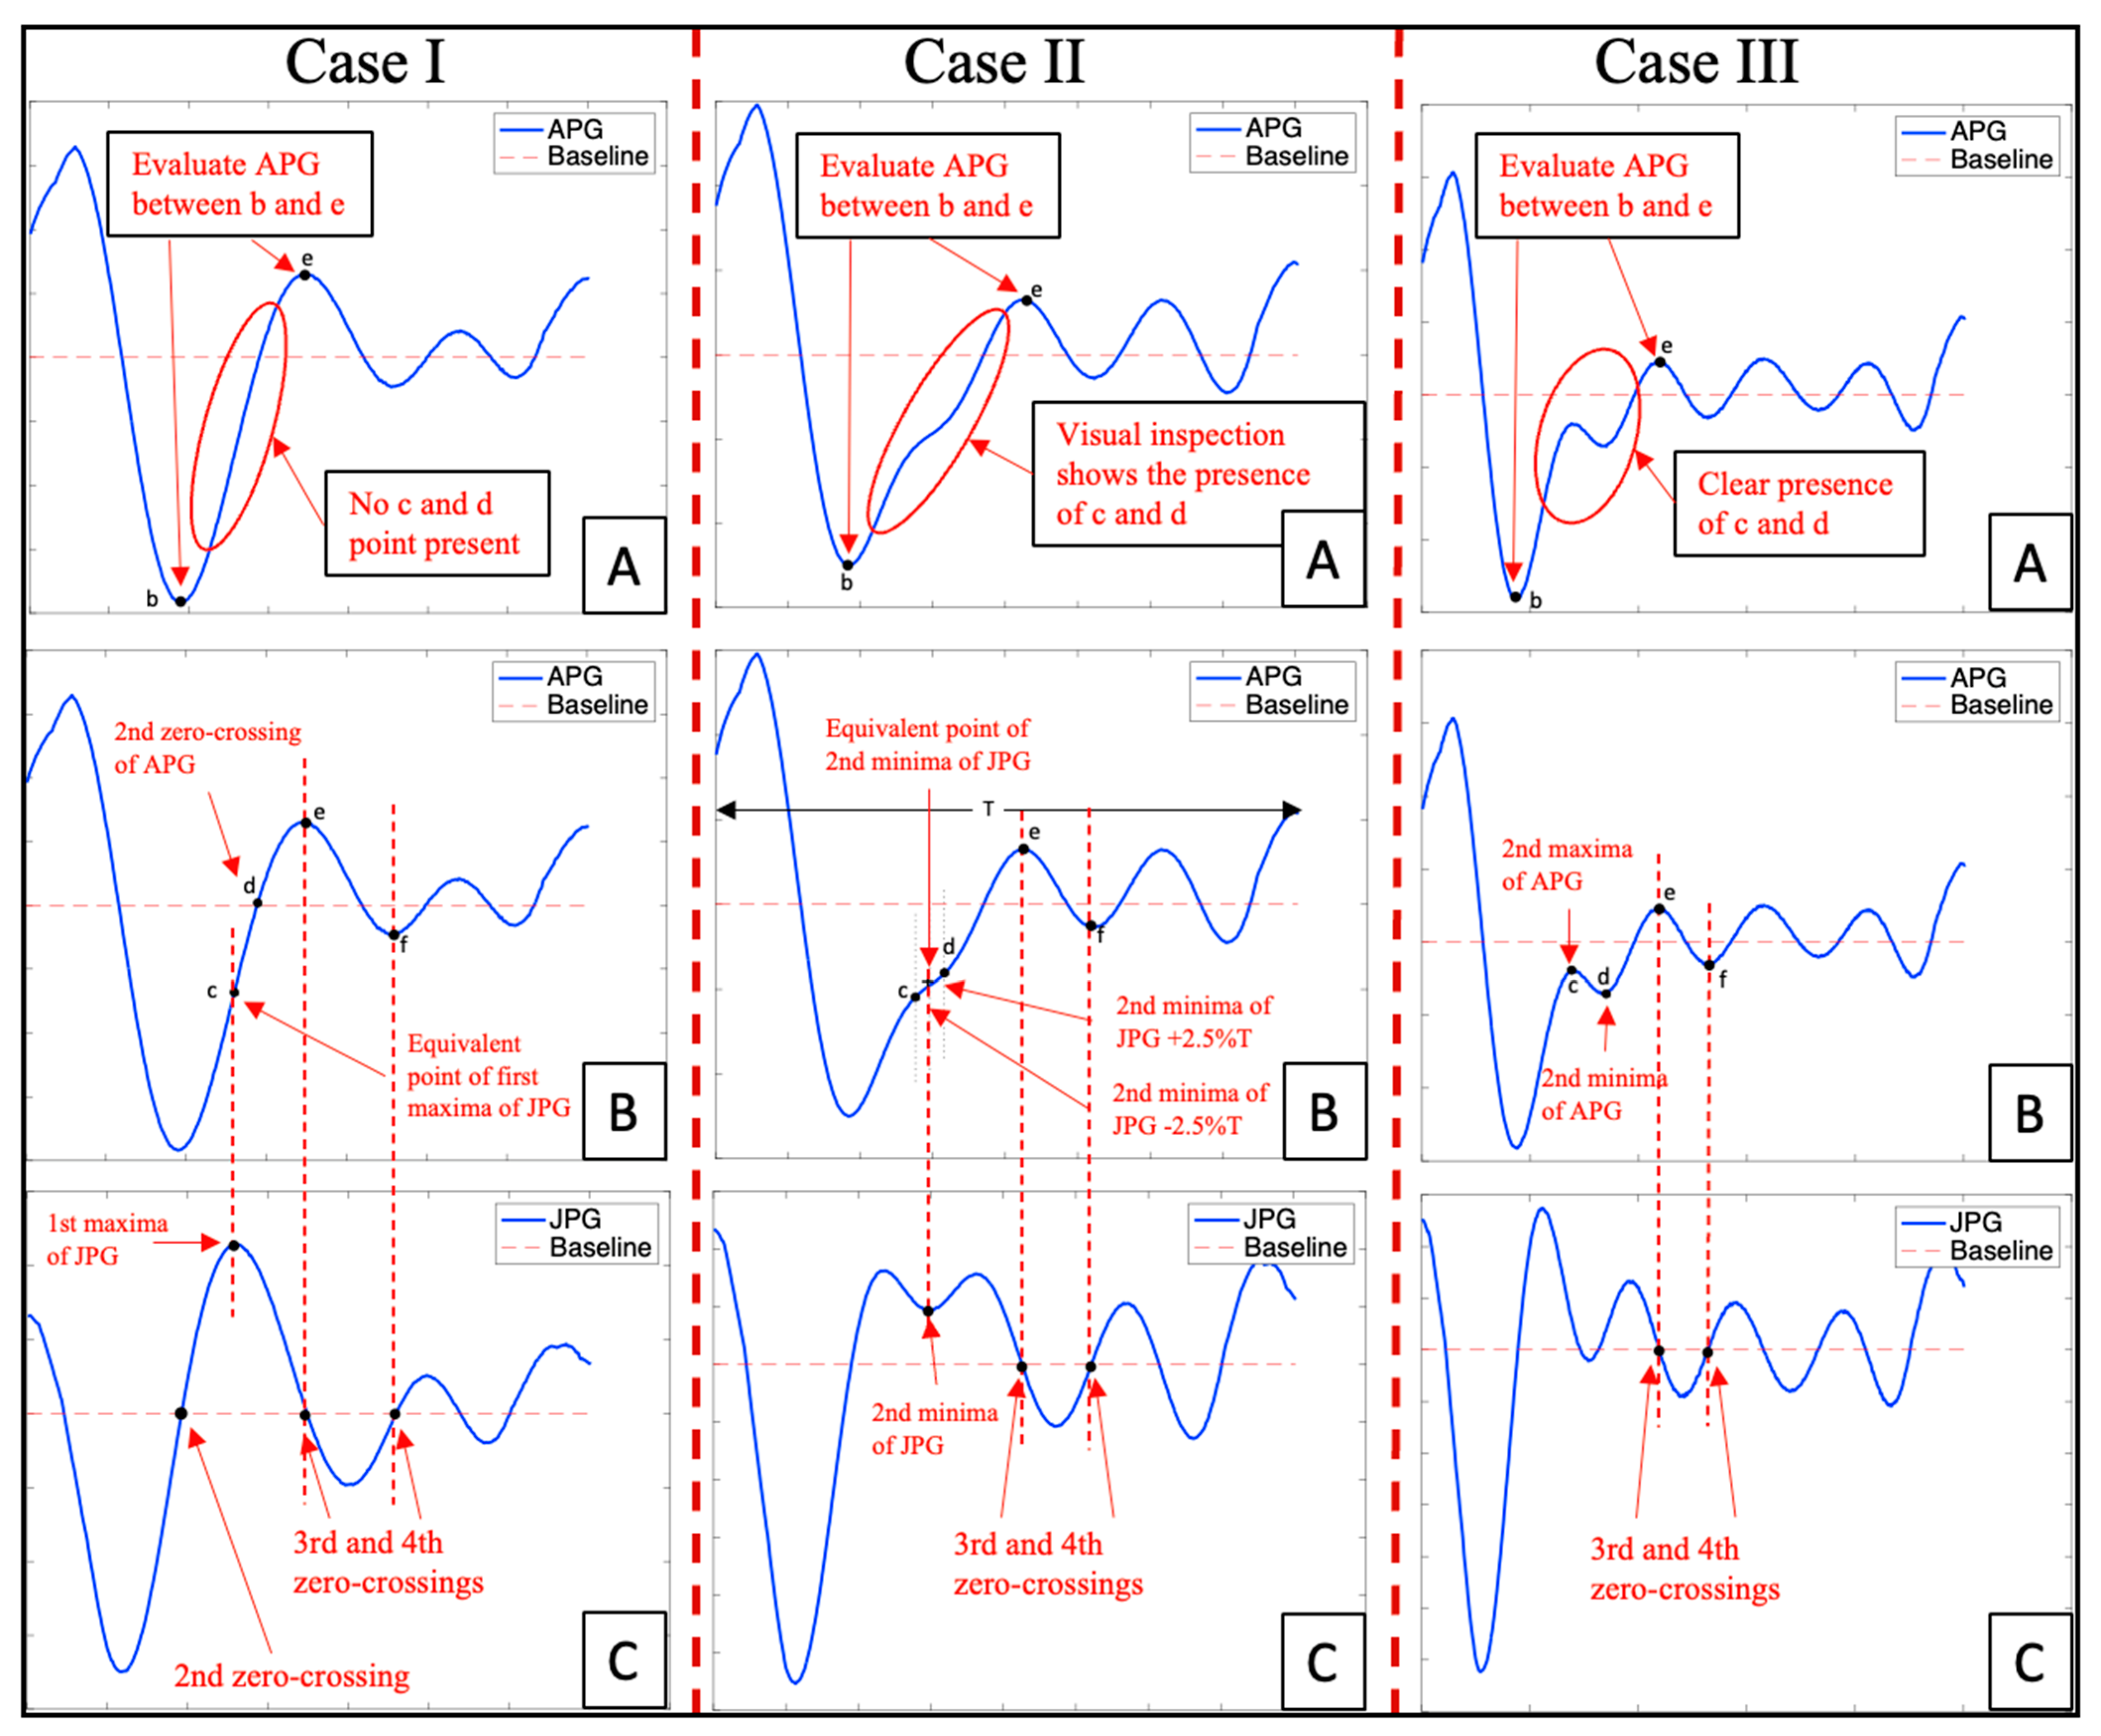
3.5. Novel Fiducial Point Extraction Algorithm to Detect C and D Points from the Acceleration Photoplethysmogram (CnD)

The flowchart in Figure 4 presents the working of the CnD algorithm for identifying c and d points in different types of APG waveforms. A raw PPG signal with a high Ssqi is provided as an input to the CnD algorithm, which is followed by pre-processing of the signal to obtain a filtered PPG signal, as explained in Section 3.2. The second derivative of the filtered PPG signal is then calculated followed by the moving average using the MATLAB functions diff and movmean functions, to obtain the APG waveform.
Identifying points c and d in the APG waveform can be challenging due to variability in their characteristics caused by stationary and non-stationary effects in blood circulation. To address this challenge, the CnD algorithm examines the region between the systolic peak (b point) and diastolic peak (e point) of the APG waveform as shown in Figure 5A. Based on this examination, the waveform is classified into one of three cases: Case I, Case II, and Case III as shown in Figure 5.
Case I: When there are no prominent c and d points in the APG as shown in Figure 5 (Case IA): The examination of the APG waveform provided information that there was no distinguishable point found between point b and e of the APG waveform, therefore, the CnD algorithm will examine the JPG waveform [19] and locate the zero-crossing points as well as the first maximum point of JPG waveform which occur after the second zero-crossing point in JPG as shown in Figure 5 (Case IC). The first maxima point in the JPG waveform corresponded to the APG waveform’s c point, while the d point was the APG waveform’s second zero-crossing point (Figure 5 (Case IB,C)). Similarly, the e point in the APG waveform corresponded to the third zero-crossing point of the JPG waveform or the second maxima of APG waveform, and the f point corresponded to the fourth zero-crossing point of JPG waveform or the second minima of the APG waveform (Figure 5 (Case IB,C).
Case II: When the c and d points are undetectable in the APG waveform as shown in Figure 5 (Case IIA): This is a crucial condition for the CnD algorithm because a visual inspection of the APG waveform can provide evidence of the presence of c and d points, but they are not prominent enough to be detected directly by the analysis of the APG waveform. Therefore, the JPG waveform was studied and from experimental analysis, it was found that the second minima of the JPG waveform was the central point of the c and d points as shown in Figure 5 (Case IIC). Therefore, the CnD algorithm takes the second minima of the JPG waveform and calculates the corresponding c and d point in the APG waveform. The location of the c point is the second minima of the JPG waveform minus 2.5% of the total wavelength of the APG waveform (T), and the location of the d point was the second minima of the JPG waveform plus 2.5% of T as shown in Figure 5 (CaseIIB,C). The e point in the APG waveform corresponds to the third zero-crossing point of the JPG waveform or the second maxima of the APG waveform, and the f point corresponded to the fourth zero-crossing point of the JPG waveform or the second minima of the APG waveform (Figure 5 (Case IIB,C)).
Case III: When the c and d points are prominent in the APG waveform as shown in Figure 5 (Case IIIA): The analysis of the APG waveform provides sufficient information to the CnD algorithm to accurately locate c and d points in the APG waveform, therefore the c point is the second maxima of the APG waveform, whereas the d point was the second minima of the APG waveform (Figure 5 (Case IIIB). The e point in the APG waveform corresponded to the third zero-crossing point of the JPG waveform or the second maxima of the APG waveform, and the f point corresponded to the fourth zero-crossing point of the JPG waveform or the second minima of the APG waveform (Figure 5 Case IIIB,C).

4. Performance Evaluation of the CnD Algorithm

To evaluate the identification of the APG waveform and the detection of c and d points, four performance parameters were calculated, which follow Equations (5)–(8) and include accuracy (Acc), error rate (Err), sensitivity (S), and positive predictivity (PP). Table 1 summarizes the complete results of the performance evaluation.
A c c = T P T P + F P + F N × 100
E r r = F P + F N N × 100
S = T P T P + F N × 100
P P = T P T P + F P × 100
where
TP = True positive (Correctly detected points).
FP = False positive (Incorrectly detected points).
FN = False negative (Missing points).
N = Number of subjects.
Table 1. Performance evaluation of the CnD algorithm for 219 samples.
AlgorithmNTPFPFNSN%PPV%Err%Acc%
Case I1401390199.291000.7199.29
Case II54531010098.151.8598.15
Case III2525001001000100
In order to evaluate the performance of the CnD algorithm, it is essential to have a wide range of data that encompass a variety of conditions. This is typically achieved by using a large number of PPG signals that represent different pathological conditions to test the CnD algorithm’s capability to handle diverse conditions.
A total of 219 PPG waveforms were processed through the CnD algorithm. The process was divided into two stages: in the first stage, the manual marking of fiducial points was performed using the MATLAB functions islocalmax and islocalmin, where each point was selected manually, and its corresponding value was recorded.
In the second stage, the same set of raw PPG segments were examined using the CnD algorithm that automatically extracts the fiducial points of PPG and its derivatives. Simultaneously, a manual assessment was performed to evaluate the CnD algorithm’s accuracy. The proposed CnD algorithm was tested on a dataset that contained a total of 438 c and d fiducial points; of which the CnD algorithm accurately identified 434 of these points, resulting in an accuracy of 99.09%. This indicates that the CnD algorithm can effectively and accurately extract fiducial points, which is crucial for the feature extraction process in PPG signal analysis. The high precision of the CnD algorithm demonstrates its potential as a reliable tool for PPG signal analysis in various medical applications.
Table 1 summarizes the detailed evaluation of the CnD algorithm for 219 samples where:
Case I: A total of 140 samples were classified as Case I, which includes 280 c and d points. Out of 140 samples, 139 samples were accurately classified as Case I (TP) and one sample was not detected by Case I (FN). This results in a sensitivity of 99.29%, a positive predictivity of 100%, an error rate of 0.71%, and an accuracy of 99.29% for Case I. This means that out of the 280 c and d points, 278 were accurately detected and 2 points were missed by the CnD algorithm.
Case II: A total of 54 samples were classified as Case II, which includes 108 c and d points. Out of 54 samples, 53 samples were correctly classified as Case II (TP) and 1 was incorrectly classified as positive (FP). This results in a sensitivity of 100%, a positive predictivity of 98.15%, an error rate of 1.85%, and an accuracy of 98.15%. This means that out of the 108 c and d points, 106 were accurately detected and 2 points were incorrectly identified by the CnD algorithm.
Case III: A total of 25 samples were classified as Case III, which includes 50 c and d points. All of these were correctly classified as Case III (TP), and none was misclassified. This results in a sensitivity of 100%, a positive predictivity of 100%, an error rate of 0%, and an accuracy of 100%. This means that out of the 50 c and d points, all of the points were accurately detected by the CnD algorithm.

5. Discussion and Conclusions

Statistical analyses of APG fiducial points provide clinicians and researchers with important information related to arterial stiffness, aging, and essential hypertension. Several research efforts have been reported on this matter; however, so far there is no widely accepted standard method for automatically detecting the c and d points in APG signals. The detection is not trivial since the c and d points are not always visually observable in the APG.
This article has presented a novel fiducial point extraction algorithm to detect c and d points from the acceleration photoplethysmogram (CnD). The algorithm is a valuable and new resource for researchers and healthcare professionals working on the analysis of PPG signals. The CnD algorithm significantly reduces the risk of errors in identifying fiducial points, and an experimental evaluation has shown that the CnD algorithm provides accurate results at a high degree of consistency. The algorithm has a high potential to become a powerful tool in the field of non-invasive vital sign monitoring and in the identification of individuals at risk for cardiovascular diseases [7].
To evaluate an algorithm’s performance as a feature extraction algorithm, a sufficiently large and diverse dataset is required. The CnD algorithm was evaluated using the PPG-BP Database [28]. This dataset, which contains data from 219 subjects of equal gender distribution of a varying age, covers subjects with several diseases including hypertension, diabetes, cerebral infarction, and insufficient brain blood supply. The dataset, hence, includes PPG samples in which: (Case I) there are no prominent c and d points in the APG, (Case II) the c and d points are undetectable in the APG, and (Case III) the c and d points are prominent in the APG.
Overall, the evaluation shows that the CnD algorithm performs well in all three cases, with the highest performance seen for Case III where all samples were correctly classified as Case III with a 100% accuracy, sensitivity, and positive predictivity. For Case I, the algorithm performed well with an accuracy of 99.29% for detecting c and d points with a very low error rate. For Case II, the algorithm showed an accuracy of 98.15% for detecting c and d points with an error rate of 1.85%. Overall, this suggests that the CnD algorithm is robust and can effectively detect fiducial points in various cases.
The CnD algorithm handles PPG samples for which c and d points are indistinct or undetectable in the APG by extracting additional information through the JPG. This information is essential for accurately determining the position of the c and d points in the APG. In this work, an overall accuracy of 99.09% was obtained for the extraction of c and d points. This distinguishes the CnD algorithm from prior work that either has primarily focused on using the first and second derivative [10], or first–fourth derivate of the PPG [19] to extract the fiducial points either by generating a block of interest [23,27], or by using only a peak detection method [19] on a very limited dataset of subjects with no physiological variations.
While the proposed CnD algorithm is a promising method for the automatic detection of the c and d points, it is crucial to remember that machine learning-based techniques have already been used to analyze the PPG waveform. Commonly used methods for classifying the PPG include neural networks, support vector machines, and random forests [38,39]. The proposed CnD algorithm has the benefit of being a rule-based approach as compared to machine learning approaches which require training on substantial datasets. The CnD algorithm is capable of analyzing new datasets without significant pre-processing or training, thus making it highly efficient.
In order to support researchers and healthcare professionals, a MATLAB Toolbox is currently being developed. The toolbox will incorporate the algorithm presented in this article and thereby provide an important further step in the automatic detection of c and d points in APG signals.

Author Contributions

S.A. and A.K. designed the study; S.A. developed the algorithm, performed the validation and performance analysis, and drafted the manuscript; A.H., M.L., M.F. and A.K. provided directions, feedback, and/or revised the manuscript. All authors have read and agreed to the published version of the manuscript.

Funding

The research was funded by Mälardalen University.

Data Availability Statement

An openly available dataset, the PPG-BP Database, was analyzed in this work. These data are available in Figshare at: https://doi.org/10.6084/m9.figshare.5459299, accessed on 27 January 2023.

Acknowledgments

S.A. would like to express his deepest gratitude to his wife, Samreen Saad, for her unwavering support and encouragement throughout the course of this research.

Conflicts of Interest

The authors declare no conflict of interest.

References

  1. Allen, J. Photoplethysmography and Its Application in Clinical Physiological Measurement. Physiol. Meas. 2007, 28, R1-39. [Google Scholar] [CrossRef] [Green Version]
  2. He, X.; Goubran, R.A.; Liu, X.P. Secondary Peak Detection of PPG Signal for Continuous Cuffless Arterial Blood Pressure Measurement. IEEE Trans. Instrum. Meas. 2014, 63, 1431–1439. [Google Scholar] [CrossRef]
  3. Karlen, W.; Raman, S.; Ansermino, J.M.; Dumont, G.A. Multiparameter Respiratory Rate Estimation from the Photoplethysmogram. IEEE Trans. Biomed. Eng. 2013, 60, 1946–1953. [Google Scholar] [CrossRef] [PubMed]
  4. Islam, M.T.; Zabir, I.; Ahamed, S.T.; Yasar, M.T.; Shahnaz, C.; Fattah, S.A. A Time-Frequency Domain Approach of Heart Rate Estimation from Photoplethysmographic (PPG) Signal. Biomed. Signal. Process. Control 2017, 36, 146–154. [Google Scholar] [CrossRef] [Green Version]
  5. Fukushima, H.; Kawanaka, H.; Bhuiyan, M.S.; Oguri, K. Estimating Heart Rate Using Wrist-Type Photoplethysmography and Acceleration Sensor While Running. In Proceedings of the Annual International Conference of the IEEE Engineering in Medicine and Biology Society, EMBC, San Diego, CA, USA, 28 August–1 September 2012; pp. 2901–2904. [Google Scholar] [CrossRef]
  6. Charlton, P.H.; Kyriaco, P.A.; Mant, J.; Marozas, V.; Chowienczyk, P.; Alastruey, J. Wearable Photoplethysmography for Cardiovascular Monitoring. Proc. IEEE Inst. Electr. Electron. Eng. 2022, 110, 355–381. [Google Scholar] [CrossRef]
  7. Lee, S.; Chu, Y.; Ryu, J.; Park, Y.J.; Yang, S.; Koh, S.B. Artificial Intelligence for Detection of Cardiovascular-Related Diseases from Wearable Devices: A Systematic Review and Meta-Analysis. Yonsei Med. J. 2022, 63, S93–S107. [Google Scholar] [CrossRef]
  8. Chakraborty, A.; Sadhukhan, D.; Pal, S.; Mitra, M. Automated Myocardial Infarction Identification Based on Interbeat Variability Analysis of the Photoplethysmographic Data. Biomed. Signal. Process. Control 2020, 57, 101747. [Google Scholar] [CrossRef]
  9. Mahri, N.; Gan, K.B.; Meswari, R.; Jaafar, M.H.; Mohd. Ali, M.A. Utilization of Second Derivative Photoplethysmographic Features for Myocardial Infarction Classification. J. Med. Eng. Technol. 2017, 41, 298–308. [Google Scholar] [CrossRef] [PubMed]
  10. Elgendi, M.; Liang, Y.; Ward, R. Toward Generating More Diagnostic Features from Photoplethysmogram Waveforms. Diseases 2018, 6, 20. [Google Scholar] [CrossRef] [PubMed] [Green Version]
  11. Ab Hamid, H.; Nayan, N.A. Methods of Extracting Feature from Photoplethysmogram Waveform for Non-Invasive Diagnostic Applications. Int. J. Online Biomed. Eng. 2020, 16, 39–62. [Google Scholar] [CrossRef]
  12. Chakraborty, A.; Sadhukhan, D.; Mitra, M. An Automated Algorithm to Extract Time Plane Features from the PPG Signal and Its Derivatives for Personal Health Monitoring Application. IETE J. Res. 2019, 68, 379–391. [Google Scholar] [CrossRef]
  13. Almarshad, M.A.; Islam, M.S.; Al-Ahmadi, S.; Bahammam, A.S. Diagnostic Features and Potential Applications of PPG Signal in Healthcare: A Systematic Review. Healthcare 2022, 10, 547. [Google Scholar] [CrossRef]
  14. Prieto-Avalos, G.; Cruz-Ramos, N.A.; Alor-Hernández, G.; Sánchez-Cervantes, J.L.; Rodríguez-Mazahua, L.; Guarneros-Nolasco, L.R. Wearable Devices for Physical Monitoring of Heart: A Review. Biosensors 2022, 12, 292. [Google Scholar] [CrossRef] [PubMed]
  15. Chan, G.; Cooper, R.; Hosanee, M.; Welykholowa, K.; Kyriacou, P.A.; Zheng, D.; Allen, J.; Abbott, D.; Lovell, N.H.; Fletcher, R.; et al. Multi-Site Photoplethysmography Technology for Blood Pressure Assessment: Challenges and Recommendations. J. Clin. Med. 2019, 8, 1827. [Google Scholar] [CrossRef] [PubMed] [Green Version]
  16. Gil, E.; Orini, M.; Bailón, R.; Vergara, J.M.; Mainardi, L.; Laguna, P. Photoplethysmography Pulse Rate Variability as a Surrogate Measurement of Heart Rate Variability during Non-Stationary Conditions. Physiol. Meas. 2010, 31, 1271–1290. [Google Scholar] [CrossRef]
  17. Baek, H.J.; Kim, K.K.; Kim, J.S.; Lee, B.; Park, K.S. Enhancing the Estimation of Blood Pressure Using Pulse Arrival Time and Two Confounding Factors. Physiol. Meas. 2010, 31, 145–157. [Google Scholar] [CrossRef] [PubMed]
  18. Takada, H.; Washino, K.; Harreil, J.S.; Iwata, H. Acceleration Plethysmography to Evaluate Aging Effect in Cardiovascular System Using New Criteria of Four Wave Patterns. Med. Prog. Technol. 1996, 21, 205–210. [Google Scholar] [CrossRef] [PubMed]
  19. Suboh, M.Z.; Jaafar, R.; Nayan, N.A.; Harun, N.H.; Mohamad, M.S.F. Analysis on Four Derivative Waveforms of Photoplethysmogram (PPG) for Fiducial Point Detection. Front. Public Health 2022, 10, 920946. [Google Scholar] [CrossRef] [PubMed]
  20. Suzuki, A.; Ryu, K. Feature Selection Method for Estimating Systolic Blood Pressure Using the Taguchi Method. IEEE Trans. Industr. Inform. 2014, 10, 1077–1085. [Google Scholar] [CrossRef]
  21. Krishnan, S. Biomedical Signal Analysis for Connected Healthcare; Academic Press: Cambridge, MA, USA, 2021; pp. 1–325. [Google Scholar] [CrossRef]
  22. Mok Ahn, J. New Aging Index Using Signal Features of Both Photoplethysmograms and Acceleration Plethysmograms. Healthc. Inform. Res. 2017, 23, 53–59. [Google Scholar] [CrossRef] [Green Version]
  23. Elgendi, M.; Norton, I.; Brearley, M.; Abbott, D.; Schuurmans, D. Systolic Peak Detection in Acceleration Photoplethysmograms Measured from Emergency Responders in Tropical Conditions. PLoS ONE 2013, 8, e76585. [Google Scholar] [CrossRef] [Green Version]
  24. Brillante, D.G.; O’sullivan, A.J.; Howes, L.G. Arterial Stiffness Indices in Healthy Volunteers Using Non-Invasive Digital Photoplethysmography. Blood Press. 2008, 17, 116–123. [Google Scholar] [CrossRef] [PubMed] [Green Version]
  25. Elgendi, M.; Fletcher, R.; Liang, Y.; Howard, N.; Lovell, N.H.; Abbott, D.; Lim, K.; Ward, R. The Use of Photoplethysmography for Assessing Hypertension. NPJ Digit. Med. 2019, 2, 60. [Google Scholar] [CrossRef] [PubMed] [Green Version]
  26. Sarhaddi, F.; Kazemi, K.; Azimi, I.; Cao, R.; Niela-Vilén, H.; Axelin, A.; Liljeberg, P.; Rahmani, A.M. A Comprehensive Accuracy Assessment of Samsung Smartwatch Heart Rate and Heart Rate Variability. PLoS ONE 2022, 17, e0268361. [Google Scholar] [CrossRef] [PubMed]
  27. Li, B.N.; Dong, M.C.; Vai, M.I. On an Automatic Delineator for Arterial Blood Pressure Waveforms. Biomed. Signal. Process. Control 2010, 5, 76–81. [Google Scholar] [CrossRef]
  28. Liang, Y.; Chen, Z.; Liu, G.; Elgendi, M. A New, Short-Recorded Photoplethysmogram Dataset for Blood Pressure Monitoring in China. Sci. Data 2018, 5, 180020. [Google Scholar] [CrossRef] [Green Version]
  29. Liu, D.; Görges, M.; Jenkins, S.A. University of Queensland Vital Signs Dataset: Development of an Accessible Repository of Anesthesia Patient Monitoring Data for Research. Anesth. Analg. 2012, 114, 584–589. [Google Scholar] [CrossRef]
  30. Saeed, M.; Villarroel, M.; Reisner, A.T.; Clifford, G.; Lehman, L.W.; Moody, G.; Heldt, T.; Kyaw, T.H.; Moody, B.; Mark, R.G. Multiparameter Intelligent Monitoring in Intensive Care II: A Public-Access Intensive Care Unit Database. Crit. Care Med. 2011, 39, 952–960. [Google Scholar] [CrossRef] [Green Version]
  31. Karlen, W.; Kobayashi, K.; Ansermino, J.M.; Dumont, G.A. Photoplethysmogram Signal Quality Estimation Using Repeated Gaussian Filters and Cross-Correlation. Physiol. Meas. 2012, 33, 1617–1629. [Google Scholar] [CrossRef]
  32. Liang, Y.; Elgendi, M.; Chen, Z.; Ward, R. Analysis: An Optimal Filter for Short Photoplethysmogram Signals. Sci. Data 2018, 5, 180076. [Google Scholar] [CrossRef] [Green Version]
  33. Wan, C.; Chen, D.; Yang, J. Pulse Rate Estimation from Forehead Photoplethysmograph Signal Using RLS Adaptive Filtering with Dynamical Reference Signal. Biomed. Signal. Process. Control 2022, 71 Part B, 103189. [Google Scholar] [CrossRef]
  34. Huang, R.; Qing, K.; Yang, D.; Hong, K.S. Real-Time Motion Artifact Removal Using a Dual-Stage Median Filter. Biomed. Signal. Process. Control 2022, 72 Part A, 103301. [Google Scholar] [CrossRef]
  35. Peng, F.; Liu, H.; Wang, W. A Comb Filter Based Signal Processing Method to Effectively Reduce Motion Artifacts from Photoplethysmographic Signals. Physiol. Meas. 2015, 36, 2159–2170. [Google Scholar] [CrossRef] [PubMed]
  36. Zhang, Q.; Chen, X.; Fang, Z.; Xue, Y.; Zhan, Q.; Yang, T.; Xia, S. Cuff-Less Blood Pressure Measurement Using Pulse Arrival Time and a Kalman Filter. J. Micromechanics Microengineering 2017, 27, 024002. [Google Scholar] [CrossRef]
  37. Charlton, P.H.; Celka, P.; Farukh, B.; Chowienczyk, P.; Alastruey, J. Assessing Mental Stress from the Photoplethysmogram: A Numerical Study. Physiol. Meas. 2018, 39, 054001. [Google Scholar] [CrossRef]
  38. Ghufran, K.S.; Jufen, Z.; Fei, C.; Dingchang, Z. Blood Pressure Estimation Using Photoplethysmography Only: Comparison between Different Machine Learning Approaches. J. Healthc. Eng. 2018, 2018, 1548647. [Google Scholar]
  39. Hossain, S.; Debnath, B.; Biswas, S.; Al-Hossain, M.J.; Anika, A.; Khaled, S.Z.N. Estimation of Blood Glucose from PPG Signal Using Convolutional Neural Network. In Proceedings of the IEEE International Conference on Biomedical Engineering, Computer and Information Technology for Health (BECITHCON), Dhaka, Bangladesh, 28–30 November 2019. [Google Scholar]
Figure 1. Illustration of fiducial points, where the blue lines in (a) represent the PPG waveform, (b) represent the VPG waveform, and (c) represent the APG waveform.
Electronics 12 01174 g001
Figure 2. Data selection and preparation process.
Electronics 12 01174 g002
Figure 3. PPG and APG waveforms, (i) Filtered PPG waveform, (ii) APG waveform, consisting of overall six fiducial points, where four points are in the systolic phase (a–d) which corresponds to the point of maximum acceleration, and two points are in the diastolic phase (e, f) which correspond to the dicrotic notch and diastolic peak of the PPG waveform.
Electronics 12 01174 g003
Figure 4. Flowchart of the CnD algorithm for filtering, examining, and identifying fiducial points.
Electronics 12 01174 g004
Figure 5. APG fiducial point extraction through Cases I–III, where (A) is the APG waveform examined by the algorithm between points b and e and it is classified into Case I–III based on this, (B) is the output waveform from the algorithm highlighting the fiducial point c and d, whereas (C) is the JPG waveform used to extract fiducial points for APG waveform.
Electronics 12 01174 g005
Disclaimer/Publisher’s Note: The statements, opinions and data contained in all publications are solely those of the individual author(s) and contributor(s) and not of MDPI and/or the editor(s). MDPI and/or the editor(s) disclaim responsibility for any injury to people or property resulting from any ideas, methods, instructions or products referred to in the content.

