Article

Intrusion Detection Method Based on CNN–GRU–FL in a Smart Grid Environment

1
School of Electrical and Information Engineering, Tianjin University, Tianjin 300072, China
2
China Electric Power Research Institute Co., Ltd., Beijing 100192, China
3
State Grid Corporation of China, Beijing 100031, China
4
Hexing Electrical Co., Ltd., Hangzhou 310030, China
*
Author to whom correspondence should be addressed.
Electronics 2023, 12(5), 1164; https://doi.org/10.3390/electronics12051164
Submission received: 16 December 2022 / Revised: 21 February 2023 / Accepted: 22 February 2023 / Published: 28 February 2023
(This article belongs to the Special Issue Artificial Intelligence in Cybersecurity for Industry 4.0)

Abstract

:
The aim of this paper is to address the current situation where business units in smart grid (SG) environments are decentralized and independent, and there is a conflict between the need for data privacy protection and network security monitoring. To address this issue, we propose a distributed intrusion detection method based on convolutional neural networks–gated recurrent units–federated learning (CNN–GRU–FL). We designed an intrusion detection model and a local training process based on convolutional neural networks–gated recurrent units (CNN–GRU) and enhanced the feature description ability by introducing an attention mechanism. We also propose a new parameter aggregation mechanism to improve the model quality when dealing with differences in data quality and volume. Additionally, a trust-based node selection mechanism was designed to improve the convergence ability of federated learning (FL). Through experiments, it was demonstrated that the proposed method can effectively build a global intrusion detection model among multiple independent entities, and the training accuracy rate, recall rate, and F1 value of CNN–GRU–FL reached 78.79%, 64.15%, and 76.90%, respectively. The improved mechanism improves the performance and efficiency of parameter aggregation when there are differences in data quality.

1. Introduction

A smart grid is usually composed of multiple smart devices, including intelligent metering and collection and monitoring systems, which can generate a large amount of data transmitted through the Internet. However, the standard communication protocols lack basic security measures, such as encryption and authentication, which makes smart grids particularly vulnerable to attacks. With the continuous increase in equipment, business types, and quantities connected to the smart grid, the security control of power communication network is becoming increasingly difficult. It has become an urgent problem to accurately and quickly detect the network security threats to the smart grid [1,2,3].
Intrusion detection technology is an effective means of ensuring network security. At present, the use of deep learning algorithms for intrusion detection has become a trend [4,5,6]. In the field of smart grids, the intrusion detection method based on deep learning has achieved some research results, such as the use of improved extreme random tree classifiers to achieve a multi-layer network security assessment of smart grids, as seen in [7], which also demonstrates the real-time intrusion detection of network security using machine learning, etc. However, some specific problems will be encountered during the implementation process: first, the supervised deep learning method requires the training data to be as rich and comprehensive as possible. However, the power communication network and smart grids are managed by different regions or departments, which may lack effective data aggregation mechanisms, and there may be data islands. Secondly, due to the existence of power system partitions and domains, the original data are aggregated across departments throughout the network, which may have potential data security and privacy problems, and lead to fuzzy security management boundaries and unclear security responsibilities. However, if each department only conducts intrusion detection research based on its own data, the resulting intrusion detection models will generally encounter problems, such as a low detection ability and a poor generalization ability caused by uneven data distributions.
In response to the above problems, federal learning (FL), which has emerged in recent years, provides a new solution. FL, as a distributed machine learning method, has characteristics such as distributed cooperation, easy expansion, and a low cost, etc. [8,9,10,11], and is compatible with smart grids using a large number of distributed power sources. Therefore, a distributed intrusion detection method based on CNN–GRU–FL is proposed. The innovation points of this paper are summarized as follows:
  • In order to solve the problem of a smart grid having a large number of distributed power sources [12], we designed a local detection method based on CNNs and GRUs, deployed it in multiple independent branch nodes, and used the attention mechanism to extract the key flow information, so as to further improve the comprehensiveness of the smart grid detection.
  • FL was introduced to aggregate and optimize the parameters globally, resulting in a unified and efficient intrusion detection method.
  • A node selection mechanism was designed to improve the convergence ability of FL in real environments.
  • A new parameter aggregation mechanism was designed to improve the training effect of the intrusion detection model under FL, while also allowing for the efficient training of the model without the direct aggregation of the original data.
The structure of this paper is as follows: the first part is the introduction, which introduces the research background and the innovation of the proposed method; the second part is the related work, systematically summarizing the existing research results; the third part describes the distributed intrusion detection method of smart grids; the fourth part discusses the local intrusion detection model based on CNN–GRU, in detail; the fifth part describes the parameter training method based on FL design; the sixth part is the experimental demonstration of the proposed method; and the seventh part is the conclusion.

2. Related Works

At present, certain results have been achieved in the research into deep learning, such as CNNs, LSTMs, and artificial neural networks, etc. [13]. Ref. [14] developed an efficient, scalable, and faster machine learning (ML)-based tool for real-time smart grid (SG) security. Ref. [15] designed a hybrid load forecasting model for smart grids based on a support vector regression model, and combined intelligent feature engineering with an intelligent algorithm to optimize the parameters. Ref. [16] proposed a factored, conditional, restricted Boltzmann machine (FCRBM) model for load forecasting, and proposed a genetic-wind-driven optimization algorithm for performance improvement. The FCRBM shows a strong capability in data analysis [17,18].
In addition, several research teams have applied various deep learning algorithms to intrusion detection methods. Some of their work is described as follows:
Long short-term memory (LSTM) network is a recursive neural network that uses time dimension information. Ref. [19] combined a multi-scale convolutional neural network (MSCNN) and an LSTM network model for intrusion detection, and the effect was good. Ref. [20] proposed intrusion detection technology based on federated simulation learning, which takes advantage of FL and simulation learning to minimize the possibility of obtaining any sensitive data to resist reverse engineering attacks on the learning model.
In 2020, Rahman et al. claimed that the accuracy of the federal learning detection model they proposed was close to the centralized method and superior to the distributed non-clustered device training model [21]. In the same year, Wang et al. combined FL and CNN to extract features and classify the detection based on FL and CNN [22]. In the same year, ref. [23] designed a high-precision intrusion detection model with a better intrusion detection performance using the optimized CNN and multi-scale LSTM.
In 2021, Li et al. considered the temporal characteristics of network intrusion data and used a GRU–RNN network structure to train on the KDD dataset and obtain a better recognition rate and convergence than other non-temporal networks [24]. In the same year, Mothukuri et al. proposed an anomaly detection method that combined FL and gated recurrent unit (GRU) models, using decentralized device data to actively identify intrusions in the Internet of Things, and conducted experiments to prove that this method was superior to the classic/centralized machine learning (non-FL) version in protecting user data privacy [25].
In 2022, Luo et al. designed an FL method based on deep learning, and applied deep learning and integrated learning to the framework of federation learning, improving the accuracy of local models by optimizing their parameters [26].

3. Distributed Intrusion Detection Method for Smart Grid

An intrusion detection method based on an FL network is proposed, which is composed of a central server and several participating nodes (referred to as “participants”). The topology is shown in Figure 1.
Branches in the smart grid environment have independent relationships and security responsibilities, and do not share and exchange original data with each other. Each branch provides a CNN–GRU algorithm model training node, and different participants use local data to train and maintain the algorithm model with the same structure. In the federation mechanism, the participants aggregate and update the model parameters under the auspices of the central server, and use federation learning to jointly build a global intrusion detection method. The participant data basically conform to the independent and identical distribution, so the horizontal federal learning model is adopted for parameter aggregation and distribution [27]. However, some participants may lack a few attack samples or individual data dimensions, so there is a certain degree of dependent co-distribution.
The operation process of the method includes: local model training and federation parameter aggregation, as shown in Figure 2.
The steps of horizontal FL are:
  • Each node uses the intrusion detection model based on the CNN–GRU algorithm to train the local data, and different nodes are maintained within the same algorithm network;
  • The selection mechanism is implemented for each node. The selected node uploads the model parameters after local training in the center for model aggregation, and the other nodes will not participate in this round of training aggregation;
  • The center aggregates the uploaded parameters, updates the global model parameters, and distributes them to each node;
  • Repeat steps 2 and 3 until the model converges with or reaches the specified maximum aggregation time, and end the training. At this point, the CNN–GRU model parameters with the best global effect will be obtained in the center.

4. Local Intrusion Detection Model Based on CNN–GRU

4.1. Local Training Process

The model training process based on CNN–GRU is shown in Figure 3.
In the local intrusion detection model, each branch independently collects traffic characteristics and tries to maintain the same data feature dimension, Dim. Considering the differences and limitations of acquisition technologies, the model is allowed to lose individual dimensions in the acquisition process, and Dim_ Loss indicates the limit of allowable loss. When the number of missing dimensions is less than 10% of the number of dimensions, we set the missing dimensions to 0, but do not add new dimensions, namely:
D i m _ L o s s < = 0.1 D i m
The branches uniformly preprocess and label the collected traffic characteristic data, allowing the label quality to be affected by the limitations of the branches’ data collection level and label ability. The preprocessing includes two steps: normalizing the data via the means of mean normalization; and using the nearest neighbor method to process the missing data values. The data are used to train the intrusion detection model.
The local intrusion detection model is a supervised learning multi-classification detection model based on CNNs and GRUs. The model is shown in Figure 3. Its main body is a roll-up layer and a GRU layer. There is one maximum pooling layer, one random deactivation (dropout) layer, and one full connection layer, and finally, the classification results are output through the attention optimization layer.
In the model, the one-dimensional convolution layer is used to realize the de-sampling and potential feature capture of the dataset. After processing, the feature data is input into the GRU network unit, and is finally classified by the attention optimization layer. The characteristics of CNNs and the simple structure of GRUs can effectively suppress the gradient explosion.
At the same time, considering the data characteristics, such as multi-dimensionality and feature imbalances, the attention mechanism is introduced. The attention mechanism enhances the presentation of important features. In addition, because of the parallelism of the attention mechanism calculation, the training efficiency of the intrusion detection model is improved.

4.2. One-Dimensional CNN Unit

A CNN is a feedforward neural network with the characteristics of a convolution calculation and depth network [28]. A one-dimensional CNN regards the input data as one-dimensional vector, conducts a convolution operation on the input data to construct a feature plane, and generates a group of new features [29]. The CNN output y(x) is as follows:
y ( x ) = f ( j i w i j x i j + b )
where, f(*) represents the activation function(AF), wij is the convolution kernel weight of the position (i,j) of size m × n, i,jRm,n, xij is the input vectors, and b represents the offset.
Then, we apply the maximum pooling operation on each feature plane, select the feature with the highest value, and input the new feature into the full connection layer. The AF of the full connection layer is the softmax function, and the mathematical definition formula of the output σ t of this layer is:
σ t = s o f t max ( w h 0 H + b 0 )
where, wh0 is the convolution kernel, H is the feature, and b0 is the offset. The minimum and maximum values of the offset are one and three, respectively.

4.3. GRU Algorithm Unit

A GRU is a kind of RNN (recurrent neural network). A GRU retains the ability of a traditional RNN to process time series data. By selectively adding new information and forgetting the information accumulated before the gating unit, GRUs effectively solve the problem of RNN gradient disappearance during training, and make up for the problem of RNNs being unable to solve the long-term dependence when processing long series data [30].
GRUs simplify and adjust the structure of LSTMs [31], reduce the number of parameters, and shorten the training time. The structure of the gate control cycle unit in the GRU is shown in Figure 4.
The reset gate rt and update gate zt of the GRU are calculated as follows:
r t = σ ( W r x t + U r h t 1 )
z t = σ ( W z x t + U r h t 1 )
h ˜ = tan h ( W h x t + U ( r t h t 1 ) )
h t = ( 1 z t ) h t 1 + z t h ˜ t
where, x t represents the input quantity, h ˜ t is the hidden unit to be updated, ht represents the hidden layer status of the current GRU unit, Wr, Wz, Wh, Ur, and U are weight matrices, and σ represents a sigmoid function. The above Formulas (4) and (5) first multiply the input value and the output value at the previous time by weight, and then obtain the values of the reset gate and update gate through the sigmoid function. Formula (6) shows that the information of ht−1 is obtained by multiplying the forgetting layer and the output value at the previous time, and that the hidden layer state is obtained by adding the forgetting layer and the output value through the tan h activation function. The final output is updated, as shown in Formula (7).

4.4. Attention Mechanism

The attention mechanism synchronously maps the input traffic data to three special attention matrices, namely, the query matrix Q, key value matrix K, and value matrix V matrix, through the weight matrices Wq, Wk, and Wv, and processes them through the inner product of the Q matrix and K matrix. After scaling according to the data dimension d i , the weight is calculated by the softmax function, and is then matched to the corresponding value matrix V to obtain the attention result. Then, it is combined with the CNN–GRU network to determine the final classification result.
The attention mechanism can be divided into the single-headed and the multi-headed attention. The calculation formula of the single-headed attention A T T ( Q , K , V ) is:
A T T ( Q , K , V ) = s o f t max ( Q K T d i ) V
The multi-headed attention mechanism is conducive to the multi-level comparison and analysis of the collected traffic data. The key information in the traffic can be more accurately focused and captured through the multiple linear mapping of Q, K, V, and the scaling processing, and the model can be optimized through the continuous learning of parameters to obtain more robust results.
The multi-headed attention is calculated by splicing all the single-headed vectors end-to-end, and then obtaining the final multi-headed attention value through a linear transformation. Multi-headed attention can effectively prevent over-fitting by integrating multiple independent attention calculations.

5. Parameter Training Based on FL

5.1. Federal Learning Process in the Smart Grid Scenario

The main idea of the federated average algorithm is to allow training nodes to upload and aggregate the model parameters after multiple rounds of training in an incremental manner. In a smart grid scenario, the traditional FA algorithm may have several problems:
  • In an actual smart grid environment, considering the technical level of the different branch structures, the quality and volume of the local data may vary greatly. While the FA algorithm distributes the average weights of the nodes participating in the aggregation during the parameter aggregation, it does so without taking into account the volume and quality of the local dataset, which may reduce the accuracy of the global model [32].
  • There are many branches in a smart grid, and the network status among the branches may be uncertain. This leads to an uncontrollable aggregation and training time, and the overall training time depends on the maximum communication delay of each round.
  • A smart grid is vulnerable to multiple types of network attacks, and malicious nodes participating in FL will cause the model performance to decline. Normal nodes may be transformed into malicious nodes by identity theft, and be attacked by increasing the weight of their own nodes in the process of FL. In addition, considering the large size of smart grid nodes, it is possible to have a number of legal nodes. A large number of similar nodes participating in the aggregation will reduce the efficiency of the model aggregation.
To solve these problems, firstly, the core aggregation formula is improved in the traditional FA algorithm. Based on the number of dataset samples and the proportion of attack samples, the contribution rate of the different nodes is adjusted to balance the impact of uneven data distribution. Secondly, a node selection mechanism based on trust is introduced, which comprehensively considers the communication delay, node quality, node historical behavior, and node similarity, and selects the trusted nodes to participate in the aggregation.

5.1.1. Parameter Updating Mechanism of FA Algorithm

The total dataset is divided into N sub sets, that is, N nodes. The local dataset covered by node d in the i-th federated task is expressed as H = (xi,d,yi,d). Without losing generality, we use the loss function li = (xi,d,yi,di,d) for each node in local training, where ωi,d is the model parameter of equipment node d in the i-th training, that is, the loss function L i ( ω ) [33] of the i-th round of the federal task, and is defined as follows:
L i ( ω ) = 1 | C i | d N l i ( x i , d , y i , d ; ϖ i , d )
where, |Ci| represents the size of the dataset participating in the i-th round of federal tasks, and ω represents the weight value of the current training model. The goal for the federation mechanism is to minimize the li trained on each sub-dataset [34], namely:
ω = arg min L i ( ω )
In terms of parameter updating, the general random gradient descent (SGD) algorithm is used in the parameter-updating method of FL, which can reduce the computational load [35]. The model parameter update formula for the n-th iteration is:
ϖ i , d n = ϖ i , d n 1 h n l ( ϖ i , d n 1 )
where hn represents the learning rate of the n-th training, and ∇ is the gradient operator.

5.1.2. Improved Model Aggregation Mechanism

In order to balance the contribution rate of the different local training results with the global model, the aggregation formula of the FA algorithm is improved from the perspectives of dataset size and the attack proportion in the dataset, as shown in Formula (12):
ϖ n + 1 = ω n + d N | C d | ( ϖ n + 1 ϖ n ) | P d | | C i |
wherein ω n represents the n-th global parameter (weight value), C represents the size of all the datasets, and Cd represents the size of the dataset of sub-model d. ωn+1 − ωn represents the difference between the weights uploaded for the n + 1 training, and the weights uploaded for the n-th training when the local training is performed on sub-model d. Pd represents the proportion of the attacks in sub-model d among all attacks. Different from the traditional weighted average method, the core aggregation Formula (12) introduces the proportion of each sub-dataset in the total dataset |Cd|/|Ci|, and the proportion of the attacks in the d sub-model within all the attacks Pd, to balance the contribution of each federated node’s upload parameters.

5.2. Trust-Based Node Selection Mechanism

Under the smart grid FL model, trust is expressed as whether the nodes participating in the aggregation have a greater value. It is of great value in that the node delay is within the specified threshold, the node data are of a high quality, the historical behavior of the node is legal, and there is no node with a high similarity.
In order to better select some of the most valuable nodes, this paper introduces a trust-based node selection mechanism, and the selection process is shown in Figure 5.
This mechanism divides the global trust value into direct and indirect trust.
The direct trust value comprehensively considers the influence of the communication delay, node quality, and node historical behavior. The communication delay directly affects the efficiency of FL. The quality of the nodes affects the final training effect of the global model. The renegade node interferes with the precision of the model by stealing the legal identity of the original node. The introduction of historical node behavior factors can gradually reduce the trust of the renegade node.
The indirect trust index is introduced to avoid the problem of efficiency reduction caused by node redundancy. In this paper, the indirect trust value is obtained by calculating the node similarity.
This paper uses the hierarchical method to assign values to the indicators, and then introduces the weight mechanism to calculate the global trust value. The specific indicators are as follows:
  • Communication delay Trustd: specify the maximum training times m and the maximum training duration tm when each sub-model conducts local training. ti is the time required for node i to complete m times of training, and Ti is the actual delay of each sub-model. When the number of training times of node i reaches m or the training time exceeds the specified maximum duration, the index is assigned as 0, or otherwise score is assigned according to the grading rules:
    T r u s t d = { 0 ,       T i > max i N { t i , t m } s c o r e ,             o t h e r s
  • Node data quality Trustq: in this paper, the node quality mainly takes into account the proportion of the node dataset size within the entire dataset. The higher the proportion, the higher the score is.
  • Node historical behavior Trusth: it stores the node’s historical behavior trust value in a trust list. After each round of node selection, a new trust value will be updated. Node i has no historical behavior when participating in node selection for the first time; thus, it is assigned a minimum trust value Thmin. The calculation process is shown in Algorithm 1.
Algorithm 1: Trust value algorithm for node history behavior.
Input: Thmin, Trustdi, Trustqi, Trusthi
Output: Trusthi
if(Trusthi’ = NULL)
Trusthi = Thmin
else
scorei = σ * Trustdi + (1 − σ) * Trustqi
   if(scorei/scorei’ > 1 + γ)
     Trusthi = Trusthi’ + α
else if (scorei/scorei’ < 1 − γ)
Trusthi = Trusthi’ − α
else
Trusthi = Trusthi
   end
end
Among them, Trustdi and Trustqi are, respectively, the communication delay score and the node data quality score of node i, in this round of node selection. Trusthi scores the last round of the historical behavior of node i. For each round of selection, a scorei is calculated according to the communication delay and data quality score of the node in the round, and is compared with the value of scorei in the previous round. The reward and punishment factors α are introduced, and if the scorei is greater than γ% of the scorei, α will be rewarded on the basis of Trusthi, and, if it is less than γ%, α will be punished. Otherwise, the original Trusthi will be kept unchanged, and the final historical behavior trust value will not exceed the upper and lower limits of the assigned value.
4.
Direct trust value: the three indicators of Trustd, Trustq, and Trusth are comprehensively considered, and Formula (14) is used to calculate the direct trust value DT:
D T = 2 T r u s t d + T r u s t q + T r u s t h
5.
Indirect trust value: the similarity is calculated by the distance of dimension space. In this paper, the Chebyshev distance is calculated. The dimension of the sample space is s, and the distance between L ( Q m , Q n ) of any sample object Qm and Qn is:
L ( Q m , Q n ) = lim k ( i = 1 s | Q m i Q n i | k ) 1 / k
The average value of all Chebyshev distances is calculated as the threshold value, and the indirect trust value of the nodes with a distance greater than the average value is assigned a full score. The nodes with a distance less than the average value have a high similarity, which is assigned 0.
6.
The global trust value TG is calculated as follows:
T G = ϖ D T + ( 1 - ϖ ) IT
where ϖ is the weight of the DT. We set a predetermined global trust value threshold of θ , and if the TG is greater than θ , the node is trusted.

6. Experiment and Analysis

6.1. Experiment Preparation

6.1.1. Experimental Environment and Data Preprocessing

Considering that the article focuses on the design of the model architecture process, node selection, weight integration, data transmission, and privacy protection are not concerns. Therefore, the simulation experiment is carried out in a stand-alone environment. Thus, the local training dataset in multiple sub-nodes is simulated by splitting the training dataset. Based on the segmented dataset, the single node training effect, node selection, and FL effect, etc., are all tested. The experimental hardware environment is: 3.0 GHz CPU, 32 GB memory, and the software environment is Python 3.8.
The experiment is based on the open-source dataset NSL-KDD, and the data structures are the same as KDD-CUP 99. The dataset contains normal traffic and different kinds of abnormal traffic. It can be classified into five categories: a denial-of-service attack (DoS), a user-to-root attack (U2R), a remote-to-local attack (R2L), a probing attack, and normal. The dataset contains 41 features, including 7 category features or unordered discrete features; there are 22 attacks, and 14 attacks only appear in the test set. All the attacks fall into four categories, including denial-of-service (Dos), surveillance or probe (probe), remote-to-local (R2L), and user-to-root (U2R). The data distribution of NSL-KDD is shown in Table 1. KDD-CUP 99 has problems such as a high redundancy and a high data noise, while NSL-KDD has deleted duplicate and redundant records, especially of normal traffic data. NSL-KDD has a relatively small amount of data, and the distribution of the data features is uneven. Some feature values rarely appear in the training set, or even do not exist. Therefore, after the NSL-KDD dataset is split, a “data island” is easy to form, or the data distribution is uneven, which is more suitable for verifying and comparing the effect of FL.
There are six out-of-order features in the data. When preprocessing the data, we first use the target code to map it to a numerical value. Target encoding is a supervised coding method which maps a discrete type class to a posteriori probability of the target of that class, so that the column can be directly linked to the target column without adding any data dimensions, avoiding the problem of adding these data dimensions in common hot coding. The basic strategy of target coding is as follows:
There are N data points (xi,yi), and the target code maps each layer x to a feature, and the code value corresponding to the current feature value is E(j) below:
E ( j ) = 1 S ( j ) i = 1 S y i I { x i = x ( j ) }
where, x(j) is the current feature value, S is the total number of samples, and II is the indicator function, where:
S ( j ) = i = 1 S I { x i = x ( j ) }
Then, all the data are normalized. The normalized value β i is calculated as follows:
β i = α i α mean S ^
where, αmean is the mean value corresponding to the eigenvalue, and S ^ represents the variance corresponding to the eigenvalue.
Thirdly, the data tags in the dataset should be uniquely hot coded during training and expanded to an n-dimensional array.

6.1.2. Parameters of Local Detection Model

The specific parameters of the node’s local CNN–GRU detection model are as follows: the size and number of the convolution kernels are 1 × 3 and 64, respectively. The one-dimensional convolution layer can realize the de-sampling of the one-dimensional data. The step size of the maximum pool layer is two, which can reduce the number of parameters to half of the original. The pool layer can select important local features. The GRU layer output data dimension is 1 × 64. The dropout parameter of the random deactivation layer is set to 0.5. Based on the output data in the local CNN–GRU model, the data dimensions of Wq, Wk, and Wv are set to 64 × 64. The data dimensions of the Q, K, and V matrices are all 1 × 64.

6.1.3. FL Model Parameters

The specific parameters of the node selection mechanism based on trust are as follows: the full score of each trust index is 100, and the value is assigned according to the respective evaluation criteria. The maximum training number m of each node is five, and the maximum training duration tm is 30 s. In the trust value algorithm of the node historical behavior, the minimum trust value Thmin is set to 50, and the reward and punishment factors are α = 5, γ = 0.5. The weight of the direct trust value ω is set to 0.75, and the weight of the IT value is 0.25, so as to ensure that the full scores of the DT and IT values are basically equal after weighting. The predetermined threshold θ is specified as 25, which is half of the full score of the weighted global trust value.

6.1.4. Experimental Evaluation Index

The evaluation indexes of the experiment are accuracy, recall, and the F1 value. The evaluation is calculated as follows:
Accuracy: this refers to the ratio of the number of samples correctly classified by the classifier to the total number of samples. Generally speaking, the higher the accuracy, the better the detection or classification effect is. This indicator A can be expressed as:
A = P T + N T P T + P F + N T + N F
where, PT, PF, NT, and NF are the number of samples with true positive, false positive, true negative, and false negative, respectively.
Precision: this indicates the correct attack sample frequency predicted by the model, that is, how many of the predictions that are true are correct. This indicator is high, indicating that the false positive rate of the prediction is low. This indicator P can be expressed as:
P = P T P T + P F
Recall: this represents the ratio of the correctly classified samples to the actual samples. A high recall indicates a low rate of missed reports. This indicator R can be expressed as:
R = P T P T + N T
F1 score: the accuracy and the recall rate of the model are comprehensively considered. A high index means that there are fewer false positives and false negatives. The two indicators are balanced. This indicator F can be expressed as:
F = 2 P R P + R

6.2. Experiment and Result Analysis

6.2.1. Effect Analysis of CNN–GRU Centralized Inspection Model

The NSL-KDD full dataset is used for algorithm training. The effect of the CNN–GRU algorithm adopted by a single training node is tested and analyzed. Because there are normal data and five types of attacks, the number of neurons in the last full connection layer of the model is five. Considering that the data volume of the training nodes is small in the FL mechanism, the maximum number of the training rounds is ten. If the accuracy is not improved for five consecutive rounds, the training can be terminated in advance. The effects of different algorithms (decision trees, logical regression, naive Bayes, random forests, and the CNN–GRU centralized model) are shown in Table 2.
From Table 2, for the classification detection of the NSL-KDD full dataset, excluding the naive Bayesian algorithm, most traditional classification algorithms and article models can achieve a high accuracy, but due to the limitations of the dataset itself, the recall rate is generally low. The CNN–GRU algorithm has certain advantages in its overall prediction. It shows that the CNN–GRU algorithm has a strong intrusion detection capability when the dataset is relatively comprehensive.

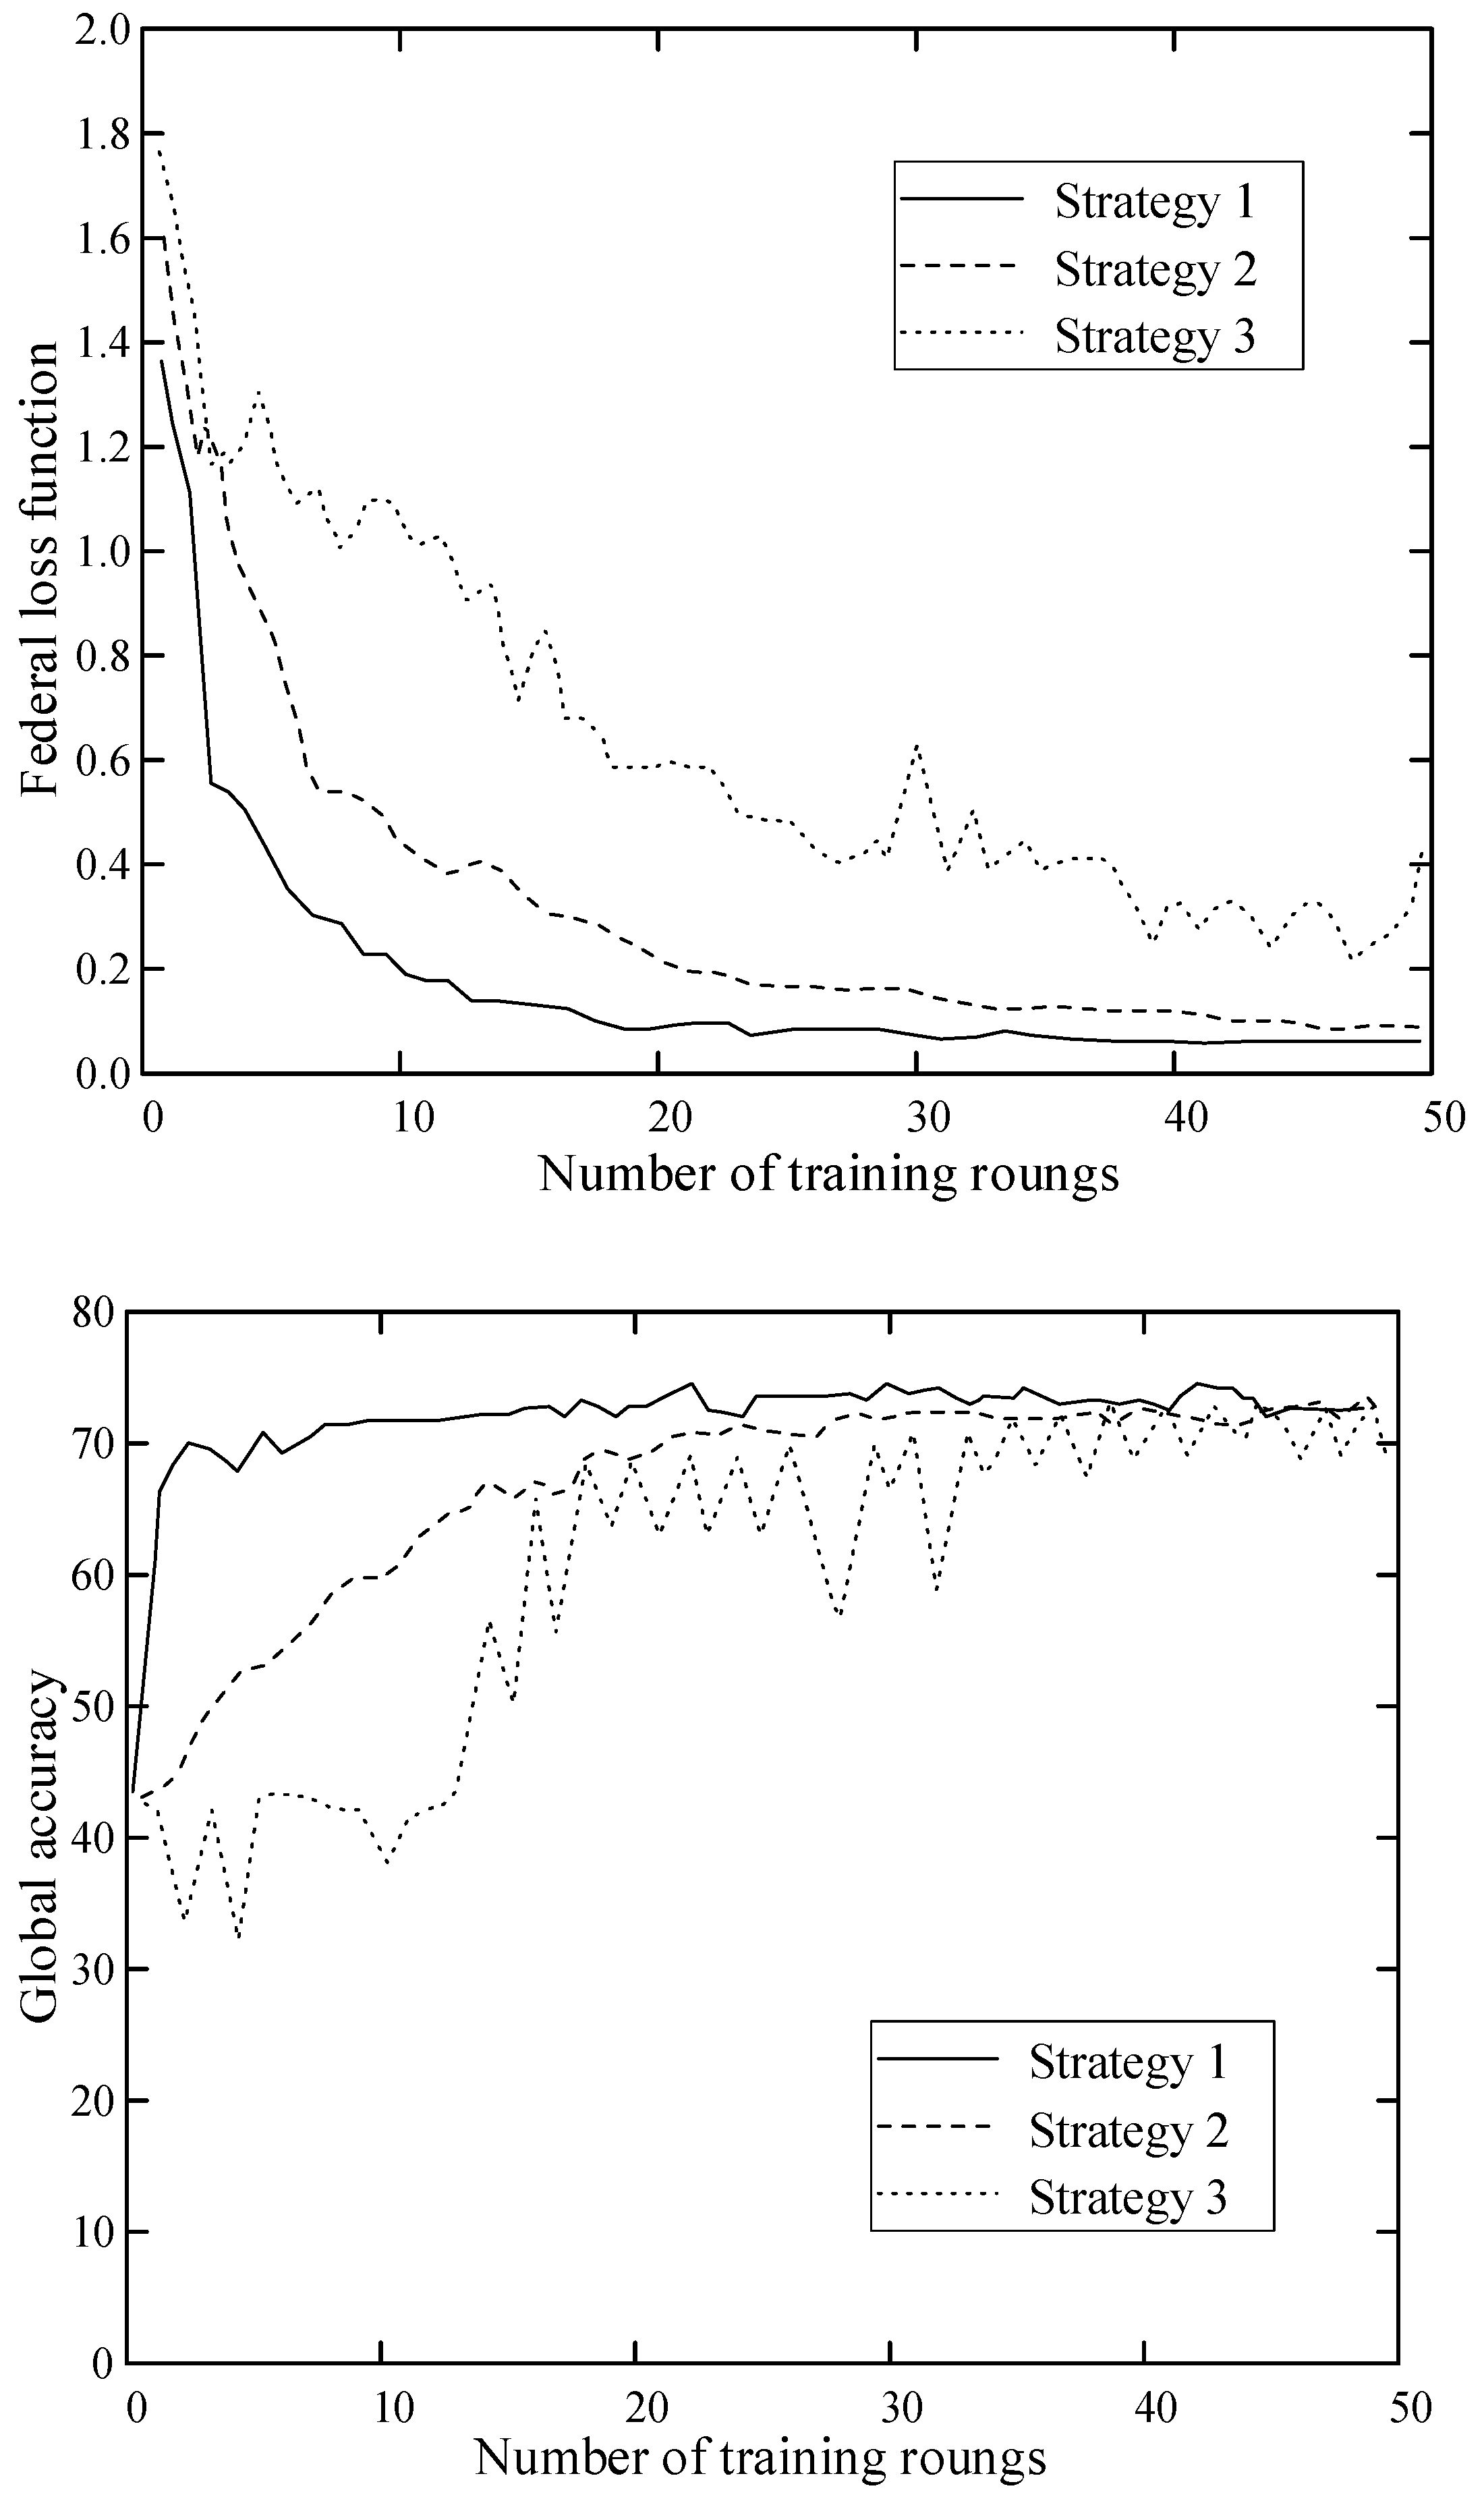
6.2.2. Effect of Node Selection in FL Algorithm

The experiment with the federal learning strategy is proposed in Formula (12). We focus on adjusting and testing the trust-based node selection mechanism proposed in Section 3 and the local training times of the CNN–GRU algorithm proposed in Section 2.
Considering that the current experimental environment cannot simulate the node timeout, the number of aggregated nodes in each round is a random number within the upper and lower limits. The nodes are randomly selected. The aggregation is mainly based on the loss function described in Formula (9) and the core aggregation formula described in Formula (12). The training dataset is divided into 100 pieces to simulate the situation when there are 100 training nodes in the FL model. The upper and lower limits of each round of the aggregation nodes are selected from the values shown in Table 3 to simulate the good, moderate, or poor status of the network or nodes in the actual scenario. The test results are shown in Figure 6.
It can be seen from Figure 6 that when more nodes are required to be aggregated in each round, the FL model converges faster. When the number of nodes is between 15–30, the model can converge to a better degree, in about 20 iterations. On the contrary, when there are few aggregation nodes, the convergence speed of FL decreases, and the accuracy fluctuates greatly. However, when the number of training rounds is sufficient, the accuracy remains good.
Therefore, in the actual smart grid scenario, the relevant parameters in the node selection strategy, such as the maximum communication delay, can be reasonably adjusted according to the network status, node training delay, and other specific parameters.

6.2.3. Analysis and Comparison of FL Detection Effects

An experimental analysis is performed on the effect of the FL algorithm, and the effect is compared with that of single node detection in the presence of “data islands”. The specific experimental methods are as follows:
First, the effect of the FL detection was analyzed experimentally. The overall detection model, based on the CNN–GRU and FL mechanisms proposed in this paper, was tested and analyzed. The experimental parameters were: the number of federation aggregation rounds was set at 50, assuming that there were 100 training nodes in the model, and the upper and lower limits of each round of the node selection were set as 10 and 20.
Secondly, 5 samples were selected from 100 data samples, each of which had about 1260 samples itself. The CNN–GRU algorithm was used for training, and the scene of five training nodes using local data for intrusion detection training was simulated. The algorithm parameters were consistent with those in Table 2.
Finally, it was considered that, in the FL mechanism, the data volume of each training node would not be too large, and that the number of rounds in the local CNN–GRU model during the aggregation update was ten at most. The detection effects are shown in Table 4.
From Table 4, it can be seen that the training results of FL are similar to the detection results after all data are trained together, which are shown in Table 3. The training accuracy rate, the recall rate, and the F1 value of CNN–GRU–FL reached 78.79%, 64.15%, and 76.90%, respectively, which is 3.65% higher than that of the random forest in Table 2. This shows that the federated learning method proposed in the article can achieve a similar detection effect with the centralized model without data aggregation, which ensures data privacy.
However, the detection effect of a single training node is limited by the local data, and its accuracy, recall, and other indicators have been declined to varying degrees. Due to the uneven distribution of the data during data segmentation, the detection effects of the different nodes differ, which indicates that in the actual power IoT scenario, due to the difference of the data collected by each unit, when each unit conducts its own intrusion detection training its detection effect shows a certain degree of uncertainty, which may lead to weak links in the overall network.
The effect of attack classification is tested. Considering the distribution of the different attack types, DoS and probe attack types are performed with more data, so they are evenly distributed during the data segmentation. However, if the number of U2R attacks is too small, a large number of nodes will be unable to identify this type of attack. Therefore, an R2L attack is selected for the attack classification test. The test results are shown in Table 5.
It can be seen from the table that a single training node is limited by its own data and cannot classify specific types of attacks, such as node 3 and node 4, and that the detection index obtained is 0. However, the method enables FL and the nodes in the model to obtain the detection ability for a specific type of attack without being attacked by it, that is, it eliminates the possible poor detection ability, the lack of specific attack classification ability, and the over-fitting of the model of a single node under the effect of an information island. The accuracy of this method is 88.34%.
In addition, in the general FL scenario, due to the data dispersion and the randomness of each round of aggregation nodes, the detection and classification performance will be lost. Thus, the FL model is inferior to the centralized model in terms of the performance indicators. However, based on the conclusions in Table 5 and Table 6, the average precision of our model is 97.2%. The overall similarity to the centralized model of all indexes is 93.5%. It can be seen that, by improving the aggregation mechanism of the model parameters, the method in this paper has obtained index values similar to those of the CNN–GRU centralized model, without a significant performance degradation.

6.2.4. Intrusion Detection Time Comparison

In order to demonstrate the detection efficiency of the proposed CNN–GRU–FL method, it is compared with the decision tree, logical regression, naive Bayes, random forest, and CNN–GRU centralized model. Then, 5 pieces of data are selected, each of which has about 1260 samples. The return time of the system when the intrusion detection is completed by different methods is shown in Table 6.
From Table 6, the detection time of the method using a single detection model, such as the decision tree, is shorter, and the detection time is not more than 0.22 s. However, the CNN–GRU centralized model needs intensive processing of the data, so it takes a long time, reaching 0.2681 s. Since the proposed model improves FL based on trust, which can accelerate its convergence speed, the detection time is reduced by 0.2359 s compared with the centralized model. Overall, the proposed method is effective in the intrusion detection of a smart grid.

7. Conclusions

A distributed intrusion detection method based on CNN–GRU–FL is proposed to solve the problems of data security and data privacy in smart grids. First, we deploy intrusion detection models based on CNN and GRU at each local end. Then, federal learning is introduced to aggregate and optimize the parameters to form a unified and efficient intrusion detection method. In the overall intrusion detection method, a trust-based node selection mechanism is designed to improve the convergence ability of the federation model, and a new parameter aggregation mechanism is designed to improve the training effect of the intrusion detection model under the federation learning. The experimental results show that the training accuracy rate, the recall rate, and the F1 value of CNN–GRU–FL reached 78.79%, 64.15%, and 76.90%, respectively, and that the detection time is 0.2359s. It is an efficient and accurate intrusion detection model.
Due to the continuous development of information technology, new network attacks are bound to occur, and the proposed methods may lack universality. Therefore, in future research, migration learning and other mechanisms will be introduced to further improve the monitoring ability of intrusion detection methods.

Author Contributions

Conceptualization, F.Z. and S.L.; methodology, F.Z., T.Y., H.C. and S.L.; software, T.Y., H.C. and F.Z.; validation, F.Z. and S.L.; formal analysis, F.Z., T.Y., H.C., B.H. and S.L.; investigation, F.Z., T.Y., H.C. and B.H.; resources, B.H.; data curation, F.Z., T.Y. and H.C.; writing—original draft preparation, F.Z., T.Y., H.C. and S.L.; writing—review and editing, F.Z. and S.L.; visualization, F.Z., T.Y. and H.C.; supervision, F.Z., B.H. and S.L.; project administration, S.L.; funding acquisition, B.H. All authors have read and agreed to the published version of the manuscript..

Funding

This research was funded by National Key R&D Program of China (2022YFB2403800), National Natural Science Foundation of China (61971305), Key Program of Natural Science Foundation of Tianjin (21JCZDJC00640).

Data Availability Statement

The original data can be obtained by contacting the corresponding author.

Acknowledgments

Thanks for the help in compiling this article from China Electric Power Research Institute Co., Ltd. and State Grid Corporation of China. Project Supported by National Key R&D Program of China (2022YFB2403800), National Natural Science Foundation of China (61971305), Key Program of Natural Science Foundation of Tianjin (21JCZDJC00640).

Conflicts of Interest

The authors declare no conflict of interest.

References

  1. Kim, H.; Choi, J. Intelligent Access Control Design for Security Context Awareness in Smart Grid. Sustainability 2021, 13, 4124. [Google Scholar] [CrossRef]
  2. Yin, X.C.; Liu, Z.G.; Nkenyereye, L.; Ndibanje, B. Toward an Applied Cyber Security Solution in IoT-Based Smart Grids: An Intrusion Detection System Approach. Sensors 2019, 19, 4952. [Google Scholar] [CrossRef] [PubMed] [Green Version]
  3. Waghmare, S. Machine Learning Based Intrusion Detection System for Real-Time Smart Grid Security. In Proceedings of the 2021 13th IEEE PES Asia Pacific Power & Energy Engineering Conference (APPEEC), Thiruvananthapuram, India, 21–23 November 2021. [Google Scholar]
  4. Subasi, A.; Qaisar, S.M.; Al-Nory, M.; Rambo, K.A. Intrusion Detection in Smart Grid Using Bagging Ensemble Classifiers. Appl. Sci. 2021, 13, 30. [Google Scholar]
  5. Zhong, W.; Yu, N.; Ai, C. Applying Big Data Based Deep Learning System to Intrusion Detection. Big Data Min. Anal. 2020, 3, 181–195. [Google Scholar] [CrossRef]
  6. Khan, F.A.; Gumaei, A.; Derhab, A.; Hussain, A. A Novel Two-Stage Deep Learning Model for Efficient Network Intrusion Detection. IEEE Access 2019, 7, 30373–30385. [Google Scholar] [CrossRef]
  7. Mohamed, M.; Shady, S.R.; Haitham, A. Intrusion Detection Method Based on SMOTE Transformation for Smart Grid Cybersecurity. In Proceedings of the 2022 3rd International Conference on Smart Grid and Renewable Energy (SGRE), Doha, Qatar, 20–22 March 2022. [Google Scholar]
  8. Yin, C.L.; Zhu, Y.F.; Fei, J.L.; He, X. A Deep Learning Approach for Intrusion Detection Using Recurrent Neural Networks. IEEE Access 2017, 5, 21954–21961. [Google Scholar] [CrossRef]
  9. Nguyen, T.D.; Marchal, S.; Miettinen, M.; Fereidooni, H.; Asokan, N.; Sadeghi, A.-R. DoT: A Federated Self-learning Anomaly Detection System for IoT. In Proceedings of the 2019 IEEE 39th International Conference on Distributed Computing Systems (ICDCS), Dallas, TX, USA, 7–10 July 2019. [Google Scholar]
  10. Zhang, Z.; Zhang, Y.; Guo, D.; Ya, L.; Li, Z. SecFedNIDS: Robust defense for poisoning attack against federated learning-based network intrusion detection system. Future Gener. Comput. Syst. FGCS 2022, 134, 154–169. [Google Scholar] [CrossRef]
  11. Vy, N.C.; Quyen, N.H.; Duy, P.T.; Pham, V.H. Federated Learning-Based Intrusion Detection in the Context of IIoT Networks: Poisoning Attack and Defense. In Proceedings of the Network and System Security: 15th International Conference, Tianjin, China, 23 October 2021. [Google Scholar]
  12. Halid, K.; Kambiz, T.; Mo, J. Fault Diagnosis of Smart Grids Based on Deep Learning Approach. In Proceedings of the 2021 World Automation Congress (WAC), Taipei, Taiwan, 1–5 August 2021. [Google Scholar]
  13. Vinayakumar, R.; Soman, K.P.; Poornachandran, P. Applying convolutional neural network for network intrusion detection. In Proceedings of the 2017 International Conference on Advances in Computing, Communications and Informatics (ICACCI), Udupi, India, 13–16 September 2017. [Google Scholar]
  14. Hafeez, G.; Alimgeer, K.S.; Wadud, Z.; Khan, I.; Usman, M.; Qazi, A.B.; Khan, F.A. An Innovative Optimization Strategy for Efficient Energy Management With Day-Ahead Demand Response Signal and Energy Consumption Forecasting in Smart Grid Using Artificial Neural Network. IEEE Access 2020, 8, 84415–84433. [Google Scholar] [CrossRef]
  15. Hafeez, G.; Khan, I.; Jan, S.; Shah, I.A.; Khan, F.A.; Derhab, A. A novel hybrid load forecasting framework with intelligent feature engineering and optimization algorithm in smart grid. Appl. Energy 2021, 299, 117178. [Google Scholar] [CrossRef]
  16. Hafeez, G.; Alimgeer, K.S.; Wadud, Z.; Shafiq, Z.; Ali Khan, M.U.; Khan, I.; Khan, F.A.; Derhab, A. A Novel Accurate and Fast Converging Deep Learning-Based Model for Electrical Energy Consumption Forecasting in a Smart Grid. Energies 2020, 13, 2244. [Google Scholar] [CrossRef]
  17. Khan, I.; Hafeez, G.; Alimgeer, K.S. Electric Load Forecasting based on Deep Learning and Optimized by Heuristic Algorithm in Smart Grid. Appl. Energy 2020, 269, 114915. [Google Scholar]
  18. Hafeez, G.; Javaid, N.; Riaz, M.; Ali, A.; Umar, K.; Iqbal, Z. Day Ahead Electric Load Forecasting by an Intelligent Hybrid Model Based on Deep Learning for Smart Grid. In Proceedings of the Conference on Complex, Intelligent, and Software Intensive Systems, Sydney, Australia, 3–9 July 2019; Springer: Cham, Switzerland, 2019. [Google Scholar]
  19. Zhang, J.; Ling, Y.; Fu, X.; Yang, X.; Xiong, G.; Zhang, R. Model of the intrusion detection system based on the integration of spatial-temporal features. Comput. Secur. 2020, 89, 101681. [Google Scholar] [CrossRef]
  20. Al-Marri, A.A.; Ciftler, B.S.; Abdallah, M. Federated Mimic Learning for Privacy Preserving Intrusion Detection. In Proceedings of the 2020 IEEE International Black Sea Conference on Communications and Networking (BlackSeaCom), Odessa, Ukraine, 26–29 May 2020. [Google Scholar]
  21. Rahman, S.A.; Tout, H.; Talhi, C.; Mourad, A. Internet of Things Intrusion Detection: Centralized, On-Device, or Federated Learning? IEEE Netw. 2020, 34, 310–317. [Google Scholar] [CrossRef]
  22. Wang, R.; Ma, C.; Wu, P. An intrusion detection method based on federated learning and convolutional neural network. Netinfo Secur. 2020, 20, 47–54. [Google Scholar]
  23. Prk, A.; Ps, B. Unified deep learning approach for efficient intrusion detection system using integrated spatial-temporal features. Knowl.-Based Syst. 2021, 226, 107132. [Google Scholar]
  24. Li, J.; Xia, S.; Lan, H.; Li, S.; Sun, J. Network intrusiondetection methodbasedon GRU-RNN. J. Harbin Eng. Univ. 2021, 42, 879–884. (In Chinese) [Google Scholar]
  25. Mothukuri, V.; Khare, P.; Parizi, R.M.; Pouriyeh, S.; Dehghantanha, A.; Srivastava, G. Federated Learning-based Anomaly Detection for IoT Security Attacks. IEEE Internet Things J. 2021, 9, 2327–4662. [Google Scholar] [CrossRef]
  26. Luo, C.; Chen, X.; Song, S.; Zhang, S.; Liu, Z. Federated ensemble algorithm based on deep neural network. J. Appl. Sci. 2022, 1, 1–18. [Google Scholar]
  27. Chandiramani, K.; Garg, D.; Maheswari, N. Performance Analysis of Distributed and Federated Learning Models on Private Data—ScienceDirect. Procedia Comput. Sci. 2019, 165, 349–355. [Google Scholar] [CrossRef]
  28. Yang, Y.R.; Song, R.J.; Guo-Qiang, H.U. Intrusion detection based on CNN-ELM. Comput. Eng. Des. 2019, 40, 3382–3387. [Google Scholar]
  29. Alferaidi, A.; Yadav, K.; Alharbi, Y.; Razmjooy, N.; Viriyasitavat, W.; Gulati, K.; Gulati, K.; Kautish, S.; Dhiman, G. Distributed Deep CNN-LSTM Model for Intrusion Detection Method in IoT-Based Vehicles. Math. Probl. Eng. 2022, 2022, 3424819. [Google Scholar] [CrossRef]
  30. Bengio, Y. Learning long-term dependencies with gradient descent is difficult. IEEE Trans. Neural. Netw. 2002, 5, 157–166. [Google Scholar] [CrossRef] [PubMed]
  31. Hao, Y.; Sheng, Y.; Wang, J. Variant Gated Recurrent Units With Encoders to Preprocess Packets for Payload-Aware Intrusion Detection. IEEE Access 2019, 7, 49985–49998. [Google Scholar] [CrossRef]
  32. Geng, D.Q.; He, H.W.; Lan, X.C.; Liu, C. Bearing fault diagnosis based on improved federated learning algorithm. Computing 2021, 104, 1–19. [Google Scholar] [CrossRef]
  33. Ren, J.; He, Y.; Wen, D.; Yu, G.; Huang, K.; Guo, D. Scheduling for Cellular Federated Edge Learning with Importance and Channel Awareness. IEEE Trans. Wirel. Commun. 2020, 19, 7690–7703. [Google Scholar] [CrossRef]
  34. Kang, J.W.; Xiong, Z.H.; Niyato, D.; Xie, S.; Zhang, J. Incentive mechanism for reliable federated learning: A joint optimization approach to combining reputation and contract theory. IEEE Internet Things J. 2019, 6, 10700–10714. [Google Scholar] [CrossRef]
  35. Liu, Y.; Kang, Y.; Li, L.; Zhang, X.; Cheng, Y.; Chen, T.; Hong, M.; Yang, Q. Communication Efficient Vertical Federated Learning Framework. Comput. Sci. 2019. [Google Scholar]
Figure 1. Topology of smart-grid-distributed intrusion detection model.
Electronics 12 01164 g001
Figure 2. Horizontal FL process framework.
Electronics 12 01164 g002
Figure 3. CNN–GRU multi-classification prediction model and its training process.
Electronics 12 01164 g003
Figure 4. Gated circulation unit structure.
Electronics 12 01164 g004
Figure 5. Flow chart of node selection mechanism based on trust.
Electronics 12 01164 g005
Figure 6. Effect comparison of node selection strategy.
Electronics 12 01164 g006
Table 1. NSL-KDD data distribution.
Attack TypeTraining Set DistributionTest Set Distribution
Normal125,9739652
Dos45,7297845
Probe15,6612718
R2L9722699
U2R52200
Total188,38723,114
Table 2. Comparison of intrusion detection effects of CNN–GRU centralized model.
AccuracyPrecisionRecallF1 Value
Decision tree0.75340.96210.60670.7330
Logistic regression0.73740.92610.58540.7174
Naive bayes0.58800.59220.88750.7104
Random forest0.75140.97400.57870.7260
CNN–GRU centralized model0.79790.97260.64550.7860
Table 3. Upper and lower limits of aggregation nodes in each round.
Upper LimitLower Limit
Strategy13015
Strategy 22010
Strategy 3105
Table 4. FL intrusion detection effect.
AccuracyPrecisionRecallF1 Value
Node 10.76150.96500.60300.7422
Node 20.74360.96780.56850.7163
Node 30.74420.96210.57330.7185
Node 40.75030.96950.57960.7255
Node 50.75400.97370.58360.7298
Proposed method0.78790.97330.64150.7690
CNN–GRU centralized model0.79790.97260.64550.7860
Table 5. FL (R2L) attack classification effect.
AccuracyPrecisionRecallF1 Value
Node 10.87890.81080.01090.0004
Node 20.88360.84660.05810.0015
Node 30000
Node 40.87810.69230.00330.0002
Node 50000
Proposed method0.88340.96990.10680.0010
CNN–GRU centralized model0.89190.96200.15500.0012
Table 6. Intrusion detection time.
Accuracy
Decision tree0.1617
Logistic regression0.2152
Naïve Bayes0.2098
Random forest0.2163
CNN–GRU centralized model0.2681
Proposed method0.2359
Disclaimer/Publisher’s Note: The statements, opinions and data contained in all publications are solely those of the individual author(s) and contributor(s) and not of MDPI and/or the editor(s). MDPI and/or the editor(s) disclaim responsibility for any injury to people or property resulting from any ideas, methods, instructions or products referred to in the content.

