Abstract
In this paper, a novel Monogenic Sobel Directional Pattern (MSDP) using fractional order masks is proposed for extracting features. The MSDP uses fractional-order Sobel masks to identify thin edges along with color and texture-based information thereby increasing performance. Other edge-detection methods can identify only thick edges. There are three modules namely feature extraction, dimension reduction via a novel discriminant analysis method, and classification using a Convolutional Neural Network (CNN). The proposed MSDP is insensitive to the rotation and scaling changes existing in the images. The Bat Algorithm-based Optimization (BAO) is used for the selection of the best parameters of MSDP. The best value is modified by the Pearson Mutation (PM) operator in an effort to aid the algorithm in avoiding local optima and achieving a balance between global and local searches. The proposed work uses CNN for classification and achieves higher classification accuracy for six datasets.
1. Introduction
Facial expression recognition has its scope in many applications of human–computer interaction. Human–computer interaction and computer vision are vital in social networking sites. In human–computer interaction, a better understanding of human emotions is necessary for a natural interaction between humans and machines. There are different methods of recognizing emotions. In different applications in our day-to-day life, an emotion recognition process is needed [1,2]. A wide range of study fields, including the detection of human social/physiological interactions and the diagnosis of mental illnesses, can benefit from the use of Facial Expression Recognition (FER). FER has a wide range of uses. Applications are found in a variety of sectors, including law, marketing, e-learning, monitoring, and medicine. Facial images are the best method of recognizing emotions. In the facial images, the intensity of the pattern varies as per the emotions expressed. When the quality of the image is not good, it affects classification accuracy. The degradation of the image happens because of the blur, turbulence in the atmosphere, and focusing issues. Therefore, a better feature-extraction technique that is insensitive to these variations in quality is very much needed for the better recognition of emotions. While capturing the images, the scaling and alignment of the image are also vulnerable to transformation. So, when extracting the features, feature vectors gathered should be insensitive to these scaling and orientation changes. There are many feature-extraction techniques in the literature [3,4,5,6]. However, they are not entirely compatible with the process of emotion recognition as, some of them such as Local Binary Pattern (LBP), Opposite Color Local Binary Patterns (OCLBP), Local Configuration Patterns (LCP), Four Patch Local Binary Pattern (FPLBP), and Multi-scale Local Ternary Pattern (MLTP) are blur-sensitive [4]. The Short-Term Fourier Transform (STFT)-based feature extraction technique [5] is insensitive to blur, but it is scale-variant and rotation-variant. The phases computed using low-frequency coefficients are not sensitive to the blur and also have other image capturing issues [6]. In addition, edge detection methods when united with the texture extraction methods help combine the texture information along with the edge information of the images [3]. Then, when massive preprocessing techniques are used, the method is less efficient and more time-consuming. Instead, the features obtained from the facial image can be improved to achieve a good classification accuracy, because degradation of the facial images will happen even after using the best quality image-capturing methods. This paper proposes a novel and more accurate method of emotion recognition. The key contributions of the proposed technique are as follows:
- A novel feature-extraction technique based on fractional Sobel edge detection is proposed as MSDP that is rotation, scale, and blur-resistant;
- A novel Pearson Mutation (PM) operator-based Bat algorithm-based optimization (BAO) is used for obtaining best parameters of MSDP;
- A novel Pearson Kernel-based Supervised Principal Component Analysis (PKSPCA) for dimension reduction is proposed for reducing the dimension of features.
This novel algorithm improves the classification accuracy while identifying the facial images. Texture and sharp edge information are obtained and a feature vector is formed. The random noise that is included in images during image acquisition is removed. The images from six different datasets are used for the experimental analysis. This proposed technique achieves the highest accuracy compared to all other prevailing methods.
2. Related Works
As seen in the various works available in the literature, thick edges were attained when operators through derivative of first-orders [6,7] are applied to facial images. The second-order derivative-based operators resulted in better edge detection but lost some of the important information in facial images. The second-order derivative-based operators can find the edge-based details in the facial images [7]. The drawback is that these types of extraction methods are noise-sensitive. Fractional-order derivative masks are projected in this proposed work to identify the edges and eliminate the noise included in the images while capturing the facial images. The fractional-order derivative masks when used in edge detection aid in regulating certain features present in the image by leveling precise components using frequency in the facial image. These fractional-order edge detection masks are used in several other research works in the literature [7] but not previously applied for facial emotion recognition. The blend of edge detection using fractional-order methods and a classifier was used in an existing work for fingerprint identification. The restrictions of the integral order were overcome by using a fractional order-based edge detection technique. This fractional order-based mask for detecting the edges was projected to attain stronger ridge and valley edges in the fingerprint pictures. The working mask was used in both directions. A fractional-based differential technique was proposed for Palm Print prediction. The fractional order-based masks have greater abilities than the integer order-based ones in improving the texture information of digital pictures [8].
In an existing work for astral image investigation in the literature, the fractional method was functional on an image using RGB banks and the composite textural data of the creative bank image was stronger after using the fractional method. A processing tool was created to improve the quality of astronomical images [9]. It was determined that using the fractional-order masks aided in finding dim objects and galaxy-like structures with improved superficial details. A mixture of dual fractional-order derivatives is utilized for smoothing various regions and removing noise. The methods for detecting the edges based on fractional-order methods were better in handling redundant structures and textures in an image and reducing noise. Models can be projected for identifying thin edges along with some texture information, thereby minimizing the time complexity [3,4,5,6]. When various kinds of textured images were included for validation, good performance with an accuracy above 90% was attained. Many fractional masks were obtained and practiced for noise removal in images in the literature. These masks depend on the integration methods using fractional techniques. The GL scheme termed (GL-ABC), the Toufik–Atangana scheme (TA-ABC), and the fractional Euler technique (Eu-ABC) [10] are the integration methods already used in the literature. The method created a square and then practiced on all the regions of a noisy image. The results presented a state that these masks are effective, and are well-suited with smoothing filters. A fractional edge detection-based convolution mask was created on the Riemann–Liouville fractional derivative that is a distinct form of the Srivastava–Owa operator. This resulting mask trapped both intensity discontinuities, and traced the Dirac edges [11]. However, these highly effective masks are not yet applied in facial expression recognition.
In the medical images, the fractional order-based Sobel operators have been used in the literature. There are several other feature-extraction techniques already existing in the literature for facial expression recognition which have some drawbacks. The Rotational Invariant-Local Phase Quantization (RI-LPQ) techniques [12] proposed in the literature were rotational invariant and achieved a high accuracy in recognizing human emotions. RI-LPQ is more sensitive to the changes in the scale of the images. The methods in the literature [1,2,3,4,5] are sensitive to the variations in scale and to rotations which result in poor classification accuracy. The drawback of RI-LPQ is the greater time complexity as 36 angles and a window size of 13 are used. This paper proposes a novel algorithm, based on the fractional-order Sobel edge detection masks. These masks were able to sense the minute details on even images with a lower contrast and high noise. This proposed algorithm extracts the features based on high-frequency components. Already, the Sobel mask-based features [10] are used in a variety of applications in the literature such as detecting Alzheimer’s, mammogram images, palm print images, Magnetic Resonance Imaging (MRI) images, etc. The fractional-order Sobel edge detection masks are not yet applied for facial emotion recognition [8,9,10,11].
Changes in lighting, position variations, occlusion, ageing, and poor resolutions are a few of the challenges that affect the performance of a facial recognition system. The suggested method uses MSDP to address these issues. Despite lighting, age, position fluctuations, and poor resolution, the fractional order-based Sobel masks aid in obtaining the precise shape and texture information that improves the performance. The proposed method identifies even the subtlest expressions. The proposed Monogenic Sobel Directional Pattern (MSDP) uses fractional order-based Sobel masks [7] for deriving the directional edges. Four responses are obtained for each pixel. Only the higher frequency components are taken for the calculation of the edges. This method produces sharp edges. Difference of Gaussian (DOG) filtering helps to remove the random noise in the code image obtained from the original image. Finally, the resultant code image is divided into grids and a histogram is obtained that is specified as input to the machine learning algorithm for predicting the emotions. The proposed MSDP achieves a high classification accuracy of above 95% and has very low time complexity. The proposed MSDP enhances the image and eliminates the noise present in the images by using Difference of Gaussian filters. The features obtained are also scale-invariant and rotation-invariant which makes it superior to other existing feature-extraction techniques.
There are different classifiers in the literature. The Hidden Markov Models (HMM) are too slow and contain too many iterations. Support Vector Machine (SVM) is slow in computation [13,14,15,16]. Convolutional Neural Networks (CNN) [13] require bigger training data. The classification algorithm should be both fast and have a high performance in real-time environments. Extreme Learning Machine (ELM) [14,15] is faster and has trivial constraints applied for optimization. It also results in better accuracy. Each and every layer of DBN is trained extensively in deep learning techniques. DBN and RBM execute perfectly in real-life situations. The proposed work uses CNN with LeNet architecture [2] that achieves the best performance compared to the other existing classifiers [15]. A type of deep learning technique called deep belief networks (DBNs) aims to solve the issues with conventional neural networks. They accomplish this by exploiting the network’s layers of stochastic latent variables. The RBM is the name of the neural network that makes up the energy-based model. It is a probabilistic, generative, unsupervised deep-learning algorithm. The objective of RBM is to find the joint probability distribution that maximizes the log-likelihood function. LeNet [2] is little and easy to understand, yet it is also huge enough to provide interesting results. LeNet + dataset may also run on the CPU, making it simple for beginners to start utilizing Convolutional Neural Networks and Deep Learning.
3. Methodology of the Proposed Work
The whole proposed system is represented in Figure 1. The images are captured using a camera and the images are preprocessed using the “Chehra” face detection algorithm. The Chehra face detector detects the face from the images eliminating the background. Then, from the cropped facial images obtained using Chehra face detector, the features are extracted using MSDP.
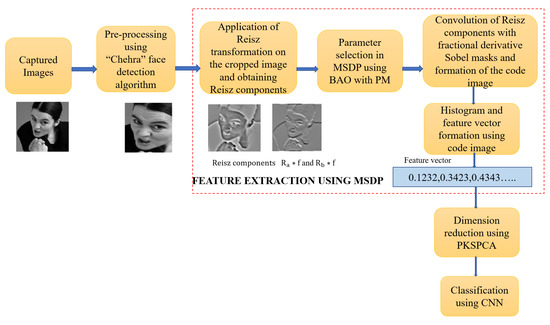
Figure 1.
The proposed system.
Figure 2 provides an explanation of the MSDP. The Riesz-order transformations are used on the facial images that have been cropped. The scale-invariant characteristics can be found using the Riesz components. The Riesz components are convoluted with the derivatives of fractional-order Sobel masks. The parameters of the Riesz transformation and fractional-derivative Sobel masks [7,8,10,11,17] in MSDP are obtained using the Bat Algorithm-based optimization (BAO). In the Bat optimization algorithm [18], the novel Pearson Mutation operator is suggested as in Section 3.3. Finally, using the optimized parameters, the Riesz-order transformations are applied on the cropped image given as input. After the transformation, the Riesz components are obtained. Then, the convolution of the Riesz components with the fractional derivative Sobel masks is performed.
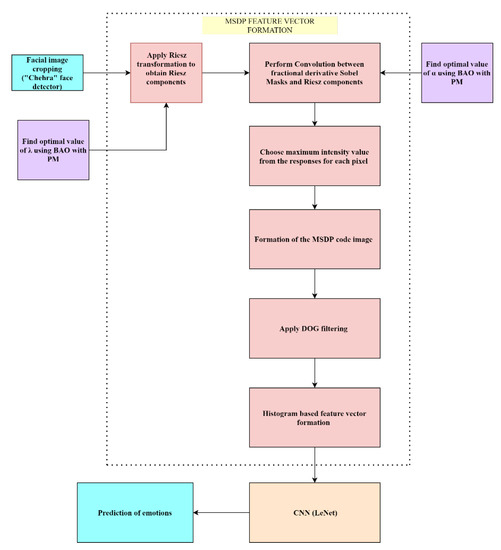
Figure 2.
MSDP feature vector formation and classification.
After convolution, four different values are obtained as responses for every pixel. The maximum pixel intensity value among the four values is considered for every pixel in MSDP. Then, using all the maximum pixel intensity values for that image, a MSDP code image is formed which is filtered using DOG. The code image has the needed textural and structural information for the accurate classification of the facial expressions. The grids are formed on the code image and the histograms are obtained from every grid. All the histograms are aggregated together to create the feature vector as mentioned in Figure 1. These feature vectors are reduced in dimension using proposed PKSPCA. The Kernel-based Principal Component Analysis (KPCA) helps in reducing the dimension of the features. However, certain kernels already in the literature such as Radial Basis Function Kernel, Polynomial kernel, etc., [2] may be suitable for one dataset which are not suitable for the other. So, in this proposed work, a Pearson General Kernel is proposed in PKSPCA that helps in performing the functions of various prevailing kernels just by varying two parameters. Then, the features of reduced dimension using PKSPCA are classified using CNN into seven categories of emotions. The Bat algorithm-based optimization using Pearson mutation operator helps in faster convergence. The reduced feature size using PKSPCA and the choosing of optimal parameters using BAO-PM in MSDP helps in achieving the best accuracy in a smaller amount of time.
3.1. Face Detection Using Chehra
The images collected through the datasets were fed to the ‘Chehra’ [19] (https://sites.google.com/site/chehrahome/home) face-detection tool in the proposed work using novel MSDP features (accessed on 21 October 2017). In ‘Chehra’, each regression function is self-regulating and it accurately distinguishes the faces, even in unrestrained conditions. The landmarks present in the faces support the construction of a boundary box. The cropping of the face depends on the boundary box. These cropped facial images are given as input to MSDP for the extraction of the features.
3.2. Proposed Feature Descriptor MSDP
This proposed MSDP preprocesses the captured images using the ‘Chehra’ face-detection algorithm and then the Riesz transformation is applied. The fractional derivative Sobel masks are convoluted with the Riesz components obtained. Bat algorithm-based optimization (BAO) [20] with PM is used for choosing the parameters. The maximum intensity value among the four responses is attained for each pixel and a code image is created. The code image is filtered for noise using the Difference of Gaussian (DOG) filtering technique and then the resulting code image is divided into smaller grids and the histogram is computed for every grid. The number of grids is determined depending upon the length of feature vector needed. The 120 × 120 pixel code pictures are produced by the MSDP. Then, bin size 10 is employed to create the histograms while employing grids with a size of 24 by 24. Finally, the feature vector is computed for every grid using the histogram information, concatenated, and then the final feature vector is obtained which is then given for discriminant analysis using PKSPCA, that reduces the dimension. The obtained features are classified using CNN and the emotions are predicted as in Figure 2.
A multi-scale feature descriptor with rotation invariance and a smaller number of computations is projected in this suggested work as MSDP to attain an enhanced performance equating to the prevailing feature descriptors. The Riesz transformation is applied to the image and the patterns are obtained from the facial image. This proposed method of feature extraction results in a vigorous performance. The monogenic depiction of the image includes information regarding magnitude, phase, and orientation [1].
A two-dimensional depiction of the Riesz transformation is represented in Equation (1):
The convolution of the facial image and the Riesz transformation is specified with the monogenic illustration as in Equation (2). The monogenic signal is the result of f and its Riesz transform for an image f(x):
Before the application of the Riesz transformations, the filter for Laplacian of Poisson is applied on the image for enabling band-pass filter as in Equation (3):
where is known as the frequency. The band-pass filtering helps to obtain the finer details. The frequency which is known as is changed to diverse scales {3.5, 7, 14, 28, 56} and applied in the images for representing the images in a multi-scale depiction. The multi-scale depiction helps in creating a complete description of the image. This multi-scale depiction consumes huge time and has high computational complexity. To eradicate this drawback, the suggested MSDP utilizes only the and from Equation (2). The information of and are more discriminatory than the sub-component In the additional computations, and are utilized for obtaining images that are not affected by blur and rotation. In this method, the value of ranges up to three scales. Figure 2 depicts the complete process. After gaining the components for various number of scales in , the Sobel masks (SMs) are applied.
The novel feature extraction technique MSDP proposed in this work extracts multi-scale features with small computational complexity compared to the other algorithms in the literature. MSDP is unresponsive to blur and has low-dimensional and discriminative features that are created on micro-patterns. The edges detected using fractional derivative SMs are grouped under two types: masks using first-order derivation and masks of second-order derivation. The thin edges are examined by sensing the peaks by means of first-order derivation-based Prewitt or Sobel or Roberts operators, or by identifying the zero crossings with second-order derivation-based Laplacian operators. Thus, in this proposed work the adapted fractional derivative SMs are convoluted with the components of the original image to find the thinner edges. The SMs are shown in Figure 3 below.
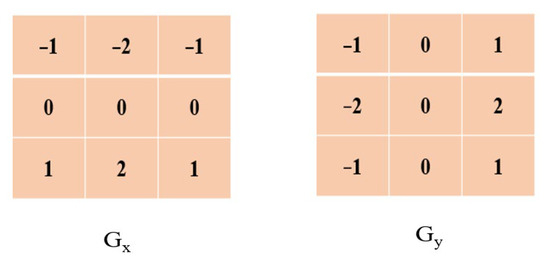
Figure 3.
Sobel Mask.
The edge detection results obtained while using the conventional Kirsch, Sobel, and Prewitt edge operators are shown below in Figure 4. In the proposed work, Sobel operators are used for the detection of the edges. In this proposed work, novel fractional derivative SMs are applied for the effective extraction of thin edges from the facial images and filtering of noise included in images.
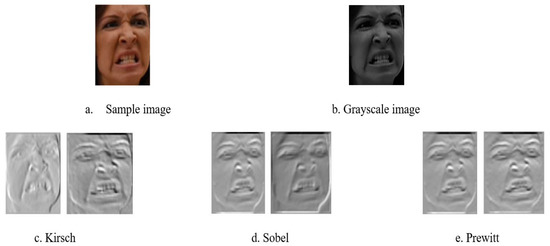
Figure 4.
Edge detection obtained using various operators.
The fractional derivative SMs are derived as follows. The traditional integer-order SM has gradient components in both the x and y axes. The illustration of the Gx and Gy components of the original Sobel filter can be adapted to create the adapted Sobel representation as shown in Figure 5. The gradient-based components of the integer-order Sobel operator are in both the x- and y-axis. The differential form of the components is represented in Equations (4) and (5):
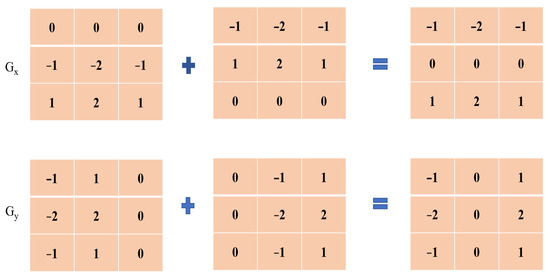
Figure 5.
The adapted Sobel representation.
The Gx and Gy components present in the real Sobel filter are updated. The adapted Sobel filter is converted to the fractional-order domain, with the differential form obtained from the gradient operator in Equations (4) and (5). GL fractional-order differential operator attains four novel masks, namely the two left fractional-SMs and two right fractional masks as shown in Figure 6 and Figure 7. These masks are applied on the Riesz components and . The function f is on a finite or infinite interval (a1, b1) and t ∈ (a1, b1).
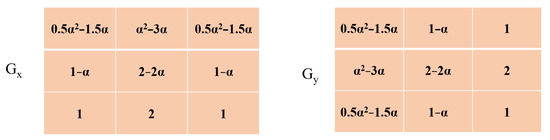
Figure 6.
Left-side-oriented fractional-order masks using Sobel.
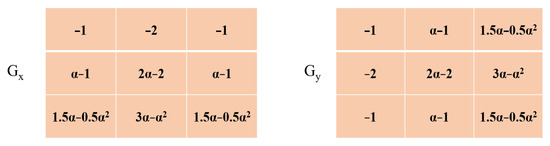
Figure 7.
Right-side-oriented fractional-order masks using Sobel.
Left GL derivative is represented in Equation (6):
To obtain a symmetric filter GL operator is applied on the updated Sobel filter. The right GL derivatives are represented in Equation (7):
The above differential operator does not need to only be constrained to integers. For example, the (1 + j)th derivative of the (1 − j)th derivative yields the 2nd derivative. The parameter is used to define the limit. In analysis, limits are used to convert approximations into accurate values. For example, the area inside a curved region is defined to be the limit of approximations by rectangles. Limits are the mechanism by which the derivative, or rate of change, of a function, is computed.
These proposed fractional derivative SMs, when applied to the Riesz components of the facial images help in the extraction of the thin edges rather than the thick edges extracted using the integer-order SMs. This helps in extracting even the subtle facial expressions. The use of the Riesz components helps in the extraction of scale-invariant and rotation-invariant features. The DOG filtering helps in the removal of noise in code image. The final feature vectors are having scale-invariant, rotation-invariant, and noise-eliminated information that leads to high classification accuracy.
Creation of Multiscale, Noise Insensitive, Rotation Invariant Edge, and Texture Features as MSDP
These four masks are applied on the component images. As the value α of the fractional mask varies, the convoluted output differs. The fractional-order SMs are more sensitive to variations in edge than the normal SMs. These fractional-order masks, as shown in Figure 6 and Figure 7, help to capture more details regarding the texture also resulting in high classification accuracy of the human emotions. The values of α ranges from 0.1 to 1 and ranges from 1 to 56 (λ = {3.5, 7, 14, 28, 56}). The value of α = 1 results in a conventional SM. The experiment is completed with various values and the classifications are completed with a K-Nearest Neighbor (KNN) classifier on the Japanese Female Facial Expression (JAFFE)dataset images for choosing the optimum value for α. The cropped facial images obtained using ‘Chehra’ are subjected to Riesz transformations. Each Riesz transformation has 3 scales as per BAO. The Riesz transform component images are convoluted with the four left and right fractional-order SMs. The fractional derivative SMs proposed in this paper with the optimum value of α are convolved with facial image. Since four responses are obtained for each pixel, the maximum response value is selected. The responses are { The formula for selecting the Maximum value among the Responses (MV) is mentioned in Equation (8):
Here, mentions the response at the pixel position . Then, the DOG filter is convoluted with the maximum response image as:
where is the standard deviation that is higher than . The degree of blurring is governed by the Gaussian function’s standard deviation. A modest standard deviation (i.e., 0.5) blurs less, whereas a big standard deviation (i.e., >2) blurs greatly. In some situations, a rank filter (median) could be more beneficial if the goal is to achieve noise reduction:
The DOG filter convoluted with the code image obtained using maximum responses eradicates the random noise and aids in creating sharp edge information that advances the classification accuracy. The sharp edge information helps to effectively capture the structural information of the face. In MSDP, both the textural and shape information are taken into account and this captures even the subtle expressions. The histogram is calculated from the grids created over the code image. Thus, for each sample in the dataset, one code image using four fractional order masks is obtained for each Riesz component. Two Riesz components are used in MSDP. When there are 3 scales for each Riesz component, 3 × 2 = 6 code images are obtained. The output varies based on the values of α and as in Figure 8. The best combination of values that results in higher accuracy are chosen using the BAO algorithm.
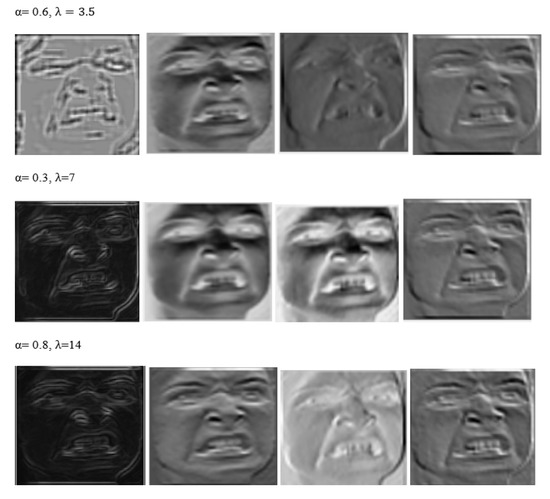
Figure 8.
Outputs using two left-sided and two right-sided fractional order SMs and different values of α, λ.
3.3. Bat Algorithm-Based Optimization of Parameters with Pearson Mutation
The Bat algorithm-based optimization is a bio-inspired algorithm [20,21]. The original Bat algorithm has a random huge step-length issue that results in less-than-ideal answers in the search space and thus is unable to address higher dimensional issues. This research concentrates on leveraging the Pearson distribution, which provides lower step lengths throughout the step-by-step process, to solve higher dimensional problems and minimize the step length size. The output produced by the MSDP algorithm differs based on the values of α and as shown in Figure 8. The parameters of the Riesz transformations and the fractional derivative-based Sobel operator are obtained as optimized parameters in this proposed approach using Bat algorithm-based optimization with Pearson Mutation. It discovers the best number of scales for frequency and the value of α. This optimization algorithm is functional on the training set images. The training set is divided into two individual folds. Here, the accuracy is considered by using one-fold as the training set. The optimal parameters are obtained by applying different parameters and testing the accuracy on the testing set. The total number of scales and the range of α are initialized. The fitness function used while applying the Bat algorithm-based optimization is calculated as the accuracy obtained using CNN. If the accuracy obtained is the best using some parameters, then that value of and α is assigned as the new and new α. The algorithm used for finding the optimized parameters is shown in Algorithm 1. In contrast to other values, the best value is the leader during the search process, and it requires the mutation operator to advance. Consequently, PM is implemented to increase population diversity in BAO. The new value is created via a Pearson perturbation using the optimal position as the base, according to the PM operator. The local optimum may also include some significant information, thus only one dimension is selected for mutation. The general form of the Pearson VII function is given in Equation (11):
P is the peak height at , the center in Equation (11) [21], and v is a self-regulating parameter value. Here, the tailing factor and peak width are denoted by and , respectively. From Gaussian to Lorentzian, the shapes of different functions can be created by adjusting the parameters and . Therefore, there is a fine tuning of the values when this Pearson mutation-based coefficient is used for updating the values of parameters and this results in finding the optimum values with faster convergence. Here, the two vectors and their distance-calculating formula take the place of v. Then, P is changed to represent 1 and is removed. By adjusting its characteristics, the Pearson VII function can be used in place of any other function. Therefore, the Pearson VII function can be employed in place of any other function:
where Pij indicates the jth position of the ith parameter value. N is the population size. Wj is the weight calculated. The updated new jth position vector of the parameter value is calculated as:
This Equation (13) is applied for updating the parameter values of α and .
| Algorithm 1 Bat algorithm-based optimization of parameters with Pearson Mutation. |
| Procedure BAO_PM (α, λ) Input: A range of values for α and λ of MSDP Output: Optimized values of α and λ Parameters: α—Set of values of α λ—Set of values of frequencies new_α—Optimized value for α of MSDP new_λ—Optimized value for λ αi—ith value of α λj—jth value of λ CNN acc—Accuracy obtained with CNN using αi and λj CNN acc is considered as the fitness parameter and objective function of this algorithm |
| 1. Set the values of α and λ; |
| 2. Evaluate the preliminary population; |
| 3. While the finish condition is not attained; |
| 4. Create new solutions by altering αi and λj; |
| 5. |
| 6. ; |
| 7. ; |
| 8. Update αi and λj using Pearson Mutation; |
| 9. Obtain CNN acc; |
| 10. If CNN acc > best_accuracy; |
| 11. Set new_α = αi; |
| 12. Set new_λ = λj; |
| 13. Set best_accuracy = CNN acc; |
| 14. Rank the best_accuracy as globally best accuracy; |
| 15. Update αi and λj; |
| 16. End; |
| 17. End While; |
| 18. Store new_α and new_λ; |
| 19. Assign the values of α and λ as new_α and new_λ; |
| 20. Return new optimized values of α and λ; |
| 21. End Procedure. |
3.4. Feature Vector Construction from the Histogram of Grids
M grids are formed on the code images. Each grid is considered as . The size of each grid is the optimum size for creating a better feature vector that has a low dimension and all information about the micro-patterns. For each grid , the histogram is normalized before forming the feature vector. Thus, the feature vector of all the grids is grouped to form the final Monogenic Sobel Directional Feature Vector as in Equation (14):
where denotes the count of overall equal-sized grids formed in the final transformed code image. This process results in features with a compact length. The resultant feature vector is invariant to scaling, translation, and rotation. The fractional-order SMs help in identifying sharp edges, where the DOG filter aids in removing the random noise present in the images. Thus, this MSDP helps in identifying even the micro-patterns as the feature vector is formed by using the histograms of grids in code images as shown in Figure 9.
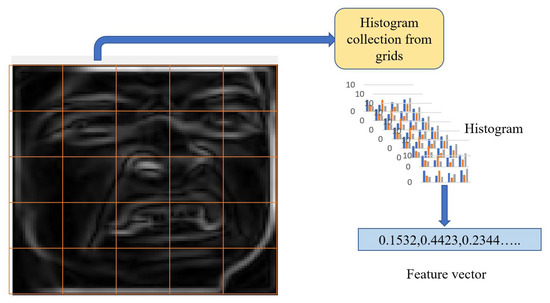
Figure 9.
Code image from MSDP after application of DOG filter.
3.5. The Proposed Pearson Kernel-Based Supervised Principal Component Analysis (PKSPCA)
The different grouping of the features is found and this leads to very large feature sets. These feature sets have repetitive features, which lead to poor performance. Therefore, compact feature vectors are represented using PKSPCA and this eradicates both noisy and repetitive features which results in the best performance. The projected novel PKSPCA aids in dropping a substantial amount of time during calculation [22]. PKSPCA is an enhanced form of the Supervised Principal Component Analysis method. In the proposed procedure, novel Pearson Kernel is projected that helps in attaining a better performance than other kernels namely linear, polynomial, and Gaussian. PKSPCA is a supervised type of Principal Component Analysis. It computes the principal components having maximal confidence. The Herbert Schildt Independence Criterion (HSIC) is maximized. Here, is the attribute space and is the space for the response variable:
The empirical HSIC can be calculated by assuming that F and G are separable reproducing kernel Hilbert spaces (RKHS), which include all continuously bounded real-valued functions of X and Y, respectively:
where K and L are kernel matrices of F and G based on the kernel functions k() and l(), respectively, and Tr(•) signifies the trace of a square matrix.
H is known as the matrix for mean subtraction and where I is the identity matrix having order N and e represents a column vector with order N. The subspace is maximizing the dependency between and Y. The HSIC is a measurement of the dependency among X and Y and it is used to solve the problem of optimization by maximizing Tr(KHLH).
Here:
The optimization problem now becomes as and . In the PKSKPCA is replaces by Φ(X) and define U = Φ(X)α. Now the objective function becomes:
where and L are kernel matrices having order N computed using the proposed Pearson General Kernel. The Pearson function proposed is used as Pearson kernel which is a general kernel. This leads to the usage of the same Pearson Kernel for all the datasets, rather than testing other kernels in state-of-the-art. The proposed PKSPCA reduces the amount of time in selecting the kernels and the total computations:
The optimization problem is solved and the solution is which has M eigen vectors of ( according to the first M eigen values. The kernel matrices and L are computed by using a PGK with respect to X and Y, namely where k is the kernel function. After that, the answer to objective function can be analytically expressed to obtain F of order M N, or the newly created low-dimensional radio map. As a result, the PKSPCA-extracted low dimensional features, or F, from the samples can be expressed as follows:
PKSPCA projects data onto a higher dimensional feature space, where is the data are linearly separable, using a Pearson kernel function. The basic components of the principal subspace are the eigen vectors. The JAFFE dataset can be used for finding the optimal number of eigen vectors (d) and the optimal number of principal components (p). The number of principal components is varied for different values as and the experiments are repeated. The value of p that obtains the best accuracy is chosen as the optimal value of . For the JAFFE dataset, the optimal value of p is 35. Then, for p = 35 the experiments are repeated to find the optimal value of d, where d = {1, 2, …, 10}. The optimal value of d is 7, as explained in Appendix A. The feature vector of reduced dimensions is then given as input into a CNN for the classification of emotions.
3.6. Classification
The Fully Connected layer is a non-linear function in CNN [13]. The feature vectors are specified as input to CNN. The flattened output obtained is given to a feed-forward neural network and backpropagation is executed on each iteration of training. After several epochs, the model classifies the emotions using the Softmax technique. In a CNN, as convolution and pooling are executed in training, neurons of the hidden layers identify abstract depictions of the input thereby decreasing its dimensionality. This function is more advantageous than sigmoidal functions thereby reducing the amount of computation required in classification [12]. Rectified linear activation unit (ReLU) involves a comparison among the input and the value 0. Pooling layers reduce the length of the feature maps. Thus, it minimizes the total number of parameters and the number of computations. The pooling layer produces a summarized version of the features in the feature map. The SoftMax function is the activation function present in the output layer of CNN to perform prediction. Hyperparameters of CNN are the kernel size, total number of kernels, stride length, and the size of pooling which affects the CNN performance and speed. LeNet architecture is used in the proposed approach for the prediction of emotions as shown in Figure 10.
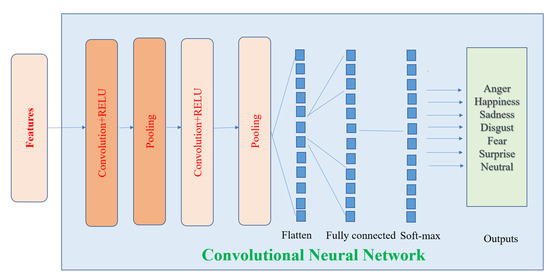
Figure 10.
Classification using Convolutional Neural Network (LeNet).
4. The Analysis and Validation of Results Obtained Using the Proposed Method
The suggested approach with MSDP and BAO with PM uses MATLAB 2018a for its experimental analysis.
4.1. Datasets
Six datasets, namely JAFFE, Cohn Kanade (CK+), Multimedia Understanding Group (MUG), Static Facial Expressions in the Wild (SFEW), Oulu-CASIA NIR&VIS facial expression database (OULU-CASIA), and Man Machine Interface (MMI), [23,24,25,26,27,28,29,30,31,32] were used for the experiments.
In the JAFFE dataset, there are 213 facial expression images extracted from 10 persons. The sizes of the images are 256 × 256. The images are labeled in the dataset. The pictures are assembled under seven emotion groups namely anger, happiness, fear, disgust, sadness, surprise, and neutral.
In the CK+ dataset, two versions of the datasets are available namely, CK and CK+. The facial images of CK+ are more expressive than CK. The sizes of the facial expression images are 640 × 490. There are 593 sequences of images available in CK+. The images are extracted from 123 persons. In the experiments, only the images with the best facial expressions were used. In each series, the neutral emotion is represented first. A total of 1281 images were used in the experiments.
In the MUG dataset, there are image sequences in which the neutral emotion image is the first image of the sample sequence. There are 60 images in each and every sequence. The facial expression images are represented using 896 × 896 pixels. In each sequence, there are 1462 number of images gathered from 86 subjects. In each category, 81 pictures were used in the experimental analysis. The pictures are gathered under different environmental situations. These images are captured under an unconstrained setting at a resolution of 720 × 576. From this dataset, 958 images were chosen for training and 436 images were chosen for testing. Two-fold cross-validation was used in the experiments and subject-independent testing was performed.
In SFEW, the images are taken under unconstrained conditions. The size of each facial image is 720 × 576. There were 958 images in training and 436 images in testing. Subject-independent tests were performed. The images that were generated in highly controlled lab environments are images captured under constrained environments. The images taken under unconstrained situations have natural head movements, varied illumination, age, gender, and occlusion.
In the Oulu-CASIA (Oulu, the Machine Vision Group, Chinese Academy of Science and Institute of Automation) the images are captured from 80 persons. Among the 480 sequences, five to six best images were chosen for the experiments. Under each class, 500 images were chosen. There are 312 series of images captured from 30 persons. Among the sequence of images, three to four images of superior expressions were designated. The last image in the sequence expressed a neutral emotion. The experiments that were conducted were subject-independent.
4.2. Experimental Analysis
In the state-of-the-art descriptors, Gabor, Monogenic Directional Pattern (MDP) [3], and Multiscale and Rotation invariant Phase Pattern (MRIPP) [5] have good classification accuracy but the high computational complexity is a major drawback. All the other feature descriptors in the literature have comparatively smaller accuracy, especially under unconstrained situations. The SFEW dataset is very challenging as it is captured under unconstrained situations.
With improved resolutions, there is a rise in accuracy for JAFFE images as shown in Table 1. The dimensions are also improved, but it is suggestively smaller than the other MDP and multi-scales Gabor descriptors. Additionally, MSDP consumes little computational complexity. Table 2, Table 3, Table 4, Table 5, Table 6 and Table 7 show the performance of the proposed method by indicating the number of samples accurately classified and also the number of samples misclassified. During the classification of the images from the JAFFE dataset using the proposed approach, the neutral and sad expressions created confusion while predicting other images as seen in the confusion matrix in Table 2. In the case of the CK+, dataset anger and neutral emotions have comparatively lesser classification accuracy as shown in Table 3. In the MUG dataset, the expressions such as disgust, happiness, and surprise are confused among other emotions as shown in Table 4. In the SFEW dataset, the main challenge is that the images are captured under unconstrained conditions and there is misbalancing among the samples of different classes. So, larger training data are needed to improve the accuracy as shown in Table 5. The proposed MSDP attains better accuracy for SFEW than the other existing descriptors because of its ability to detect the sharp edges and because of its scale-invariant and rotation-invariant properties. The SFEW dataset achieves lower classification accuracy compared to the other existing datasets. However, SFEW achieves a higher accuracy using MSDP compared to the other existing descriptors in the literature, as shown in Table 5. The disgusted facial expression is mostly confused with other facial expressions. In the Oulu-CASIA dataset and MMI, fear and sadness facial expressions create confusion with the other facial expressions as seen in the confusion matrices presented in Table 6 and Table 7.

Table 1.
Classification accuracy variation at different resolutions of the JAFFE image.
Table 2.
Matrix representing the confusions in JAFFE dataset.
Table 3.
Matrix representing the confusions in CK+ dataset.
Table 4.
Matrix representing the confusions in MUG dataset.
Table 5.
Matrix representing the confusions in SFEW dataset.
Table 6.
Matrix representing the confusions in Oulu-CASIA dataset.
Table 7.
Matrix representing the confusions in MMI dataset.
When images of size 132 × 132 are used, the proposed method attains improved classification accuracy for all the images at a dimension of 1500 which is lower compared to the other conventional techniques in the literature. The MSDP achieves the best accuracy at a feature-length of 1500. Here, the MSDP code uses the images where the row size is 132 × 132. The MSDP creates the code images of size 120 × 120. Then, the histograms are formed using grids of sizes 24 × 24 and bin size 10 is used for the histogram formation. For one code image, the feature vector length is 250. Experiments are conducted on JAFFE as shown in Table 1 and the optimal grid sizes are selected. The optimum number of scales of Riesz transform obtained using the BAO algorithm is three. So, the number of Riesz components is six. Therefore, the total number of code images are six and the total length = 250 × 6 = 1500.
The conventional Gabor achieves good accuracy at a feature vector length of 46,240 [26,27,28,29,30,33]. SFEW comparatively achieves lower accuracy as the images are obtained under different environmental circumstances [33,34,35,36,37,38]. The prevailing techniques, such as Local Ternary Pattern (LTP), Local Phase Quantization (LPQ), and SIFT, are affected by illumination disparities. In total, 36 angles and 13 different sizes of the window are involved in the formation of the rotated LPQ filters in RI-LPQ which increases the complexity. (Scale Invariant Fourier Transform) SIFT and Histogram of Oriented Gradients (HOG) are very sensitive to the variations in scale and rotations. MSDP achieves a greater performance than the prevailing techniques [36,37,38,39,40]. The MSDP is using the gradient information while forming the code images and also calculates the histograms from the finer patterns while creating the features. Rather than Maximum Response-based Directional Texture Pattern (MRDTP) [3] and MRIPP, MSDP attains good accuracy as the Riesz transformation and prevents the sensitivity to scaling and rotation variations. The Difference of Gaussian (DOG) filter helps in removing the noise and thereby enhancing the accuracy as seen in Table 8.
Table 8.
Accuracy obtained by different feature descriptors.
While creating the features using convolution with filters, the number of convolutions determines the total complexity. This complexity is compared with the complexity of the other feature extraction techniques. The descriptors such as Histogram of Gabor Phase Patterns (HGPP) and Local Gabor Binary Pattern Histogram Sequence (LGBPHS) [38,39,40] use the Gabor filters for extracting the patterns from the images. These descriptors use nearly 40 and 80 convolutions per image. The Monogenic Directional Pattern uses three convolutions and Laplace of Poisson with three frequency scales, and eight convolutions with Kirsch mask. In MSDP there are four convolutions. The existing HGPP forms 90 maps of features per image. LGBPHS generates 40 maps for an image, and MDP creates 9 maps of features. MSDP creates one feature map. The MSDP has very low complexity and creates a feature vector of low dimension that achieves a very high accuracy for JAFFE as shown in Figure 11.
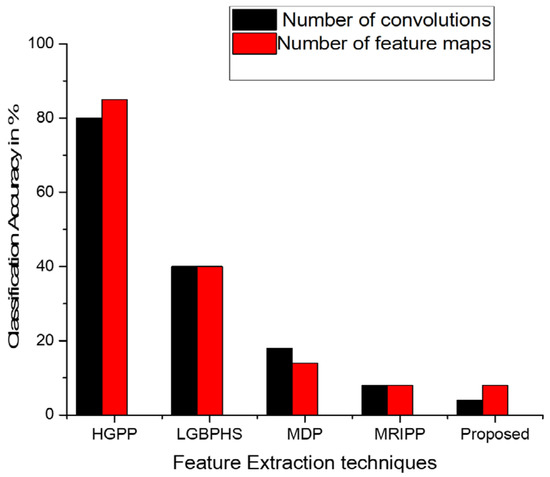
Figure 11.
Comparison of complexities with the other multiscale and rotation-invariant feature extraction methods.
The comparison reveals that the proposed Pearson Kernel-based Principal component analysis outperforms the existing approaches [41,42,43,44,45,46,47,48] in the literature as in Figure 12. OVO-SVM applies classifiers which are higher than the classifiers used in OVA-SVM. The entire problem is divided into smaller problems in OVO-SVM and therefore the total time needed for computation declines. The OVO-SVM classifier achieves higher accuracy for emotion prediction. In DNN architecture, 300 hidden nodes are used. DNN requires enormous training time. The proposed approach uses LeNet architecture that achieves comparatively higher accuracy. There are several methods such as RELM, AKELM, RAKELM, MVAKELM, and MVCAELM [1,5,14,15] based on Extreme Learning Machine that achieve a good performance in less amount of time. The proposed technique using LeNet architecture achieves the best performance as seen in Figure 13.
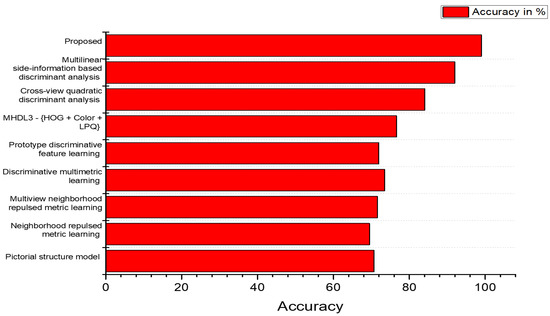
Figure 12.
Comparison of accuracies achieved by JAFFE for different discriminant analysis methods.
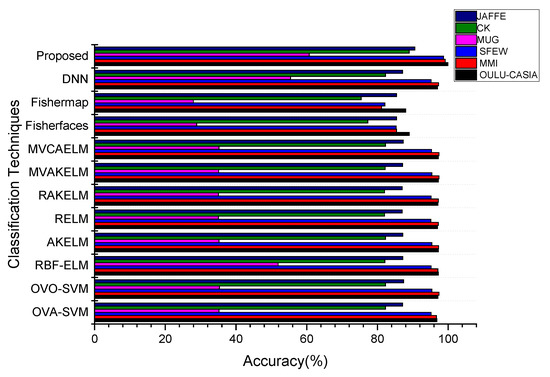
Figure 13.
Comparison of accuracies by different classifiers for different datasets.
The proposed BAO with PM operator is compared with other optimization algorithms while applying on JAFFE is shown in Figure 14 and Figure 15. The Bat Algorithm (BA) and the proposed BAO-PM are compared with Whale Optimization Algorithm (WOA), Gray Wolf Optimization (GWO), Particle Swarm Optimization (PSO), Genetic Algorithm (GA), Gravitational Search Algorithm (GSA), and Ant Bee Colony (ABC) algorithm [49]. The BAO-PM utilizes a lower amount of time when compared to the other algorithms as it uses random fly technique and Pearson mutation that results in faster convergence. The best individuals are periodically sent from each subprocess to the main process using a centralized migration strategy. The main process then chooses the best individual from the entire population to broadcast to the subprocess, forcing the subpopulation to carry out the best evolution. The optimized parameters thus obtained using BAO-PM result in higher accuracy.
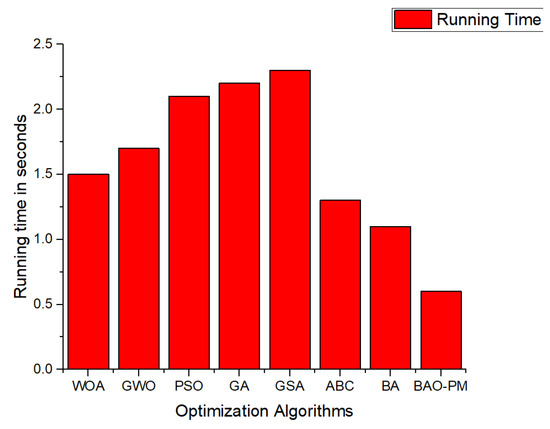
Figure 14.
Running time achieved by BAO with PM operator.
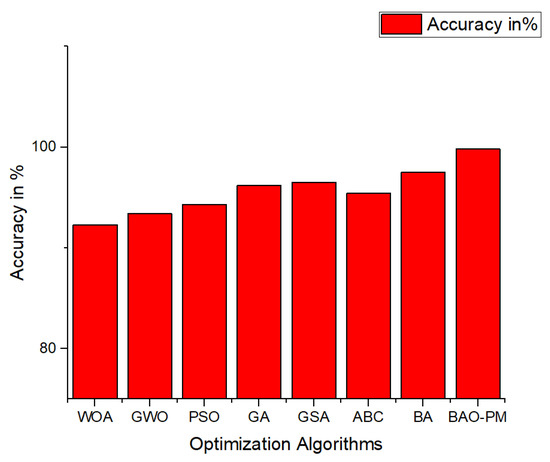
Figure 15.
Accuracy achieved by BAO with PM operator.
The comparison of results in Table 9 with the state-of-the-art methods [44,45,46,47,48,49,50,51,52,53,54,55,56,57,58] indicates that the proposed approach achieves a better performance for all the six datasets. The multitask network in [41] identifies some attributes such as gender, age of the person, and posture of the head. This proposed method identifies the emotions only using the facial expression data. In the future enhancement of the proposed work, this novel feature vector MSDP will be concatenated with some other feature descriptors and the results will be analyzed. PSO is used for the optimization of the hyper-parameters. The recognition results are compared in Table 9. The proposed work achieves better accuracy than the recent techniques such as EmoNet and visual transformers [57,58]. The proposed work achieves better performance as there is less chance of overfitting, reduced noise in data, better discrimination, and better data visualization. The suggested feature extraction method selects only the pertinent data required for this task automatically.
Table 9.
Analysis of results with some prevailing methods.
The proposed work uses a novel feature extraction technique rather than applying machine learning techniques directly on the raw images because of the following advantages. The technique of turning unprocessed raw images into numerical features that can be used for processing while retaining the data from the original dataset is known as feature extraction. It produces superior outcomes compared to machine learning/deep learning that are applied directly to the raw image. The amount of redundant data in the dataset can be reduced by feature extraction. In the end, the data reduction speeds up the learning and generalization phases of the machine learning process while also making it easier for the machine to develop the model. Less duplicated data are created in the proposed approach that uses MSDP for feature extraction which leads to less chances for decisions to be based on noise. Overfitting is also reduced. Accuracy is enhanced compared to existing models [50,53,55], when the features are classified using the LeNet architecture of CNN. In the proposed work, more accurate modelling is possible with less misleading data. It cuts down on training time as algorithms can train more quickly when there are less data. The summary of the hyper-parameters is shown in Table 10.
Table 10.
Summary of Parameters.
JAFFE, CK+, MUG, OULU-CASIA, and MUG datasets were the five datasets used in the cross-database tests. Each group in Table 11 is given a name based on the test set database that was used. When the JAFFE dataset is used as the test set, all the remaining samples from the other datasets are used as training samples. The JAFFE database, which consists solely of Japanese female participants, is severely skewed in terms of gender and ethnicity. The JAFFE database’s results fell short of expectations. The accuracy of SFEW is low in the cross-database experiment as the images were captured under highly unconstrained environments and are difficult to compare with other datasets.
Table 11.
Accuracy obtained using cross-database experiments.
The results are shown in Table 12. The JAFFE dataset is split into training and testing samples for this reason using the leave-one-out method. The test set is built using a sample image from each subject-expression pair, and the training set is built using the remaining images. There are 143 total samples used, of which 70 are used for testing. The similarity metrics are determined according to Table 12. The hyper parameter values are chosen using the grid search algorithm. The ratios / are spread between 0.989 and 1.000 in Table 12, which indicate a high degree of similarity between the kernel matrices and . According to the estimated similarity measures, the PGK kernel and the other existing kernels are quite similar for certain values. The PGK kernel transforms from linear to RBF as the values of , change.
Table 12.
The similarity measure / for JAFFE images.
High classification accuracy is attained by the proposed MSDP compared to the other existing descriptors, which also have a very low time complexity as shown in Table 13. MSDP outperforms all other currently used descriptors in terms of accuracy. Additionally, it has a computational complexity of O (5 MN), where M and N are the number of rows and columns in the image. MSDP has a significantly lower level of complexity than MRDTP, MRDNP, MDP, MRIPP, and E-Gabor. Due to its great precision and low processing complexity, MSDP is thus ideally suited for usage in real-time applications. By employing Difference of Gaussian filters, the suggested MSDP improves the image and removes any noise that may be present. In addition to being scale- and rotation-invariant, the retrieved features make this feature extraction method superior to others that are currently in use. It is possible to recognize very subtle expressions with the capacity to extract thin edges. The signal to noise ratio is the main drawback of the Sobel operator. Some of the results may be erroneous because the gradient magnitude of the edges decreases as the noise levels rise. This is an MSDP restriction that will be remedied in the future by using derivatives based on fractional orders on other, better edge-detection algorithms.
Table 13.
Computational complexity of different techniques.
5. Conclusions
In the proposed work, Riesz transformation and Sobel filters are used for the formation of the features. MSDP applies the Riesz transformation with the finest parameters chosen using the Bat algorithm-based optimization technique. Then, the fractional derivative-based Sobel filters are applied and the code images are formed. The code image is designed by obtaining the pixel information from the maximum value. Thus, the edge information of the facial expression image is encoded into a feature vector. This novel MSDP achieves higher classification accuracy compared to the existing techniques. MSDP has comparatively low computational complexity and length. The novel Bat optimization algorithm with Pearson mutation operator obtains the best parameters for MSDP. The novel PKSPCA achieves effective dimension reduction. The proposed technique achieves higher classification accuracy for the SFEW images with high blur and occlusions. The suggested work attains high accuracy compared to the other techniques in the literature. The proposed technique achieves higher classification accuracy on six datasets as seen in the results. The future works will focus on micro-expressions, and the prediction of dynamic emotions in videos. JAFFE and SFEW outcomes are not better in cross-database experiments using proposed MSDP, which will be overcome in future works.
Author Contributions
Conceptualization, A.S.A. and S.A.; methodology, A.S.A.; software, S.A.; validation, K.S.A.; writing—original draft preparation, A.S.A. and S.A.; writing—review and editing, A.S.A., S.A. and K.S.A. All authors have read and agreed to the published version of the manuscript.
Funding
This research received no external funding.
Institutional Review Board Statement
Not Applicable.
Informed Consent Statement
Not Applicable.
Data Availability Statement
JAFFE and CK are publicly available datasets. Other datasets are available from particular authors on request https://computervisiononline.com/dataset/1105138659 (accessed on 21 October 2017). The MUG dataset is available from https://mug.ee.auth.gr/fed/ (accessed on 21 October 2017). The Oulu-CASIA dataset is available from https://paperswithcode.com/dataset/oulu-casia (accessed on 21 October 2017). The MMI dataset is available from https://mmifacedb.eu/ (accessed on 21 October 2017). The SFEW dataset can be obtained from https://computervisiononline.com/dataset/1105138659 (accessed on 21 October 2017).
Conflicts of Interest
The authors declare no conflict of interest.
Appendix A. Calculation of Optimal Number of Eigen Vectors and Principal Components for PKSPCA
The experiments are completed using the JAFFE dataset. The features are extracted using MSDP and the PKSPCA is applied on the feature vectors. CNN is used for classification. Here, the classification accuracy is obtained for different values of principal components as in Table A1.
Table A1.
Accuracy obtained using number of eigen vectors as d = 3 and different number of principal components (p).
Table A1.
Accuracy obtained using number of eigen vectors as d = 3 and different number of principal components (p).
| Number of Principal Components (p) | 5 | 15 | 25 | 35 | 45 | 55 |
|---|---|---|---|---|---|---|
| Accuracy in% | 89.4 | 90.2 | 95.4 | 97.6 | 97.6 | 97.6 |
As shown in Table A1, when the principal components’ number is 35, the accuracy based on PKSPCA is 97.6%, and the accuracy is unaffected by the principal components that have grown in number.
Table A2 also displays the accuracy based on PKSPCA with varied d and a principal component number of 35. Optimal accuracy is obtained when d = 7 as after that there is no significant increase in accuracy. The highest recognition rate based on PKSPCA is 97.7% when the principal components number is 35 and d = 7.
Table A2.
Accuracy obtained using p = 35 and different number of eigen vectors (d).
Table A2.
Accuracy obtained using p = 35 and different number of eigen vectors (d).
| Number of Eigen Vectors (d) | 1 | 2 | 3 | 4 | 5 | 6 | 7 | 8 | 9 | 10 |
|---|---|---|---|---|---|---|---|---|---|---|
| Accuracy in % | 86.4 | 90.2 | 92.2 | 94.4 | 94.8 | 94.9 | 97.6 | 97.6 | 97.6 | 97.7 |
References
- Mehta, D.; Siddiqui, M.F.H.; Javaid, A.Y. Facial Emotion Recognition: A Survey and Real-World User Experiences in Mixed Reality. Sensors 2018, 18, 416. [Google Scholar] [CrossRef] [PubMed]
- Wang, G.; Gong, J. Facial expression recognition based on improved LeNet-5 CNN. In Proceedings of the 2019 Chinese Control and Decision Conference (CCDC), Nanchang, China, 3–5 June 2019; pp. 5655–5660. [Google Scholar]
- Alphonse, A.S.; Dharma, D. Novel directional patterns and a Generalized Supervised Dimension Reduction System (GSDRS) for facial emotion recognition. Multimed. Tools Appl. 2018, 77, 9455–9488. [Google Scholar] [CrossRef]
- Garcia Freitas, P.; Da Eira, L.P.; Santos, S.S.; Farias, M.C. On the application LBP texture descriptors and its variants for no-reference image quality assessment. J. Imaging 2018, 4, 114. [Google Scholar] [CrossRef]
- Chikkerur, S.; Cartwright, A.N.; Govindaraju, V. Fingerprint enhancement using STFT analysis. Pattern Recognit. 2007, 40, 198–211. [Google Scholar] [CrossRef]
- Huang, X.; Zhao, G.; Zheng, W.; Pietikainen, M. Spatiotemporal local monogenic binary patterns for facial expression recognition. IEEE Signal Process Lett. 2012, 19, 243–246. [Google Scholar] [CrossRef]
- Chen, J.; Huang, C.; Du, Y.; Lin, C. Combining fractional-order edge detection and chaos synchronisation classifier for fingerprint identification. IET Image Process 2014, 8, 354–362. [Google Scholar] [CrossRef]
- Chi, C.; Gao, F. Palm Print Edge Extraction Using Fractional Differential Algorithm. J. Appl. Math. 2014, 2014, 896938. [Google Scholar] [CrossRef]
- Dong, F.; Chen, Y. A Fractional-order derivative based variational framework for image denoising. Inverse Probl. Imaging 2016, 10, 27–50. [Google Scholar] [CrossRef]
- Ismail, S.M.; Said, L.A.; Madian, A.H.; Radwan, A.G. Fractional-order edge detection masks for diabetic retinopathy diagnosis as a case study. Computers 2021, 10, 30. [Google Scholar] [CrossRef]
- Cajo, R.; Mac, T.T.; Plaza, D.; Copot, C.; De Keyser, R.; Ionescu, C. A survey on fractional order control techniques for unmanned aerial and ground vehicles. IEEE Access 2019, 7, 66864–66878. [Google Scholar] [CrossRef]
- Ojansivu, V.; Rahtu, E.; Heikkila, J. Rotation invariant local phase quantization for blur insensitive texture analysis. In Proceedings of the 2008 19th International Conference on Pattern Recognition, Tampa, FL, USA, 8–11 December 2008; pp. 1–4. [Google Scholar]
- Hamester, D.; Barros, P.; Wermter, S. Face expression recognition with a 2- channel convolutional neural network. In Neural Networks (IJCNN), Proceedings of the 2015 International Joint Conference on Killarney, Ireland, 12–17 July 2015; IEEE: New York City, NY, USA, 2015; pp. 1–8. [Google Scholar]
- Huang, G.B.; Zhou, H.; Ding, X.; Zhang, R. Extreme learning machine for regression and multiclass classification. Part B IEEE Trans. Syst. Man Cybern. 2012, 42, 513–529. [Google Scholar] [CrossRef]
- Huang, G.B.; Zhu, Q.Y.; Siew, C.K. Extreme learning machine: A new learning scheme of feedforward neural networks. Neural Netw. 2004, 2, 985–990. [Google Scholar]
- Reddy, G.T.; Khare, N. Hybrid firefly-bat optimized fuzzy artificial neural network-based classifier for diabetes diagnosis. Int. J. Intell. Eng. Syst. 2017, 10, 18–27. [Google Scholar] [CrossRef]
- Vincent, O.R.; Folorunso, O. A descriptive algorithm for sobel image edge detection. In Proceedings of the Informing Science & IT Education Conference (InSITE), Macon, GA, USA, 12–15 June 2009; Volume 40, pp. 97–107. [Google Scholar]
- Reddy, G.T.; Khare, N. An efficient system for heart disease prediction using hybrid OFBAT with rule-based fuzzy logic model. J. Circuits Syst. Comput. 2017, 26, 1750061. [Google Scholar] [CrossRef]
- Asthana, A.; Zafeiriou, S.; Cheng, S.; Pantic, M. Incremental face alignment in the wild. In Proceedings of the IEEE Conference on Computer Vision and Pattern Recognition, Washington, DC, USA, 23–28 June 2014; pp. 1859–1866. [Google Scholar]
- Yang, X.S.; He, X. Bat algorithm: Literature review and applications. Int. J. BioInspired Comput. 2013, 5, 141–149. [Google Scholar] [CrossRef]
- Üstün, B.; Melssen, W.J.; Buydens, L.M. Facilitating the application of Support Vector Regression by using a universal Pearson VII function based Kernel. Chemom. Intell. Lab. Syst. 2006, 81, 29–40. [Google Scholar] [CrossRef]
- Jia, B.; Huang, B.; Gao, H.; Li, W. Dimension reduction in radio maps based on the supervised kernel principal component analysis. Soft Comput. 2018, 22, 7697–7703. [Google Scholar] [CrossRef]
- Lucey, P.; Cohn, J.F.; Kanade, T.; Saragih, J.; Ambadar, Z.; Matthews, I. The extended cohn-kanade dataset (ck+): A complete dataset for action unit and emotion-specified expression. In Proceedings of the IEEE Computer Society Conference on Computer Vision and Pattern Recognition Workshops (CVPRW), San Francisco, CA, USA, 13–18 June 2010; pp. 94–101. [Google Scholar]
- Lyons, M.; Akamatsu, S.; Kamachi, M.; Gyoba, J. Coding facial expressions with gabor wavelets. In Proceedings of the Third IEEE International Conference on Automatic Face and Gesture Recognition, Nara, Japan, 14–16 April 1998; pp. 200–205. [Google Scholar]
- Zhao, G.; Huang, X.; Taini, M.; Li, S.Z.; Pietikäinen, M. Facial expression recognition from near-infrared videos. Image Vis. Comput. 2010, 29, 607–619. [Google Scholar] [CrossRef]
- Ojala, T.; Pietikainen, M.; Maenpaa, T. Multiresolution gray-scale and rotation invariant texture classification with local binary patterns. IEEE Trans. Pattern Anal. Mach. Intell. 2002, 24, 971–987. [Google Scholar] [CrossRef]
- Pantic, M.; Valstar, M.; Rademaker, R.; Maat, L. Web-based database for facial expression analysis. In Proceedings of the Multimedia and Expo, IEEE International Conference, Amsterdam, The Netherlands, 6 July 2005; p. 5. [Google Scholar]
- Valstar, M.; Pantic, M. Induced disgust, happiness and surprise:an addition to the MMI facial expression database. In Proceedings of the 3rd International Workshop on EMOTION (Satellite of LREC): Corpora for Research on Emotion and Affect, London, UK, 23 May 2010. [Google Scholar]
- Pu, Y.-F. Fractional differential analysis for texture of digital image. J. Algorithms Comput. Technol. 2007, 1, 357–380. [Google Scholar]
- Aifanti, N.; Papachristou, C.; Delopoulos, A. The MUG facial expression database. In Proceedings of the 11th International Workshop on Image Analysis for Multimedia Interactive Services (WIAMIS), Desenzano, Italy, 12–14 April 2010. [Google Scholar]
- Dhall, A.; Goecke, R.; Joshi, J.; Sikka, K.; Gedeon, T. Emotion recognition in the wild challenge 2014: Baseline, data and protocol, ACM ICMI. In Proceedings of the 16th International Conference on Multimodal Interaction, Istanbul, Turkey, 12–16 November 2014. [Google Scholar]
- Dhall, A.; Goecke, R.; Lucey, S.; Gedeon, T. Collecting Large, Richly Annotated Facial Expression Databases from Movies. IEEE MultiMedia 2012, 19, 34–41. [Google Scholar] [CrossRef]
- Jabid, T.; Kabir, M.H.; Chae, O. Local directional pattern (LDP) for face recognition. In Proceedings of the 2010 Digest of Technical Papers International Conference on Consumer Electronics (ICCE), Las Vegas, NV, USA, 9–13 January 2010; pp. 329–330. [Google Scholar]
- Alphonse, A.S.; Dharma, D. A novel Monogenic Directional Pattern (MDP) and pseudo-Voigt kernel for facilitating the identification of facial emotions. J. Vis. Commun. Image Represent. 2017, 49, 459–470. [Google Scholar] [CrossRef]
- Fogel, I.; Sagi, D. Gabor filters as texture discriminator. Biol. Cybern. 1989, 61, 103–113. [Google Scholar] [CrossRef]
- Arya, R.; Vimina, E.R. Local triangular coded pattern: A texture descriptor for image classification. IETE J. Res. 2021, 1–2. [Google Scholar] [CrossRef]
- Qazi, H.A.; Jahangir, U.; Yousuf, B.M.; Noor, A. Human action recognition using SIFT and HOG method. In Proceedings of the 2017 International Conference on Information and Communication Technologies (ICICT), Karachi, Pakistan, 30–31 December 2017; pp. 6–10. [Google Scholar]
- Ahonen, T.; Rahtu, E.; Ojansivu, V.; Heikkila, J. Recognition of blurred faces using local phase quantization. In Proceedings of the 2008 19th International Conference on Pattern Recognition, Tampa, FL, USA, 8–11 December 2008; pp. 1–4. [Google Scholar]
- Zhang, B.; Shan, S.; Chen, X.; Gao, W. Histogram of gabor phase patterns (hgpp): A novel object representation approach for face recognition. IEEE Trans. Image Process 2006, 16, 57–68. [Google Scholar] [CrossRef]
- Zhang, W.; Shan, S.; Gao, W.; Chen, X.; Zhang, H. Local gabor binary pattern histogram sequence (lgbphs): A novel non-statistical model for face representation and recognition. In Proceedings of the Tenth IEEE International Conference on Computer Vision (ICCV’05) Volume 1, Beijing, China, 17–21 October 2005. [Google Scholar]
- Felzenszwalb, P.F.; Huttenlocher, D.P. Pictorial structures for object recognition. Int. J. Comput. Vis. 2005, 61, 55–79. [Google Scholar] [CrossRef]
- Lu, J.; Zhou, X.; Tan, Y.P.; Shang, Y.; Zhou, J. Neighborhood repulsed metric learning for kinship verification. IEEE Trans. Pattern Anal. Mach. Intell. 2013, 36, 331–345. [Google Scholar]
- Hu, J.; Lu, J.; Liu, L.; Zhou, J. Multi-view geometric mean metric learning for kinship verification. In Proceedings of the 2019 IEEE International Conference on Image Processing (ICIP), Taipei, Taiwan, 22–25 September 2019; pp. 1178–1182. [Google Scholar]
- Guillaumin, M.; Mensink, T.; Verbeek, J.; Schmid, C. Tagprop: Discriminative metric learning in nearest neighbor models for image auto-annotation. In Proceedings of the 2009 IEEE 12th International Conference on Computer Vision, Kyoto, Japan, 29 September–2 October 2009; pp. 309–316. [Google Scholar]
- Huang, S.; Lin, J.; Huangfu, L. Class-prototype discriminative network for generalized zero-shot learning. IEEE Signal Process Lett. 2020, 27, 301–305. [Google Scholar] [CrossRef]
- Mahpod, S.; Keller, Y. Kinship verification using multiview hybrid distance learning. Comput. Vis. Image Underst. 2018, 167, 28–36. [Google Scholar] [CrossRef]
- Matsukawa, T.; Suzuki, E. Kernelized cross-view quadratic discriminant analysis for person re-identification. In Proceedings of the 2019 16th International Conference on Machine Vision Applications (MVA), Tokyo, Japan, 27–31 May 2019; pp. 1–5. [Google Scholar]
- Bessaoudi, M.; Ouamane, A.; Belahcene, M.; Chouchane, A.; Boutellaa, E.; Bourennane, S. Multilinear side-information based discriminant analysis for face and kinship verification in the wild. Neurocomputing 2019, 329, 267–278. [Google Scholar] [CrossRef]
- Shankar, P.B.; Vani, Y.D. Conceptual Glance of Genetic Algorithms in the Detection of Heart Diseases. In Proceedings of the 2021 International Conference on Advances in Electrical, Computing, Communication and Sustainable Technologies (ICAECT), Bhilai, India, 19–20 February 2021; pp. 1–4. [Google Scholar]
- Liu, P.; Han, S.; Meng, Z.; Tong, Y. Facial expression recognition via a boosted deep belief network. In Proceedings of the IEEE Conference on Computer Vision and Pattern Recognition, Columbus, OH, USA, 23–28 June 2014; pp. 1805–1812. [Google Scholar]
- Turan, C.; Lam, K.M.; He, X. Soft Locality Preserving Map (SLPM) for Facial Expression Recognition. arXiv 2018, arXiv:1801.03754. [Google Scholar]
- Wang, W.; Sun, Q.; Chen, T. A Fine-Grained Facial Expression Database for End-to-End Multi-Pose Facial Expression Recognition. arXiv 2019, arXiv:1907.10838. [Google Scholar]
- Yang, H.; Ciftci, U.; Yin, L. Facial expression recognition by de-expression residue learning. In Proceedings of the IEEE Conference on Computer Vision and Pattern Recognition, Salt Lake City, UT, USA, 23–28 June 2018; pp. 2168–2177. [Google Scholar]
- Zhang, Z.; Luo, P.; Chen, C.L.; Tang, X. From facial expression recognition to interpersonal relation prediction. Int. J. Comput. Vis. 2018, 126, 1–20. [Google Scholar] [CrossRef]
- Zhao, R.; Liu, T.; Xiao, J.; Lun, D.P.; Lam, K.M. Deep multi-task learning for facial expression recognition and synthesis based on selective feature sharing. In Proceedings of the 2020 25th International Conference on Pattern Recognition (ICPR), Milan, Italy, 10–15 January 2021; pp. 4412–4419. [Google Scholar]
- Zheng, H.; Wang, R.; Ji, W.; Zong, M.; Wong, W.K.; Lai, Z.; Lv, H. Discriminative deep multi-task learning for facial expression recognition. Inf. Sci. 2020, 533, 60–71. [Google Scholar] [CrossRef]
- Dosovitskiy, A.; Beyer, L.; Kolesnikov, A.; Weissenborn, D.; Zhai, X.; Unterthiner, T.; Dehghani, M.; Minderer, M.; Heigold, G.; Gelly, S.; et al. An image is worth 16x16 words: Transformers for image recognition at scale. arXiv 2020, arXiv:2010.11929. [Google Scholar]
- Cui, Y.; Ma, Y.; Li, W.; Bian, N.; Li, G.; Cao, D. Multi-EmoNet: A Novel Multi-Task Neural Network for Driver Emotion Recognition. IFAC-PapersOnLine 2020, 53, 650–655. [Google Scholar] [CrossRef]
- Gera, D.; Balasubramanian, S. Landmark guidance independent spatio-channel attention and complementary context information based facial expression recognition. Pattern Recognit. Lett. 2021, 145, 58–66. [Google Scholar] [CrossRef]
Disclaimer/Publisher’s Note: The statements, opinions and data contained in all publications are solely those of the individual author(s) and contributor(s) and not of MDPI and/or the editor(s). MDPI and/or the editor(s) disclaim responsibility for any injury to people or property resulting from any ideas, methods, instructions or products referred to in the content. |
© 2023 by the authors. Licensee MDPI, Basel, Switzerland. This article is an open access article distributed under the terms and conditions of the Creative Commons Attribution (CC BY) license (https://creativecommons.org/licenses/by/4.0/).