Article

Ultra-Low-Power Voice Activity Detection System Using Level-Crossing Sampling

by
Maral Faghani
1,
Hamidreza Rezaee-Dehsorkh
1,*,
Nassim Ravanshad
1 and
Hamed Aminzadeh
2,*
1
Department of Electrical Engineering, Sadjad University, Mashhad 9188148848, Iran
2
Department of Electrical Engineering, Payame Noor University (PNU), Tehran P.O. Box 19395-4697, Iran
*
Authors to whom correspondence should be addressed.
Electronics 2023, 12(4), 795; https://doi.org/10.3390/electronics12040795
Submission received: 28 November 2022 / Revised: 17 January 2023 / Accepted: 3 February 2023 / Published: 5 February 2023

Abstract

:
This paper presents an ultra-low-power voice activity detection (VAD) system to discriminate speech from non-speech parts of audio signals. The proposed VAD system uses level-crossing sampling for voice activity detection. The useless samples in the non-speech parts of the signal are eliminated due to the activity-dependent nature of this sampling scheme. A 40 ms moving window with a 30 ms overlap is exploited as a feature extraction block, within which the output samples of the level-crossing analog-to-digital converter (LC-ADC) are counted as the feature. The only variable used to distinguish speech and non-speech segments in the audio input signal is the number of LC-ADC output samples within a time window. The proposed system achieves an average of 91.02% speech hit rate and 82.64% non-speech hit rate over 12 noise types at −5, 0, 5, and 10 dB signal-to-noise ratios (SNR) over the TIMIT database. The proposed system including LC-ADC, feature extraction, and classification circuits was designed in 0.18 µm CMOS technology. Post-layout simulation results show a power consumption of 394.6 nW with a silicon area of 0.044 mm2, which makes it suitable as an always-on device in an automatic speech recognition system.

1. Introduction

Voice activity detection (VAD) systems distinguish speech from non-speech segments. They are used for pre-processing in most speech-related applications, including automatic speech recognition (ASR), keyword spotting, and speaker verification. In many audio applications, it is observed that the signal is alternately activated and deactivated. Thus, the use of VAD is very popular as a wake-up system to activate the power-hungry processing system in the presence of speech [1,2,3,4] as illustrated conceptually in Figure 1. Using this wake-up system, the power consumption of the entire system is decreased significantly. One of the crucial aspects of VAD as an always-on subsystem, that listens continuously to the input signal, is its restriction in terms of power consumption. Any VAD system typically extracts some features from the input audio signal and compares them to the threshold values. Depending on the type of feature, if the feature value exceeds or falls below the threshold, the under-review audio segment is recognized as speech (VAD output = 1) or non-speech (VAD output = 0) [5], respectively.
Accurate detection is challenging, particularly when the speech signal is corrupted by noise. Many VAD systems have been proposed and widely studied in the past decade. They can be categorized into two major types: software VAD and hardware VAD. In software VAD systems, various features are introduced, such as spectral entropy, hidden Markov models, cepstrum coefficients, and others, which are reviewed and compared in [6]. A more complicated VAD algorithm based on a deep neural network (DNN) learns features during the training process [7]. Despite their high functionality, the majority of these methods require complex computations, making them inappropriate for low-cost and low-power hardware implementation.
Hardware VAD systems should be designed with a minimum complexity and low power consumption. Several solutions have been presented to achieve these goals. Conventional approaches use short-time energy and zero-crossing rate methods [8,9]. While they are simple, they fail to distinguish speech from non-speech as the background noise increases [5]. Fast Fourier transform (FFT) is also used in [1,2] to extract features. However, the power consumption of the FFT circuitry exceeds 2 μW [1]. To reduce power consumption, an idea has been discussed in [3] in which the computation of individual features is switched ON/OFF depending on the features’ usefulness in a particular context. In this method, feature extraction techniques are implemented in the analog domain to optimize VAD power consumption [3,10]. However, the analog feature extraction block is still the most power-consuming part, which results in microwatt operation. A fully analog implementation of VAD, including a switched-capacitor acoustic feature extractor, is also suggested in [11,12]. The VAD algorithm introduced in [11] exploits the time-variant energy of the input audio signal as a feature. The system is composed of a programmable-gain amplifier, a squarer, an integrator, a switched-capacitor-based signal averaging circuit, and a periodic threshold update circuit for adaptability. However, this circuit consumes around five times as much power as its digital counterparts [4].
In [12], only the feature extractor is implemented by using a switched-capacitor bandpass filter bank to minimize the impact of process–voltage–temperature (PVT) variation. In [4], by sequentially scanning 4 kHz of frequency bands and down-converting to below 500 Hz, feature extraction power consumption is reduced by 4×. In [13], analog signal processing for acoustic feature extraction, approximate event-driven analog-to-digital conversion, and a digital DNN are used for speech/non-speech classification. However, while effective performance of the circuits is reported for a 10 dB signal-to-noise ratio (SNR), no information is provided concerning the performance of the circuit at higher noise levels.
One of the most efficient ways to reduce power consumption is to reduce the rate at which information is sent from the analog-to-digital converter (ADC) to the next block. An efficient technique for an acceptable data rate reduction is to change the sampling scheme in the signal conversion by the ADC. A level-crossing sampling scheme is a recommended approach for this purpose. In this sampling scheme, samples are taken from the signal only when significant changes in the amplitude of the signal occur. Therefore, the samples are taken only from the active part of the signal. In level-crossing sampling, no anti-aliasing filter is needed because no sample-and-hold circuit is required in most of the LCADC structures. The converter also has an inherent noise reduction mechanism [14]. In this case, signal conditioning can be performed with a simpler filter.
There are two ways to implement the LC-ADC: fixed-window and floating-window structures [14]. The LC-ADC implementation types are suitable for various applications and specifications. The LC-ADC, like conventional converters, can be implemented in both synchronous and asynchronous timing modes. The LC-ADC output can be directly used for simple and low-power processing [15]. Applying this method to the sparse signals, which show activity only for short periods, reduces the sampling rate as well as the number of bits corresponding to each sample and thus significantly reduces the data rate [15]. The efficiency of this method in reducing power consumption is shown in many signal recording and processing systems, including cardiac [15,16,17], neural [18], and speech [19] signals.
In this paper, a novel VAD algorithm for speech/non-speech detection based on the output data of the level-crossing ADC is proposed. The main goal is to achieve improved power efficiency as well as detection accuracy. The proposed extracted feature is as simple as counting the number of the level-crossing ADC (LC-ADC) output samples in a specific time window. The simplicity of the feature extraction leads to the simplicity of the circuit, and, as a result, the power consumption is reduced. The system performance is evaluated using the TIMIT database across various types of noise and SNRs [20]. TIMIT contains 630 speakers of eight dialects of American English, each reading 10 phonetically rich sentences.
The rest of the paper is organized as follows: Section 2 describes the overview of the level-crossing sampling. Section 3 describes the proposed LC-ADC-based VAD algorithm and its circuit implementation. The behavioral simulations of the algorithm are presented in Section 4. Post-layout simulation results and the performance comparison are presented in Section 5. Finally, the paper is concluded in Section 6.

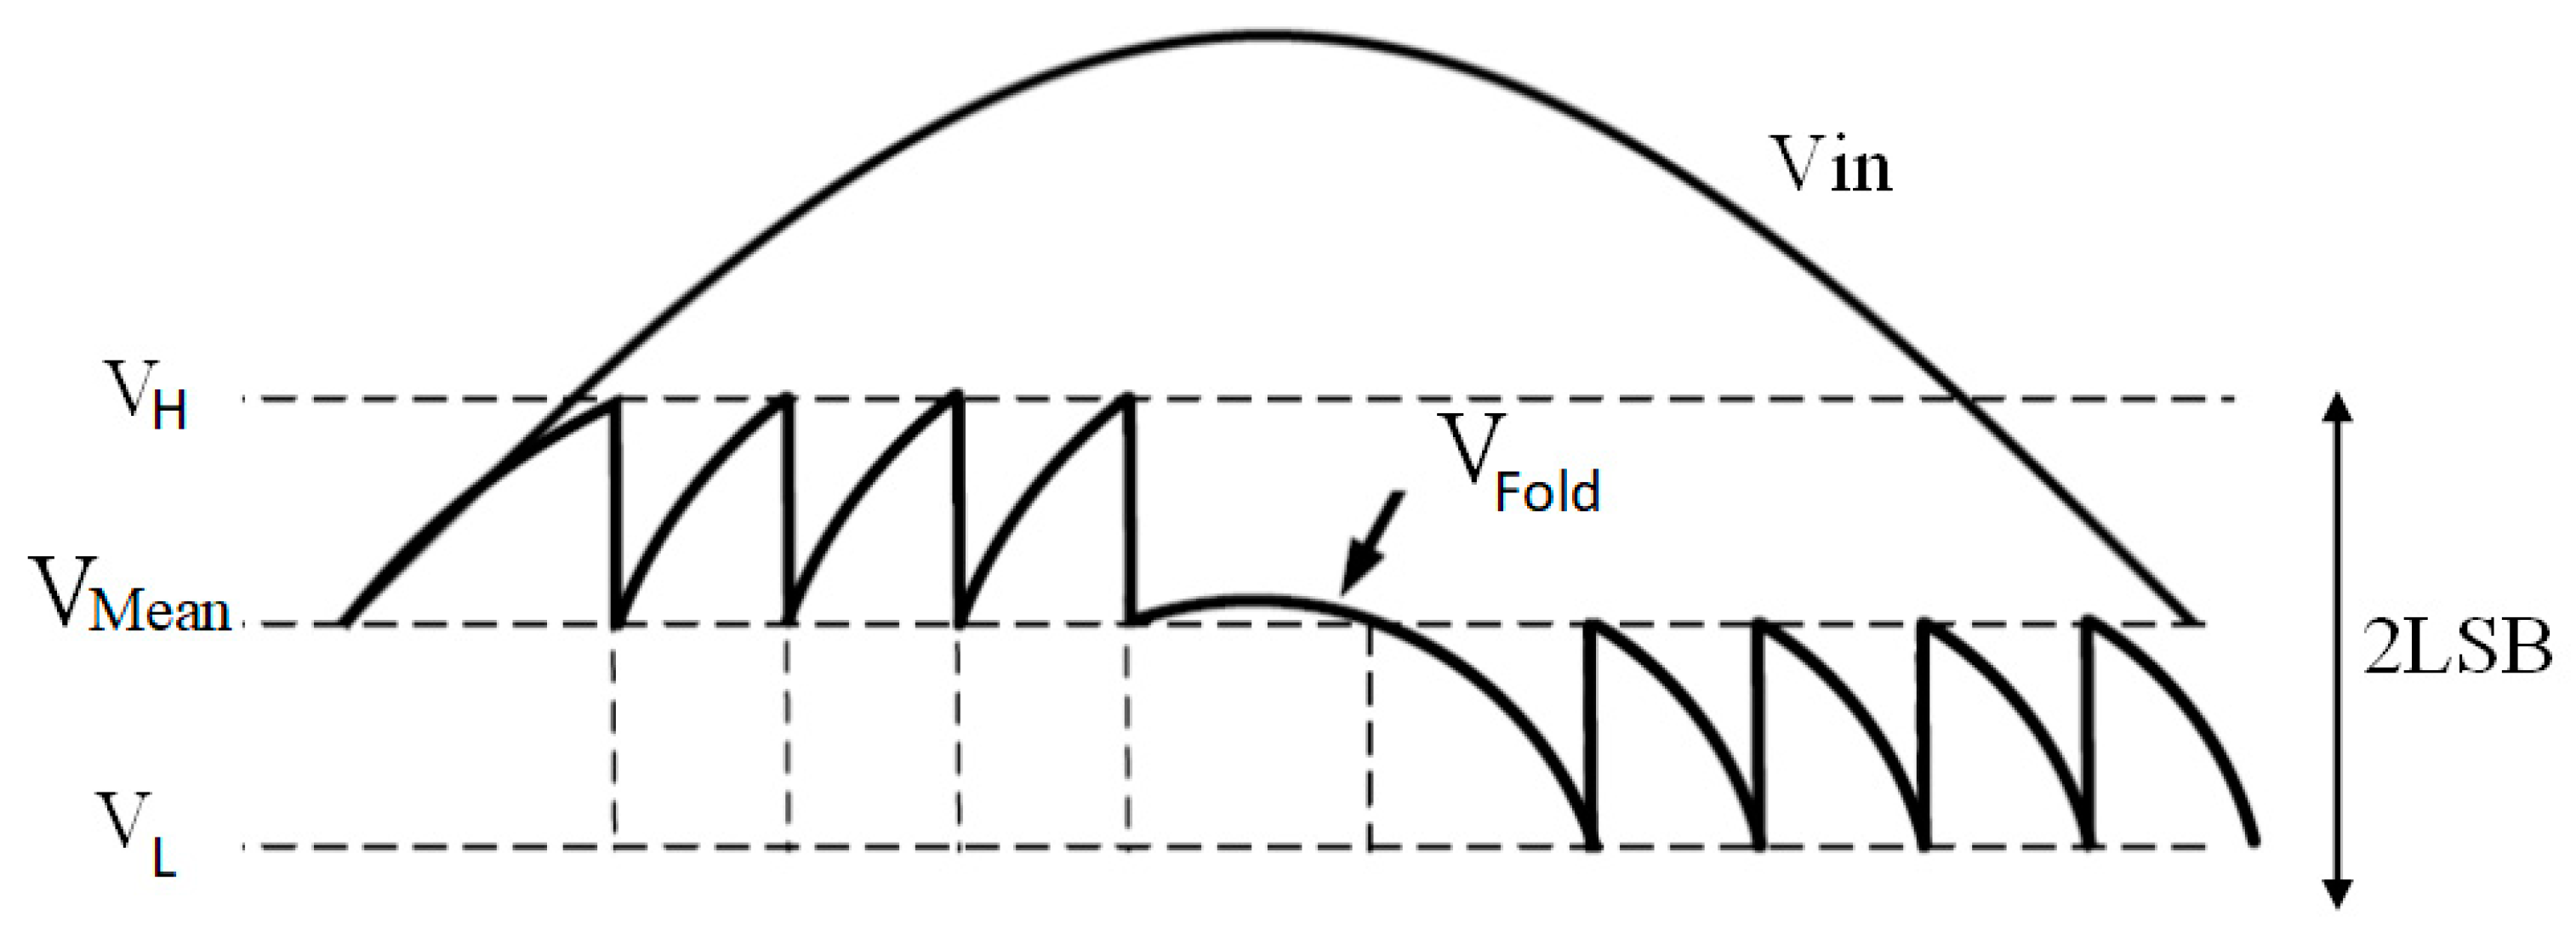
2. Level-Crossing Sampling

In the conventional synchronous sampling method, the samples are taken uniformly over time and at a fixed time interval. Applying this method to speech signals means taking a large number of samples from non-speech parts, which constitute about 60% of a signal and have no useful information [21]. Processing these samples results in wasting power in the processor. Uniform sampling and level-crossing sampling are shown in Figure 2a,b, respectively. In order to achieve a resolution of M bits for a level-crossing converter, 2M-1 comparison levels with an equal distance of one least-significant bit (LSB) within the input range of the converter (indicated as dotted lines in Figure 2b) are considered. A sample is taken only when the input signal crosses one of the comparison levels.
Because the number of samples in level-crossing sampling is determined by amplitude changes in the input signal, the sampling rate is determined by the activity of the input signal. This property makes level-crossing sampling (LC sampling) useful for sparse signals that are inactive most of the time. These signals include pressure, temperature, heart [15], neural [18], and speech signals [19]. As long as the input signal is inactive and has no changes, level-crossing sampling does not take any samples. It is the main advantage of LC sampling. This reduction in the number of samples leads to a decrease in power consumption in the following blocks. Another benefit of LC sampling is that, unlike synchronous sampling, the sample amplitude is not subjected to quantization error. This is because the sample is taken precisely at the comparison levels. Therefore, the accuracy of the converter is not limited to its resolution. Thus, the value of M can be reduced to the extent that a sufficient number of samples are taken in the active parts of the signal. In this case, the power efficiency can be improved by using a smaller number of hardware bits, which results in a lower bit rate and less hardware complexity [15].
Furthermore, since the two consecutive samples only differ by 1 LSB, the signal amplitude can be retrieved by producing one bit in the output (UD), as shown in Figure 2c. The UD indicates the direction of the input signal: ‘1’ indicates upward, and ‘0’ indicates downward [15]. Since the time interval between samples is not constant, using an indication signal (Token) to indicate the sampling instant is obligatory, as shown in Figure 2c. The Token is usually realized as a single-bit pulse, which is activated for a short time when the input signal crosses each of the comparison levels and is then deactivated. The number of Token pulses in speech intervals is higher than in non-speech intervals due to the signal’s higher activity. Thus, the speech part can be distinguished from non-speech by counting Token pulses at specific time intervals. In this work, by using this property provided by LC-ADC, the VAD algorithm identifies the speech part of the signal.

3. VAD Algorithm Using Level-Crossing Samples

VAD systems are made of three blocks [22,23,24]. The first is a feature extraction block, the second is a threshold calculation block, and the third is a decision block that compares the feature(s) and threshold value(s) to make the VAD output ‘1’ (speech) or ‘0’ (non-speech). The main difference between most of the proposed methods is in the features used. In this work, the feature is the number of samples provided by the LC-ADC in specific time intervals. By using this method, the processing data volume can be reduced significantly, which may result in decreased power consumption while providing sufficient accuracy.

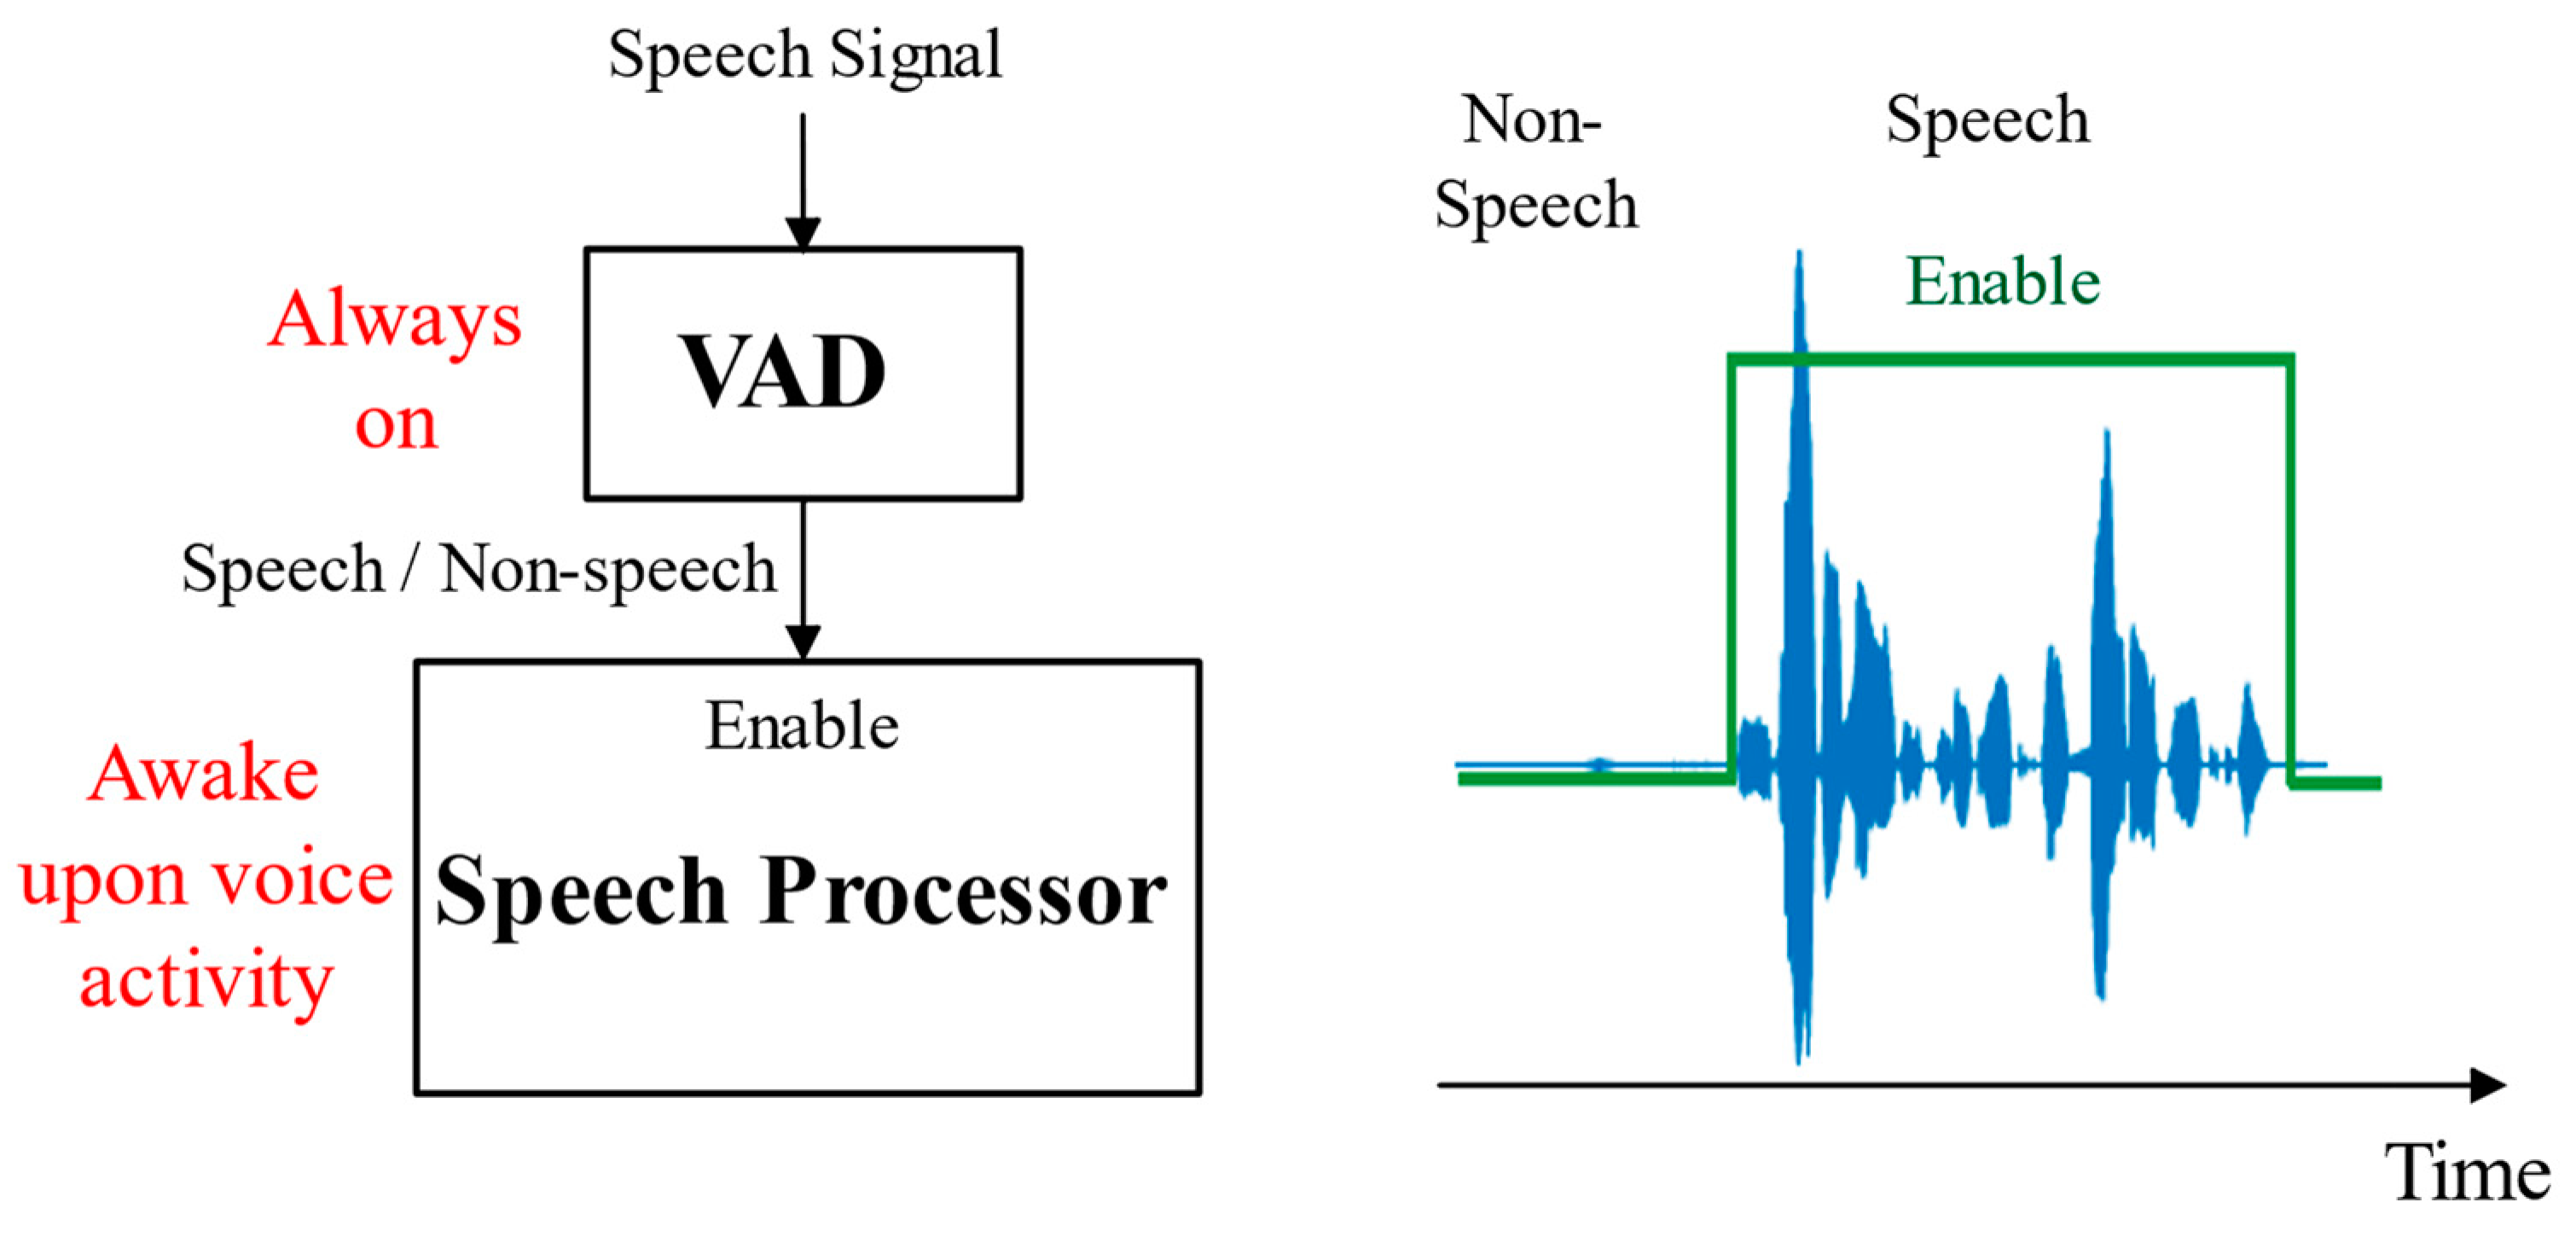
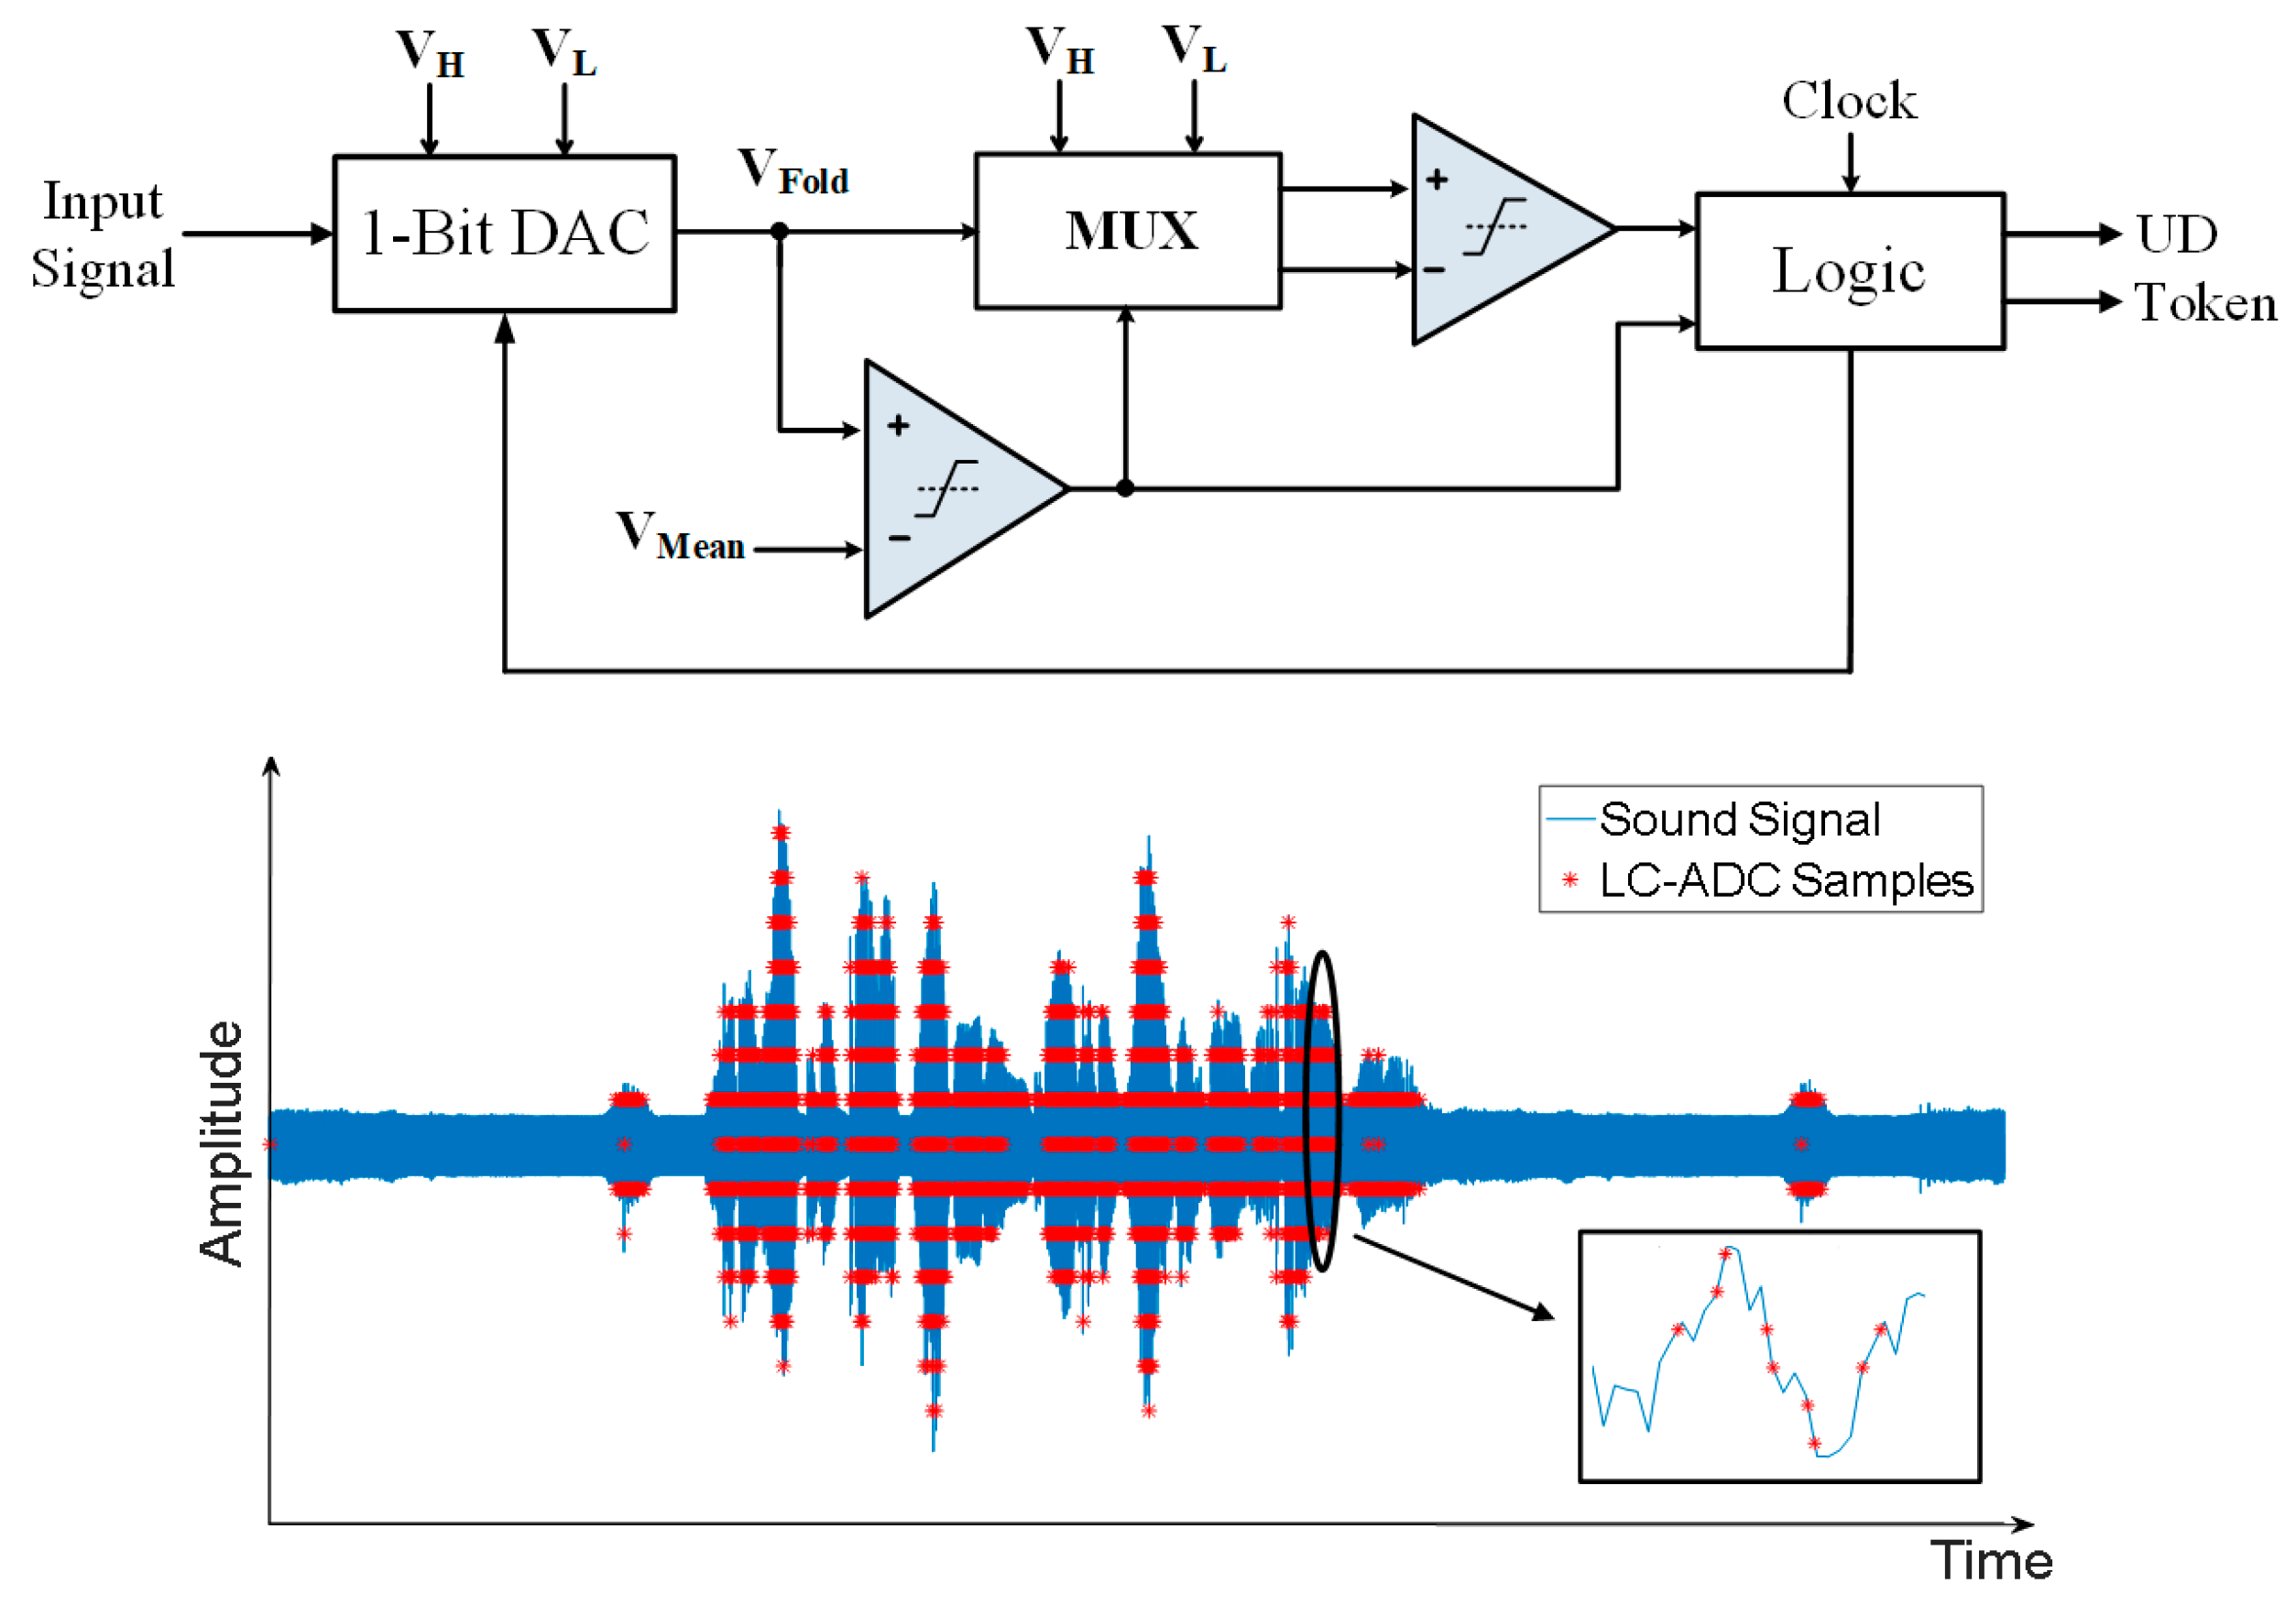
3.1. Exploiting LC-ADC for VAD Algorithm

Accurate VAD is challenging, particularly when various background noises corrupt the speech signal. Therefore, for more precise detection, many VAD algorithms use sophisticated methods to extract frequency features that are inherently different for noise and speech signals [2,7,13,25,26]. In [13,27], bandpass filtering and adaptive rate filtering are used to select the desired frequency band of the audio signal. However, using sophisticated frequency extraction methods increases power consumption. In the following, by using LC-ADC, many unwanted noises and even signals with amplitudes less than the specified value can be removed. By using this property, a simpler algorithm can be used to implement a power-efficient and accurate hardware VAD circuit. Few studies [13,27] use event-driven sampling in the VAD application. In [27], only the activity decrement property of the LC sampling is considered. After synchronous resampling and filtering with an adaptive rate, audio characteristics such as the first- and second-order derivatives of spectral coefficients are extracted as features for signal processing. In [13], the audio signal is passed through 16 analog audio processing channels, where each channel contains a bandpass filter, a full-wave rectifier, and an integrate-and-fire encoder as the event-driven ADC. Pre-VAD filtering in [13,27] has the disadvantages of complexity and high power consumption.
In addition to reducing the number of samples and removing noise, level-crossing sampling has other advantages. It can be used to reduce the complexity and improve the efficiency of the following processing blocks. It is shown in the following that the feature can be extracted simply by counting the number of Tokens. This feature shows signal activity, and there is no need to store samples with this method. By using these properties, a simple VAD algorithm can be obtained. To explain the idea, it is necessary to understand the overall functionality of the LC-ADC. LC-ADCs are implemented in several ways. The operation of the fixed-window type [14] for LC-ADCs, used in this work, is shown in Figure 3. The LC-ADC produces the output based on a pair of in-process quantization levels, named VH and VL. These values are fixed and specified with an equal distance around the input-signal DC value (VMean). A folded version of the input signal (VFold) is made, which follows the input signal variation. Whenever VFold crosses VH (VL), the value of this signal decreases (increases) by 1 LSB, such that it remains inside the comparison window (between two voltages VL and VH). The LSB value is defined as follows:
LSB = 2 A FS 2 M
in which A FS and M represent the ADC input voltage amplitude range and the ADC resolution, respectively.
The gap between VH and VL levels is represented by K. Figure 4 shows the effect of increasing the K value on level-crossing sampling [15]. Applying K to more than 2 LSBs removes many unwanted samples from the noisy signal in inactive areas. When K = 2 LSBs, as shown in Figure 4a, some samples are taken from the inactive parts of the signal, which do not have beneficial information and only increase the data volume and power consumption. One way to avoid such a problem is to increase the K value. Figure 4b shows an example of K = 4 LSBs. This figure depicts that a sample is taken only when the signal changes more than 1 LSB in the same direction as the previous sample or K-1 LSB in the opposite direction. Under such a sampling scheme, K-1 level-crossings are skipped in every direction change, and no samples are taken from signals with amplitudes less than K LSBs. The advantages of this scheme are reduced sampling points and noise filtering. As shown in Figure 4, a significant portion of the background noise and unwanted parts of the signal are reduced by increasing K from 2 to 4 LSBs.
The ADC can be built with several adjustable K values. In conventional floating-window structures, the LC-ADC can accept various values of K just by setting the desired values into the registers that hold VH and VL at startup. Thus, no extra circuits or sophisticated processes are expected to apply the chosen K to the ADC [15]. In others, this can be implemented by adding simple circuitry to the LC-ADC [28].

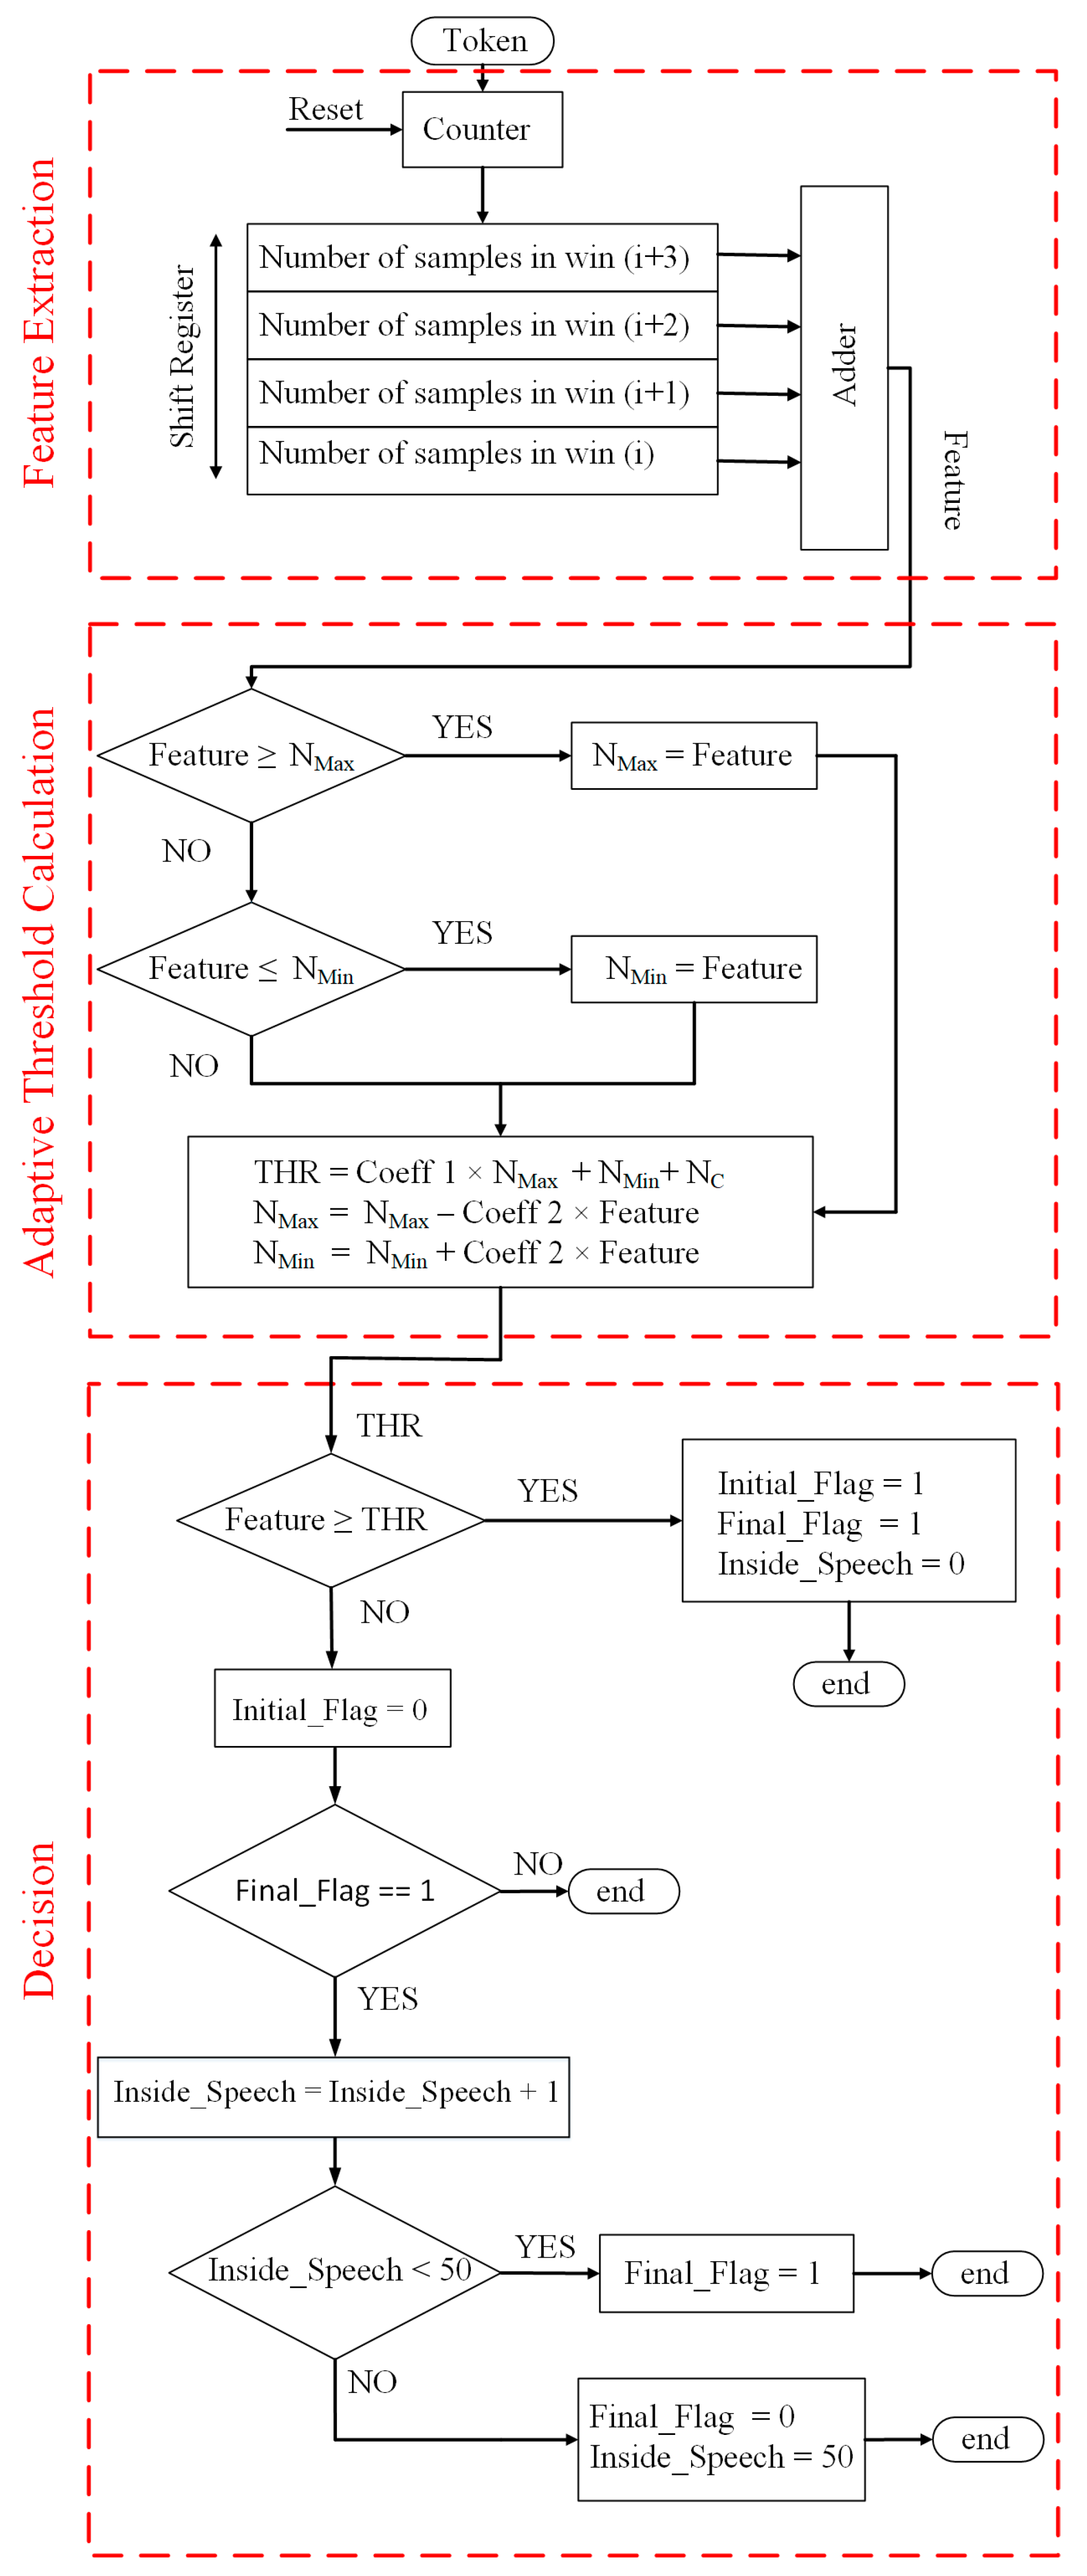
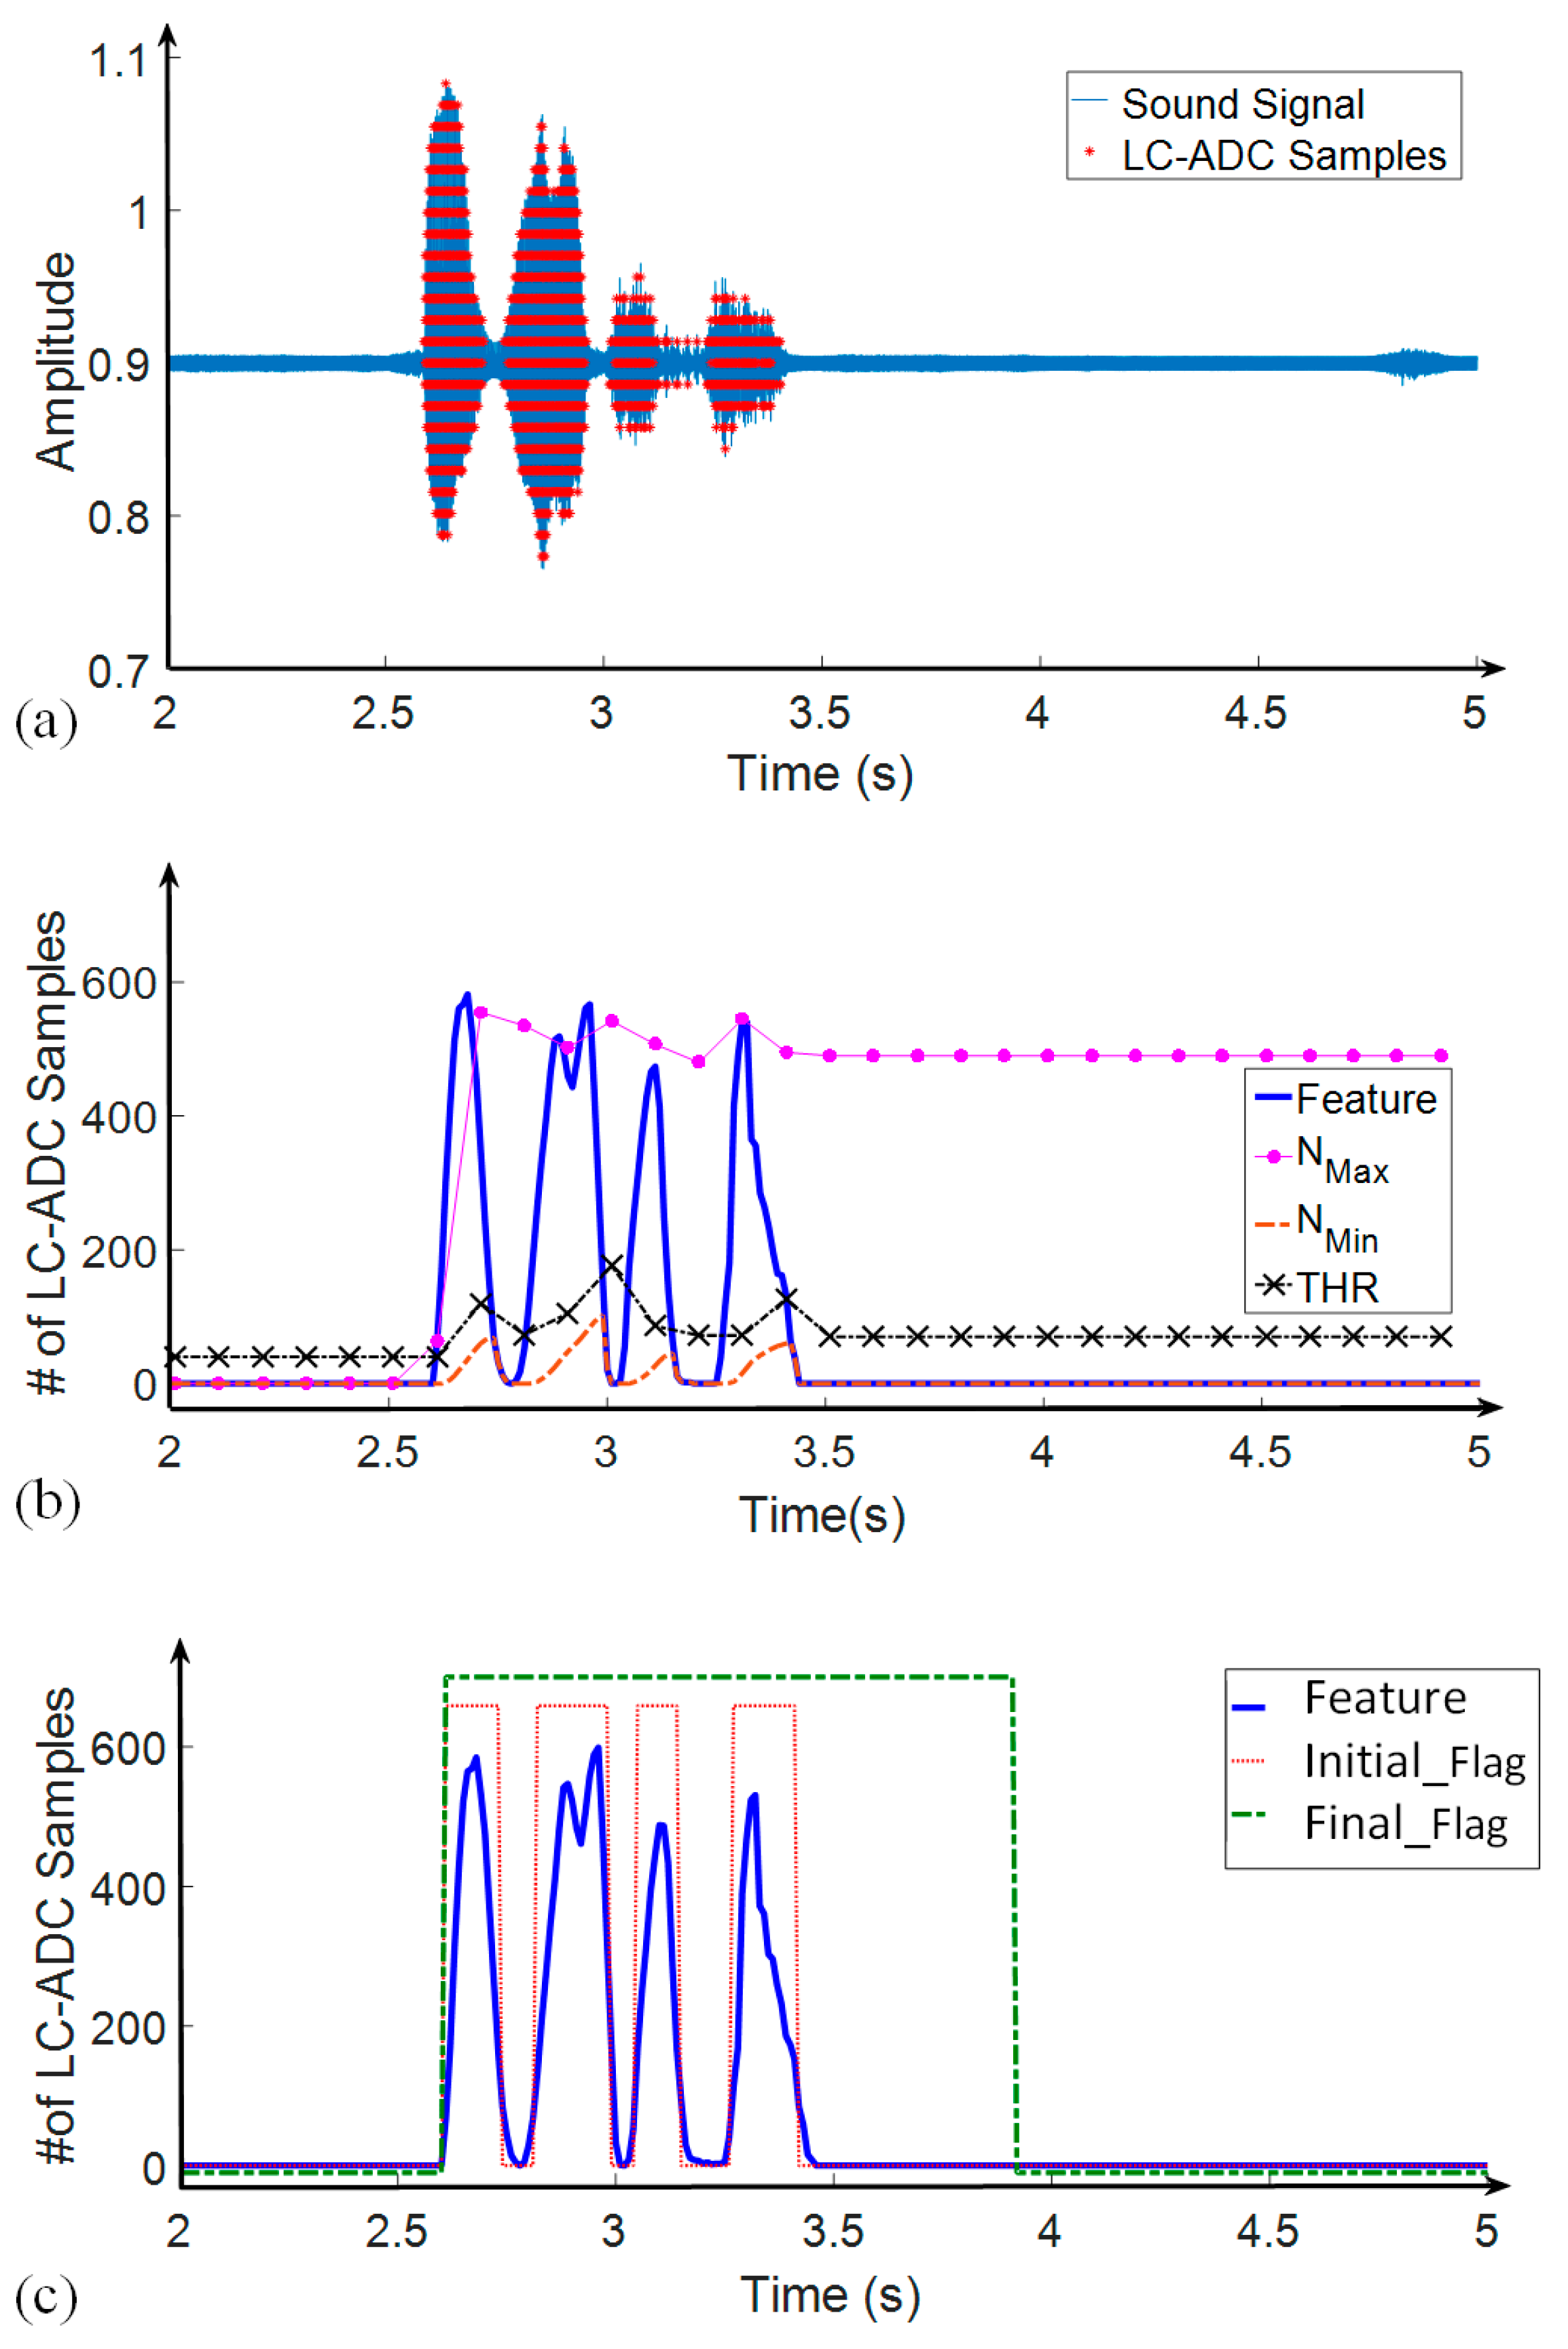
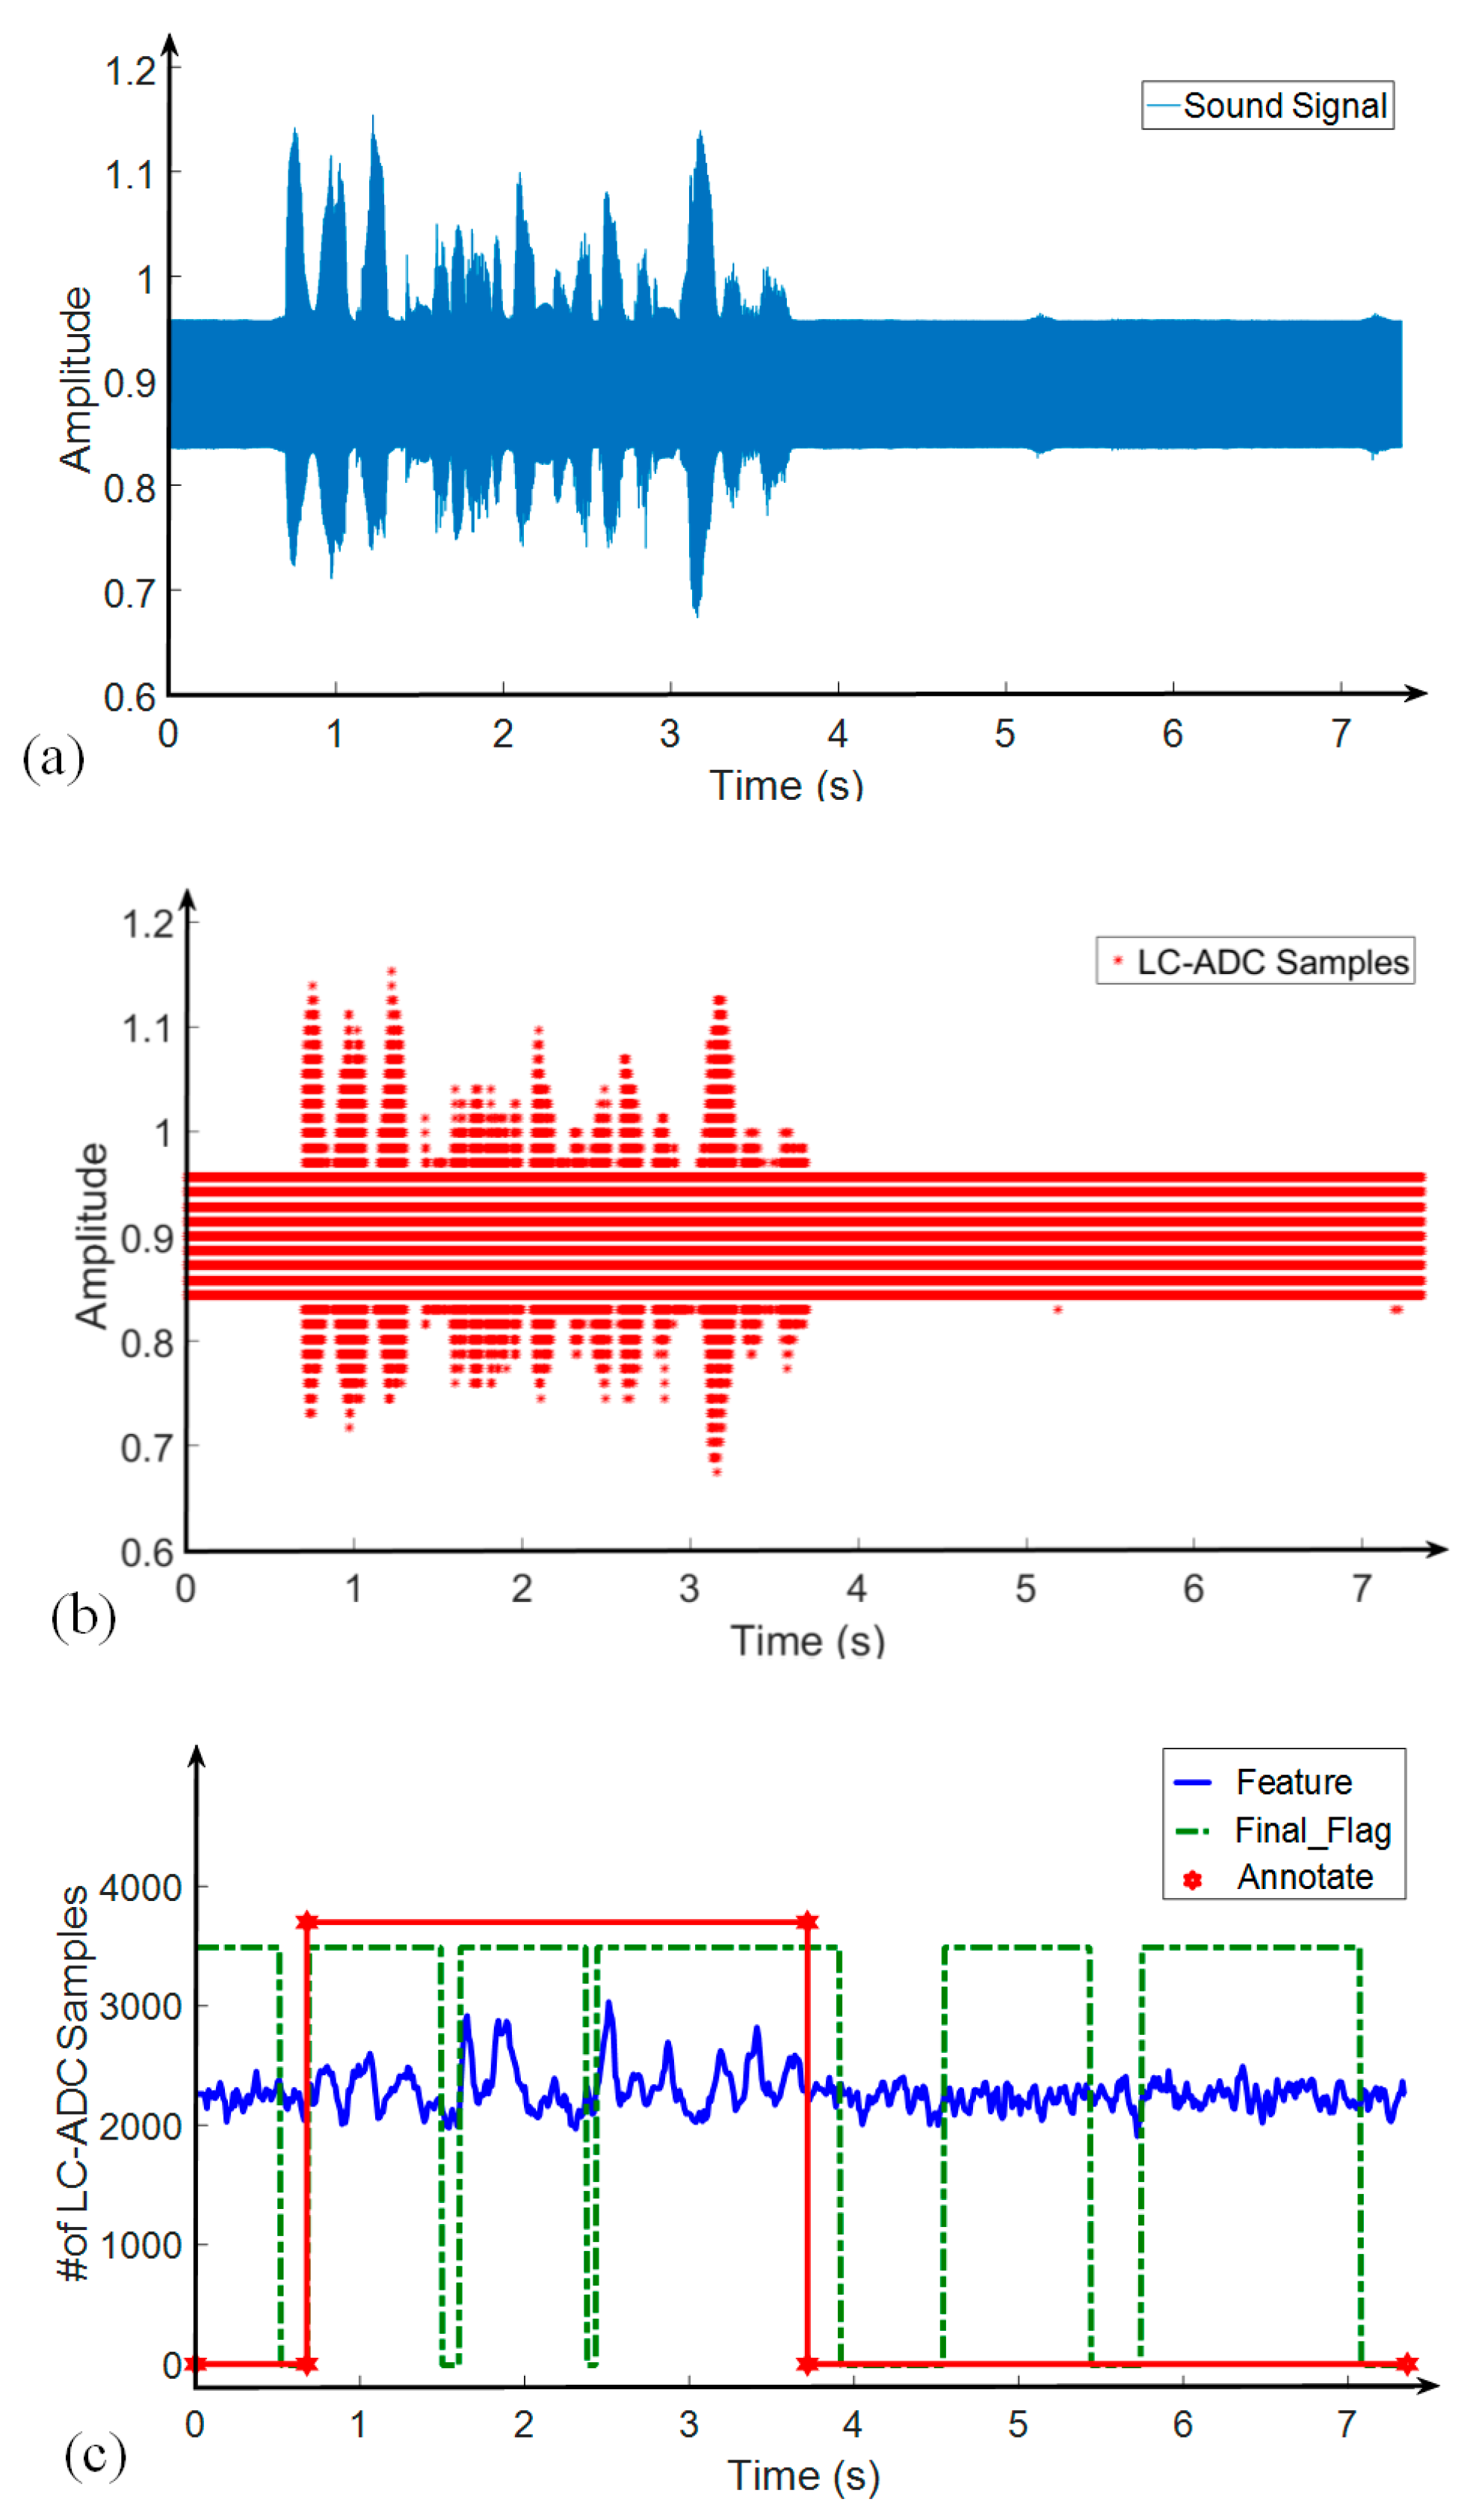
3.2. Proposed VAD Algorithm

Figure 5 shows the block diagram of the proposed VAD algorithm. As the first step, the audio signal passes through the LC-ADC. The Token signal provided by the LC-ADC is applied to the feature-extraction block. The feature provided by this block is applied to both threshold calculation and decision blocks.
Among several structures, the appropriate structure to implement the LC-ADC can be selected according to the characteristics of the input signal, in which the usual compromise between speed, accuracy, and power consumption is also considered [29,30]. The block diagram of the LC-ADC, including an input audio signal and LC-ADC output samples, is shown in Figure 6 [28]. This block diagram represents a conventional fixed-window LC-ADC, which is one of the simplest LC-ADC structures and consumes a low power. In this structure, a one-bit DAC tracks the input signal and generates VFold that is compared with VH and VL using comparators. Any level crossing activates the logic block. The logic block generates UD, showing the direction of the input signal along with the Token, which indicates the level-crossing occurrence. The Token is sent as an input signal to the feature extraction block. As shown in Figure 6, by setting the proper values for M and K, enough samples are taken from the voice parts of the signal, while a very small number of samples are taken from the inactive (silent) parts.
A flowchart of the rest of the VAD system, containing feature extraction, adaptive threshold calculation, and decision blocks, is given in Figure 7. From the hardware implementation side, the extracted features and detection algorithm should be as simple as possible to lead to low power consumption and reduce the occupied silicon area of the hardware. On the other hand, simple algorithms have lower accuracy. Therefore, there is a compromise between power consumption and accuracy.
This work represents a balance between power consumption and accuracy by extracting an appropriate feature for the detection algorithm. The feature used in this study is only the number of LC-ADC output samples in a moving time window. As a result, this structure needs a counter in the first stage to count the number of samples at certain time intervals. In every 10 ms time window (frame), the counter counts the number of LC-ADC output samples (NToken). Then, NToken is sent to a shift register, and the counter is reset. The values stored in the shift register (the count value of four successive windows) are added together, and the resulting value is sent to the next block as a feature. This process makes 40 ms moving windows with a 30 ms overlap. As previously stated, only the number of samples within 10 ms is saved, not the sample itself. Only four consecutive NToken values are enough to form the feature. Therefore, the proposed algorithm does not store any samples, and it does not need memory for this purpose, which is one of the advantages of the proposed system. It is worth noting that the 10 ms frame is selected based on References [1,13,22] that use 10 ms frames in their VAD algorithms. In order to optimize the size of the moving window in the proposed algorithm, the length of this window is swept from 20 to 60 ms, and the detection accuracy parameters are calculated. The results show that the optimal value for the moving window is 40 ms.
Figure 8 presents the circuit implementation of the proposed VAD feature extraction block in more detail. It consists of a counter, a 4 × 13-bit shift register, and an adder. In this circuit, a 13-bit counter is designed. It starts counting Token pulses during a 10 ms interval. Then, the value is stored in a 4 × 13-bit shift register, and the counter is reset. There is a 30 ms overlap between two adjacent moving windows shown in Figure 9. Accordingly, the registered values of NToken are added together in the next part of the feature extraction circuit. This obtained value (Feature) is sent to the next block, which is the adaptive threshold calculation, as seen in Figure 7.
The decision block compares the Feature with a threshold (THR) to make a decision. Speech cannot be identified by employing a fixed threshold since factors including the sentence, speaker, audio signal characteristics, noise type, and noise level are not constants. Adaptive thresholding helps to track time-varying changes in the acoustic environments (e.g., the environmental background noise) and hence gives a more reliable voice detection result.
Therefore, this part of the algorithm involves calculating and updating the threshold value. Similarly, the same limitation of simplicity in the calculation process considered for the previous block must be observed for the threshold calculation and update block. The decision rules can also be based on statistical models that, despite their high accuracy, are not used in the hardware implementations because of their complexity. With these explanations, this algorithm has three variables (NMin, NMax, THR), which are initially set. NMin and NMax, store the minimum and maximum value of the Feature and are adaptively updated by the algorithm in each frame. First, NMin and NMax are compared with the Feature value of the window under study. If the value of the Feature is more than NMax, then the algorithm updates the value of NMax with the value of the Feature. Similarly, if the Feature value is smaller than the NMin, then the algorithm updates the NMin value with the Feature value. Otherwise, if the above does not happen, NMax and NMin retain their previous values, and finally, the THR value is updated from the following equation in each frame:
THR =   Coeff 1 ×   N Max + N Min + N C
in which Coeff1 and NC are constants. The NC sets an initial value for the THR. The parameters NMax and NMin are slightly decreased and increased for each frame, respectively, and are defined by:
N Max =   N Max Coeff 2 × Feature ,
N Min =   N Min + Coeff 2 × Feature
To implement the hardware without using a multiplier and only by removing LSB bits (truncation), the values of the constants Coeff1 and Coeff2 were selected to be 1/16 and 1/64, respectively. These values are optimized by simulating the algorithm on the TIMIT database [20], as explained below. Coeff1 and Coeff2 should be less than one to provide smooth changes of THR and powers of two to simplify the hardware implementation. Therefore, Coeff1 and Coeff2 were set to be negative powers of two. The variables NMax, NMin, and THR are updated by these coefficients. Milder changes of NMax and NMin are desired for more control over THR variations. Hence, Coeff1 and Coeff2 are swept from 1/2 to 1/512, and the detection accuracy parameters are calculated. The results indicate that the optimal point for this design is equal to Coeff1 = 1/16 and Coeff2 = 1/64. It is worth noting that the algorithm is not very sensitive to the values of these coefficients.
Figure 10a depicts the audio signal corrupted by 10 dB SNR white noise and the LC-ADC samples. Feature, NMax, NMin, and THR are plotted in Figure 10b. It can be seen how the proposed Feature tracks the input signal variations and updates the THR value.
The decision block receives the Feature and THR and compares them window-by-window. If the value of the Feature in each window is greater than the THR, the Initial_Flag and Final_Flag of the algorithm are set to logic one. Otherwise, the value of Initial_Flag is set to logic zero. However, the boundary between speech and non-speech is not clear. There may be some interruptions in the sentence as well, which the algorithm mistakenly recognizes as non-speech. This leads to fluctuations in the Initial_Flag shown in Figure 10c. To solve this problem, a 6-bit counter named Inside_Speech is defined. At the start of the algorithm, both Initial_Flag and Final_Flag are logic zero. If Initial_Flag changes to logic one, Final_Flag also becomes logic one. Final_Flag becomes logic zero only when Initial_Flag changes to logic zero and this state is maintained for 50 consecutive windows (500 ms). The advantage of applying this method, shown in Figure 10c, is that it allows a sentence to be fully and continuously recognized and ignores the many zeros and ones of the Initial_Flag that are no longer needed. It also has another advantage that occurs at the end of sentences, through which in most cases, the signal energy and, by its nature, the signal amplitude are low. In this case, applying a 500 ms window prevents the last part of the sentence from being lost. The downside is that for speech signals that have enough energy at the end of the sentence, an extra part is selected from the non-speech part.

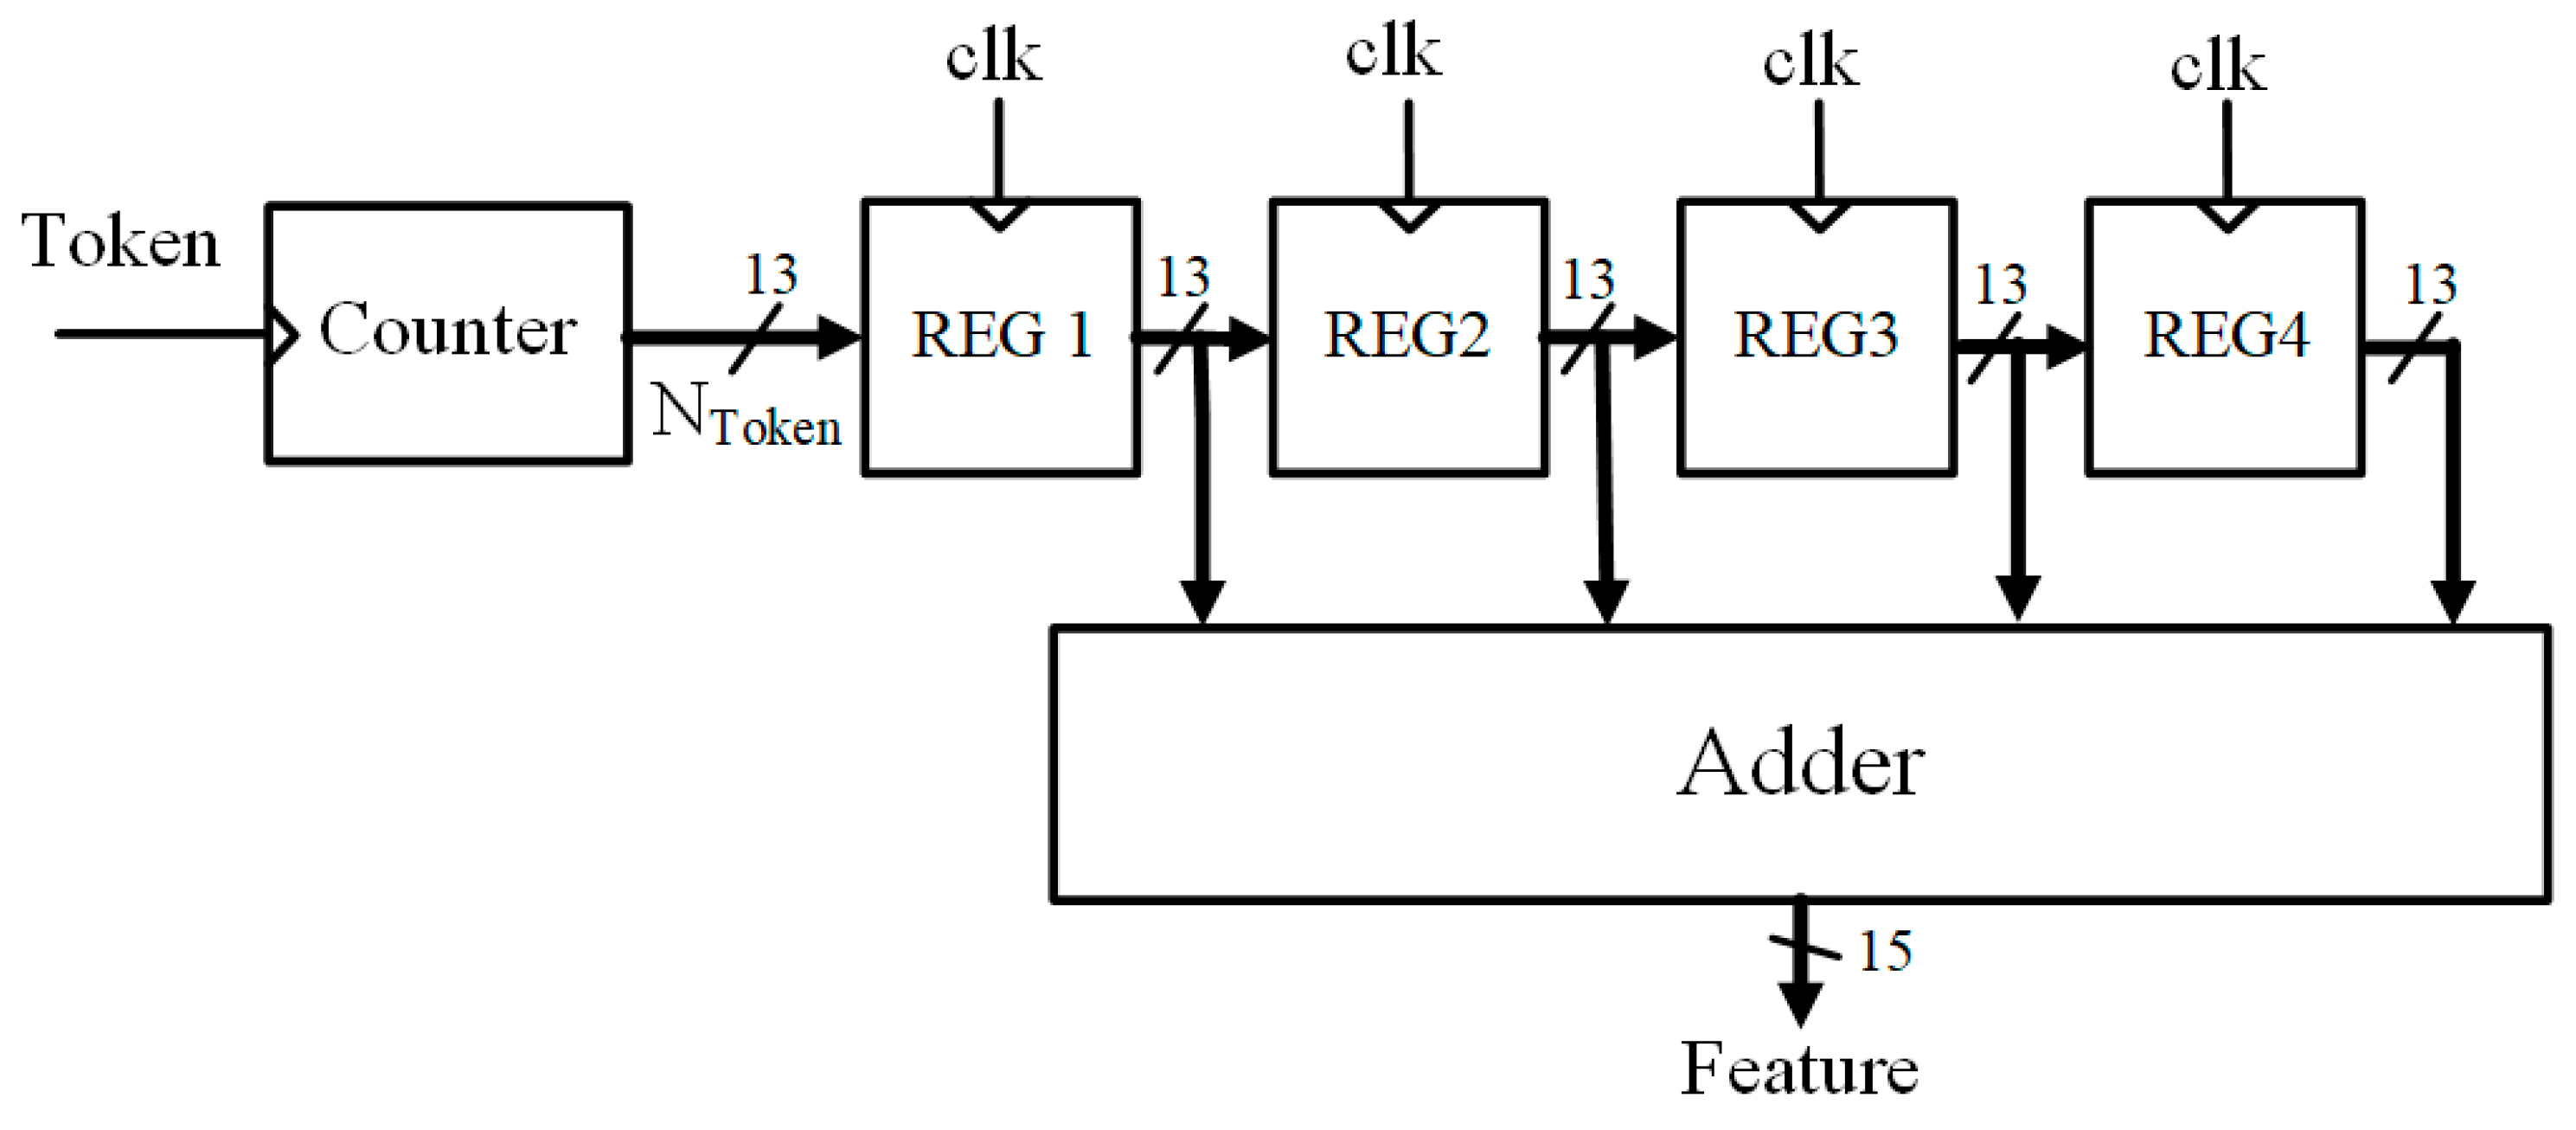
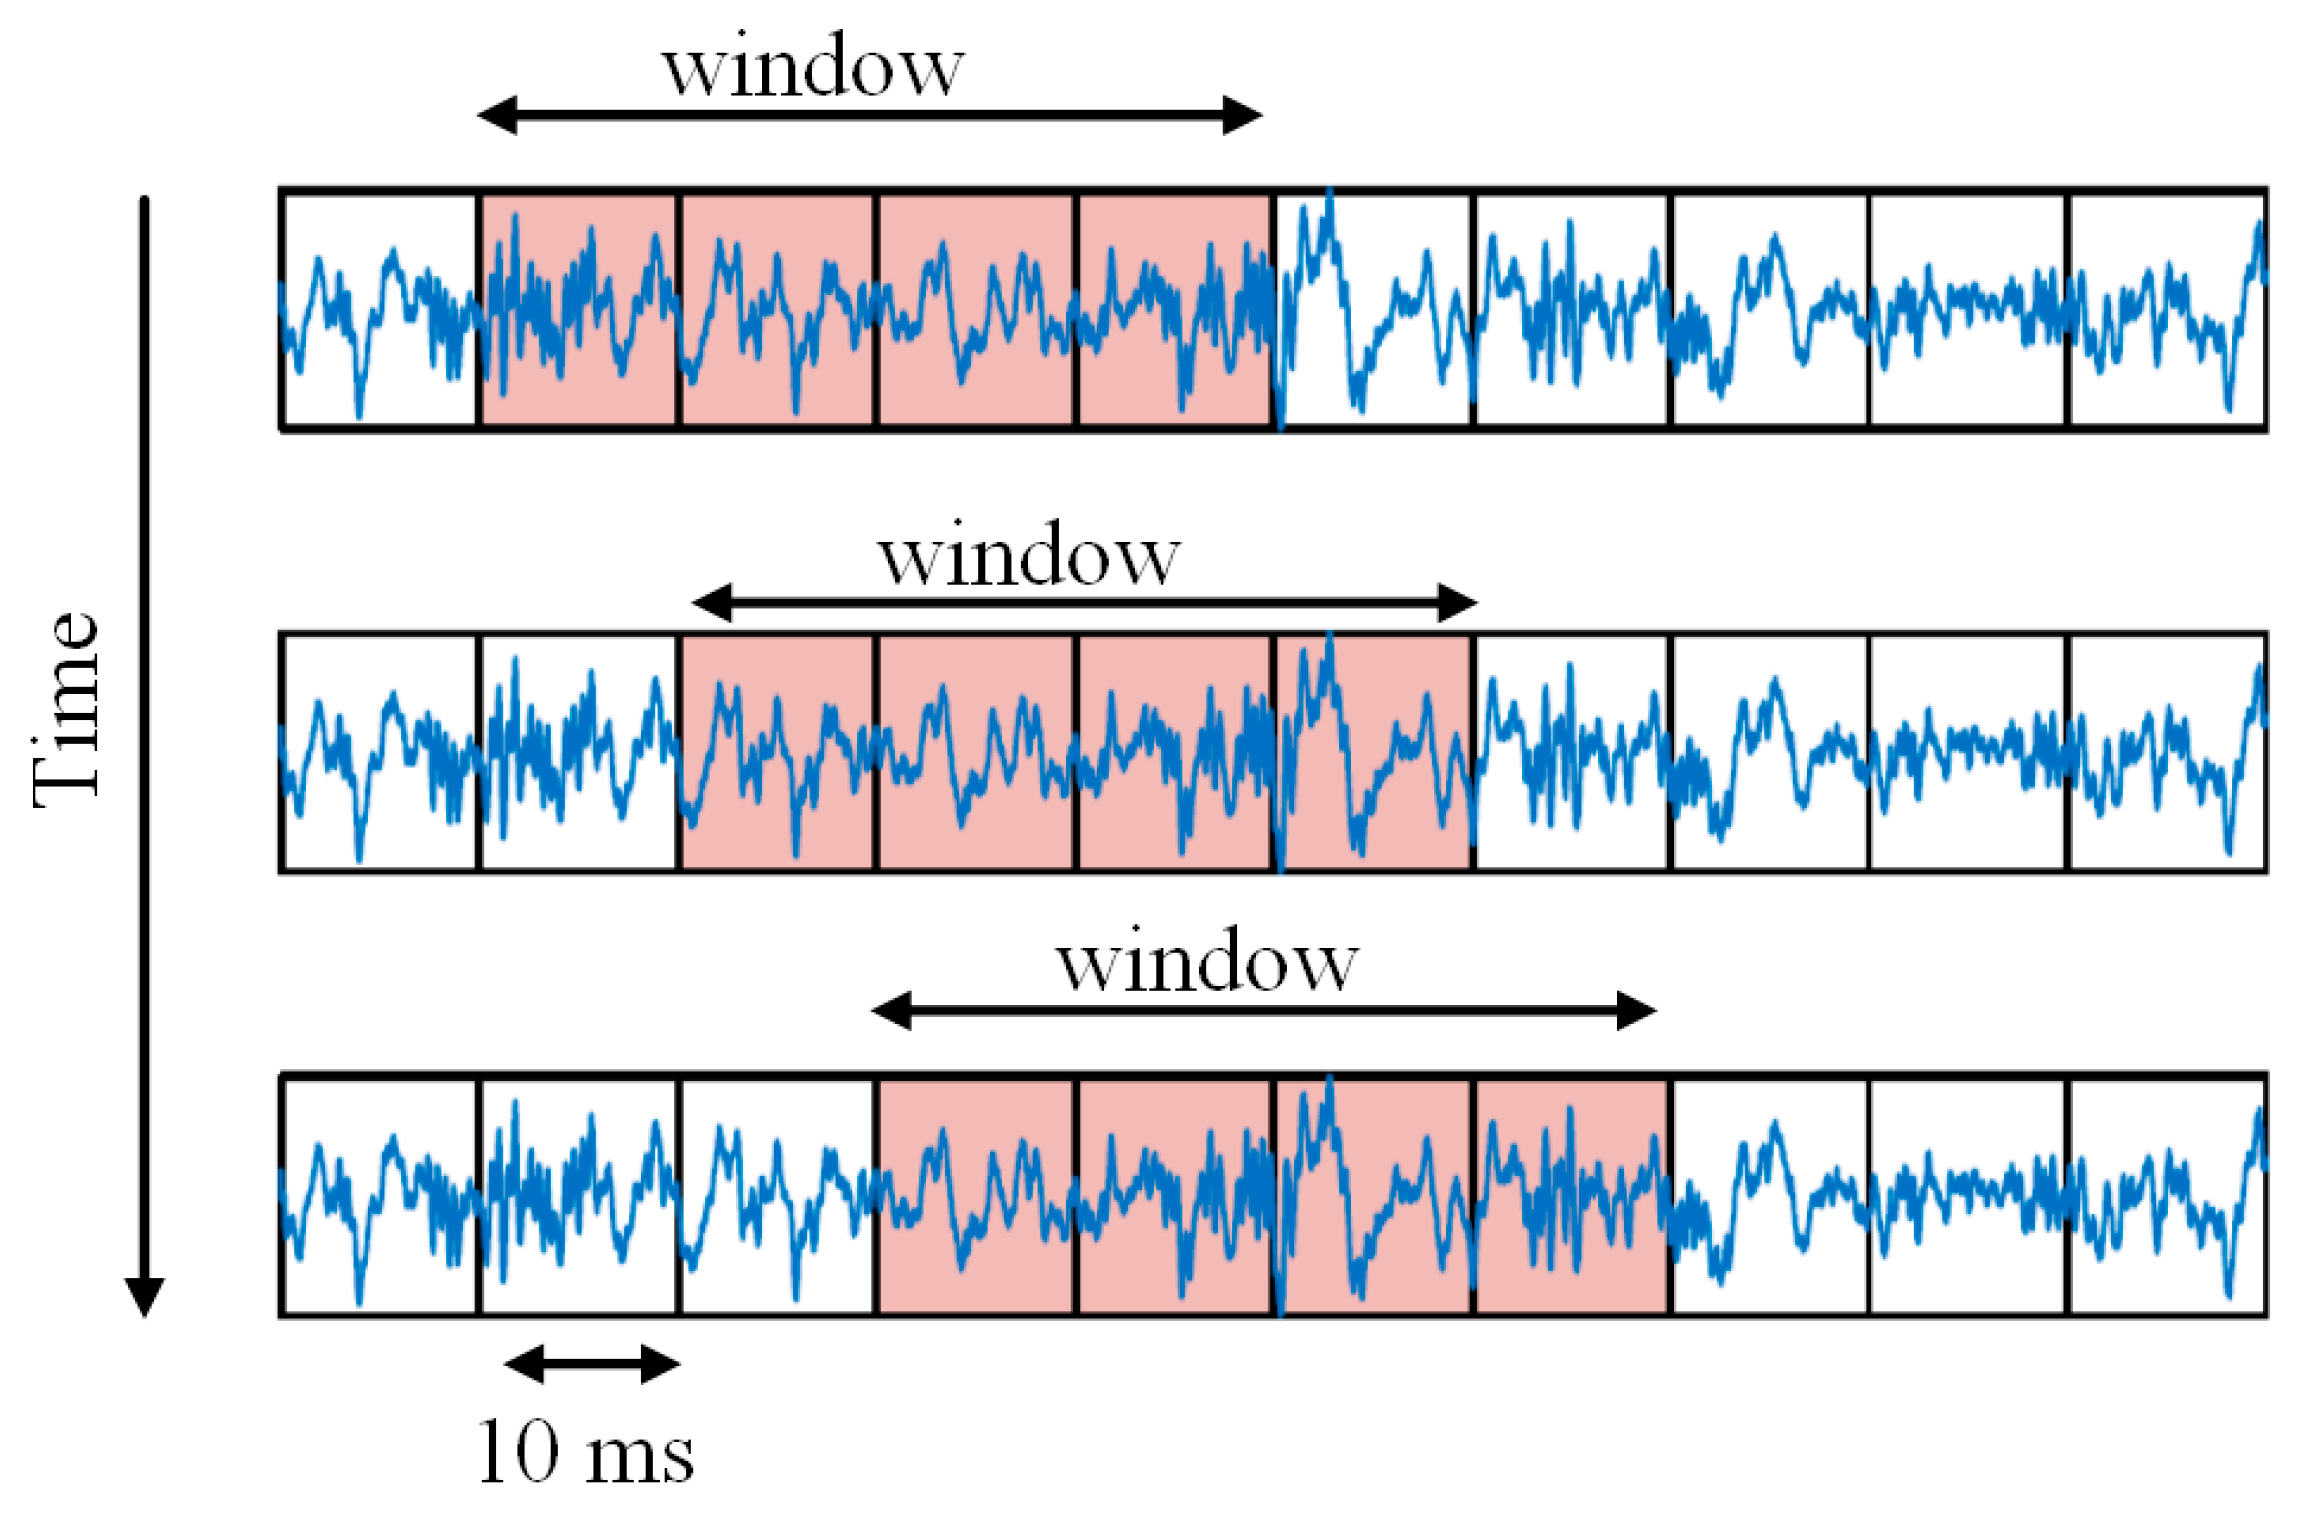
3.3. Setting of the Proposed Circuit Parameters

The performance of the proposed VAD algorithm was evaluated by comparing the Final_Flag with the annotations to calculate the evaluation parameters, which are CORRECT, speech hit rate (HR1), and non-speech hit rate (HR0), defined as [31]:
HR 1 = N 1 , 1 N 1 ref  
HR 0 = N 0 , 0 N 0 ref  
CORRECT = N 1 , 1 + N 0 , 0 N 1 ref + N 0 ref  
where N 1 ref and N 0 ref are the speech and non-speech numbers of frames (or time intervals) in the database, respectively. N 1 , 1 and N 0 , 0 are the speech and non-speech numbers of frames (or time intervals) that are correctly classified by the algorithm, respectively. Therefore, HR1 and HR0 indicate the extent to which the VAD system correctly identifies the speech and non-speech parts of the signal, respectively. It is necessary to mention that there is usually a trade-off between these two metrics, and an increase in one may lead to a decrease in the other. In most applications, increasing HR1 is more substantial than increasing HR0 [32]. Thus, to obtain a better metric to compare the two different VAD algorithms, a total performance metric (CORRECT) as a weighted mean of HR1 and HR0 is used. It generally expresses how successful the algorithm is in distinguishing between speech and non-speech.
According to the nature of the algorithm, to ensure low power consumption, it is worthwhile to achieve the required accuracy with fewer bits (M) in LC-ADC. Furthermore, the number of samples increases exponentially when the resolution of level-crossing sampling increases. In order to determine a proper value of M for VAD, 168 sentences of TIMIT [20] with 12 different noise types at 4 SNR levels (−5, 0, 5, 10 dB) from the Noisex 92 database [33] were applied to the proposed LC-ADC-based VAD, which was modeled in MATLAB with various values of M and K. A variety of signal amplitudes and slopes are considered in the selection of database signals. The noises include white, babble, pink, factory, Volvo, tank, jet cockpit, HF channel, F16, car, machine gun, and military vehicle. These noises were added to the TIMIT database at four SNR values between −5 and 10 dB (stepped by 5 dB). Using the LC-ADC output data, the accuracy of distinguishing speech and non-speech parts of the signal (CORRECT) was calculated and plotted in Figure 11a versus K for different values of M. In order to obtain the maximum accuracy rate (CORRECT), which is 85% based on Figure 11a, M should be equal to or greater than 6 bits for K ≥ 2 LSBs. It should be noted that, in hardware-implemented VAD systems, the accuracy rate is usually around 90% for a 10 dB SNR [1,2,3,4,12,13]. Since in this design an SNR of −5 to 10 dB is considered, the accuracy rate of 85%, which is slightly lower than 90%, is adequate.
Figure 11b shows the average sampling frequency (favg) of the TIMIT database for the same values of M and K. As favg rises, the power consumption of the LC-ADC and VAD processors also rises. Increasing favg increases the number of Feature bits and the area of the VAD circuit. It is clear that the average sampling frequency of a 6- or 7-bit LC-ADC at the same K value is much lower than that of its 8-bit counterpart. Considering CORRECT and favg, the best design points are {M = 7, K = 2, 3} and {M = 6, K = 2}. Figure 11c depicts the algorithm speech hit rate (HR1), which is also important in VAD applications. Although {M = 6, K = 2} has the same CORRECT and lower sampling rate in comparison to {M = 7, K = 3}, the samples at the active portions of the speech signal are too sparse, especially for low-amplitude signals, which affect speech detection and so decrease HR1. As a result, since higher values of K are desirable to eliminate noise and lower the average sampling frequency, the case {M = 7, K = 3} is the preferred design point. In this case, the CORRECT value is 85%, the HR1 value is 91%, and the average sampling frequency over the entire database is 1718 Hz. This value is much lower than the sampling rate of most voice recognition software and hardware, in which a sampling rate of 16 kHz is used [1]. Detailed evaluation results of the proposed algorithm are discussed in the next section.
To optimize the proposed algorithm parameters, including Coeff1, Coeff2, NC, and the length of the moving window, 20 audio signals with a variety of signal amplitudes and slopes, including all 10 sentences from different dialects, were selected. Twelve different noise types from the Noisex 92 database were added at 4 SNR levels (−5, 0, 5, 10 dB) to these 20 audio signals. Hence, the algorithm parameters were optimized for 12 × 4 × 20 = 960 audio signals.

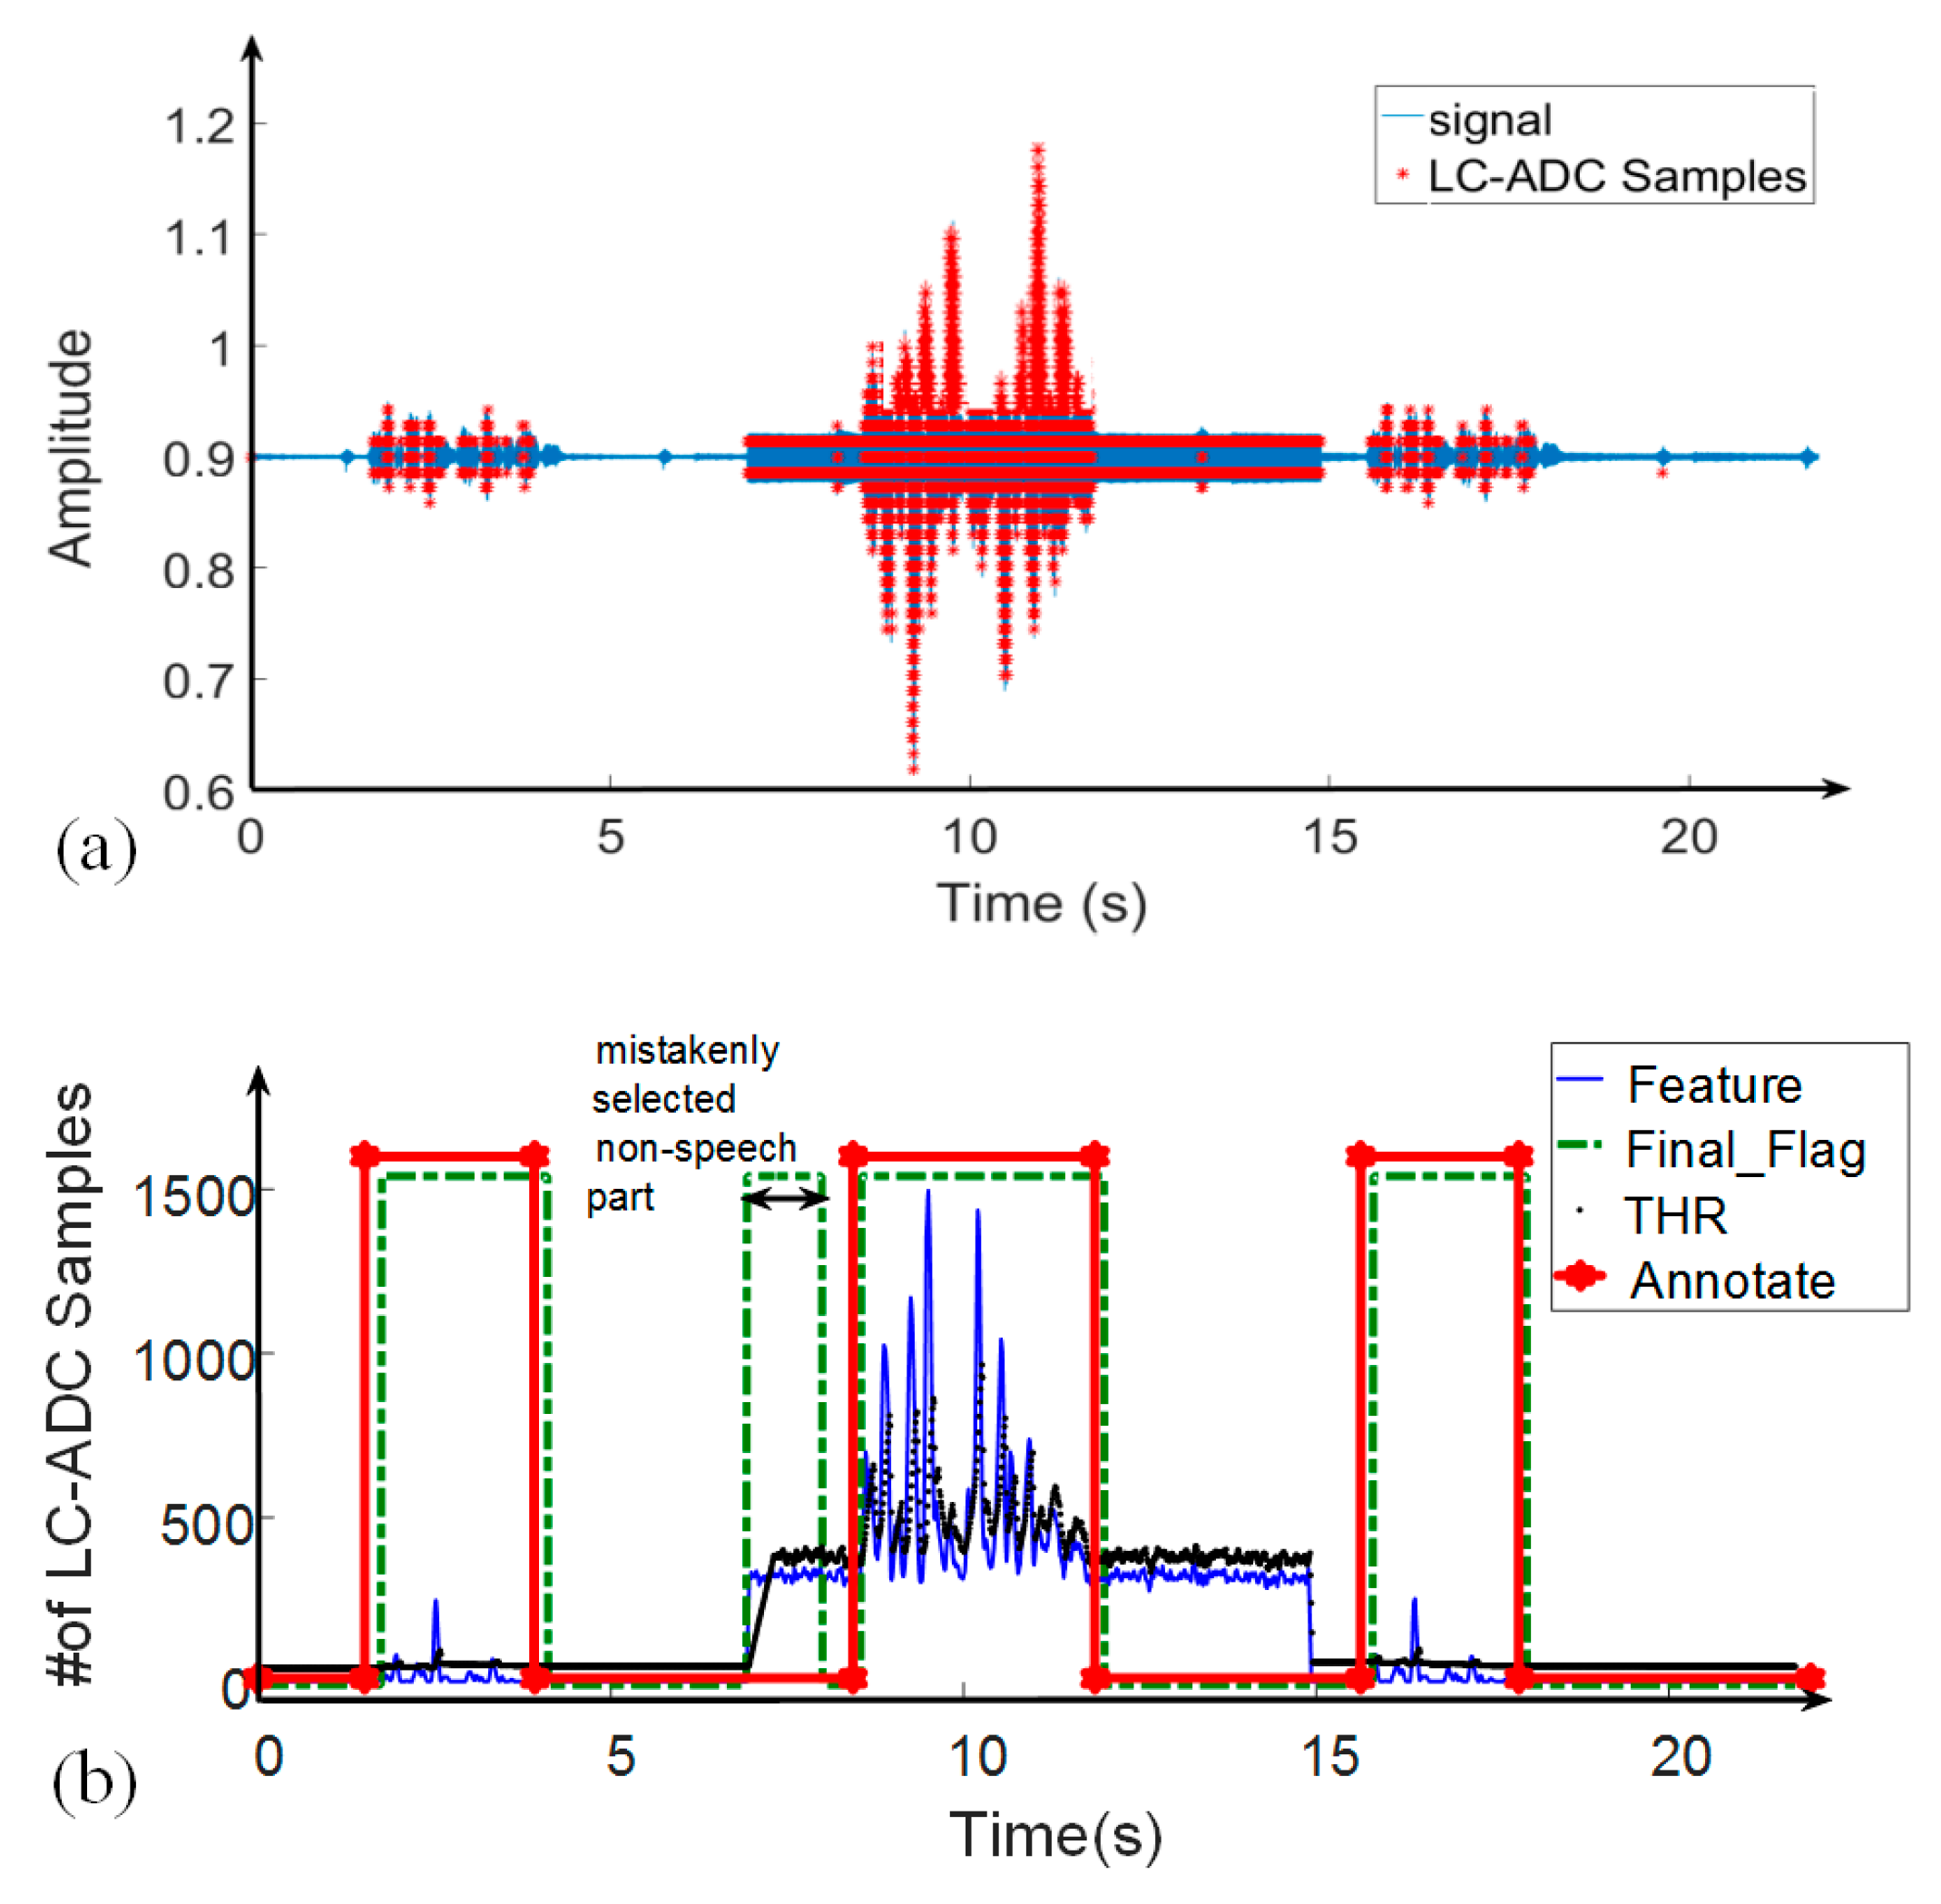
4. Behavioral Simulation Results of the Proposed Algorithm

The proposed VAD system was modeled and simulated in MATLAB. To test the algorithm in different noise conditions, 12 different noise types from the Noisex 92 database [33] at four SNR values between −5 and 10 dB (increased by 5 dB) were applied to the TIMIT database. Statistical observations show that a typical conversation involves 60% silence and 40% speech [21]. Since the database used in this article has 90% speech and 10% silence, we randomly added the total value of four seconds of silence at the beginning and end of each input audio, as performed in many other studies [34].
The experiments were conducted on 168 sentences of TIMIT with 12 different noise types at four SNR levels (−5, 0, 5, 10 dB). A variety of signal amplitudes and slopes were considered in the selection of database signals. The performance of the proposed algorithm was evaluated with the evaluation parameters for each SNR level over all types of noise, shown in Table 1. The average results in Table 1 belong to 8064 audio signals, which include all the sentences from different dialects contaminated with various types of noise at various levels of SNR.
According to Table 1, an average accuracy detection (CORRECT) of 85.85% was obtained for the database. This performance is comparable to the current voice activity detection algorithms, the performance of which is achieved with very large data samples, using pre- and/or post-ADC filtering, and with sophisticated detection algorithms [1,2]. As shown in Table 1, the algorithm has a CORRECT of more than 86% for SNR 0 dB, but if the SNR is less than −5 dB, this algorithm will not perform well in distinguishing between speech and non-speech. Although for SNR of −5 dB the CORRECT value decreased to 73.7%, the algorithm still obtained an appropriate value of 93.9% for HR1, so the beneficial information of the speech part was not lost. Nevertheless, the low value of HR0 indicates that some additional samples of the non-speech part were processed. As a result, the optimal performance of this algorithm occurred for SNR ≥ −5 dB, and if the SNR is less than this value, accuracy is lost and the speech and non-speech parts cannot be correctly distinguished. In the following, the algorithm performance in the critical cases where the noise exceeds −10 dB SNR or the signal amplitude becomes very low is examined in detail.
High-noise-impregnated audio signals (e.g., a −10 dB SNR) suffer from high-amplitude and high-frequency noise. In the absence of filtering, some noise signals cannot be removed with the selected value of K. Therefore, some noise signals are recognized as speech. As a result, the majority of the signal is recognized as speech, resulting in the dramatic reduction in the HR0 and CORRECT in this situation, as illustrated in Figure 12. The constant value of K was tuned to reach the best result over 168 selected signals from the database, which also contains some signals with very low amplitude. This problem can be solved by filtering the input signal or by adaptively adjusting the value of K based on the amplitude of the input signal as future improvements. For example, by increasing the value of K from 3 to 10, the values of HR0, HR1, and CORRECT improved from 22.7%, 97.3%, and 53.5% to 88%, 98.7%, and 92.4%, respectively, for the signal in Figure 12.
The enormous variation in signal amplitude between signals in the TIMIT database is the other element that has an impact on the performance of the suggested algorithm. Database signals, for instance, can have an amplitude that ranges from one-fifth of the full-scale range to a value that is close to the full-scale range. The average amplitude variation of the whole TIMIT database is actually only one-third of the full-scale range. Since the LC-ADC specifications (M and K) are assumed to be fixed and tuned for the best performance over the entire database, the low amplitude means the ADC takes fewer samples. Figure 13 illustrates an example of such a case. The figure shows that the speech part is not fully identified because of the samples’ deficiency due to a low-amplitude signal. Better results can be achieved by adjusting the amplitude of the input signals with an automatic gain control before applying them to the ADC or by applying small values of K for low-amplitude input signals as future improvements. For example, if the amplitude of the speech signal in Figure 13 is multiplied by 1.9 before applying it to the LC-ADC to fit the full-scale range, HR1 and CORRECT increase from 49% and 81% to 86% and 91%, respectively, for this signal.
The accuracy can be further improved, but additional circuitry is required to adaptively adjust other parameters such as K and M, to use a complicated adaptive threshold, or to adjust the analog signal gain adaptively. They are all at the expense of higher complexity, higher power consumption, and a larger area. Since our goal for the proposed VAD system is to be able to detect speech as an always-on device, the proposed algorithm strikes a balance between power and performance.
Three audio sentences were placed in a row to provide difficult conditions for testing the algorithm. As depicted in Figure 14a, two low-amplitude sentences of the database were placed as the first and third sentences, which were impregnated with white noise and had SNRs equal to 10 and 5 dB, respectively. A high-amplitude sentence of the database was also present with white noise and an SNR equal to 0 dB in the middle. The purpose of this arrangement is to investigate the performance of the algorithm in tracking consecutive speech with loud and low voices. As can be seen in Figure 14b, nearly all the samples were taken from the speech part, and only a small portion of the silent part of the noisy high-amplitude signal was mistakenly selected. Figure 14b demonstrates that the proposed system correctly detects the speech part of the signal, even in one of the most difficult situations, where the signals are placed one after the other with a large variety of amplitudes and SNRs.

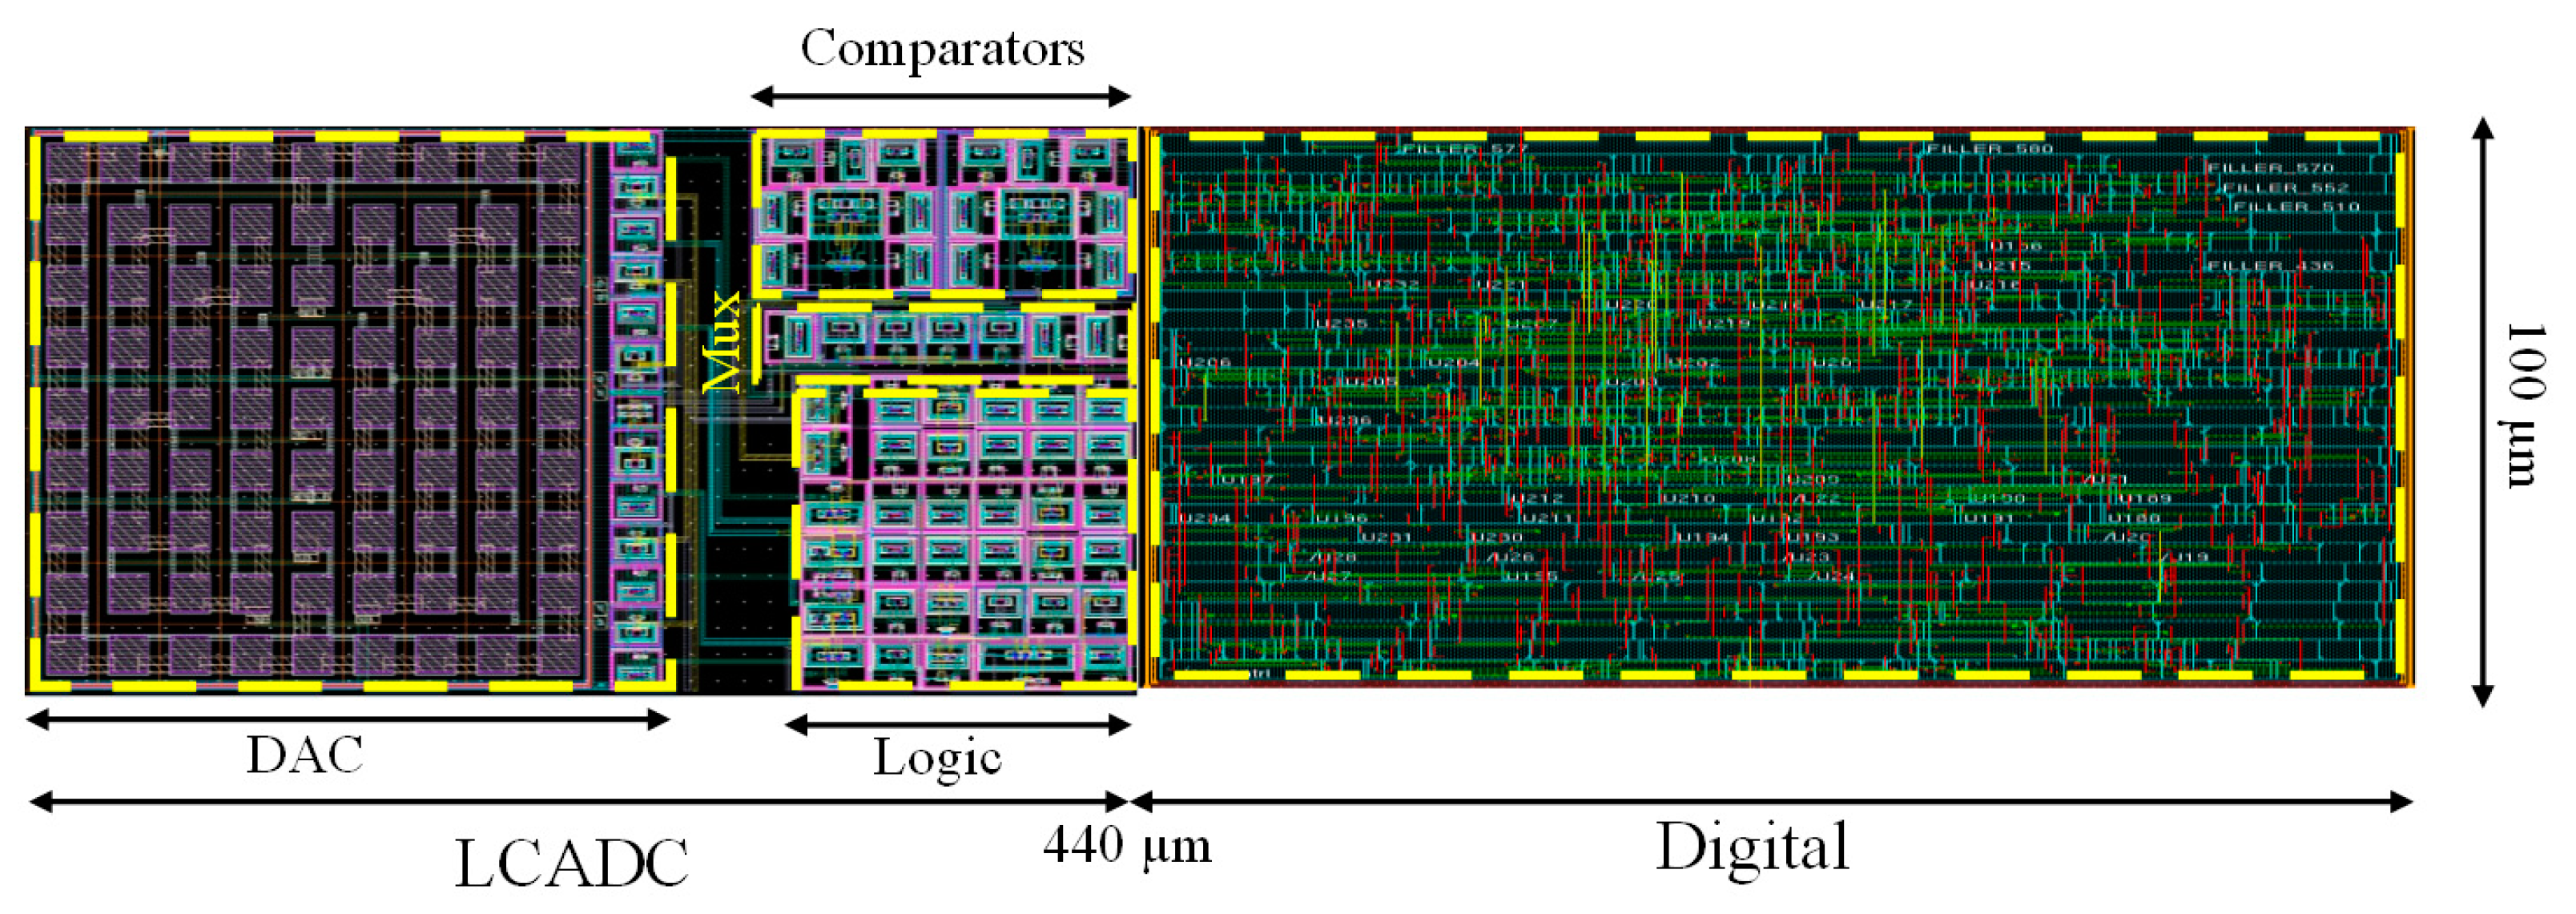
5. Circuit Implementation and Performance Comparison

To illustrate the power efficiency of the proposed algorithm, the entire system, including the 7-bit LC-ADC and the proposed digital processing circuit of the VAD algorithm, was implemented in 0.18 µm CMOS technology using a 1.8 V supply voltage. The Synopsys Design Compiler was used for the synthesis of the processor logic as well as its power estimation. Audio signals from TIMIT were used as a test bench for generating switching activities in power estimation. Post-layout simulation was applied to show the effectiveness of the proposed system in reducing the average sampling rate and power consumption. The post-layout results show that the LC-ADC and the processor consume 293.7 and 100.9 nW, respectively. Table 2 reports the power consumption of the sub-blocks used in the proposed VAD. The power consumption in the digital part is dominated by leakage power, which can be further reduced by using low-power standard-cell libraries. The layout of the implemented circuit is shown in Figure 15. The digital core occupies a 0.024 mm2 silicon area, and the total area of the VAD system is 0.044 mm2.
For the M = 7 bits LC-ADC with K = 3 LSBs, the average sampling frequency (the ratio of the LC-ADC output samples over the total simulation time) is 1718 Hz, which is 9.31 times lower than the uniform sampling rate that proves the advantage of using the level-crossing converter. By reducing the average sampling frequency, system activity is decreased. This results in significant dynamic power reduction in comparison with the Nyquist sampling systems. Most conventional algorithms perform all computations for each sample so that the processing rate for these parts is equal to the sample rate. In the proposed method, the filtering function is integrated inherently inside the LC-ADC operation. This means that using an additional filter for pre-processing is no longer necessary. In addition, the proposed algorithm has simple implementation and achieves acceptable performance through the TIMIT database. Another advantage of this algorithm is that no samples are stored in the proposed algorithm. Thus, it does not need memory for this purpose. Finally, the processing blocks only include shift registers, adders, and comparators. In the proposed algorithm, multipliers and other complex circuits such as FFT are not used. This results in an extremely low-power implementation of the proposed VAD system, compared to many reported high-accuracy VAD algorithms that use complicated power-hungry processing circuitries and large amounts of memory [1,2].
The proposed algorithm was compared with the standard VAD systems, which have been widely employed as references for performance comparison. The comparison is shown in Table 3. Without the use of any special power reduction techniques such as low supply voltage or multi-threshold voltage, the power consumption of the proposed system is much lower than the traditional synchronous solutions, which makes it suitable for always-on tracking-input applications. Reference [1] demonstrates the best accuracy but consumes significant power (50 µW). The algorithm was implemented in 32 nm CMOS technology using multiple supply voltages and two different clock frequencies, all of which resulted in significant power saving. However, the reported power consumption is still about 500 × the power consumption of the proposed algorithm in this article. In [2], the VAD algorithm is implemented by extracting various features, which are energy, harmonicity, and modulation frequencies. The power consumption of the VAD circuit is reported to be at least 169.6 µ W in 65 nm CMOS technology. This value of power is about 400 × the power consumption of the proposed circuit, while the detection accuracy is comparable to the proposed algorithm. In [3], the amplifiers and bandpass filter in the analog feature extractor block are the most power-consuming blocks. While the design of [4] consumes the least power, it is worthwhile to also consider the large amount of silicon area occupied due to the use of neural networks and memory. Compared with [4], the area of the proposed VAD circuit is reduced by 398 × . In [4], the algorithm is only validated for a 10 dB SNR. However, achieving high accuracy at high noise levels is one of the most difficult challenges for VAD systems. In [12,13], the reduced supply voltages of 0.65 and 0.6 V are used in 180 nm CMOS technology. This may reduce the power consumption. Nevertheless, the power consumption of the proposed circuit at 1.8 V supply voltage is less than that of [13] and at the same level as in [12] while achieving a higher HR0. Generally, it can be seen that the proposed algorithm improves the speech detection rate (HR1) while keeping the quality of the non-speech detection rate (HR0), resulting in an overall improvement in detection. In order to make the comparison fair, in this table, the values of HR0 and HR1 are reported at an SNR of 10 dB. The proposed voice activity detection system is suited for high-performance battery-powered applications because of its excellent low power consumption and high accuracy.

6. Conclusions

A new voice activity detection algorithm based on level-crossing sampling to distinguish speech and non-speech parts of an audio signal is proposed. Using this sampling method significantly reduces the sampling rate and power consumption. The proposed algorithm provides acceptable accuracy on signals with different noise types and SNR levels. It is also much less complex than other algorithms, which makes it a suitable option for VAD hardware implementation. The system performance was evaluated using the TIMIT database over 12 noise types at −5, 0, 5, and 10 dB SNR with an accuracy rate of 85.85%, HR1 of 91.02%, and HR0 of 82.64% without any filtering requirements. The post-layout simulation result indicates that the total power consumption of the VAD system is 394.6 nW, which is less than many of its counterparts. The performance of the proposed algorithm might be enhanced by applying techniques such as adaptive resolution and K but at the cost of increased power consumption.

Author Contributions

Conceptualization, M.F., H.R.-D. and N.R.; methodology, M.F.; software, M.F.; validation, M.F., H.R.-D. and N.R.; formal analysis, M.F., H.R.-D. and N.R.; investigation, M.F. and H.R.-D.; data curation, M.F.; writing—original draft preparation, M.F.; writing—review and editing, H.R.-D., N.R. and H.A.; visualization, M.F., H.R.-D. and N.R.; supervision, H.R.-D. and N.R.; project administration, H.R.-D. and N.R. All authors have read and agreed to the published version of the manuscript.

Funding

This research received no external funding.

Data Availability Statement

Not applicable.

Conflicts of Interest

The authors declare no conflict of interest.

References

  1. Raychowdhury, A.; Tokunaga, C.; Beltman, W.; Deisher, M.; Tschanz, J.W.; De, V. A 2.3 nJ/frame Voice Activity Detector-Based Audio Front-End for Context-Aware System-On-Chip Applications in 32-nm CMOS. IEEE J. Solid-State Circuits 2013, 48, 1963–1969. [Google Scholar] [CrossRef]
  2. Price, M.; Glass, J.; Chandrakasan, A.P. A Low-Power Speech Recognizer and Voice Activity Detector Using Deep Neural Networks. IEEE J. Solid-State Circuits 2018, 53, 66–75. [Google Scholar] [CrossRef]
  3. Badami, K.M.H.; Lauwereins, S.; Meert, W.; Verhelst, M. A 90 nm CMOS, 6 mW Power-Proportional Acoustic Sensing Frontend for Voice Activity Detection. IEEE J. Solid-State Circuits 2016, 51, 291–302. [Google Scholar] [CrossRef]
  4. Oh, S.; Cho, M.; Shi, Z.; Lim, J.; Kim, Y.; Jeong, S.; Chen, Y.; Rothe, R.; Blaauw, D.; Kim, H.S.; et al. An Acoustic Signal Processing Chip with 142-nW Voice Activity Detection Using Mixer-Based Sequential Frequency Scanning and Neural Network Classification. IEEE J. Solid-State Circuits 2019, 54, 3005–3016. [Google Scholar] [CrossRef]
  5. Soares, A.D.S.P.; Parreira, W.D.; Souza, E.G.; do Nascimento, C.D.D.; de Almeida, S.J.M. Voice Activity Detection Using Generalized Exponential Kernels for Time and Frequency Domains. IEEE Trans. Circuits Syst. I Regul. Pap. 2019, 66, 2116–2123. [Google Scholar] [CrossRef]
  6. Alías, F.; Socoró, J.C.; Sevillano, X. A Review of Physical and Perceptual Feature Extraction Techniques for Speech, Music and Environmental Sounds. Appl. Sci. 2016, 6, 143. [Google Scholar] [CrossRef]
  7. Liu, B.; Wang, Z.; Guo, S.; Yu, H.; Gong, Y.; Yang, J.; Shi, L. An Energy-Efficient Voice Activity Detector Using Deep Neural Networks and Approximate Computing. Microelectron. J. 2019, 87, 12–21. [Google Scholar] [CrossRef]
  8. Bachu, R.G.; Kopparthi, S.; Adapa, B.; Barkana, B.D. Voiced/Unvoiced decision for speech signals based on zero-crossing rate and energy. In Advanced Techniques in Computing Sciences and Software Engineering; Elleithy, K., Ed.; Springer: Dordrecht, The Netherlands, 2010; pp. 279–282. [Google Scholar] [CrossRef]
  9. Sakhnov, K.; Verteletskaya, E.; Simak, B. Approach for Energy-Based Voice Detector with Adaptive Scaling Factor. IAENG Int. J. Comput. Sci. 2009, 36. Available online: https://www.iaeng.org/IJCS/issues_v36/issue_4/IJCS_36_4_16.pdf (accessed on 27 November 2022).
  10. Yang, M.; Yeh, C.H.; Zhou, Y.; Cerqueira, J.P.; Lazar, A.A.; Seok, M. A 1μW Voice Activity Detector Using Analog Feature Extraction and Digital Deep Neural Network. In Proceedings of the 2018 IEEE International Solid-State Circuits Conference-(ISSCC), San Francisco, CA, USA, 11–15 February 2018; Volume 61, pp. 346–348. [Google Scholar] [CrossRef]
  11. Croce, M.; Friend, B.; Nesta, F.; Crespi, L.; Malcovati, P.; Baschirotto, A. A 760-nW, 180-nm CMOS Fully Analog Voice Activity Detection System for Domestic Environment. IEEE J. Solid-State Circuits 2021, 56, 778–787. [Google Scholar] [CrossRef]
  12. Shi, E.; Tang, X.; Pun, K.P. A 270 nW Switched-Capacitor Acoustic Feature Extractor for Always-On Voice Activity Detection. IEEE Trans. Circuits Syst. I Regul. Pap. 2021, 68, 1045–1054. [Google Scholar] [CrossRef]
  13. Yang, M.; Yeh, C.H.; Zhou, Y.; Cerqueira, J.P.; Lazar, A.A.; Seok, M. Design of an Always-On Deep Neural Network-Based 1-μW Voice Activity Detector Aided with a Customized Software Model for Analog Feature Extraction. IEEE J. Solid-State Circuits 2019, 54, 1764–1777. [Google Scholar] [CrossRef]
  14. Ravanshad, N.; Rezaee-Dehsorkh, H. Level-Crossing Sampling: Principles, Circuits, and Processing for Healthcare Applications. In Compressive Sensing in Healthcare; Khosravy, M., Dey, N., Duque, C.A., Eds.; Elsevier Academic Press Inc.: Amsterdam, The Netherlands, 2020; pp. 223–246. ISBN 9780128212479. [Google Scholar] [CrossRef]
  15. Ravanshad, N.; Rezaee-Dehsorkh, H.; Lotfi, R.; Lian, Y. A Level-Crossing Based QRS-Detection Algorithm for Wearable ECG Sensors. IEEE J. Biomed. Health Inform. 2014, 18, 183–192. [Google Scholar] [CrossRef] [PubMed]
  16. Zhang, X.; Member, S.; Lian, Y. A 300-mV 220-nW Event-Driven ADC with Real-Time QRS Detection for Wearable ECG Sensors. IEEE Trans. Biomed. Circuits Syst. 2014, 8, 1–10. [Google Scholar] [CrossRef] [PubMed]
  17. Ravanshad, N.; Rezaee-dehsorkh, H. An Event-Based ECG-Monitoring and QRS-Detection System Based on Level-Crossing Sampling. In Proceedings of the 2017 25th Iranian Conference on Electrical Engineering, ICEE, Tehran, Iran, 2–4 May 2017; pp. 302–307. [Google Scholar] [CrossRef]
  18. Jimenez, J.; Dai, S.; Rosenstein, J.K. A Microwatt Front End and Asynchronous ADC for Sparse Biopotential Acquisition. In Proceedings of the 2017 IEEE 60th International Midwest Symposium on Circuits and Systems (MWSCAS), Boston, MA, USA, 6–9 August 2017; Volume 2017, pp. 503–506. [Google Scholar]
  19. Kurchuk, M.; Tsividis, Y. Signal-Dependent Variable-Resolution Clockless A/D Conversion with Application to Continuous-Time Digital Signal Processing. IEEE Trans. Circuits Syst. I Regul. Pap. 2010, 57, 982–991. [Google Scholar] [CrossRef]
  20. Garofolo, J.; Lamel, L.; Fisher, W.; Fiscus, J.; Pallett, D.; Dahlgren, N. The DARPA TIMIT Acoustic-PhoneticContinuous Speech Corpus CD-ROM; Technical Report NISTIR 4930; National Institute of Standards and Technology: Gaithersburg, MD, USA, 1993. [Google Scholar]
  21. Ma, Y. Efficient Voice Activity Detection and Speech Enhancement Algorithms Based on Spectral Features. Ph.D. Thesis, Tokyo Institute of Technology, Tokyo, Japan, 2014. [Google Scholar]
  22. Sohn, J. A Statistical Model-Based Voice Activity Detection. IEEE Signal Process. Lett. 1999, 6, 1–3. [Google Scholar] [CrossRef]
  23. Ryant, N.; Liberman, M.; Yuan, J. Speech Activity Detection on Youtube Using Deep Neural Networks. In Proceedings of the 14th Annual Conference of the International Speech Communication Association (INTERSPEECH 2013), Lyon, France, 25–29 August 2013; pp. 728–731. [Google Scholar]
  24. Ying, D.; Yan, Y.; Dang, J.; Soong, F.K. Voice Activity Detection Based on an Unsupervised Learning Framework. IEEE Trans. Audio Speech Lang. Process. 2011, 19, 2624–2632. [Google Scholar] [CrossRef]
  25. Kim, J.T.; Jung, S.H.; Cho, K.H. Efficient Harmonic Peak Detection of Vowel Sounds for Enhanced Voice Activity Detection. IET Signal Process. 2018, 12, 975–982. [Google Scholar] [CrossRef]
  26. Ariav, I.; Cohen, I. An End-to-End Multimodal Voice Activity Detection Using WaveNet Encoder and Residual Networks. IEEE J. Sel. Top. Signal Process. 2019, 13, 265–274. [Google Scholar] [CrossRef]
  27. Qaisar, S.M.; Niyazi, S.; Subasi, A. Efficient Isolated Speech to Sign Conversion Based on the Adaptive Rate Processing. In Proceedings of the 16th International Learning & Technology Conference 2019, Jeddah, Saudi Arabia, 30–31 January 2019; Volume 163, pp. 35–40. [Google Scholar]
  28. Teimoori, H.; Ravanshad, N.; Rezaee-Dehsorkh, H. Ultra-Low-Power Fully-Synchronous Level-Crossing Analog-to-Digital Converter for Biomedical Signal Acquisition. In Proceedings of the 2017 29th International Conference on Microelectronics (ICM), Beirut, Lebanon, 10–13 December 2017; pp. 1–4. [Google Scholar]
  29. Hou, Y.; Yousef, K.; Atef, M.; Wang, G.; Lian, Y. A 1-to-1-kHz, 4.2-to-544-nW, Multi-Level Comparator Based Level-Crossing ADC for IoT Applications. IEEE Trans. Circuits Syst. II Express Briefs 2018, 65, 1390–1394. [Google Scholar] [CrossRef]
  30. Ravanshad, N.; Rezaee-Dehsorkh, H.; Lotfi, R. A Fully-Synchronous Offset-Insensitive Level-Crossing Analog-To-Digital Converter. In Proceedings of the 2016 IEEE 59th International Midwest Symposium on Circuits and Systems (MWSCAS), Abu Dhabi, United Arab Emirates, 6–19 October 2016; pp. 1–4. [Google Scholar]
  31. Muralishankar, R.; Ghosh, D.; Gurugopinath, S. A Novel Modified Mel-DCT Filter Bank Structure with Application to Voice Activity Detection. IEEE Signal Process. Lett. 2020, 27, 1240–1244. [Google Scholar] [CrossRef]
  32. Moattar, M.H.; Homayounpour, M.M. A Simple but Efficient Real-Time Voice Activity Detection Algorithm. In Proceedings of the 2009 17th European Signal Processing Conference, Glasgow, UK, 24–28 August 2009; pp. 2549–2553. [Google Scholar]
  33. Varga, A.; Steeneken, H.J.M. Assessment for Automatic Speech Recognition: II. NOISEX-92: A Database and an Experiment to Study the Effect of Additive Noise on Speech Recognition Systems. Speech. Commun. 1993, 12, 247–251. [Google Scholar] [CrossRef]
  34. Kim, J.; Hahn, M. Voice Activity Detection Using an Adaptive Context Attention Model. IEEE Signal Process. Lett. 2018, 25, 1181–1185. [Google Scholar] [CrossRef]
Figure 1. Always-on voice activity detection as a wakeup mechanism.
Electronics 12 00795 g001
Figure 2. Different sampling schemes: (a) uniform sampling, (b) level-crossing sampling with K = 2 LSBs, (c) level-crossing sampling output signals (UD and Token).
Electronics 12 00795 g002
Figure 3. Operation of LC-ADC: K = 2 LSBs.
Electronics 12 00795 g003
Figure 4. Effect of increasing the K on level-crossing sampling: (a) K = 2 LSBs, (b) K = 4 LSBs.
Electronics 12 00795 g004
Figure 5. Block diagram of the proposed VAD algorithm.
Electronics 12 00795 g005
Figure 6. Block diagram of the LC-ADC, including the input signal and LC-ADC output samples.
Electronics 12 00795 g006
Figure 7. Flowchart of the proposed VAD algorithm containing the feature extraction, adaptive threshold calculation, and decision blocks.
Electronics 12 00795 g007
Figure 8. Feature extraction circuit.
Electronics 12 00795 g008
Figure 9. A 40 ms moving window with 30 ms overlap.
Electronics 12 00795 g009
Figure 10. Basic operation of the proposed VAD algorithm. (a) A small part of the audio input signal, LC-ADC output samples. (b) Feature, NMax, NMin, THR signals. (c) Feature, Initial_Flag, Final_Flag signals.
Electronics 12 00795 g010
Figure 11. The results of the proposed LC-ADC-based VAD algorithm operation on the database signals to obtain optimized values for M and K. (a) The total performance metric (CORRECT) versus K. (b) The average sampling frequency (favg) versus K. (c) The speech hit rate (HR1) versus K.
Electronics 12 00795 g011
Figure 12. (a) The audio signal is contaminated with a lot of noise (−10 dB SNR and white noise). (b) A large number of samples are taken from the audio signal. (c) Excess speech detection due to high noise.
Electronics 12 00795 g012
Figure 13. Missing speech detection due to low signal amplitude and lack of enough samples.
Electronics 12 00795 g013
Figure 14. Three audio signals, all impregnated with white noise with significant amplitude differences and different SNRs, were placed consecutively. The first and third audio signals are low-amplitude, and the middle audio signal is high-amplitude with SNRs of 10, 0, and 5 dB, respectively. (a) Three audio signals and LC-ADC samples. (b) Feature signal, Final_Flag, THR, and Annotate signals.
Electronics 12 00795 g014
Figure 15. Layout of the proposed VAD system.
Electronics 12 00795 g015
Table 1. Average evaluation parameters (HR0, HR1, CORRECT) over all 12 types of noises for each SNR levels ranging from −5 to 10 dB.
SNRHR0 (%)HR1 (%)CORRECT (%)
10 dB93.9789.1592.12
5 dB92.4289.9791.48
0 dB82.7991.4186.09
−5 dB61.2093.9173.74
Average82.6491.0285.85
Table 2. Power consumption of different sub-blocks of proposed VAD system and total VAD power used for audio signal corrupted with 10 dB white noise.
BlocksSub-BlocksCell Internal + Net Switching Power (nW)Cell
Leakage Power
(nW)
Power
(nW)
VAD Total Power
(nW)
Digital PartFeature
Extraction
2.6639.3100.9394.6
Threshold
Calculation
4.7740.3
Decision9.234.69
LC-ADC1-Bit DAC1.76293.7
Mux0.158
Comparators291.8
Control Logic0.023
Table 3. Performance comparison with other VAD systems.
Ref.MethodDatabaseTechnology
(nm)
Supply Voltage (V)HR0%HR1%Power
Feature ExtractorProcessor
[1]Programmable filters, noise floor estimator, and a decision engineNA320.6597.67%96.63%NA50 µW
[2]Energy/harmonicity/modulation frequency calculationAurora2651.290% @ 7 dB90% @ 7 dB147.3 µW to 7.76 mW22.3 µW
[3]Sensing paradigm algorithm, machine learning160 s of NOISEUS90NA85% @ 12 dB babble noise89% @ 12 dB babble noise6 µW, worst case
[4]mixer-based architecture, ultra-low-powerLibriSpeech+NOISEX-92180NA90%
@ 10 dB babble
91.5%
@ 10 dB babble
142 nW
[12]10-band passive
switched-capacitor, bandpass filter bank,
TIMIT 6 h @ various noises1800.6586% @ 10 dB SNR90% @ 10 dB SNR270 nWNA
[13]analog signal processing, event driven-ADC, and deep neural network.Aurora41800.685% @ 10 dB restaurant noise84% @ 10 dB restaurant noise0.38 µW1 µW
ThisworkNumber of samples extracted from LC-ADC output168 sentences of TIMIT over 12 noise type at 10 dB1801.893.97% @ 10 dB SNR of all noise types89.15% @ 10 dB SNR of all noise types294 nW 101 nW
395 nW
Post-layout simulation.
Disclaimer/Publisher’s Note: The statements, opinions and data contained in all publications are solely those of the individual author(s) and contributor(s) and not of MDPI and/or the editor(s). MDPI and/or the editor(s) disclaim responsibility for any injury to people or property resulting from any ideas, methods, instructions or products referred to in the content.

