Abstract
The phenomenon of digitisation of the public sector is an irreversible process that affects both the way public institutions are organised and the communication relationships between people and institutions. The COVID-19 pandemic represented a challenge and a strong impetus in accelerating the digitisation process of public administration at the global level such that it is currently difficult to make a clear distinction between governance and e-governance. The purpose of this research is to investigate the impact of the intensification of the digitisation process of public services in increasing the efficiency of governments at the level of the member states of the European Union, based on a cluster analysis. A robust least squares regression method was used to estimate the effects of the three dimensions of the e-government development index (EGDI) on government effectiveness. The results of the analysis highlighted the fact that the skills of the population in using online services determine the increase in a double percentage of government efficiency in intensively digitised states compared to states where the digitisation of public services is less developed. The development of the telecommunications infrastructure also has a significant positive impact on the efficiency of the government. However, online services offered by public authorities have proven to negatively influence government efficiency in both clusters.
1. Introduction
The digitalisation phenomenon has rapidly changed the way people communicate, work, and live. The public sector at the level of each member state of the European Union is engaged in the modernisation and digital transformation of public services. Still, the results differ considerably from one country to another, so not all states have the ability to obtain the same level of development of e-governments. According to OECD [1], e-government refers to “the use of new information and communication technologies… by governments as applied to the full range of government functions”. The World Bank [2] adds that these new technologies “have the ability to transform relations with citizens, businesses, and other arms of government”, which indicates the importance of e-government development in our lives. E-government is known under many terms such as: “electronic government, also known as e-gov, digital government, online government” [3].
As these definitions show, e-government is about the digitalisation of public services and the efficiency of public administration is influenced by its development [4]. The high quality of the services offered to the citizens should be accompanied by a good infrastructure and well-equipped employees to provide digital services and manage any problems that might arise.
The role of e-government has been researched by many authors [5,6,7,8]. Adjei-Bamfo et al. [5] emphasise that implementing digital services in public administration leads to achieving the 12th sustainable development goal related to responsible consumption and production. The exact role played by e-gov in the sustainable development of a country is highlighted by Ullah et al. [6], who also referred to its importance, especially in a crisis, such as those generated by the COVID-19 pandemic. United Nations [7] also mentions that many public services in the last years (2020–2022) were offered digital technologies in order to avoid spreading the disease in the community.
The recent pandemic crisis has intensified the technological development of government services worldwide, forcing governments to rethink how they serve all segments of society. As digital governance intensifies, institutions and public administrations have been irreversibly transformed, on the one hand, from a structural point of view, and on the other hand, from the point of view of the relationship between governments and the people they serve.
The hypothesis from which we start in the scientific approach is that the development of digitalization has a positive impact on increasing governmental efficiency. Thus, the main aim of our research is to highlight the importance of e-government development to raise government administration effectiveness.
Our study follows the management science theory [9,10], also called the quantitative approach, because it helps managers to make decisions based on the results of an analysis, which uses statistics and optimization models. In this context, both efficiency and effectiveness are important in relation to management activity. Efficiency refers to a “successful input transformation into outputs” [11] or even “cost-effectiveness” [12], meanwhile effectiveness refers to the success and the usefulness of a result in relation to the intended objectives [12].
The novelty of our research consists in using a robust regression model to estimate the impact of the most significant three attributes of e-government: the availability and quality of online services, the evolution of the telecommunication infrastructure, and human capital skills on government effectiveness, based on cluster analysis.
The paper comprises the Introduction, followed by a Literature Review, the Materials and Methods section, Results and Discussion, and the Conclusions and References.
2. Literature Review
For the literature review, we conducted a complex search on Scopus and Google Scholar using keywords such as “e-government”, “government digitalisation”, “public services quality”, “telecommunication infrastructure”, and “human capital skills”, which cover the elements of the model we proposed. We also focused on mostly recent research, with half of the references used in our analysis having been published in the last years (2017–2022).
E-government reflects a new way of interacting with citizens and businesses [13]. Kamolov and Konstantinova [13] mention that e-government is the solution for the “modernisation and efficiency enhancement” of public administration. Nam [14] researched the relationship between e-government and the efficiency of government administration and found a significant influence of the former on the latter. Archmann and Iglesias [15] emphasise some of the benefits of using digitalisation in the public sector, including increased efficiency and innovation. The authors consider that this type of governance is more focused on the citizen, reduces bureaucracy, and has a “market-oriented approach” [15] (p. 30).
Twizeyimana and Andersson [16] analyse e-government through the citizens’ perspective, which is very important for the efficiency of this transformed way of providing public services. Suppose citizens are reluctant to the changes or are not adequately informed or educated to use all the opportunities provided by digitalisation in the public sector. In that case, the public administration’s effectiveness might suffer. The same perspective is analysed by Yıldırım and Bostancı [17] in Turkey, the authors showing that communicating the benefits of e-government to citizens through various channels (social media included) is necessary for having an efficient administration. E-governance development refers mainly to online public services, the telecommunication infrastructure, and human capital skills in using the services [18]. Each of these variables influences the success of providing efficient services to citizens.
Online services offered by the government and other public authorities should be available to all citizens and have high quality. Ancarani [19] (p. 6) refer to the qualities needed in online public services for them to satisfy citizens, and these are “transparency, efficiency, and effectiveness”. If these criteria are met, citizens will perceive the services as high quality. James [20] also shows how the government’s performance in public services provided online directly affects and positively affects the expectation of citizens and their compliance with using these types of services to the detriment of more traditional types. Sá et al. [21] emphasise the importance and the need to create a model to measure the quality of online public services compared to traditional services. Hu et al. [22] (p. 292) mention other essential characteristics for having quality services when paying taxes online, especially when they involve personal data from citizens: “security and convenience”, and “perceived usefulness”. The concept of the quality perceived by citizens is important because not all citizens have the same skills in using technology or access to the same infrastructure.
Asogwa [23] appreciates the numerous advantages brought by using public e-services on a large scale: high efficiency in the public administration, high transparency, less corruption, reduced expenses for the administration, a better relationship with citizens, and an increased connection. As the author states, these could be damaged by poor infrastructure. Broadband coverage and speed also influence the efficiency of public administration in collecting taxes [24]. Saxena [25] researched the use of online public services (using mobile devices) in India and identified several factors which can influence the extent of usage among citizens, technology being one of them.
The digital divide is an important challenge in offering online public services because some people have access to technology and the skills to access these e-services, meanwhile, others do not [26]. This gap creates inequalities [27], and the government should address this problem when providing services to the population. Because of the disparities regarding the telecommunication infrastructure, both traditional and digital services should exist to satisfy the needs of all citizens. Dahiya and Mathew [28] appreciate that e-governance efficiency depends on the IT infrastructure, thus highlighting the need for higher investments in this area. Zarei et al. [29] (p. 199) also emphasise the differences between developing and developed countries in terms of infrastructure, the authors appreciating that the e-government development is ensured primarily on the latter because of their high level of technological development and their more “mature” infrastructures.
Ebrahim and Irani [30] show that an undeveloped infrastructure is an essential barrier to efficient e-government. The digital divide affects citizens and local administrations in regions with poorer infrastructure. As Basu [31] (p. 109) states, the telecommunication infrastructure is the one that connects “government, citizens, and businesses”. The author highlights that e-government efficiency is more frequent in developed countries than in developing countries which might face legal and technical challenges.
As Wairiuko et al. [32] (p. 94) state, the technology infrastructure is one that ensures the possibility of developing e-governmental services and where human capital skills also have a “strong positive influence”. The authors studied employees in Kenya, not citizens, concluding that for increased adoption and efficiency of the public services offered online, the employees should receive adequate training and be stimulated.
Hodžić et al. [33] (p. 159) appreciate that the maturity of e-government “significantly contributes to enhancing government effectiveness and efficiency in the EU-28”. Alghamadi et al. [34] analyse both user access and human resource among other telecommunication factors that can influence the efficiency of government administration. Lee and Porumbescu [35] concluded that IT training helps raise e-government efficiency, especially for elders or people with disabilities, thus reducing the digital divide. Chohan and Hu [36] express a similar idea and consider that training focused on developing digital competencies raises public administration efficiency, helps reduce inequalities between people, and creates a more inclusive society.
Tomaszewicz [37] mentions the role played by digital literacy in providing efficient public e-services. The authors also emphasise that public administration employees and citizens using public services should have digital skills. Reddick and Anthopoulos [38] (p.398) state that people with a high level of digital literacy “are more likely to use new digital media” when it also comes to using public services.
The reluctance to change traditional ways of doing things and the level of acceptance among citizens regarding e-government might also influence the efficiency of government administration [39]. These might be related to aspects affecting the quality of the service (ease of use, the interface, and the security) and the infrastructure and skills needed for accessing e-services.
As many researchers showed, there are important benefits brought by e-government [13,14,15,17,23], but there are also significant challenges that should be addressed by public management to be both efficient and effective in providing services to the citizens in the community [40,41,42,43]. Kauma et al. [40] identified four main categories of challenges which might become opportunities if handled properly by the administration: “technological…, organizational…, financial…, and social”.
Ivić et al. [41] highlight that the digitalization of governmental services could ensure a higher quality of the services offered to the population if some prerequisites are met such as proper legislation, developed infrastructure, and trust from the citizen towards the public administration. As Hoffman and Cseh [43] point out, cybersecurity is another important challenge for e-government and public administration should correlate this with the issue of public trust. Thus, besides investments in infrastructure and solutions for protecting sensitive data, authorities should also implement a marketing strategy to raise the number of people using digital governmental services.
3. Materials and Methods
In order to answer the main objective, that of identifying and highlighting the impact that the development of e-government has on increasing the efficiency of the government administration, we carried out the research in two stages, sectioning our study into two parts: one stage refers to the formation of clusters subject to subsequent analysis, and the second involves identifying the identification of the impact that the digitisation of public services has on increasing the efficiency of governments.
We used the k-means algorithm for the cluster analysis, which involves an iterative refinement technique. The indicators we used to define clusters are up-to-date and representative of the studied field. The first indicator is represented by the E-Government Development Index (EGDI). This is a composite index used by the United Nations to evaluate the digital transformation of government administration [44]. EGDI is determined, in turn, based on three composite indices presented in Figure 1: the online service index (OSI), the telecommunication infrastructure index (TII), and the human capital index (HCI).
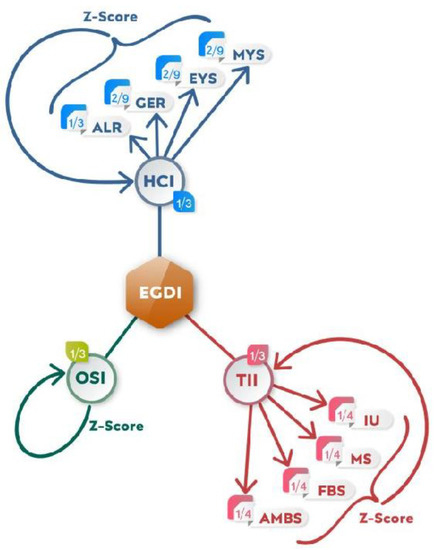
Figure 1.
E-Government Development Index (EGDI) structure is based on the United Nations methodology.
Each composite index is subject to a Z-score standardisation procedure to ensure comparable variance so that the EGDI will be the weighted average of the normalised scores of each component. The standard Z-score formula is:
where x represents the raw score, μ represents the population mean, and σ represents the standard deviation.
The OSI is calculated based on a questionnaire with 148 questions with binary answers. Each country is given one point for each positive answer to the questions in the questionnaire. The total number of points is later normalised to a value between 0 and 1, according to the following calculation formula:
where OSIX is the score for country X, OSImin is the lowest score of all the countries, and OSImax is the maximum score of all the countries.
The TII is determined as the arithmetic average of the following four indicators:
- -
- number of internet users (IU) per 100 inhabitants who used the internet in the last three months;
- -
- number of mobile service subscribers (MS) in the last three months per 100 inhabitants;
- -
- number of fixed broadband subscriptions to the public internet (FBS) per 100 inhabitants;
- -
- the number of active mobile broadband subscriptions to the public internet (AMBS).
A Z-score standardisation is applied to each of the four indicators. After the standardisation of the indicators, the TII composite value is calculated:
After the standardisation, the TII composite value of a country is normalised using the following equation:
where TIIX is the score of country X, TIImin is the lowest score of all the countries and TIImax is the maximum score of all the countries.
As for the last but very important component of the EGDI, the HCI is defined through the following indicators:
- -
- people who can read and write (% of the population above 15 years) representing adult literacy (ALR);
- -
- people enrolled in the primary, secondary or tertiary education level (% of school-age population) representing the gross enrolment ratio (GER);
- -
- the expected years of schooling representing the number of years of education that a child of a certain age is expecting to receive (EYS);
- -
- the average number of years completed in the education system by the adult population (above 25 years) (MYS).
The Z-score procedure is applied to each of the four indicators to derive the Z-score value and then to find the HCI composite value of a country using the equation:
The same normalising equation is used to determine the HCI composite value of a country:
where HCIX is the score for country X, HCImin is the lowest score of all the countries, and HCImax is the maximum score of all the countries.
The adult literacy (ALR) component represents a greater proportion of the HCI assessment because knowing how to write and read represents the basis of educational training and the development of digital skills.
The second indicator used in forming clusters, as presented in Figure 2, the e-participation index (EPI), is determined based on a questionnaire [45] also consisting of questions with binary answers to questions that cover six sub-dimensions of digitisation in the public system.
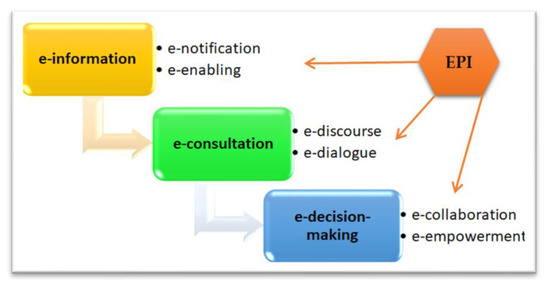
Figure 2.
E-participation index (EPI) dimensions.
The score obtained from the positive answers to the questionnaire questions is later normalised to obtain comparable results.
where EPIX is the score for country X, EPImin is the lowest score of all the countries, and EPImax is the maximum score of all the countries.
In k-means cluster analysis, k represents the number of clusters we define when starting the algorithm. In our study, we chose two values for k: the minimum value and the maximum value of the EGDI for the year 2021. The algorithm involves alternating between two steps: the assignment step, in which each observation is assigned to the group with the closest mean, i.e., the one with the closest Euclidean distance small square [46], and the updating step, in which the averages (centroids) are recalculated for the observations assigned to each group. The algorithm converges when the assignments no longer change.
We will continue the econometric analysis in order to identify the impact that the digitisation of public services has on increasing the efficiency of governments by identifying the representative variables for each field based on the principle of availability and substance, as presented in Table 1.

Table 1.
Variables included in the analysis.
The government’s effectiveness reflects the quality of public services by assessing the degree of independence of public decision-makers from political pressures, the quality of implemented public policies, and the government’s commitment to the proposed policies [47]. According to Worldwide Governance Indicators, this indicator for governance performance ranges from approximately −2.5 (weak) to 2.5 (strong).
The stationarity of the data series will be verified by applying the test proposed by Levin, Lin, and Chu (LLC) [48], whose null hypothesis implies the existence of a unit root, and alternatives confirm the stationarity of the data. The LLC test assumes that cross-sectional units are independent of each other [49]. A correlation matrix was used to detect some possible autocorrelations among the variables [50].
The robust least squares regression (ROBUSTLS) is used to overcome the possible influence of extreme observation in the datasets [51]. The model equation for the variables proposed above is:
where
GOVEFit = β1 + β2OSIit + β3HCIit + β4TIIit + εit
β1…6—the associated coefficients of the variables,
i—the cross-sections number,
t—the time period,
ε—the standard error of the regression.
The Granger pairwise causality test [52,53,54] is applied to identify the possible directions of causality between the dependent variable and the explanatory variables included in the model.
4. Results and Discussion
The intensification of the technological process, the development of the telecommunications infrastructure and the development of new public management strategies through the digitalisation of public services have led to significant progress in some countries regarding government efficiency.
Analysing the evolution of GOVEF in Figure 3, we observe that at the level of EU member states, Romania and Bulgaria register negative values for the indicator, especially during the periods of the economic crisis (2008) and pandemic crisis (2020). The blue area marks the level of government effectiveness in 2001 and the green area marks the level of government effectiveness in 2021 in the member states of the European Union. The intensity of the blue or green colour indicates higher government effectiveness, while the lightness of the colour indicates weaker government effectiveness. If the lack of trust in the government’s efficiency is perhaps justified in these states with a low level of development compared to the rest of the member states, we cannot say the same about states such as Italy, which has a low level of appreciation of the government’s efficiency.
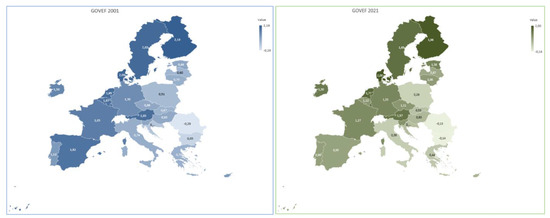
Figure 3.
Government effectiveness evolution in the EU member states.
The positioning of the former socialist states in Central and Eastern Europe in the lower part of the graph can be observed in the range of average-to-weak appreciation of government efficiency, and the developed states in Western Europe in the upper part of the range, showing a high degree of confidence awarded to the efficiency of government institutions and the public policies assumed and implemented by the government. Evaluating the capacity of public administrations to offer effective digital services to citizens and to use new technologies to their maximum potential is a complex process captured by competent institutions through the prism of several indicators. As we presented in the previous section, we proposed grouping the EU member states into two clusters, having, as starting centres in the cluster analysis, the minimum and maximum values of the EGDI indicator.
Of the top 15 countries that recorded the highest EGDI globally, six are high-income EU member states, Denmark (1st place in the world ranking), followed by Finland, Sweden, Estonia, the Netherlands, and Malta [44]. Malta recorded an increase in the three EGDI indices (OSI, TII, and HCI), the only EU country that entered the top 15 with the highest EGDI. Also worth noting are the significant developments in Sweden (a 10 percent increase in the OSI) and the Netherlands (a 4.4 percent increase in the TII).
Table 2 shows the values of the two indicators used in forming clusters. As we can see, the highest value of EDGI is registered in Denmark, representing the initial centre of cluster A, and the lowest value is found in Romania, representing the initial centre of cluster B.
Table 2.
EGDI and EPI evolution.
The k-means clustering algorithm involves the alternation of two steps: first, it assigns each observation to the group with the closest average, and second, it recalculates the averages (centroids) for the observations assigned to each group. The algorithm has converged when the assignments no longer change. The algorithm is often presented as assigning objects to the nearest cluster based on distance. The results obtained after the cluster analysis performed in Excel led to the identification of the following two clusters (Figure 4):
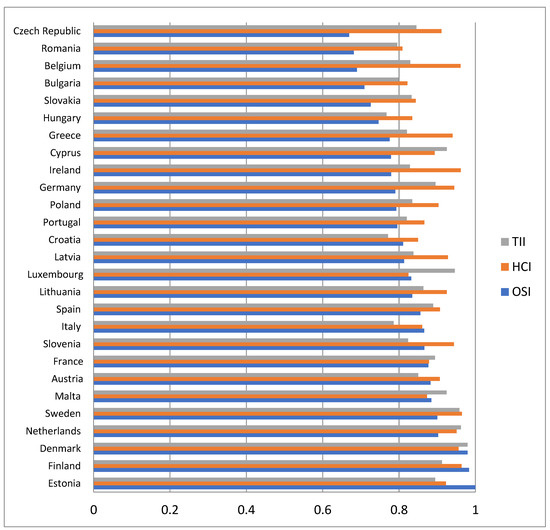
Figure 4.
Evolution of EGDI dimensions in the European Union member states.
- -
- Cluster A was characterised by high values of the two indices of the digitisation of public services (EGDI and EPI) in which the following states are included: Austria, Denmark, Estonia, Finland, Malta, Netherlands, Slovenia, Spain, and Sweden. The nine European countries in cluster A are among the world leaders in e-government development and show the most homogeneous e-government development [44]. At the European level, Estonia’s progress in digitalising public services was noted, thus positioning itself at the top of the ranking along with the Scandinavian countries [55].
- -
- Cluster B is characterised by low values of the two indices of the digitisation of public services, which include the following states: Belgium, Bulgaria, Croatia, Cyprus, Czechia, France, Germany, Greece, Hungary, Ireland, Italy, Latvia, Lithuania, Luxembourg, Poland, Portugal, Romania, and Slovakia. In contrast to the upward evolution of developed countries, we find Germany, which neglected the importance of e-government in ensuring efficient public services in an era of digitisation.
The results of the groups in the two clusters also support the grouping when considering the five categories made by the European Commission based on the indicator Overall assessment of digitalisation and service delivery, in which the leading countries are also Austria, Denmark, Estonia, Finland, the Netherlands and Sweden [55].
Figure 4 shows that in terms of connectivity (broadband), comparable levels have been reached in most countries of the European Union. Only five EU member states, namely Romania, Bulgaria, Italy, Hungary, and Croatia are below the 0.8 threshold for technological infrastructure appreciation, while Denmark, the Netherlands, and Sweden are leading in this regard. Differences in other dimensions also persist, with the levels of online services in the public sector being much more dispersed. Thus, if in Estonia, online public services are appreciated in a proportion of 100%, in countries such as the Czech Republic, Romania, and Belgium, they barely exceed the appreciation threshold of 65%.
From the graphic, it can be seen that for the HCI dimension, all member states exceed the 80% threshold in terms of the skills of human capital in using the digital services provided by public administrations. Sweden, Finland, Ireland, Belgium, Denmark, and the Netherlands are the first ranked in this dimension, while at the opposite pole are Slovakia, Hungary, Luxembourg, Bulgaria, and Romania.
This explains the division into two clusters due to the digital divide in Europe (Figure 5). The situation is determined by the fact that although e-government has enjoyed growth and development, not all citizens are willing to use such services [56,57]. Unlike e-commerce, where customers can be selected, in e-government, government agencies ensure access to the entire population, including people with lower incomes and disabilities [58].
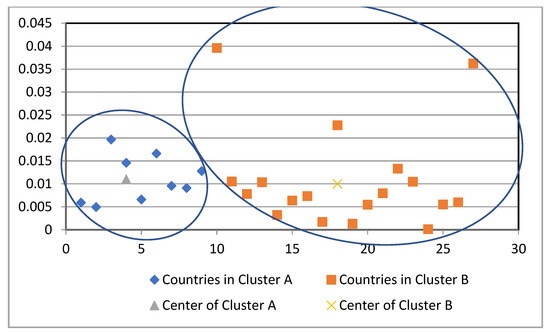
Figure 5.
K-means clustering results.
The presentation of descriptive statistics is essential in the first place to verify the normal distribution of the data series expressed by the analysis of the skewness and kurtosis indicators and the probability associated with the Jarque-Bera normality test. A value of the skewness indicator equal to or close to zero indicates a symmetrical distribution of the data series, as is the case with the data series used in our analysis. The exception to this situation is the HCI variable of cluster A, in which the negative value of the indicator highlights an elongation to the left of the data series. Kurtosis also indicates a flat distribution for all data series due to the values lower than 3, except for HCI in cluster A, where the distribution of the series is curved. The null hypothesis of the Jarque-Bera test is that the series is normally distributed. We can reject the null hypothesis of a normal distribution for the variables GOVEF, OSI, and HCI in cluster A, and for HCI and TII in cluster B (Table 3).
Table 3.
Descriptive statistics of the variables.
Therefore, the series is normally distributed for only one variable in cluster A and two variables in cluster B. This situation leads us to use a robust regression analysis method.
In Figure 6, we find the dispersion of the explanatory variables relative to the dependent variable and the related histograms of the variables used in the model displayed on the axes. The red line represents the regression line orientation according to the evolution of the variables in the two clusters. We can also observe the absence of negative values associated with weak government efficiency in cluster A compared to the existence of these values at the cluster B level.
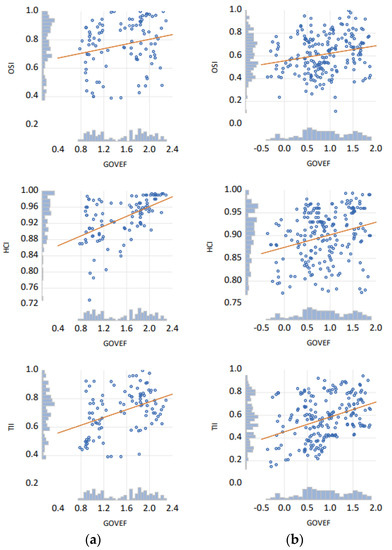
Figure 6.
Histogram and dispersion of intercepts: (a) Cluster A and (b) Cluster B.
The values of the probabilities associated with the LLC unit root test statistics indicate in Table 4 the stationarity of the data series at first difference with individual intercept and individual trend, both for the variables used in cluster A and for those in cluster B. Checking the stationarity of the data series is an important process in our analysis because it tells us to what extent the data used are optimal for obtaining robust results.
Table 4.
LLC unit root test results.
In order to avoid problems imposed by the existence of some autocorrelations between the data series used in the analysis, we considered it necessary and opportune to create a correlation matrix for both clusters (Table 5). We identified positive and negative correlations between variables at the level of the two matrices related to the clusters.
Table 5.
Correlation matrix.
Considering that there are no autocorrelations between the variables because there is not even a percentage close to 100% between any of the variables in either cluster A or B, we move on to the analysis of the regression equation (Table 6).
Table 6.
Estimation results of ROBUSTLS regression.
In the case of cluster A, which includes states with high values of EGDI and EPI, the results indicate the significant positive impact of HCI and TII on the increase in government efficiency. Thus, the increase is approximately 1 to 1 in the case of the Human Capital Index and GOVEF, expressing that with an increase in one unit in HCI, we will observe an increase in one unit of government efficiency. The same interpretation is valid for the telecommunication infrastructure index, the impact ratio being 1 to 1.2. In the case of this cluster, the OSI variable is not statistically significant.
The effects of telecommunications and infrastructure on government efficiency have also been identified in other studies, which have shown that the higher the level of telecommunications and infrastructure, the higher the efficiency of government [59]. Moreover, the use of e-government by the population instead of traditional government services is dependent on the effectiveness of using a computer [60] because the lack of practical experience in using technology creates an attitude of rejection towards public electronic services. The human capital variable was analysed from the perspective of influence on e-government, and a positive and significant relationship was identified with the level of efficiency in the provision of public services and other works, similar to our results [59,61]. There is also a study on the efficiency and maturity of e-government at the global level, which highlighted that human capital and the quality of governance did not have a significant effect on e-government maturity, only investments in ICT infrastructure [62].
The regression results for cluster B show, first of all, that the negative impact of OSI on GOVEF is, this time, statistically significant. These results contradict those obtained in other works [63], which identified a significant relationship between the impact of online services (OSI) and public efficiency but where the positive effects were greater in countries with a higher GDP. In our analysis, for cluster B countries, it seems that although online services (OSI) should simplify the management of public services, they do not lead to a reduction in production costs, most likely because they are not widely used, thus not generating an expected result which positively impacts the efficiency of public services. We can conclude that only countries with greater resources, in the sense of a higher GDP, can have the expected results of implementing online services, which is confirmed by other works [63,64,65].
The positive influences of HCI and TII on increasing government efficiency can also be observed. However, we can observe that the impact of HCI on government efficiency in cluster B is not of the same intensity as in the case of cluster A, due to the population’s lack of interest in developing skills in using online services. The lack of these skills and the use of online services can also justify the negative impact of OSI on government efficiency in the case of this cluster.
6. Conclusions
The digitalisation process of public services has been intensively developed in the last two decades but started to gain significant momentum in 2020 against the background of the pandemic crisis and the restrictions established worldwide regarding social distancing. Over 90% of EU member state governments were prompt and efficient in providing citizens with online information and platforms for information relating to testing against COVID-19, vaccination, telehealth services, and online education. Compared to the rest of the world’s states, the European Union has the most homogeneous e-government development [44].
The purpose of this research was to identify the impact that the development of digitalisation of the public system has on increasing the efficiency of public administration. In this sense, we used the three dimensions of the EGDI as the dependent variable of government effectiveness sic and explanatory variables, namely the online service index, the telecommunication infrastructure index, and the human capital index. The long-term estimates resulting from the application of robust least squares regressions showed significant positive influences from the development of the telecommunications infrastructure on similar governmental efficiency in the case of the two clusters. However, the human capital index has a positive impact with a double effect on the government efficiency intensity for more digitalised states compared to those where the digitalisation of public services is still in the development process.
The importance of the research carried out resides in the fact that the results obtained allow the identification of the significance of each of the three indicators (HCI, OSI, and TII) in ensuring government efficiency and in allowing the countries in each cluster to formulate targeted policies and the orientation and optimal allocation of resources to ensure efficiency.
In the case of cluster A, a significant positive impact of HCI and TII on the increase in government efficiency was found, while the OSI variable is not statistically significant. This means that the higher the level of telecommunications and infrastructure, the higher the efficiency of government and that the use of e-government by the population instead of traditional government services improves the effectiveness of government.
For cluster B, the regression results indicate the negative impact of OSI on GOVEF, this time statistically significant. It seems that online services, although they should simplify the management of public services, do not lead to a reduction in production costs, most likely because they are not widely used, thus not generating an expected positive impact effect on the efficiency of public services. We can conclude that only countries with greater resources, in the sense of higher GDPs, can have the expected results of implementing online services, which is confirmed by other works [63,64,65]. The positive influences of HCI and TII on increasing government efficiency can also be observed. However, we can observe that the impact of HCI on government efficiency is not of the same intensity as in the case of cluster A, due to the population’s lack of interest in developing skills in using online services. The lack of these skills and the use of online services can also justify the negative impact of OSI on government efficiency in the case of this cluster.
Local public administrations play a significant role in accelerating the digitalisation of public services from the bottom up, as they are considered within the sustainable development goals (SDGs) as true catalysts for change. Providing online services at the local level is essential in increasing government efficiency, as local authorities are the first points of contact with the population, providing the vast majority of public services.
The permanent updating and adaptation of government portals to the population’s needs can also represent a concrete way of improving government efficiency. In densely populated areas, the telecommunications infrastructure must be developed, and the government portals adapted to host as many users as possible.
During the pandemic, governments had the opportunity to demonstrate the effectiveness of e-government in ensuring social connections, supporting the business environment for the continuation of activities, and combating the spread of the pandemic, but not for all people equally. During this period, the digital gaps were intensified, especially among older people without the skills to access online services and those without access to these services. In order to reduce the digital gap between states and to ensure accessibility to the online services offered, governments must provide the vulnerable population with digital opportunities.
Author Contributions
Conceptualization, N.M.D.; data curation, G.C. and L.D.M.; formal analysis, R.M.B. and M.G.P.; methodology, N.M.D. and M.D.D.; project administration, R.M.B. and M.G.P.; resources, M.D.D. and L.D.M.; software, N.M.D., M.D.D. and G.C.; supervision, M.G.P.; validation, R.M.B.; visualization, L.D.M.; writing—original draft, S.P.; writing—review and editing, S.P. All authors have read and agreed to the published version of the manuscript.
Funding
This research received no external funding.
Institutional Review Board Statement
Not applicable.
Informed Consent Statement
Not applicable.
Data Availability Statement
Not applicable.
Conflicts of Interest
The authors declare no conflict of interest.
References
- OECD. E-Government: Analysis Framework and Methodology. 2001. Available online: https://stats.oecd.org/glossary/detail.asp?ID=4752 (accessed on 21 November 2022).
- The World Bank. E-Government. 2015. Available online: https://www.worldbank.org/en/topic/digitaldevelopment/brief/e-government (accessed on 21 November 2022).
- IGI Global. What Is Electronic Government (E-Government). Available online: https://www.igi-global.com/dictionary/investigating-enterprise-application-integration-adoption/9385 (accessed on 21 November 2022).
- Hodzic, S.; Ravselj, D.; Alibegovic, D.J. E-Government Effectiveness and Efficiency in EU-28 and COVID-19. Cent. Eur. Public Adm. Rev. 2021, 19, 159–180. [Google Scholar] [CrossRef]
- Adjei-Bamfo, P.; Maloreh-Nyamekye, T.; Ahenkan, A. The role of e-government in sustainable public procurement in developing countries: A systematic literature review. Resour. Conserv. Recycl. 2019, 142, 189–203. [Google Scholar] [CrossRef]
- Ullah, A.; Pinglu, C.; Ullah, S.; Abbas, H.S.M.; Khan, S. The Role of E-Governance in Combating COVID-19 and Promoting Sustainable Development: A Comparative Study of China and Pakistan. Chin. Political Sci. Rev. 2021, 6, 86–118. [Google Scholar] [CrossRef]
- United Nations. COVID-19 Pushes More Government Activities Online Despite Persisting Digital Divide. Available online: https://www.un.org/es/desa/covid-19-pushes-more-government-activities-online-despite-persisting-digital (accessed on 21 November 2022).
- Dhaoui, I. E-Government for Sustainable Development: Evidence from MENA Countries. J. Knowl. Econ. 2022, 13, 2070–2099. [Google Scholar] [CrossRef]
- Zand, D.E.; Sorensen, R.E. Theory of Change and the Effective Use of Management Science. Adm. Sci. Q. 1975, 20, 532–545. [Google Scholar] [CrossRef]
- Japhet, I. A review of the Management Science theory and its application in contemporary businesses. Afr. J. Bus. Manag. 2021, 15, 133–138. [Google Scholar] [CrossRef]
- Bartuševičienė, I.; Šakalytė, E. Organizational assessment: Effectiveness vs. efficiency. Soc. Transform. Contemp. Soc. 2013, 1, 45–53. [Google Scholar]
- McCormick, J.S. Effectiveness and efficiency. J. R. Coll. Gen. Pract. 1981, 31, 299–302. Available online: https://www.ncbi.nlm.nih.gov/pmc/articles/PMC1971043/pdf/jroyalcgprac00101-0045.pdf (accessed on 19 January 2023).
- Kamolov, S.G.; Konstantinova, A.N. E-Government: Way of Modernization and Efficiency Enhancement of Public Governance. J. Law Adm. 2017, 1, 13–21. [Google Scholar] [CrossRef]
- Nam, T. Does E-Government Raise Effectiveness and Efficiency?: Examining the Cross-National Effect. J. Glob. Inf. Manag. 2019, 27, 120–138. [Google Scholar] [CrossRef]
- Archmann, S.; Iglesias, C. eGovernment: A driving force for innovation and efficiency in public administration. EIPAScope 2010, 1, 29–36. [Google Scholar]
- Twizeyimana, J.D.; Andersson, A. The public value of E-Government–A literature review. Gov. Inf. Q. 2019, 36, 167–178. [Google Scholar] [CrossRef]
- Yıldırım, S.; Bostancı, S.H. The efficiency of e-government portal management from a citizen perspective: Evidences from Turkey. World J. Sci. Technol. Sustain. Dev. 2021, 18, 259–273. [Google Scholar] [CrossRef]
- Public Administration UN. Available online: https://publicadministration.un.org/egovkb/en-us/About/Overview/-E-Government-Development-Index (accessed on 22 November 2022).
- Ancarani, A. Towards quality e-service in the public sector: The evolution of web sites in the local public service sector. Manag. Serv. Qual. Int. J. 2005, 15, 6–23. [Google Scholar] [CrossRef]
- James, O. Managing Citizens’ Expectations of Public Service Performance: Evidence from Observation and Experimentation in Local Government. Public Adm. 2011, 89, 1419–1435. [Google Scholar] [CrossRef]
- Sá, F.; Rocha, Á.; Cota, M.P. From the quality of traditional services to the quality of local e-Government online services: A literature review. Gov. Inf. Q. 2016, 33, 149–160. [Google Scholar] [CrossRef]
- Hu, P.J.H.; Brown, S.A.; Thong, J.Y.; Chan, F.K.; Tam, K.Y. Determinants of service quality and continuance intention of online services: The case of eTax. J. Am. Soc. Inf. Sci. Technol. 2009, 60, 292–306. [Google Scholar] [CrossRef]
- Asogwa, B.E. Electronic government as a paradigm shift for efficient public services: Opportunities and challenges for Nigerian government. Libr. HiTech 2013, 31, 141–159. [Google Scholar] [CrossRef]
- Doran, M.D.; Puiu, S.; Berceanu, D.; Țăran, A.M.; Para, I.; Popescu, J. Combining the Broadband Coverage and Speed to Improv Fiscal System Efficiency in the Eastern European Union Countries. Electronics 2022, 11, 3321. [Google Scholar] [CrossRef]
- Saxena, S. Enhancing ICT infrastructure in public services: Factors influencing mobile government (m-government) adoption in India. Bottom Line 2017, 30, 279–296. [Google Scholar] [CrossRef]
- Cullen, R. Addressing the digital divide. Online Inf. Rev. 2001, 25, 311–320. [Google Scholar] [CrossRef]
- Van Dijk, J.A. Digital divide research, achievements and shortcomings. Poetics 2006, 34, 221–235. [Google Scholar] [CrossRef]
- Dahiya, D.; Mathew, S.K. IT assets, IT infrastructure performance and IT capability: A framework for e-government. Transform. Gov. People Process Policy 2016, 10, 411–433. [Google Scholar] [CrossRef]
- Zarei, B.; Ghapanchi, A.; Sattary, B. Toward national e-government development models for developing countries: A nine-stage model. Int. Inf. Libr. Rev. 2008, 40, 199–207. [Google Scholar] [CrossRef]
- Ebrahim, Z.; Irani, Z. E-government adoption: Architecture and barriers. Bus. Process Manag. J. 2005, 11, 589–611. [Google Scholar] [CrossRef]
- Basu, S. E-government and developing countries: An overview. Int. Rev. Law Comput. Technol. 2004, 18, 109–132. [Google Scholar] [CrossRef]
- Wairiuko, J.W.; Nyonje, R.; Omulo, E. Human resource capacity and adoption of e-government for improved service delivery in Kajiado County, Kenya. Int. J. Bus. Soc. Sci. 2018, 9, 94–110. [Google Scholar] [CrossRef]
- Lobonț, O.R.; Nicolescu, A.C.; Costea, F.; Zheng-Zheng, L.; Țăran, A.M.; Davidescu, A. A Panel Threshold Model to Capture the Nonlinear Nexus between Public Policy and Entrepreneurial Activities in EU Countries. Mathematics 2022, 10, 1265. [Google Scholar] [CrossRef]
- Alghamdi, I.A.; Goodwin, R.; Rampersad, G. E-government readiness assessment for government organizations in developing countries. Comput. Inf. Sci. 2011, 4, 3–17. [Google Scholar] [CrossRef]
- Lee, J.B.; Porumbescu, G.A. Engendering inclusive e-government use through citizen IT training programs. Gov. Inf. Q. 2019, 36, 69–76. [Google Scholar] [CrossRef]
- Chohan, S.R.; Hu, G. Strengthening digital inclusion through e-government: Cohesive ICT training programs to intensify digital competency. Inf. Technol. Dev. 2022, 28, 16–38. [Google Scholar] [CrossRef]
- Tomaszewicz, A.A. The impact of digital literacy on e-government development. Online J. Appl. Knowl. Manag. Impact Digit. Lit. E-Gov. Dev. 2015, 3, 45–53. [Google Scholar]
- Reddick, C.; Anthopoulos, L. Interactions with e-government, new digital media and traditional channel choices: Citizen-initiated factors. Transform. Gov. People Process Policy 2014, 8, 398–419. [Google Scholar] [CrossRef]
- Evans, D.; Yen, D.C. E-Government: Evolving relationship of citizens and government, domestic, and international development. Gov. Inf. Q. 2006, 23, 207–235. [Google Scholar] [CrossRef]
- Kauma, J.G.; Irerib, W.N.; Olweny, N.O. Challenges Facing Coherent Digitization of Government Processes Across All Policy Areas and Levels of Government to Enhance Efficient Public Service Delivery in Kenya. Soc. Sci. Psychol. 2022, 111, 220–228. [Google Scholar]
- Ivić, A.; Milićević, A.; Krstić, D.; Kozma, N.; Havzi, S. The Challenges and Opportunities in Adopting AI, IoT and Blockchain Technology in E-Government: A Systematic Literature Review. In Proceedings of the 2022 International Conference on Communications, Information, Electronic and Energy Systems (CIEES), Veliko Tarnovo, Bulgaria, 24–26 November 2022; pp. 1–6. [Google Scholar] [CrossRef]
- Hazineh, S.A.; Eleyan, D.; Alkhateeb, M. E-Government: Limitations and Challenges: A General Framework for to Consider in Both Developed and Developing Countries. Int. J. Sci. Technol. Res. 2022, 11, 97–103. [Google Scholar]
- Hoffman, I.; Cseh, K.B. E-administration, cybersecurity and municipalities – the challenges of cybersecurity issues for the municipalities in Hungary. Cybersecur. Law 2020, 2, 199–211. [Google Scholar] [CrossRef]
- United Nations Department of Economic and Social Affairs. E-GOVERNMENT SURVEY 2022—The Future of Digital Government; United Nations: New York, NY, USA, 2022. [Google Scholar]
- Member State Questionnaire. Available online: https://bit.ly/MSQ_2022 (accessed on 6 October 2022).
- Forgy, E.W. Cluster analysis of multivariate data: Efficiency versus interpretability of classifications. Biometrics 1965, 21, 768–769. [Google Scholar]
- The Worldwide Governance Indicators. 2022 Update. Available online: www.govindicators.org (accessed on 6 October 2022).
- Levin, A.; Lin, C.F.; Chu, C. Unit root tests in panel data: Asymptotic and finite-sample properties. J. Econom. 2002, 108, 1–24. [Google Scholar] [CrossRef]
- Westerlund, J. A note on the use of the LLC panel unit root test. Empirirical Econ. 2009, 37, 517. [Google Scholar] [CrossRef]
- Florea, N.M.; Badîrcea, R.M.; Meghisan-Toma, G.-M.; Puiu, S.; Manta, A.G.; Berceanu, D. Linking Public Finances’ Performance to Renewable-Energy Consumption in Emerging Economies of the European Union. Sustainability 2021, 13, 6344. [Google Scholar] [CrossRef]
- Doran, N.M.; Badîrcea, R.M.; Manta, A.G. Digitization and Financial Performance of Banking Sectors Facing COVID-19 Challenges in Central and Eastern European Countries. Electronics 2022, 11, 3483. [Google Scholar] [CrossRef]
- Granger, C.W.J. Investigating Causal Relations by Econometric Models and Cross-spectral Methods. Econometrica 1969, 37, 424–438. [Google Scholar] [CrossRef]
- Bădîrcea, R.M.; Doran, N.M.; Manta, A.G.; Puiu, S.; Meghisan-Toma, G.M.; Doran, M.D. Linking financial development to environmental performance index—the case of Romania. Econ. Res. -Ekon. Istraživanja 2022. [Google Scholar] [CrossRef]
- Dima, B.; Lobon¸t, O.-R.; Moldovan, N.-C. Does the quality of public policies and institutions matter for entrepreneurial activity? Evidences from the European Union’s member states. Panoeconomicus 2016, 63, 425–439. [Google Scholar] [CrossRef]
- European Commission. A Comparative Overview of Public Administration Characteristics and Performance in EU28; Publications Office of the European Union: Luxembourg, 2018. [Google Scholar] [CrossRef]
- Zhao, X.; Xu, H.D. E-government and corruption: A longitudinal analysis of countries. Int. J. Public Adm. 2015, 38, 410–421. [Google Scholar] [CrossRef]
- Carter, L.; Be´langer, F. The utilization of e-government services: Citizen trust, innovation and acceptance factors. Inf. Syst. J. 2005, 15, 5–25. [Google Scholar] [CrossRef]
- Schwester, R. Examining the Barriers to e-Government Adoption. Electron. J. E-Gov. 2009, 7, 113–122. [Google Scholar]
- Purao, S.; Souza, K. Looking for clues to failures in large-scale, public sector projects: A case study. In Proceedings of the 44th Hawaii Conference Information Systems Sciences, Kauai, HI, USA, 4–7 January 2011. [Google Scholar] [CrossRef]
- Shareef, M.A.; Kumar, V.; Kumar, U.; Dwivedi, Y.K. e-Government Adoption Model (GAM): Differing service maturity levels. Gov. Inf. Q. 2011, 28, 17–35. [Google Scholar] [CrossRef]
- Al-Khanjari, Z.; Al-Hosni, N.; Kraiem, N. Developing A Service Oriented E-Government Architecture Towards Achieving E-Government Interoperability. Int. J. Softw. Eng. Its Appl. 2014, 8, 29–42. [Google Scholar]
- Das, A.; Singh, H.; Joseph, D. A longitudinal study of e-government maturity. Inf. Manag. 2017, 54, 415–426. [Google Scholar] [CrossRef]
- Moreno-Enguix, M.D.; Lorente-Bayona, L.V.; Gras-Gil, E. Can E-Government Serve as a Tool for Public Authorities to Manage Public Resources More Efficiently? J. Glob. Inf. Manag. (JGIM) 2019, 27, 122–135. [Google Scholar] [CrossRef]
- Waheduzzaman, W.; Khandaker, S. E-participation for combating corruption, increasing voice and accountability, and developing government effectiveness: A cross-country data analysis. Aust. J. Publ. Admin. 2022, 1–20. [Google Scholar] [CrossRef]
- Martins, J.; Fernandes, B.; Rohman, I.; Veiga, L. The War on Corruption: The Role of Electronic Government. In Electronic Government. EGOV 2018. Lecture Notes in Computer Science; Springer: Cham, Switzerland, 2018; Volume 11020. [Google Scholar] [CrossRef]
Disclaimer/Publisher’s Note: The statements, opinions and data contained in all publications are solely those of the individual author(s) and contributor(s) and not of MDPI and/or the editor(s). MDPI and/or the editor(s) disclaim responsibility for any injury to people or property resulting from any ideas, methods, instructions or products referred to in the content. |
© 2023 by the authors. Licensee MDPI, Basel, Switzerland. This article is an open access article distributed under the terms and conditions of the Creative Commons Attribution (CC BY) license (https://creativecommons.org/licenses/by/4.0/).