Abstract
Parkinson’s disease (PD) is responsible for a broad spectrum of signs and symptoms, including relevant motor impairments generally rated by clinical experts. In recent years, motor measurements gathered by technology-based systems have been used more and more to provide objective data. In particular, wearable devices have been adopted to evidence differences in the gait capabilities between PD patients and healthy people. Within this frame, despite the key role that the upper limbs’ swing plays during walking, no studies have been focused on their harmonic content, to which this work is devoted. To this end, we measured, by means of IMU sensors, the walking capabilities of groups of PD patients (both de novo and under-chronic-dopaminergic-treatment patients when in an off-therapy state) and their healthy counterparts. The collected data were FFT transformed, and the frequency content was analyzed. According to the results obtained, PD determines upper limb rigidity objectively evidenced and correlated to lower harmonic contents.
1. Introduction
Parkinson’s disease (PD) is one of the most common neurodegenerative disorders worldwide, with an increasing incidence over the last 30 years [1] and prevalence in people aged >65 years [2]. PD is associated with a progressive loss of dopaminergic neurons in a specific brainstem area called Substantia Nigra pars compacta, which is responsible for the occurrence of cardinal motor signs, including rest tremor (i.e., a 4–6 Hz tremor in fully resting limbs), bradykinesia (i.e., slowness of movements) and rigidity (i.e., muscles become stiff or inflexible). PD patients may also suffer from postural instability [3] and falls, especially in the advanced stages of the disease [4], and voice disorders [5,6]. Moreover, a broad spectrum of non-motor symptoms such as anxiety, depression and urogenital dysfunction also frequently arise, negatively impacting patients’ quality of life [7].
The clinical evaluation of parkinsonian signs and symptoms is generally carried out by using rating scales, the most adopted one being the standardized Movement Disorder Society-Unified Parkinson’s Disease Rating Scale (MDS-UPDRS) [8], divided into four parts. The third (III) part concerns motor assessment, with a set of motor tasks subjectively ranked by expert clinical staff with discrete values (0–4). The UPDRS protocol demonstrates great validity but also limits, such as moderate intra- and inter-rater reliability [9,10], some observer inconsistencies [11] and a coarse assessment due to the limited scale with only four discrete values. Consequently, researchers have been more and more open to the adoption of objective technology-based systems [12,13] aimed at fine quantitative assessments of PD motor signs, such as optical apparatuses (e.g., RGB cameras) [14,15], smartphones [16], EMG tools [17,18], flex [19,20] and force sensors [21] and wearable devices (e.g., inertial measurement units, hereafter IMUs) [22,23,24]. In particular, the latter have been demonstrated to be effective in furnishing reliable data to be used for feature extraction and data classification purposes with high correlations to standards. For example, Bobić et al. [25] assessed bradykinesia by means of gyroscopes sensors placed on the thumb and index fingernails during finger tapping, di Biase et al. [26] determined rigidity with IMUs measuring passive oscillation of arms, and Dai et al. [27] adopted IMUs to objectively evidence tremors.
Apart from single aspects of motor deficiencies, IMUs have been adopted to reveal an ensemble of motor signs, too. Ricci et al. [28] adopted a set of IMUs to assess rigidity, bradykinesia, postural instability and gait abnormalities, Zampieri et al. [29] adopted IMUs to objectively evidence reduced arm swing, rigidity and bradykinesia during gait tests and Lewek et al. [30] evidenced asymmetry in the upper limb swing in early PD subjects on the basis of measurements gathered by IMUs.
Despite the detailed motor investigations of the published papers, as far as we know, no work has focused on analyzing the frequency content of forearm swings during gait tests. However, since forearm movements represent a key aspect of human walking [31], here we highlight their contribution through IMU-based measurements during a walking task performed by groups of PD patients and healthy subjects to evidence differences in their spectral components.
This work is arranged to present the subjects involved in the study (Section 2.1), the adopted technologies (Section 2.2), the procedures (Section 2.3 and Section 2.4) and the results (Section 3) to determine the impact of key relevant walking motor features (Section 4 and Section 5).
2. Materials and Methods
2.1. Subjects
A total of 89 subjects (Table 1), comprising 58 PD patients and 31 age-matched healthy people (i.e., the control group, HC hereafter), were recruited from the Movement Disorders Outpatient Service of both Tor Vergata university hospital and Sapienza University of Rome (Italy). In particular, the PD patients were 44 drug-free de novo (i.e., newly diagnosed and not yet in therapy, PD-DN hereafter), and 14 PD patients under chronic dopaminergic treatment, examined when in the off state of therapy (i.e., after drug withdrawal for at least 12 h; PD-OFF hereafter) [27,28]. All patients were evaluated by medical experts and rated according to the MDS-UPDRS part III, Hoen and Yahr (H&Y) and Mini-Mental State Examination (MMSE) scales.

Table 1.
Clinical and demographic features of the participants.
Inclusion criteria for PD subjects were diagnosis of idiopathic PD, ability to walk independently, absence of comorbidities possibly affecting gait and an MMSE score of >24.
All subjects voluntarily agreed to participate in this study, furnishing informed consent according to the local ethics committees following the Declaration of Helsinki.
2.2. Wearable Electronic Devices
We adopted three lightweight (<20 g each), unobtrusive (4 cm × 3 cm × 1.5 cm), not-hindering-movements (placed by Velcro strips) wearable devices (wearables hereafter), each termed Movit G1 (by Captiks Srl, Rome, Italy). Each Movit G1 hosts IMUs with a triaxial accelerometer and a triaxial gyroscope, already validated with respect to gold standard system [32], to collect kinematic data (i.e., acceleration, angular velocity and orientation) from different anatomic segments (i.e., forearms and upper back, Figure 1a,b) of each participant. We configured the accelerometer to ±8 g with 16.384 LSB/g sensitivity and the gyroscope to ±2000°/s with 32.8 LSB/°/s sensitivity. Signals were acquired at a sampling rate of 50 Hz and sent to a receiver connected to a personal computer that runs a dedicated application named Captiks Motion Studio (by Captiks Srl, Rome, Italy).
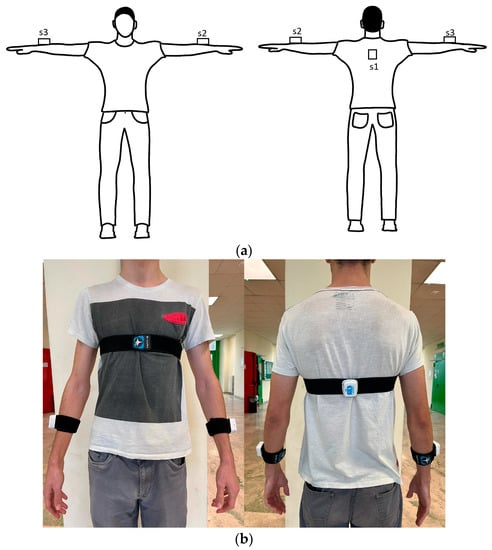
Figure 1.
Wearable sensors as placed on the subject’s body ((a) scheme, (b) real), s1 on the upper shoulder, s2 and s3 on the forearms.
2.3. Testing Procedure
Due to our walking-focused work, we adopted the Timed Up and Go (TUG) test as a standard procedure for gait assessment.
The TUG is a sequence of subjects’ common movements, as explained below:
- Sit to stand: from seated on a chair with arms crossed over the chest to standing up;
- First walking: a walk for 6 m at a comfortable speed;
- First turning: a first 180° rotation;
- Second walking: a walk from the turning point back to the chair;
- Second turning: a second 180° rotation;
- Stand to sit: from standing to sitting down.
A schematic representation of TUG test phases is reported in Figure 2.
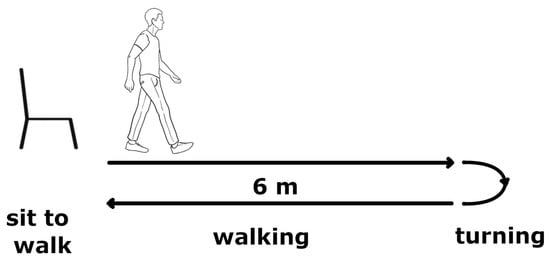
Figure 2.
Graphical representation of different phases of Timed Up and Go test.
The test was fully performed by all participants. Gait was clinically assessed through discrete scores assigned according to the MDS-UPDRS part III. The frequency contents were later extrapolated from the walking part only.
2.4. Data Analysis
The TUG test was segmented to isolate the walking phase. This segmentation was empirically obtained by evidencing the start of the first walk (when the subject releases the arms from the crossed position), the end of the first walk (when the trunk rotates more than 10 degrees) and similarly for the second walking phase.
Occasionally, some sample data were not correctly transmitted from the IMUs to the receiving unit; when this occurred, we interpolated the data streaming (even if empirically, we could consider this issue not relevant). Signals were also windowed with the Tukey window function and zero-padded to guarantee a minimum of 1024 samples.
Data were gathered to determine the frequency content (by means of the Fast Fourier Transform algorithm) of the forearm swings (for both left and right upper limbs) and, in particular, those motor features of the harmonics related to PD, and seven features were determined accordingly, as reported in Table 2. Since PD patients, especially those in the first stages of the disease, behave asymmetrically in arm swings, we considered the differences between the two upper limbs empirically differentiated into the “most affected” and “least affected” sides according to their range of motion (ROM) during the walking phase (“least affected” was for the higher ROM).

Table 2.
Motor features of the harmonics in upper limb swings during gait.
A two-sample t-test (p-value = 0.05) was performed to determine if the features’ distributions showed significant differences between PD and HC populations. The comparison was undertaken distinctly for PD-DN and PD-OFF patients and separately for the “most affected” and “least affected” sides. Moreover, Spearman’s rank correlation coefficient was computed between the motor features and MDS-UPDRS III scores to relate the features and PD signs by considering the MDS-UPDRS items, namely no. 3.3 (rigidity), no. 3.10 (gait), no. 3.14 (body bradykinesia and hypokinesia) and no. 3.16 (action tremor), as provided by clinicians. We chose these items because they have already demonstrated a good correlation with the features obtained from gait [28].
The described data analysis was homemade by means of an ad hoc algorithm written in MATLAB 2022b (by Mathworks Inc., Natick, MA, USA).
3. Results
Figure 3 shows the Hamp1 and Hamp2 distributions for HC (Figure 3a,b), PD-DN (Figure 3c,d) and PD-OFF (Figure 3e,f) populations.
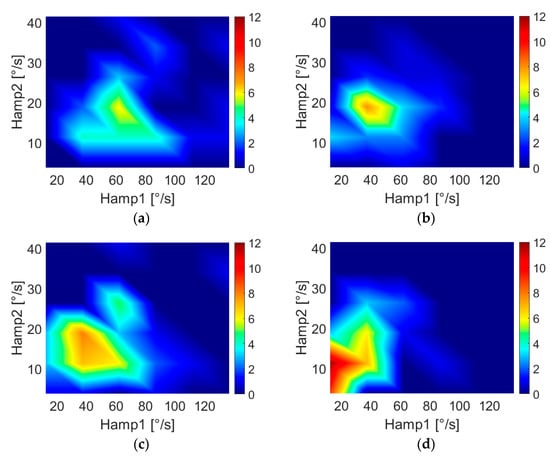
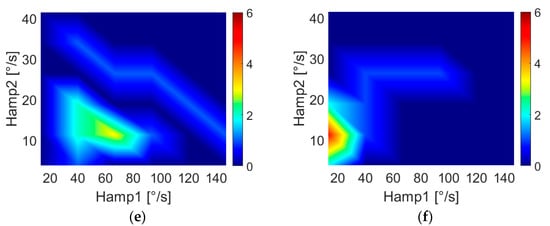
Figure 3.
Two-dimensional features’ distributions for HC subjects ((a) “least affected” side, (b) “most affected” side), PD-DN patients ((c) “least affected” side, (d) “most affected” side) and PD-OFF patient€ ((e) “least affected” side, (f) “most affected” side). The colors are related to the number of subjects. Color bar limits of PD-OFF plots are lower with respect to the other plots because of the smaller population.
Table 3 reports the mean and standard deviations of each feature for PD-DN, PD-OFF and HC, respectively, and the p-values obtained from t-tests separately for the “most affected” and “least affected” sides.

Table 3.
Values of the motor features related to PD-DN, PD-OFF and HC.
Table 4 shows the correlation coefficients and related p-values as results of Spearman’s rank correlation between features and gait and body bradykinesia scores of the MDS-UPDRS III for PD-DN subjects.

Table 4.
Spearman’s rank correlation coefficients for the “most affected” and “least affected” sides in de novo parkinsonian patients.
Table 5 shows the correlations between motor features and specific MDS-UPDRS III items for the upper limbs (i.e., action tremor and rigidity) for PD-DN subjects.

Table 5.
Spearman’s rank correlation coefficients in de novo parkinsonian patients.
Table 6 shows the correlation coefficients and related p-values as results of Spearman’s correlation between features and items related to gait and body bradykinesia of the MDS-UPDRS III relative to PD-OFF patients.

Table 6.
Spearman’s rank correlation coefficients for the “most affected” and “least affected” sides in patients with Parkinson’s disease when in off state of therapy.
Table 7 reports the results of the correlations between motor features and specific MDS-UPDRS III items for the upper limbs (i.e., action tremor and rigidity).

Table 7.
Spearman’s rank correlation coefficients in patients with Parkinson’s disease when in off state of therapy.
4. Discussion
In this study, we investigated if the frequency analysis of forearm swing during walking can be a discriminating tool for distinguishing PD patients (both at early, called PD-DN, or chronically treated, called PD-OFF, stages) from HC and if it allows quantifying different motor signs.
Our measurements evidenced the (expected) “compound pendulum” behavior of the upper limb swings, which is characterized by multiple higher-order harmonics. We focused on the relationship between these spectral components and PD signs. A set of seven features was used to quantify the nonlinear behavior of the arm swing.
As highlighted in Figure 3, walking arm-swing characteristics of subjects are significantly different for PD-DN and HC, demonstrating lower values of Hamp1 (i.e., the maximum amplitude of the fundamental frequency) and Hamp2 (i.e., the maximum amplitude of the second harmonic) for both arms in PD-DN than in HC. This evidence was confirmed by the results of t-tests reported in Table 3, where, in particular, the p-values demonstrated significant differences in PD-DN vs. HC in the swings of both arms. In particular, it was observed that the features of the “most affected” side were more significant than those of the “least affected” side, especially for features Hamp2 and HD2 (i.e., second-harmonic distortion), which showed no difference between HC and PD-DN for the “least affected” arm. This result agrees with what has been reported in the literature, namely that the early stages of this disease are characterized by a greater asymmetry of motor signs. This asymmetry in the arm swing has been quantified by means of the named Asym feature.
Table 3 also shows the t-test results for PD-OFF patients. In this case, differences from HC are evidenced for the “most affected” arm but not for the “least affected” one. Indeed, residual effects of the dopaminergic therapy, due to the known long-duration response to L-Dopa, may have smoothed possible differences also involving the “least affected” side despite a drug withdrawal of at least 12 h [33,34]. In particular, only features Hamp2 and freq (fundamental frequency) of the “most affected” side show significant p-values, although the other features of the “most affected” side have mean and standard deviation values close to those reported for PD-DN.
According to the results evidenced in Table 4, for PD-DN subjects, there is a meaningful correlation between the features of the “least affected” and “most affected” arms. In particular, motor features of the “most affected” arm are better correlated to the overall MDS-UPDRS III scores with respect to the “least affected” one, and in a special way with item no. 3.14 (bradykinesia).
Results shown in Table 5 evidence a significant correlation between rigidity- and amplitude-related features to the first three spectral components and the second-order harmonic distortion, while no correlation of the features is found with item no. 3.16 (action tremor).
As Table 6 shows, the motor feature Hamp2 is particularly useful to evidence bradykinesia issues in PD-OFF subjects. This is interesting in relation to the significance shown in Figure 3, which underlines lower values of Hamp2 in PD patients.
Table 7 reports how item no. 3.16 (action tremor) is uncorrelated to any features, while the Hamp1 and Hamp2 features present moderate to good correlation with item no. 3.3.
From the previous outcomes, it is possible to assert that the information obtained from the analysis of the first three spectral components of the arm swing can be useful for discriminating PD patients from HC subjects, and they also present a good level of correlation with MDS-UPDRS scores for bradykinesia and rigidity.
Figure 4 shows the distribution of Hamp1 and Hamp2 for different scores of bradykinesia assigned by clinicians for both PD-DN and PD-OFF patients.
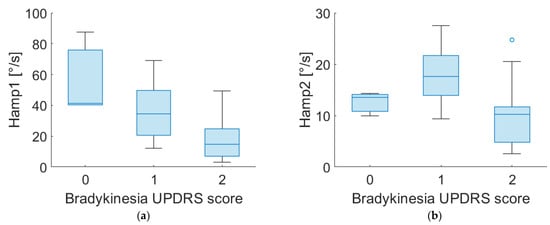
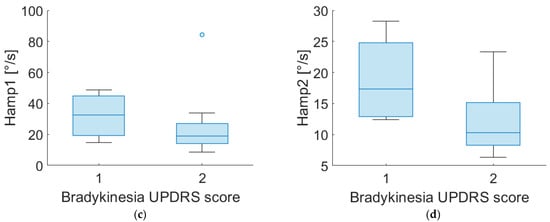
Figure 4.
Boxplot of Hamp1 and Hamp2 of “most affected” side for PD-DN (a,b) and PD-OFF (c,d) subjects for different scores of UPDRS item no. 3.14 (bradykinesia).
Of particular interest is the effect of the second harmonic on the arm swing, as it is possible to provide a physical interpretation of the phenomenon.
In fact, second- and third-harmonic distortion is a well-known phenomenon in nonlinear systems such as power amplifiers [35,36]. These effects are due to the nonlinear effects of the system’s physical constraints. In nonlinear systems, the presence of even and odd harmonics is expected, but in the human arm, the constraint of the elbow forces the forearm into an asymmetric flexion–extension movement with a consequent swing, such as the one reported in Figure 5, where three different distortions are shown. This “asymmetry” generates a prevalence of even harmonics. Accordingly, our results highlight the presence of the second harmonic in HC subjects, while PD patients show a decrease in the second-harmonic component, meaning a reduced flexion–extension of the elbow. This finding may reflect the presence of rigidity in patients’ limbs. Indeed, as demonstrated in [37,38], PD subjects show abnormal EMG patterns in the biceps brachii and triceps surae muscles during passive movements. Since the considered muscles are responsible for elbow movements, an alteration in the EMG activity can alter the flexion–extension of the joint with a consequent variation of the second harmonic. These remarks suggest a connection between higher-order harmonics and parkinsonian rigidity. As further support to this hypothesis, we found significant correlations between motor features (i.e., Hamp2, Hamp3, DH2 and DH3) and rigidity, as clinically assessed through MDS-UPDRS III scores.
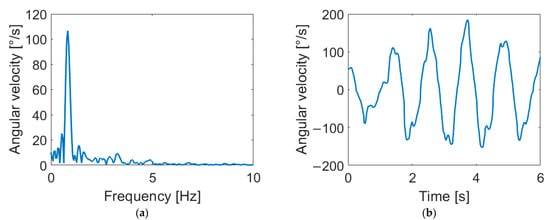
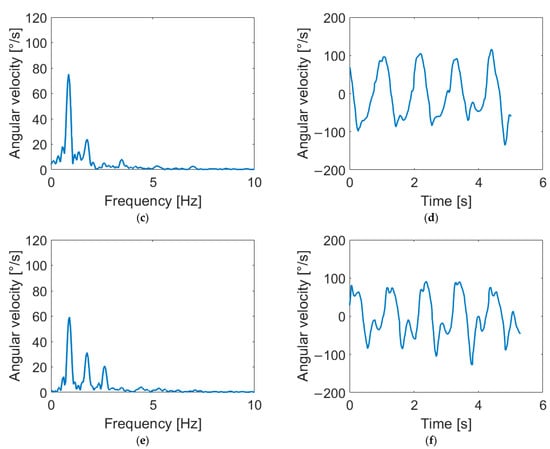
Figure 5.
Arm-swing signals in frequency and time domains for different harmonic content. Signals reported show negligible distortion (a,b), second-harmonic distortion (c,d) and third-harmonic distortion (e,f). As shown in the figure, the second harmonic corresponds to a flattening of negative peaks in the time domain, while the third harmonic causes a flattening of both positive and negative peaks.
Figure 6 shows the distribution of Hamp1 and Hamp2 for different rigidity scores in PD-DN patients. Rigidity scores 0 and 2 present distinct distributions. Thus, it can be asserted that the study of second harmonics can provide interesting information on the rigidity severity of upper limbs in parkinsonian subjects.
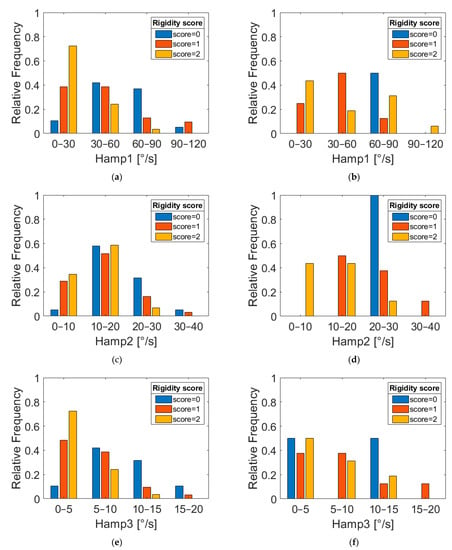
Figure 6.
Relative frequency distributions of features Hamp1, Hamp2 and Hamp3 for PD-DN (a,c,e) and PD-OFF (b,d,f) subjects grouped according to three different UPDRS rigidity scores (item 3.3).
5. Conclusions
We propose an approach for PD assessment based on the evaluation of harmonic distribution and the distortion of arm swings during walking tasks. This assessment was applied to two different PD groups (de novo subjects, called PD-DN, and PD patients under chronic dopaminergic treatment when in off state of therapy, called PD-OFF) and their healthy group (called HC) counterparts.
Findings in harmonic distribution and distortion highlight the nonlinear behaviors more evident in the HC group.
In particular, features related to the first three spectral frequencies are here demonstrated to be statistically significant for the discrimination of PD-DN patients, while it is mainly the fundamental frequency that is relevant for PD-OFF subjects. However, for both PD-DN and PD-OFF, asymmetry is a key feature for objectively discerning the HC group.
Another key result is the correlation of bradykinesia and limb rigidity with harmonic distortion. Although studies have been conducted on this topic, rigidity assessment through wearable systems is still under examination and, as far as we know, without validated methods.
Although this work presents encouraging results, the authors are aware that the number of investigated subjects must be enlarged for improved statistical validity.
Author Contributions
Conceptualization, L.P., F.G. and G.S.; methodology, L.P., A.S., A.P., C.M.V. and G.S.; software, L.P.; validation, G.S.; formal analysis, L.P. and G.S.; investigation, L.P., A.S., A.P., G.S., A.Z., M.P. and V.R.; resources, A.S., A.P., G.S. and F.F.; data curation, L.P.; writing—original draft preparation, L.P.; writing—review and editing, G.S. and A.C.; visualization, L.P.; supervision, G.S.; project administration, G.S.; funding acquisition, G.S. All authors have read and agreed to the published version of the manuscript.
Funding
This research received no external funding.
Data Availability Statement
Data are available upon reasonable request.
Acknowledgments
We want to thank Captiks Srl for providing the wearable sensors.
Conflicts of Interest
The authors declare no conflict of interest.
References
- Ou, Z.; Pan, J.; Tang, S.; Duan, D.; Yu, D.; Nong, H.; Wang, Z. Global Trends in the Incidence, Prevalence, and Years Lived with Disability of Parkinson’s Disease in 204 Countries/Territories from 1990 to 2019. Front. Public Health 2021, 9, 776847. [Google Scholar] [CrossRef] [PubMed]
- Simon, D.K.; Tanner, C.M.; Brundin, P. Parkinson Disease Epidemiology, Pathology, Genetics, and Pathophysiology. Clin. Geriatr. Med. 2020, 36, 1–12. [Google Scholar] [CrossRef] [PubMed]
- Verrelli, C.M.; Iosa, M.; Roselli, P.; Pisani, A.; Giannini, F.; Saggio, G. Generalized Finite-Length Fibonacci Sequences in Healthy and Pathological Human Walking: Comprehensively Assessing Recursivity, Asymmetry, Consistency, Self-Similarity, and Variability of Gaits. Front. Hum. Neurosci. 2021, 15, 649533. [Google Scholar] [CrossRef] [PubMed]
- Zampogna, A.; Cavallieri, F.; Bove, F.; Suppa, A.; Castrioto, A.; Meoni, S.; Pélissier, P.; Schmitt, E.; Bichon, A.; Lhommée, E.; et al. Axial Impairment and Falls in Parkinson’s Disease: 15 Years of Subthalamic Deep Brain Stimulation. NPJ Park. Dis. 2022, 8, 121. [Google Scholar] [CrossRef] [PubMed]
- Suppa, A.; Asci, F.; Saggio, G.; Marsili, L.; Casali, D.; Zarezadeh, Z.; Ruoppolo, G.; Berardelli, A.; Costantini, G. Voice Analysis in Adductor Spasmodic Dysphonia: Objective Diagnosis and Response to Botulinum Toxin. Park. Relat. Disord. 2020, 73, 23–30. [Google Scholar] [CrossRef]
- Saggio, G.; Costantini, G. Worldwide Healthy Adult Voice Baseline Parameters: A Comprehensive Review. J. Voice 2020, 36, 637–649. [Google Scholar] [CrossRef]
- Poewe, W. Non-Motor Symptoms in Parkinson’s Disease. Eur. J. Neurol. 2008, 15, 14–20. [Google Scholar] [CrossRef]
- Goetz, C.G.; Tilley, B.C.; Shaftman, S.R.; Stebbins, G.T.; Fahn, S.; Martinez-Martin, P.; Poewe, W.; Sampaio, C.; Stern, M.B.; Dodel, R.; et al. Movement Disorder Society-Sponsored Revision of the Unified Parkinson’s Disease Rating Scale (MDS-UPDRS): Scale Presentation and Clinimetric Testing Results. Mov. Disord. 2008, 23, 2129–2170. [Google Scholar] [CrossRef] [PubMed]
- Fahn, S.; Marsden, C.; Goldstein, M.; Calne, D. State of the Art Review—The Unified Parkinson’s Disease Rating Scale (UPDRS): Status and Recommendations. Mov. Disord. 2003, 18, 738–750. [Google Scholar]
- Siderowf, A.; McDermott, M.; Kieburtz, K.; Blindauer, K.; Plumb, S.; Shoulson, I. Test-Retest Reliability of the Unified Parkinson’s Disease Rating Scale in Patients with Early Parkinson’s Disease: Results from a Multicenter Clinical Trial. Mov. Disord. 2002, 17, 758–763. [Google Scholar] [CrossRef]
- Oung, Q.W.; Muthusamy, H.; Lee, H.L.; Basah, S.N.; Yaacob, S.; Sarillee, M.; Lee, C.H. Technologies for Assessment of Motor Disorders in Parkinson’s Disease: A Review. Sensors 2015, 15, 21710–21745. [Google Scholar] [CrossRef]
- Di Lazzaro, G.; Ricci, M.; Al-Wardat, M.; Schirinzi, T.; Scalise, S.; Giannini, F.; Mercuri, N.B.; Saggio, G.; Pisani, A. Technology-Based Objective Measures Detect Subclinical Axial Signs in Untreated, de Novo Parkinson’s Disease. J. Park. Dis. 2020, 10, 113–122. [Google Scholar] [CrossRef]
- Zampogna, A.; Mileti, I.; Palermo, E.; Celletti, C.; Paoloni, M.; Manoni, A.; Mazzetta, I.; Costa, G.D.; Pérez-López, C.; Camerota, F.; et al. Fifteen Years of Wireless Sensors for Balance Assessment in Neurological Disorders. Sensors 2020, 20, 3247. [Google Scholar] [CrossRef]
- Rocha, A.P.; Choupina, H.; Fernandes, J.M.; Rosas, M.J.; Vaz, R.; Cunha, J.P.S. Parkinson’s Disease Assessment Based on Gait Analysis Using an Innovative RGB-D Camera System. In Proceedings of the 2014 36th Annual International Conference of the IEEE Engineering in Medicine and Biology Society, Chicago, IL, USA, 26–30 August 2014; Volume 2014, pp. 3126–3129. [Google Scholar]
- Ťupa, O.; Procházka, A.; Vyšata, O.; Schätz, M.; Mareš, J.; Vališ, M.; Mařík, V. Motion Tracking and Gait Feature Estimation for Recognising Parkinson’s Disease Using MS Kinect. Biomed. Eng. Online 2015, 14, 97. [Google Scholar] [CrossRef]
- Borzì, L.; Varrecchia, M.; Sibille, S.; Olmo, G.; Artusi, C.A.; Fabbri, M.; Rizzone, M.G.; Romagnolo, A.; Zibetti, M.; Lopiano, L. Smartphone-Based Estimation of Item 3.8 of the MDS-UPDRS-III for Assessing Leg Agility in People with Parkinson’s Disease. IEEE Open J. Eng. Med. Biol. 2020, 1, 140–147. [Google Scholar] [CrossRef]
- Breit, S.; Spieker, S.; Schulz, J.B.; Gasser, T. Long-Term EMG Recordings Differentiate between Parkinsonian and Essential Tremor. J. Neurol. 2008, 255, 103–111. [Google Scholar] [CrossRef]
- Mazzetta, I.; Gentile, P.; Pessione, M.; Suppa, A.; Zampogna, A.; Bianchini, E.; Irrera, F. Stand-Alone Wearable System for Ubiquitous Real-Time Monitoring of Muscle Activation Potentials. Sensors 2018, 18, 1748. [Google Scholar] [CrossRef]
- Saggio, G.; Bocchetti, S.; Pinto, C.A.; Orengo, G.; Giannini, F. A Novel Application Method for Wearable Bend Sensors. In Proceedings of the 2nd International Symposium on Applied Sciences in Biomedical and Communication Technologies, Bratislava, Slovakia, 24–27 November 2009. [Google Scholar]
- Saggio, G.; Quitadamo, L.R.; Albero, L. Development and Evaluation of a Novel Low-Cost Sensor-Based Knee Flexion Angle Measurement System. Knee 2014, 21, 896–901. [Google Scholar] [CrossRef]
- Patrick, S.K.; Denington, A.A.; Gauthier, M.J.A.; Gillard, D.M.; Prochazka, A. Quantification of the UPDRS Rigidity Scale. IEEE Trans. Neural Syst. Rehabil. Eng. 2001, 9, 31–41. [Google Scholar] [CrossRef]
- Di Lazzaro, G.; Ricci, M.; Saggio, G.; Costantini, G.; Schirinzi, T.; Alwardat, M.; Pietrosanti, L.; Patera, M.; Scalise, S.; Giannini, F.; et al. Technology-Based Therapy-Response and Prognostic Biomarkers in a Prospective Study of a de Novo Parkinson’s Disease Cohort. NPJ Park. Dis. 2021, 7, 82. [Google Scholar] [CrossRef]
- Suppa, A.; Kita, A.; Leodori, G.; Zampogna, A.; Nicolini, E.; Lorenzi, P.; Rao, R.; Irrera, F. L-DOPA and Freezing of Gait in Parkinson’s Disease: Objective Assessment through a Wearable Wireless System. Front. Neurol. 2017, 8, 406. [Google Scholar] [CrossRef] [PubMed]
- Zampogna, A.; Mileti, I.; Martelli, F.; Paoloni, M.; del Prete, Z.; Palermo, E.; Suppa, A. Early Balance Impairment in Parkinson’s Disease: Evidence from Robot-Assisted Axial Rotations. Clin. Neurophysiol. 2021, 132, 2422–2430. [Google Scholar] [CrossRef]
- Bobić, V.; Djurić-Jovičić, M.; Dragašević, N.; Popović, M.B.; Kostić, V.S.; Kvaščev, G. An Expert System for Quantification of Bradykinesia Based on Wearable Inertial Sensors. Sensors 2019, 19, 2644. [Google Scholar] [CrossRef] [PubMed]
- Di Biase, L.; Summa, S.; Tosi, J.; Taffoni, F.; Marano, M.; Rizzo, A.C.; Vecchio, F.; Formica, D.; Di Lazzaro, V.; Di Pino, G.; et al. Quantitative Analysis of Bradykinesia and Rigidity in Parkinson’s Disease. Front. Neurol. 2018, 9, 121. [Google Scholar] [CrossRef] [PubMed]
- Dai, H.; Zhang, P.; Lueth, T.C. Quantitative Assessment of Parkinsonian Tremor Based on an Inertial Measurement Unit. Sensors 2015, 15, 25055–25071. [Google Scholar] [CrossRef]
- Ricci, M.; di Lazzaro, G.; Pisani, A.; Mercuri, N.B.; Giannini, F.; Saggio, G. Assessment of Motor Impairments in Early Untreated Parkinson’s Disease Patients: The Wearable Electronics Impact. IEEE J. Biomed. Health Inform. 2020, 24, 120–130. [Google Scholar] [CrossRef]
- Zampieri, C.; Salarian, A.; Carlson-Kuhta, P.; Aminian, K.; Nutt, J.G.; Horak, F.B. The Instrumented Timed up and Go Test: Potential Outcome Measure for Disease Modifying Therapies in Parkinson’s Disease. J. Neurol. Neurosurg. Psychiatry 2010, 81, 171–176. [Google Scholar] [CrossRef]
- Lewek, M.D.; Poole, R.; Johnson, J.; Halawa, O.; Huang, X. Arm Swing Magnitude and Asymmetry during Gait in the Early Stages of Parkinson’s Disease. Gait Posture 2010, 31, 256–260. [Google Scholar] [CrossRef]
- El Arayshi, M.; Verrelli, C.M.; Saggio, G.; Iosa, M.; Gentile, A.E.; Chessa, L.; Ruggieri, M.; Polizzi, A. Performance Index for in Home Assessment of Motion Abilities in Ataxia Telangiectasia: A Pilot Study. Appl. Sci. 2022, 12, 4093. [Google Scholar] [CrossRef]
- Saggio, G.; Tombolini, F.; Ruggiero, A. Technology-Based Complex Motor Tasks Assessment: A 6-DOF Inertial-Based System Versus a Gold-Standard Optoelectronic-Based One. IEEE Sens. J. 2021, 21, 1616–1624. [Google Scholar] [CrossRef]
- Anderson, E.; Nutt, J. The Long-Duration Response to Levodopa: Phenomenology, Potential Mechanisms and Clinical Implications. Park. Relat. Disord. 2011, 17, 587–592. [Google Scholar] [CrossRef]
- Zampogna, A.; Manoni, A.; Asci, F.; Liguori, C.; Irrera, F.; Suppa, A. Shedding Light on Nocturnal Movements in Parkinson’ s Disease: Evidence from Wearable Technologies. Sensors 2020, 20, 5171. [Google Scholar]
- Colantonio, P.; Giannini, F.; Leuzzi, G.; Limiti, E. High Efficiency Low-Voltage Power Amplifier Design by Second-Harmonic Manipulation. Int. J. RF Microw. Comput.-Aided Eng. 2000, 10, 19–32. [Google Scholar] [CrossRef]
- Colantonio, P.; Giannini, F.; Leuzzi, G.; Limiti, E. Harmonic Tuned PAs Design Criteria. IEEE MTT-S Int. Microw. Symp. Dig. 2002, 3, 1639–1642. [Google Scholar] [CrossRef]
- Berardelli, A.; Sabra, A.F.; Hallett, M. Physiological Mechanisms of Rigidity in Parkinson’s Disease. J. Neurol. Neurosurg. Psychiatry 1983, 46, 45–53. [Google Scholar] [CrossRef]
- Ruonala, V.; Pekkonen, E.; Airaksinen, O.; Kankaanpää, M.; Karjalainen, P.A.; Rissanen, S.M. Levodopa-Induced Changes in Electromyographic Patterns in Patients with Advanced Parkinson’s Disease. Front. Neurol. 2018, 9, 35. [Google Scholar] [CrossRef]
Disclaimer/Publisher’s Note: The statements, opinions and data contained in all publications are solely those of the individual author(s) and contributor(s) and not of MDPI and/or the editor(s). MDPI and/or the editor(s) disclaim responsibility for any injury to people or property resulting from any ideas, methods, instructions or products referred to in the content. |
© 2023 by the authors. Licensee MDPI, Basel, Switzerland. This article is an open access article distributed under the terms and conditions of the Creative Commons Attribution (CC BY) license (https://creativecommons.org/licenses/by/4.0/).