Article

Diagnosis of Autism Spectrum Disorder Using Convolutional Neural Networks

1
Management Information System Department, Cyprus International University, Nicosia 99258, Cyprus
2
Department of Electrical and Electronics Engineering, Cyprus International University, Nicosia 99258, Cyprus
3
Department of Computer Engineering, Northern Cyprus Campus, Middle East Technical University, Mersin 10, Ankara 06800, Turkey
*
Author to whom correspondence should be addressed.
Electronics 2023, 12(3), 612; https://doi.org/10.3390/electronics12030612
Submission received: 5 January 2023 / Revised: 17 January 2023 / Accepted: 21 January 2023 / Published: 26 January 2023
(This article belongs to the Section Computer Science & Engineering)

Abstract

:
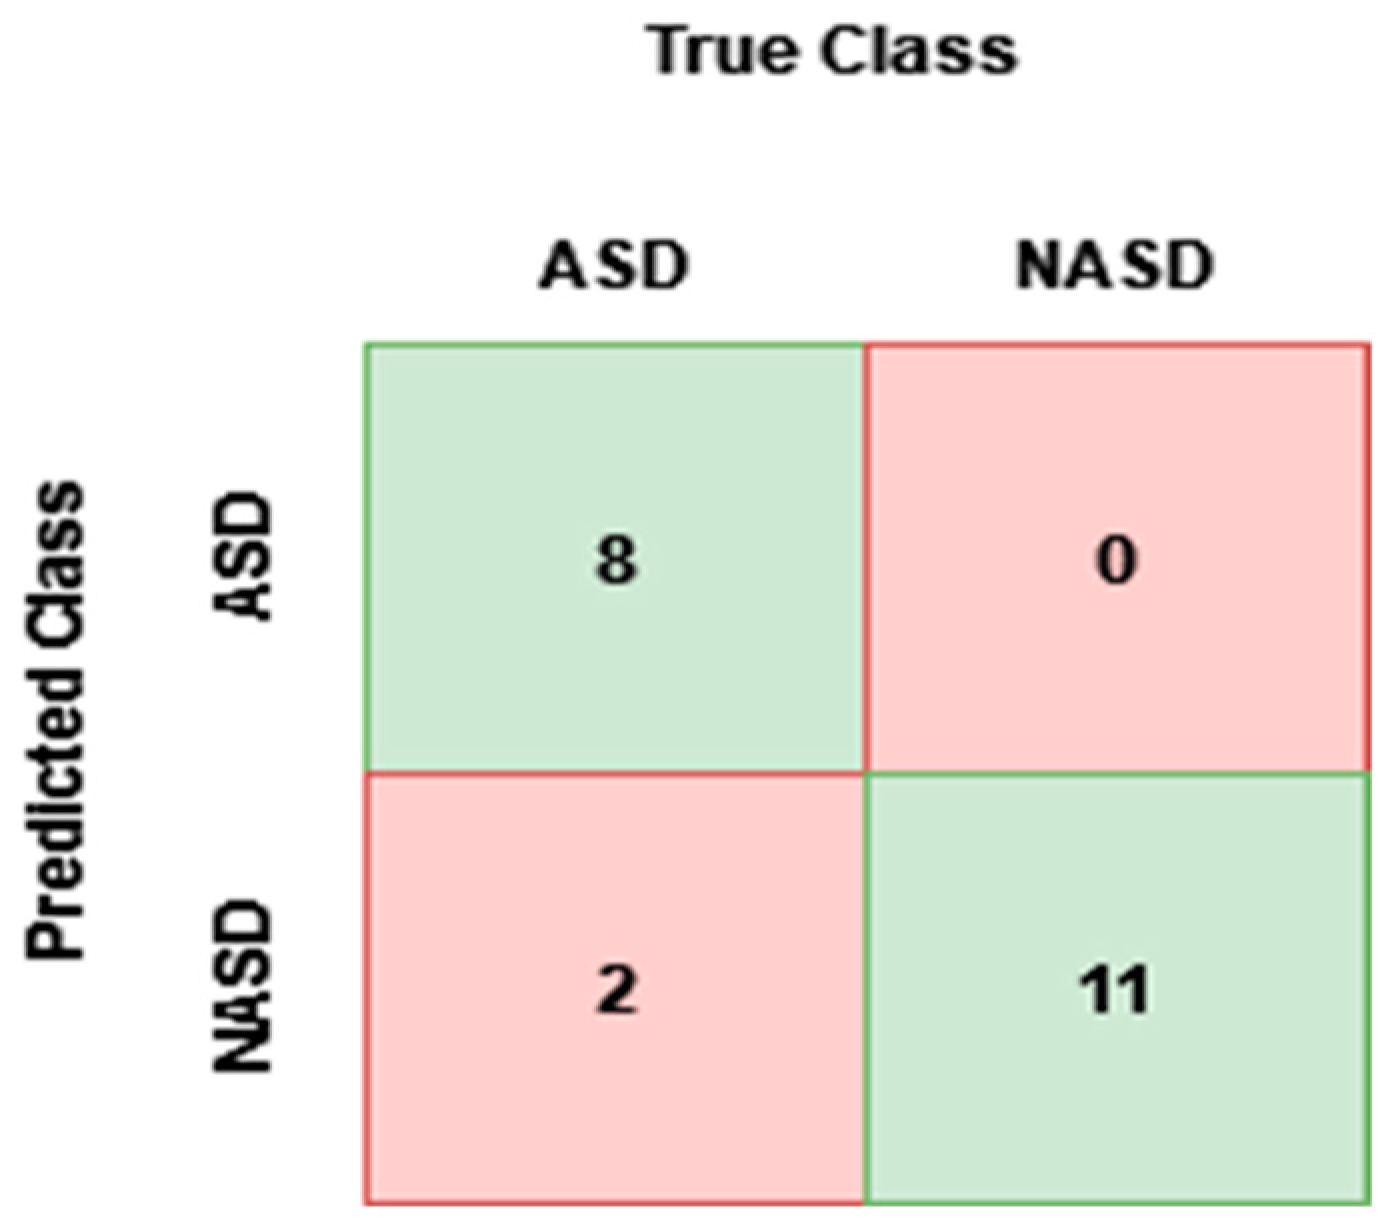
Autism spectrum disorder as a condition has posed significant early diagnosis challenges to the medical and health community for a long time. The early diagnosis of ASD is crucial for early intervention and adequate management of the condition. Several kinds of literature have shown that children with ASD have varying degrees of challenges in handwriting tasks; hence, this research has proposed the creation of a handwritten dataset of both ASD and non-ASD subjects for deep learning classification. The created dataset is based on a series of handwritten tasks given to subjects such as drawing and writing. The dataset was used to propose a deep learning automated ASD diagnosis method. Using the GoogleNet transfer learning algorithm, each handwritten task in the dataset is trained and classified for each subject. This is done because in real-life scenarios an ASD subject may not comply to performing and finishing all handwritten tasks. Using a training and testing ratio of 80:20, a total of 104 subjects’ handwritten tasks were used as input for training and classification, and it is shown that the proposed approach can correctly classify ASD with an accuracy of 90.48%, where sensitivity, specificity, and F1 score are calculated as 80%, 100%, and 100%, respectively. The results of our proposed method exhibit an impressive performance and indicate that the use of handwritten tasks has a significant potential for the early diagnosis of ASD.

1. Introduction

Interest in ASD has seen a dramatic increase in the medical and research community, which has significantly impacted its definition and perception in general [1]. Thus, Autism Spectrum Disorder has changed in definition in the past 50 years. ASD has evolved from a topic that was merely seen as a disorder in children into a topic that has given insight into a condition that is now understood as a disorder heterogeneous to all age groups of people [2]. ASD is defined as a disorder that is generally represented by conditions under a wide spectrum, which are categorized from mild to severe. These conditions are synonymous with social communication deficiency as well as unusual and repetitive sensory and motor behaviors. For example, due to the fact that children with autism exhibit reactions to sensory stimuli, this results in behavioral problems, which lead to self-injury and danger for themselves and others. Traveling with them can be very challenging for parents.
In recent years, technology has become more and more utilized for the comfort of children with autism spectrum disorders, for instance, in [3], the physiological effect of deep pressure, an autism hug machine portable seat (AHMPS), has been investigated for children with ASD and it was reported that the AHPMS decreases the physiological arousal of children with ASD during travel in public transportation. The ability of people living with ASD to manage this condition appropriately is greatly related to the lifelong support system provided. For instance, a timely and effective diagnosis of ASD by healthcare is one of the critical and crucial aspects [4]. ASD can be managed properly and efficiently through ways such as medication and therapeutic education through behavioral services for the people living with ASD [5]. It has been noted that ASD has a varying degree of manifestation in individuals. However, it is characterized by some common and general markers including restrictions and repetitive social communication, as well as motor and sensory behaviors. These characterizations have formed what is referred to as the core features of the diagnosis of ASD, since these are prevalent in people living with the condition regardless of a subject’s ethnicity and socio-economic group. In 2013, the Statistical Manual of Mental Disorders (DSM) along with the American Psychiatric Association diagnostics published criteria for the diagnosis of ASD. The criteria have a general basis in behavioral analysis, which was published to enable health professionals to have a less challenging process when diagnosing the condition in people, which has always been considered challenging. The published criterion categorized ASD into two domains, namely Asperger’s disorder and pervasive developmental disorder. Although the published criterion has helped in giving a guideline for the diagnosis of this condition, it still has not been able to provide a single accepted method for the diagnosis of the condition, and this still leaves health professionals with challenges regarding the diagnosis of ASD [6].
Over the years, there has been the availability of instruments that have been suggested by several researchers to help in the diagnosis of ASD, such as the Screening Tool for Autism in Toddlers and Young Children (STAT) and the Autism Diagnostic Observation Schedule (DOS). Such diagnostic tools are meant to provide health professionals with more insight when carrying out diagnosis of a subject to enable them to arrive at an accurate diagnosis, and these tools are also known to use adaptive scales which, when incorporated with the informational history of the subjects being diagnosed, aids in a proper diagnosis of the subjects [7]. STAT is a tool developed with interactive items to screen children between the ages of 24 months and 35 months. This tool consists of 12 activities that were designed to analyze the social communicative behaviors of subjects. The activities have the advantage of giving a direct observation of the subjects’ key behaviors. STAT as an autism evaluation tool in children has shown great promise with strong predictive values that have specificity. For instance, it has shown effectiveness in distinguishing children with autism and those without autism within the age range from 24 months to 35 months [8]. ADOS is a set of protocols that have been standardized to be used in observing and analyzing the social–communicative behavior of subjects who have been associated with ASD. ADOS consists of processes that have been particularly structured for interaction with some specified targeted behaviors in subjects and used to rate the quality of their behaviors. ADOS as a tool for ASD detection is highly recommended by the National Institute for Health and Care Excellence (NICE) as an objective and efficient tool with sufficient predictive quality for the diagnosis of ASD [9]. Despite the availability, notable progress, and development made in the diagnosis of ASD over the course of history, there have been reports of significant challenges faced in the diagnosis of ASD in subjects. In fact, some of these challenges are being posed to the diagnosis processes by the diagnosis instruments themselves, because the methods of the instruments have been found to be varying in different regions or countries due to the diversity of cultures which are dictated by differences in social norms and communication methods [10].
Children who display early signs and symptoms of the known characteristics of ASD shown by developmental disabilities are fortunate to have early management treatments from an appropriate specialist, whereas the children who do not display early known signs and symptoms will be unfortunate with regard to early management treatments, which would have otherwise made life more comforting for them and their loved ones. There is a general neglect of diagnosis toward children who have shown efficient verbal communication skills. For instance, according to the Centre for Disease Control and Prevention (2012), intellectual capacity disabilities in children between the ages of 2 and 3 are challenging to diagnose, which further makes the diagnosis of ASD in children more challenging and leads to delays in the possible early management of the condition in children with ASD [11]. A high prevalence of ASD has been reported in recent years, and this means that there is an increase in efficient diagnostic tools to enable the proper management of the rising cases of the disorder. One significant challenge exists in this regard, namely that the medical diagnosis processes have complex guidelines which is seen as time-consuming and language-constraint faced. These challenges have prompted the computational research communities to offer viable solutions for the diagnosis of ASD. For instance, the study presented in [12] has shown promise in the computational classification of ASD. As with all computational solutions, they are conducted with a single purpose in mind; to provide a more efficient solution. It is very critical to arrive at an accurate diagnosis, as with every other ailment or medical condition, to enable the provision of the required care to the person in need [13].
Machine learning has been applied in various fields in almost all disciplines [14]. For instance, in the biomedical field, several different approaches such as support vector machines and neural networks [15,16] have been adopted. The biomedical field has seen a surge in the application of computational artificial intelligence, and especially the application of deep learning techniques. Deep learning techniques have been one of the most successful applications of machine learning techniques in the biomedical field due to their accurate detection of cases of skin cancer, diabetic retinopathy [17], and other clinical cases of diagnosis using image data [18]. A study by Dimitri et al. [19] applied a multiplex computational model for the analysis of heart rate (HR) and intracranial pressure (ICP) behavior in pediatric patients with traumatic injuries. Their study sought to analyze and evaluate the relationship between HR and ICP in events of traumatic injuries in pediatric patients. The findings of their study reported a significant indication of cross-talk events and mutual interaction between HR and ICP in the patients. A review of deep learning applications for ASD diagnosis has been reported by Khodatars et al. [20], and they reported a series of experiments that used deep learning techniques in the classification of neuroimaging image data for the diagnosis of ASD. Deep learning has also been applied in magnetic resonance imaging and electroencephalography [21]. This paper primarily aims to present a solution for the classification and diagnosis of ASD using machine learning while utilizing the handwritten analysis of subjects by applying transfer learning to the acquired data. This research proposes the use of transfer learning for the classification of ASD and non-ASD subjects using acquired data from handwritten tasks.

Study Contribution

This study proposes the use of handwritten tasks of ASD and non-ASD subjects as input of deep learning-based classification for diagnosis of ASD subjects. The proposed study initiates the creation of a handwritten task dataset by carefully designing handwritten tasks.
In this paper, the handwriting of subjects is utilized for ASD classification since collecting handwriting is relatively easy, cheap, and more accessible. Several different tasks are given to subjects, such as drawing circles and rectangles on a tablet. The main contributions of this paper are listed below:
  • Proposing an approach to diagnose ASD based on deep learning, which utilizes the subjects’ handwriting;
  • Creating a handwriting dataset to diagnose ASD, which to the best of the author’s knowledge is not available in the literature;
  • Proposing an approach that ensembles neural networks to accept varying numbers of input images (for different tasks).
The block diagram of the proposed system is shown in Figure 1. A dataset from 104 subjects is collected (51 of them are from subjects with ASD and 53 of them are from subjects without ASD), where each subject is asked to complete 18 different tasks such as drawing circles, squares, or writing letters and numbers on to a tablet. The data collected from these subjects are divided into training (80%) and testing (20%) sets. In the training set, data collected from a total of 83 subjects are used and, for the testing set, data collected from 21 subjects are used. As stated before, since a subject with ASD may not be willing to finish the given task, the suggested algorithm should be able to run with a variable number of images as input. For each task, such as drawing a circle, a different network is trained (in total, 18 different networks are trained; one for each task). For testing, a total of 18 different images are provided by each subject. Thus, the image for each task is fed into a different network and a classification label is obtained from each of them. For the end result, the median label is used as can be seen in Figure 1.
The remainder of this paper is organized as follows; Section 2 is the literature review chapter that is used to provide a theoretical background for the study by reviewing related studies’ methodologies and reported research findings, Section 3 of the article comprehensively introduces the dataset of the study; its acquisition, preprocessing, and other relevant details. Section 4 is the data augmentation and hyperparameters that contain the parameter of the simulation. Section 5 discusses the proposed research methodology and the application techniques of the proposed methodology. Section 6 presents the result of the experiments carried out. Section 7 is a discussion of the findings of the research. Section 8 is the concluding section of the research, which also offers recommendations based on the research findings.

2. Related Work

There have been several published studies that have applied machine learning to implement proposed diagnosis solutions in recent years. One of the earliest of such studies is presented by [22], which proposed a solution to automate through computerization the popular Autism Diagnostic Observation Schedule (ADOS) tool (which consists of a set of standardized scenarios, where the reactions of the child are observed).
Another study presented by [23] yielded an accuracy of up to 86.5% with the automated classifications compared to the classifications conducted by healthcare professionals on the same subjects. Their proposed machine learning classifications were conducted using data from children during their social interactions to develop an algorithm through such evaluations. Although the above approaches yielded satisfactory results, they are based on the social interactions of subjects, and a set-up needed to be prepared by a professional practitioner. In addition, still, a more accessible approach is needed to observe early indications of ASD. There have been several studies that used neuroimaging data for the classification of ASD. The neuroimaging data is obtained as a result of MRI scans of subjects and used to train the machine learning systems. One such study is presented in [24], where the gray and white matter of the brain were used according to their volume to measure the structural MRI scan images of the brain. The use of neuroimaging in machine learning with regard to the diagnosis of ASD have been applauded as being more objective when compared to the more subjective methods of using behavioral data in training the machine learning systems. The application of neuroimaging in machine learning for the classification of ASD has seen an increase in its acceptance among researchers because ASD is categorized as a neurodevelopmental disorder [25]. Unfortunately, neuroimaging may still not always be accessible and can also be costly. Thus, an approach that is easily accessible and cheap is still an emerging need to observe early indications of ASD [26]. In the research by [27], an assembly of score sheets for ADOS modules for both ASD and non-ASD cases is carried out. Their study used a regularization technique based on sparsity and parsimony nested in cross-validation, using supervised learning with 17 selected features to form detectable classifiers for ASD as opposed to non-ASD.
The use of deep learning for the diagnosis of ASD has been proposed by some researchers. However, unlike the methodology proposed here which uses the handwriting of children with ASD, the methodologies of previous approaches found in the literature used different forms of data to carry out the deep learning algorithms. Some of the studies which proposed deep learning for ASD diagnosis include Heinsfeld et al. [28], which carried out deep learning on the Autism Brain Imaging Data Exchange (ABIDE) dataset. Their study attempted to unveil neural patterns in the deep learning classification of the data to show a correlation between brain posterior and anterior areas disruption. This study reported a diagnosis recognition performance of 70%. Another study by Sewani and Kashef [29] also used the ABIDE dataset with a proposed method they called the autoencoder deep learning classification. Their deep learning model uses a combination of supervised deep learning, unsupervised deep learning, and autoencoders. The autoencoders used in this study were used particularly to extract the low-level features that the deep learning CNN typically does not extract. Their study reported a performance accuracy of 84.05%. Zhou et al. [30] proposed a deep neural network model which uses a speech spectrogram for classification. Their methodology used speech utterances extracted from subjects with ASD with a large dimensional acoustic feature, the speech utterances were recorded during the tasks of the ADOS, and their study reported a performance of up to 90% accuracy. Ahmed et al. [31] carried out an approach to ASD using eye-tracking diagnosis application with deep machine learning techniques. Their study reported a classification accuracy of up to 95.5% using GoogleNet for the classification of eye-tracking images for ASD diagnosis.
Kong et al. [32] proposed the use of MRI brain network images of subjects for the classification of ASD against typical control subjects. The study utilized feature selection from the ABIDE dataset and autoencoder deep neural network, and the study reported a performance accuracy of 90.39%. Haweel et al. [33] proposed the use of a novel computer-aided grading framework based on speech-activated brain responses in infants. Their study evaluated a total of 157 ASD subjects, using global and local feature extraction for two-stage recognition, and the study reported a performance accuracy of 81%. Cilia et al. [34] proposed the use of eye-tracking visualized data for ASD classification and recognition. In their study, they proposed the use of scan paths to track the eye movements of subjects, and the scan paths were then encoded using color gradients. The acquired features were trained and classified on a CNN network, and they reported a performance accuracy of 90%. Table 1 shows previous studies and their proposed methodologies with respective performances.

3. Dataset and Preprocessing

After an intensive literature review, to the best of the author’s knowledge there is a lack of availability of a handwriting dataset of subjects with ASD. Hence, for the study presented in this paper, we collect data and create our own research dataset. The dataset for this study was collected in a homogenous environment using a device called the Intuos Wacom Professional, which is a tablet computer used in capturing handwritten tasks. The Wacom professional tablet is an ergonomic, efficient hardware that is suitable for both right-handed and left-handed individuals. The device is capable of working in paper mode which made it suitable for tracing handwritten task templates by the subjects. The device is manufactured in the United States of America, having a pen pressure level of 8192, 60 tilt levels recognition, and 5080 LPI (lines per inch) resolution. This device is capable of electronically capturing handwritten tasks while also providing a physical capture of the task on paper. The collected dataset contains 104 participants which contain ASD (51 of them) and non-ASD (53 of them) subjects. The dataset contains a total of 18 handwritten tasks from every child and of the 18 handwritten tasks, 12 were text writing tasks, and 6 were shape-drawing tasks.
The tasks carried out by these subjects are described as follows:
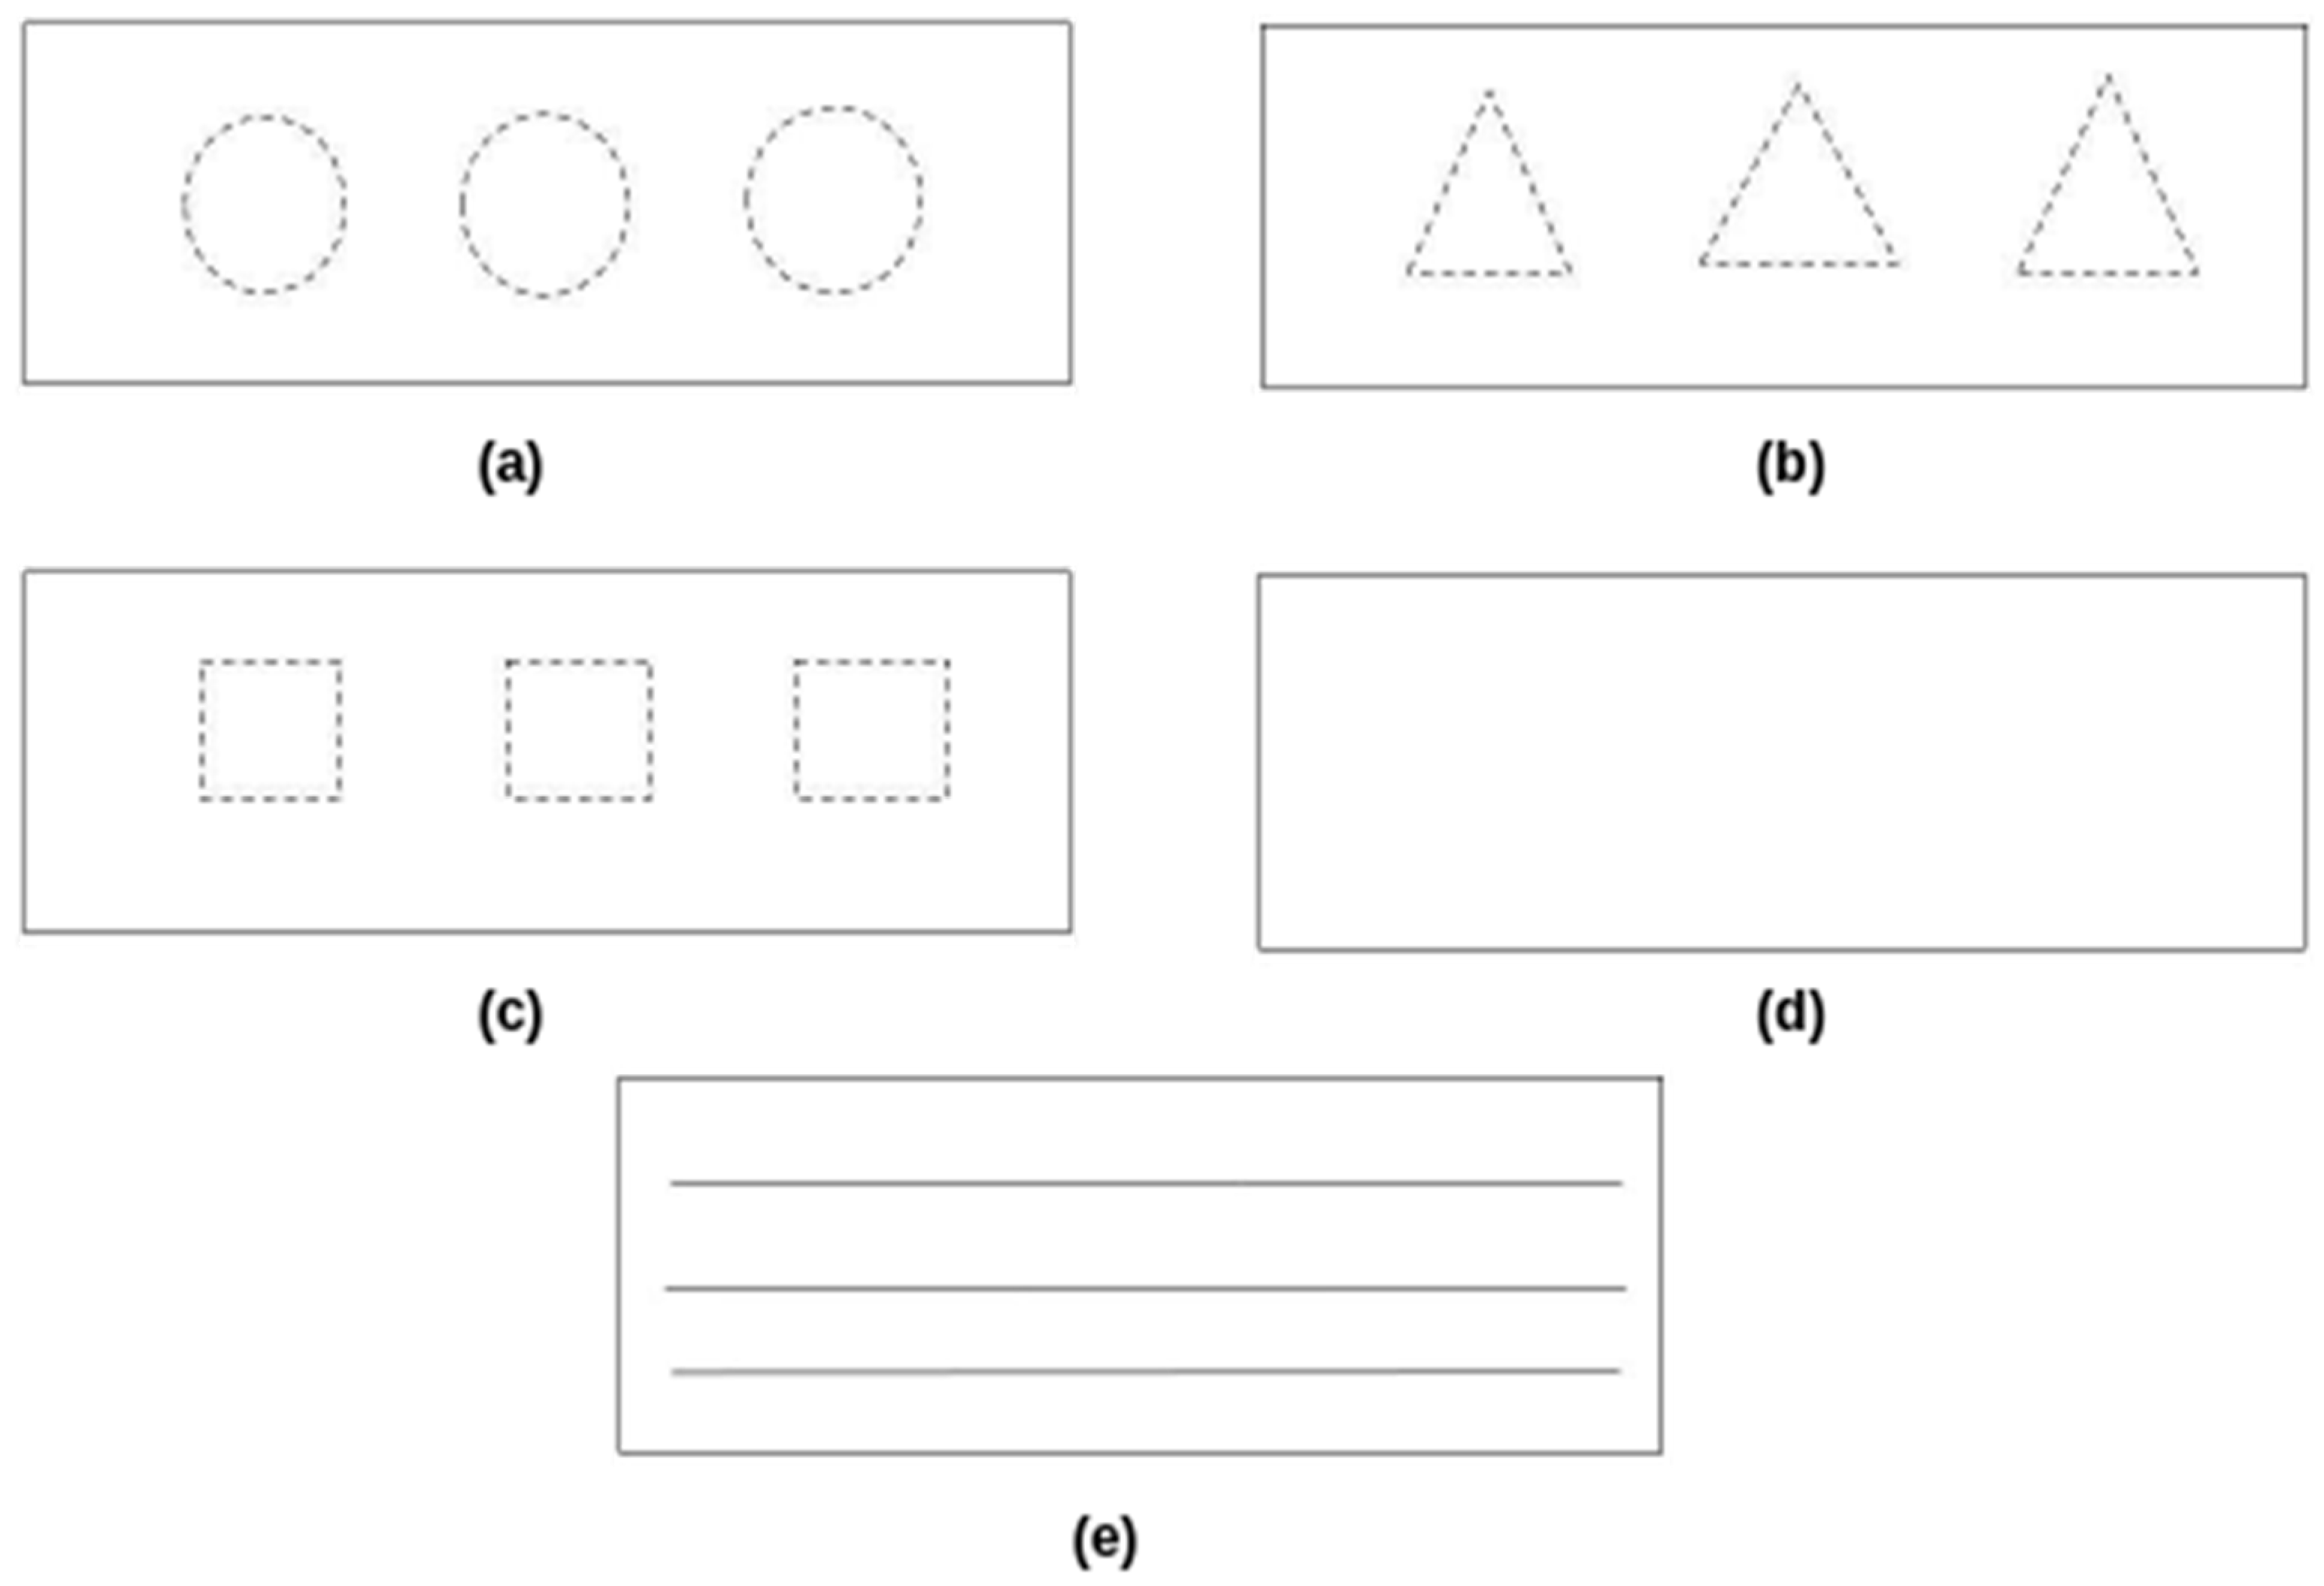
Task 1: a circle shape drawing task on a template with outlines that marked the shape to be drawn, as shown in Figure 2a.
Task 2: a triangle shape drawing task on a template with outlines that marked the shape to be drawn, as shown in Figure 2b.
Task 3: a square shape drawing task on a template with outlines that marked the shape to be drawn, as shown in Figure 2c.
Task 4–Task 6: where task 4 is a circle shape, task 5 is a triangle shape, and task 6 is a square shape, drawing tasks on a template with no outlines to guide the drawing process, as shown in Figure 2d.
Task 7–Task 9: These tasks are number writing of “1,2,3,4,5” on a template with ruled lines that guide the writing of the numbers, as shown in Figure 2e.
Task 10–Task 12: These tasks are number writing of “1,2,3,4,5” on a template with no ruled lines to guide the writing of the numbers, as shown in Figure 2d.
Task 13–Task 15: These tasks are text writing tasks of writing “cat and dog”, on a template with ruled lines that guide the writing of the text, as shown in Figure 2e.
Task 16–Task 18: These tasks are text writing tasks of writing “cat and dog”, on a template with no ruled lines to guide the writing of the text, as shown in Figure 2d.
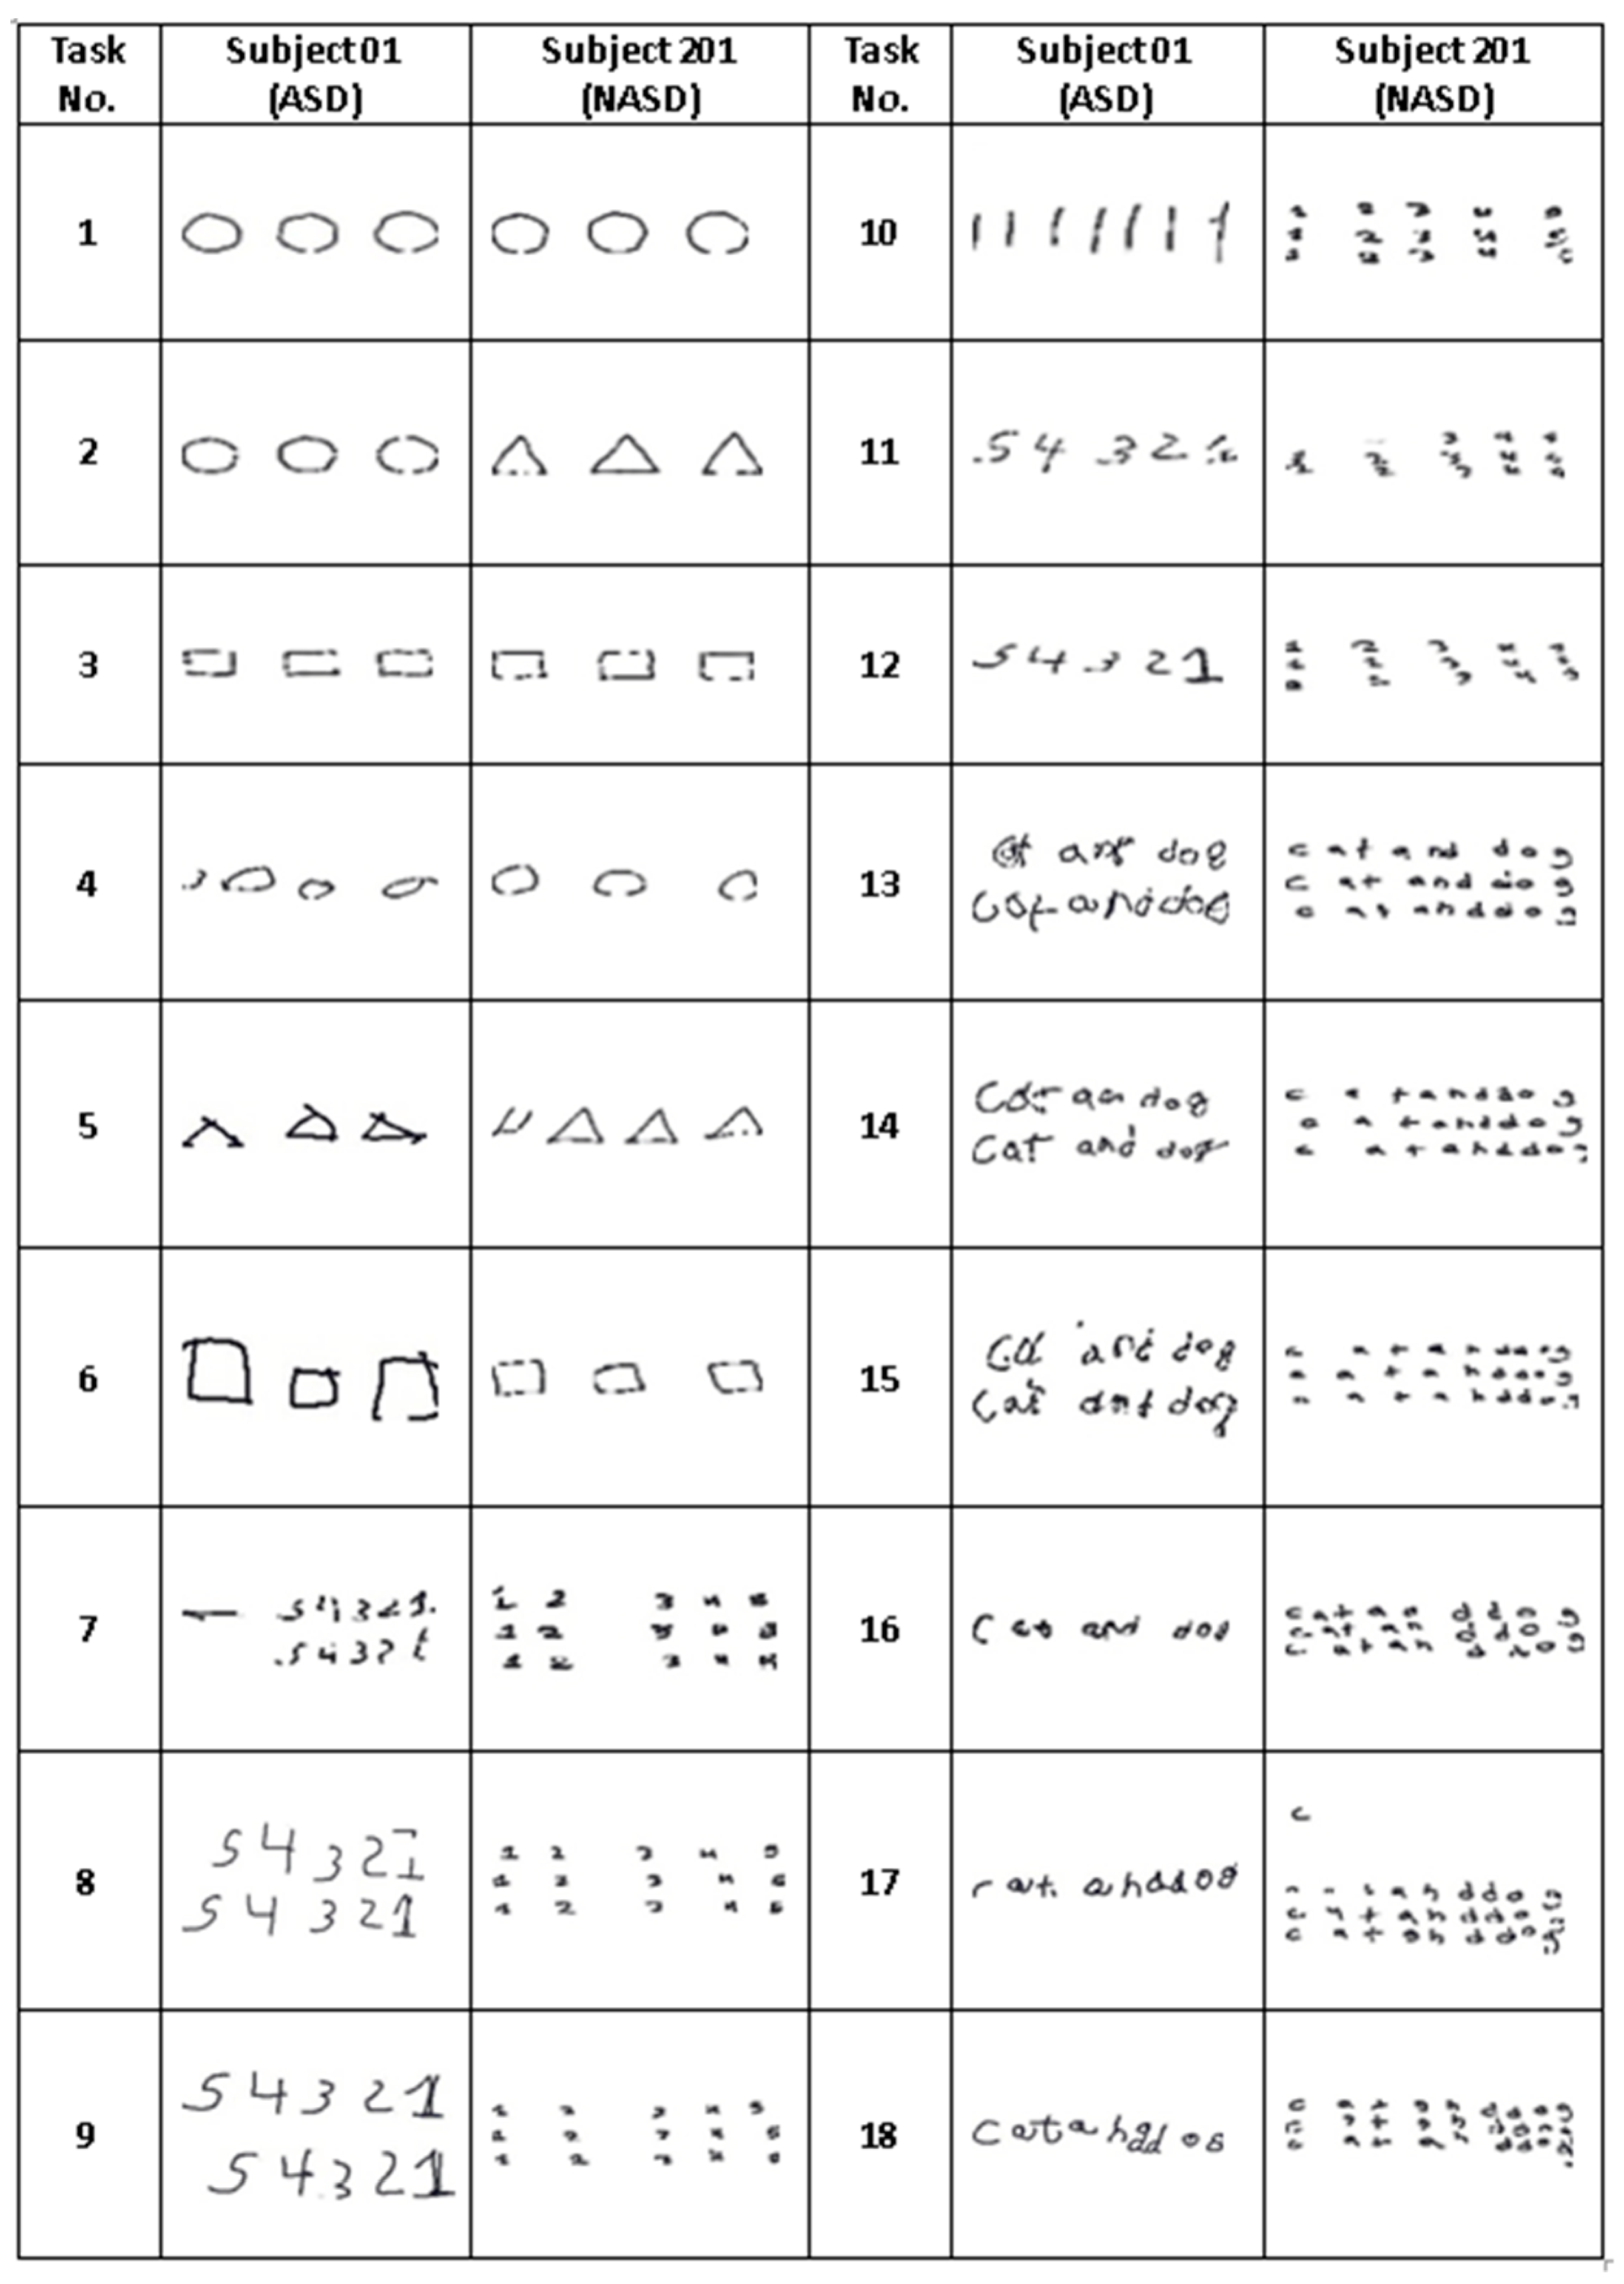
In Figure 3, the collected drawings from two subjects are shown where one of them is with ASD and the other without ASD for all 18 tasks.
The images captured by Intuos Wacom Professional are high in resolution (1349 by 678). On the other hand, the input of GoogleNet is only 224 by 224. Thus, to feed these images to GoogleNet, we simply rescale the input image to a size of 224 × 224. However, the actual drawing would only hold a small portion of the input. Thus, in this paper, an automatic cropping script has been written to alleviate this issue.
The preprocessing script used in our research was designed as follows. First, minimum and maximum locations of the pixels are calculated for the input image, and then, the image is cropped and empty areas are removed, this is illustrated in Figure 4. Then, before rescaling, cropped images are padded in a such way that the aspect ratio would be equal to one as it is in GoogleNet. Then, the output image is rescaled to 224 by 224. This can be seen in Figure 5, where first the input image has been automatically cropped, and then, padded to make the aspect ratio equal to one without any rescaling. Finally, images are rescaled to set the resolution 244 by 244, which makes it suitable input for GoogleNet.
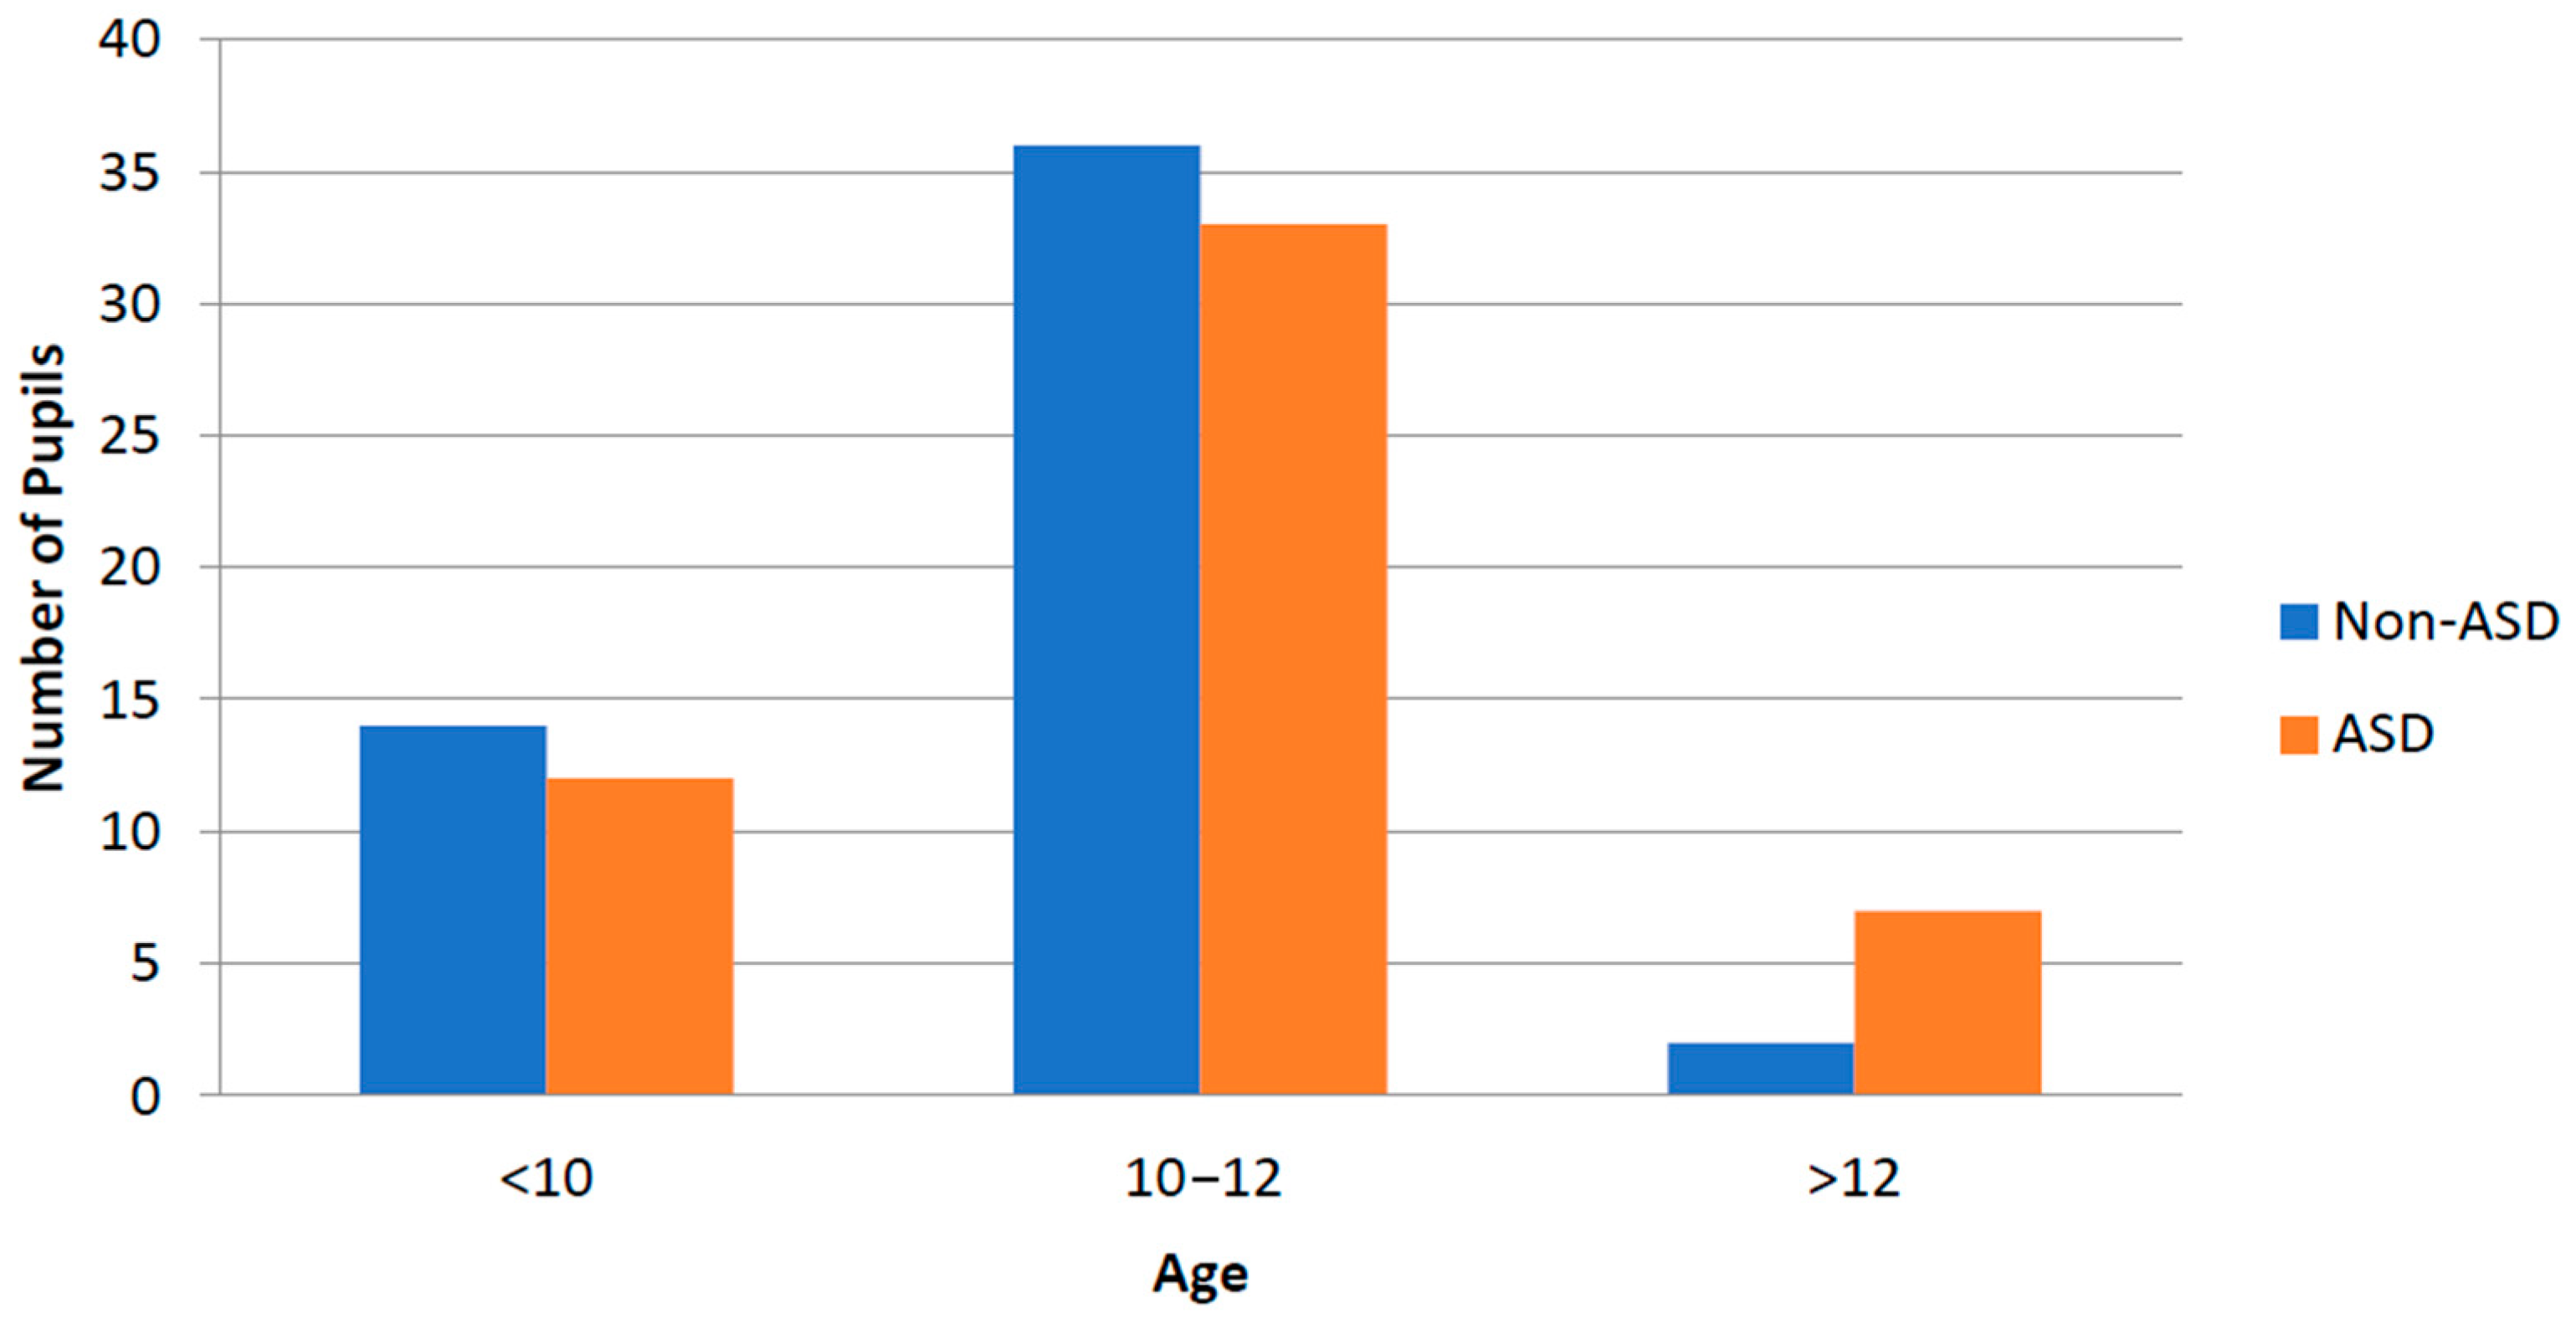
The age distribution of the subject can be seen in Figure 6, where the youngest child was 7 years of age and the oldest child was 15 years of age.
The training and testing of our convolutional neural network (which GoogleNet was applied to for transfer learning) were conducted using the 80:20 training and testing ratio, the data used in training were used as classified in the data processing stage; ASD and NASD, and our network was set up to classify NASD as 0 and ASD as 1.

4. Data Augmentation and Hyperparameters

In order to minimize the consequences of the overfitting problem due to the limited number of training data, apart from transfer learning, data augmentation is applied to the input data. For each epoch, input data is rotated, shifted, and reflected randomly [17].
While training, the dropout probability is set to be 0.9 to minimize overfitting, while the initial learning rate is set to be 10−4 with a batch size of 20 and trained for 200 epochs. The data augmentation for the input images is performed by rotating and shifting for each epoch at random. The data augmentation is carried out on the training data, and this implies that at every training stage for every k-fold experiment, 83 images of the training set are subjected to augmentation through rotation and shifting at every epoch of training.

5. Methodology

The proposed methodology is limited by the research aim and objective; early diagnosis of ASD in children. The dataset used in this study was limited to handwritten data of children as the subjects with ages ranging from 7 years to 15 years. The design of our proposed method starts with a data preprocessing stage, where all data in the research dataset are processed to fit the proposed experimental setup of the study. After the data preprocessing, the preprocessed data is used to train the deep learning networks. Figure 7 illustrates the proposed research methodology flowchart.

5.1. Convolutional Neural Network (CNN)

Artificial intelligence has seen immense growth and development in recent years. This growth has led to great achievements in bridging the existing gap between the capacity of machines and that of humans. One of the notable aspects of computing that has contributed to this achievement is the convolutional neural network (CNN). The CNN is an algorithm of machine learning which has been designed to handle tasks of machine learning such as image recognition, analysis, and processing of natural human language. The CNN is an algorithm that is capable of taking images and estimating the parameters of neural network models accurately [35]. The CNN has wide applications in the field of medicine and computer vision since it is efficient in using its architecture to factor in the characteristics of two-dimensional images parsed to it as data. The CNN has been applauded as a machine learning algorithm with exceptional performance, having a set of layers that are all fully connected; the pooling layer and convolution layer [36]. Additionally, the CNN is notably a powerful algorithm compared to other image processing and machine learning algorithms since it has a relatively lower requirement of preprocessing [37].

5.2. Transfer Learning

The availability of relatively few data causes a CNN problem known as overfitting, and that in turn leads to a lower accuracy performance from the algorithm [38]. Transfer learning is a machine learning technique that is used to solve the issue of relatively low data used in a CNN [39]. It works in a manner where a pre-trained model from a larger dataset is reused on another task by transferring the learned parameters to a new network.
Transfer learning significantly cuts down the computational requirement on the training of the new model. The previously trained network is used to train the new networks by using its weights and only replacing the final layers. This enables the previously trained network to provide the new network with feature extraction capabilities based on its own large dataset analysis and processing. The application of transfer learning has been notably reported in machine learning applications with regard to the field of medicine due to the general constraint of low image data availability [40]. As mentioned above, it is not easy to collect data from subjects with ASD. Thus, to minimize the consequences of overfitting, transfer learning has been used in this study. More specifically, the pre-trained GoogleNet architecture has been used, and the final layers (fully connected layer, SoftMax, and classification layer) are retrained for the task at hand.

5.3. GoogleNet

GoogleNet [41] is among the state-of-the-art convolutional neural network architectures, which has a deep and complex CNN architecture that introduced a module known as “Inception”. The inception module carries out the task of concatenating different-sized filters into a single filter. GoogleNet architecture has a total of nine inception layers, with two pooling layers as well as two convolution layers, and within each inception layer there is a total of six convolution layers and a pooling layer. GoogleNet was introduced as a CNN architecture in the ILSVRC challenge where it scored a top-5 classification error of 5.5%, outperforming powerful CNN architectures such as Alexnet [42]. Figure 8 below shows a simplified illustration of the GoogleNet architecture [36]. The experiments in our study using the GoogleNet model leverage on training the last layers of the model; by using the transfer learning of the model, the model extracts features from our image data input robustly even with the limited amount of training data we provide.

5.4. Cross Validation

Cross-validation is a statistical method used for evaluating machine learning algorithms. Cross-validation is a process intended to divide a dataset into training, validation, and testing datasets, whereby the training and validation sets are used for model training and hyperparameter adjustment, and the testing set is used for testing the model [43]. This study uses the k-fold cross-validation method where the number of folds in the cross-validation is five folds, which implies a five-fold cross-validation (the test set is divided into five folds). The training and testing set have 83 and 21 images, respectively. Additionally, in efforts to mitigate overfitting in our training experiments, the dropout hyperparameter was adjusted to 0.9 and data augmentation was applied. (For applied data augmentation see Section 5).

5.5. Evaluation Metrics

Sensitivity is the measure of the true positives that are identified or recognized as true positives, which is also known as Recall. This definition implies that there is a tendency of having true positive values, which may be identified or recognized as false or negative values. Sensitivity is mathematically calculated, as shown in Formula (1), where TP denotes a true positive and FN denotes a false negative. Specificity is the measure of the true negatives that are identified or recognized as true negatives, and this definition implies that there is a tendency to misclassify true positives as true negatives. Specificity is mathematically calculated, as shown in Formula (2) where TN denotes a true negative and FP denotes a false positive. Accuracy is defined as the total number of correctly classified images divided by the total number of tested images. F1 score is a harmonic mean of both precision and recall [44,45].
S e n s i t i v i t y = TP T P + F N
S p e c i f i c i t y = T N T N + F P
A c c u r a c y = T P + T N T P + T N + F P + F N
F 1   S c o r e = T P ( T P + 0.5 ( F P + F N ) )

6. Results

For the purpose of research comparison, our preprocessed data were trained on other CNN models in order to see the performance of GoogleNet as the primary model for our study. For training, a different network has been trained for each task (circle drawing, triangle drawing, number writing, etc.) and, for testing, a label is assigned to the subject based on the median label acquired from these networks (18 in total). Other models which were also experimented with are Alexnet, Resnet 18, VGG 16, and Squeeze net. The same training and testing dataset ratios were used for all CNN models, with five-fold cross-validation. The results of all five CNN models are shown in Table 2. The average accuracy of all five models shows GoogleNet and Squeeze net having the highest average accuracy with both networks having a 90.48% accuracy.
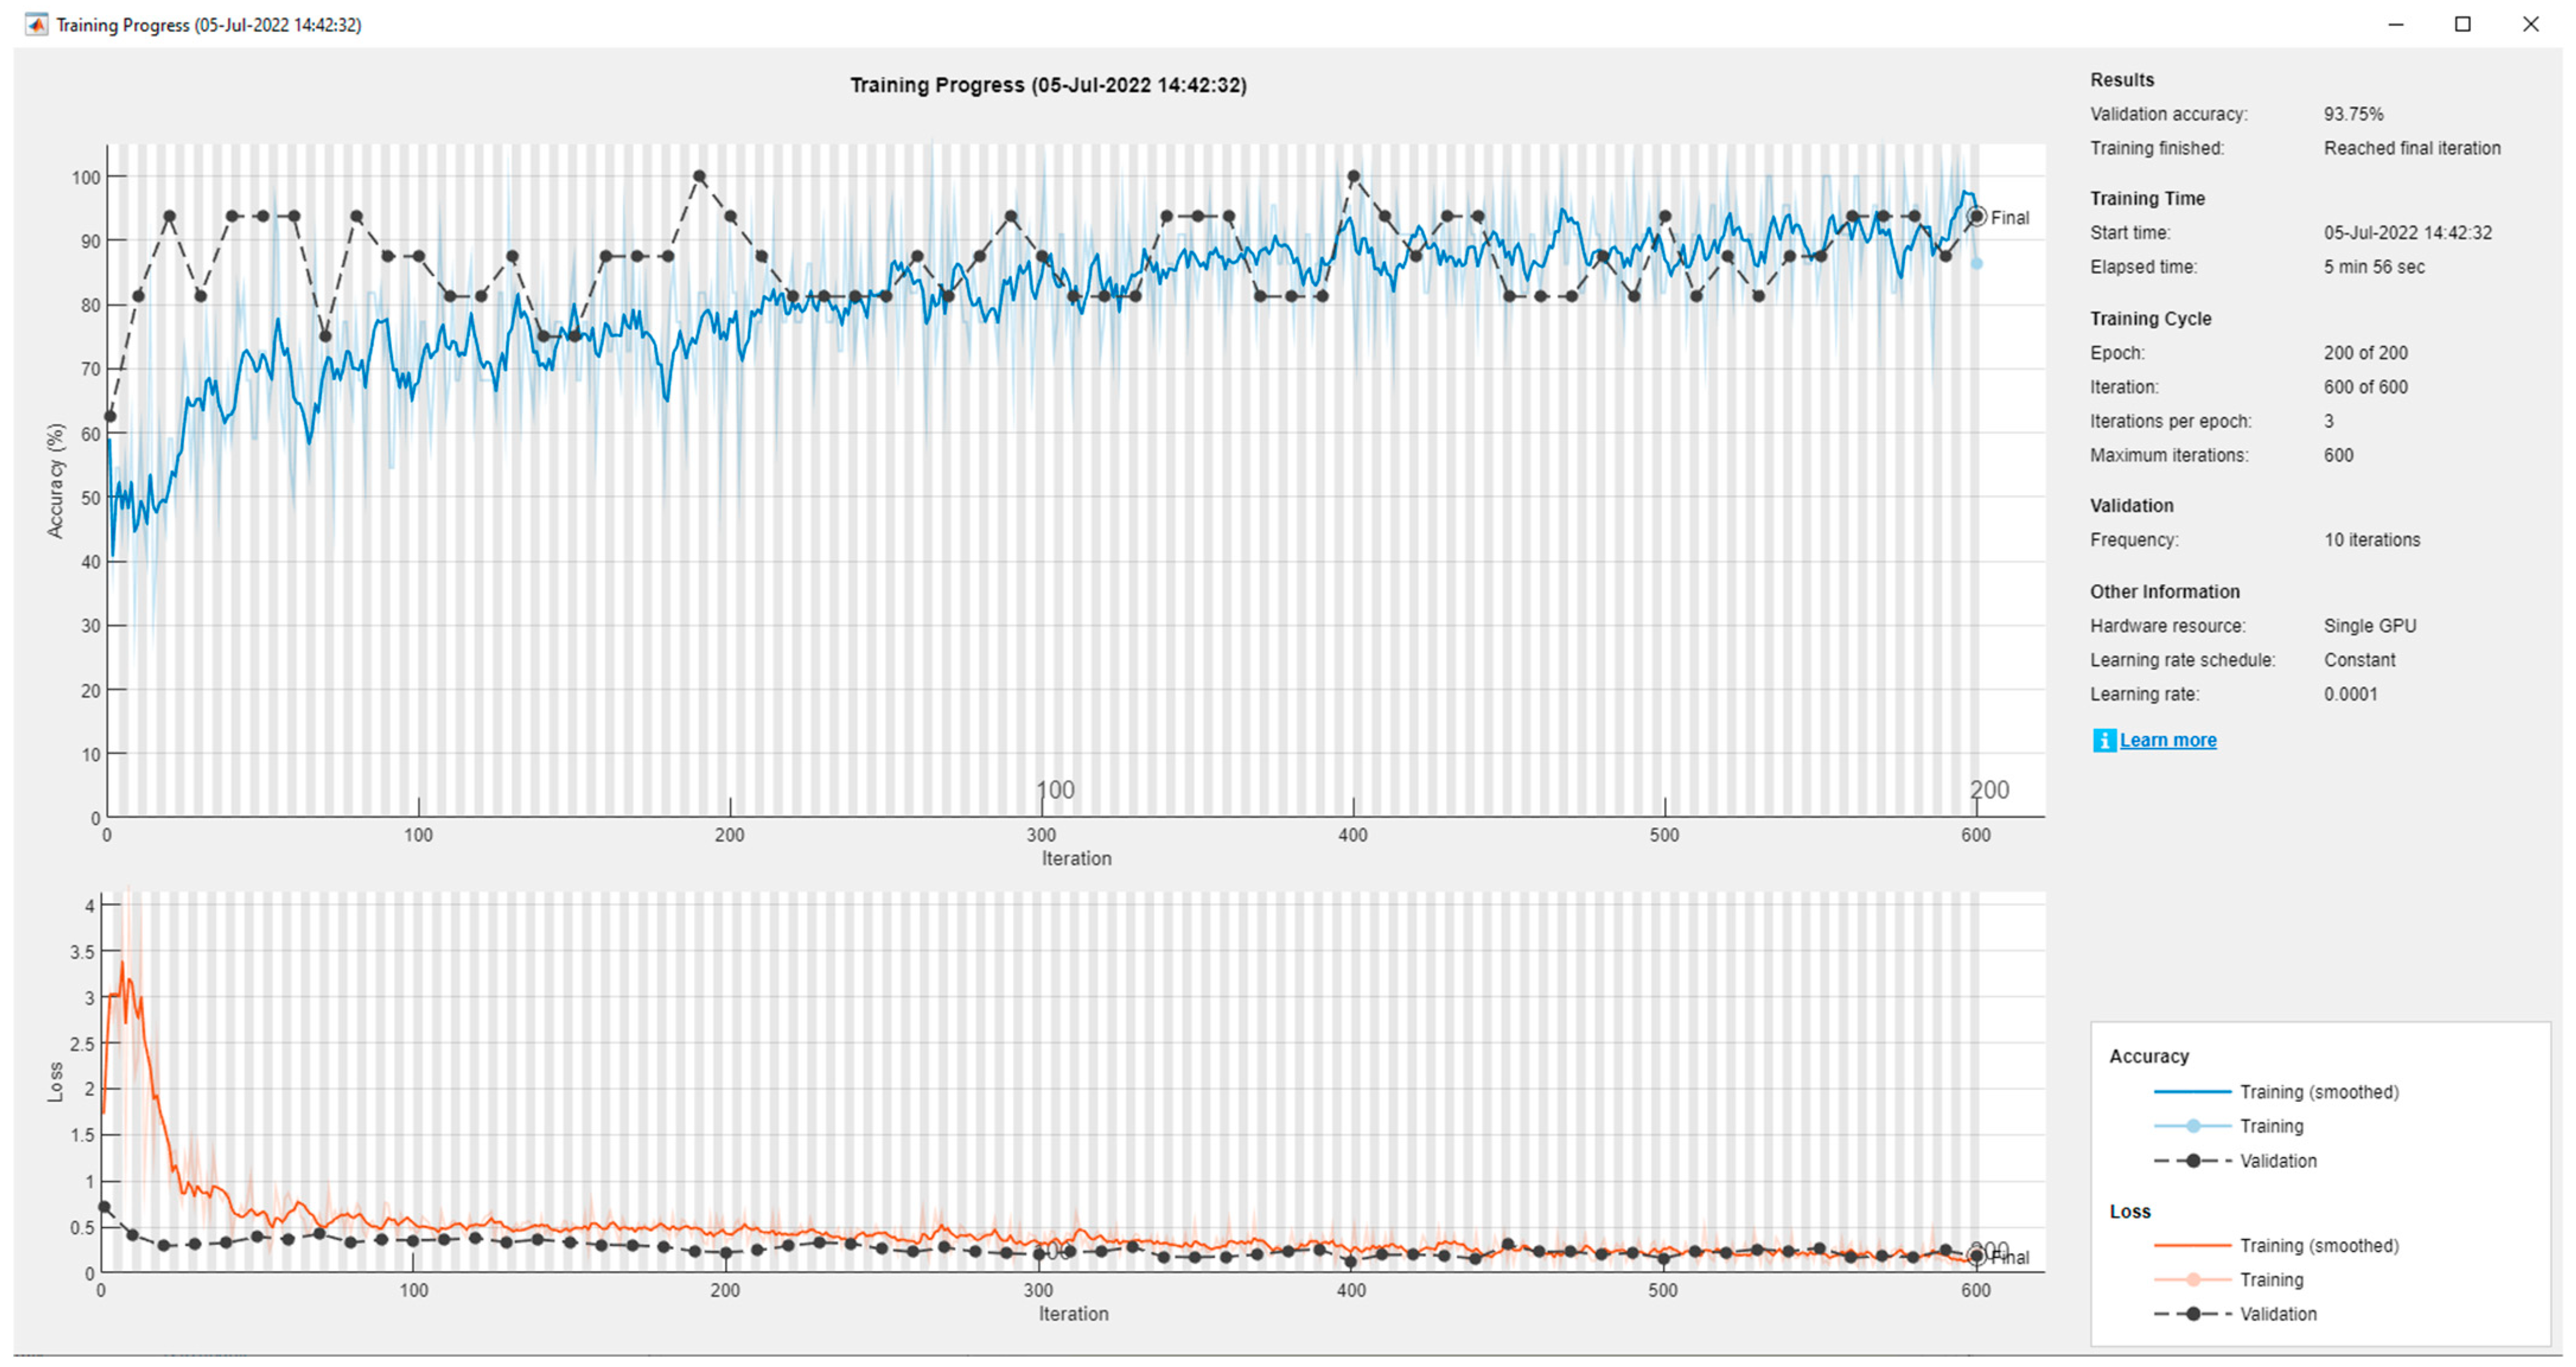
Our primary experimental deep learning model, GoogleNet, is reported below comprehensively for accuracy, sensitivity, specificity, and F1 score. After ensuring the experiment model was fine-tuned to avoid overfitting, the training charts were also observed for all the training processes to ensure there was no overfitting. The training and validation chart in Figure 9 illustrates the fine-tuning of the model to avoid overfitting.
Figure 10 shows a confusion matrix for the true classes and predicted classes of the test set.
Further evaluation of the GoogleNet classification was conducted based on the performance of specificity, sensitivity, and F1 score to have a more in-depth performance report of the GoogleNet classification on the experimental dataset (test set).

7. Discussion

It should be noted that although promising results are achieved, the available data are still limited. Thus, for the purpose of future experiments, we intend to acquire and use more data to train our convolutional neural network, because more data in the training of a neural network has been associated with an increase in performance. Table 3 shows the comparison of the proposed method of this study with other state-of-the-art methods.
In this paper, a practical approach that uses handwriting data for detecting ASD is proposed. The main advantage of the approach comes from is the simplicity of its application where no professional expertise is necessary. While we achieved good accuracy (90.48%), as deep learning is a data-driven approach, it is possible to improve accuracy even more. Thus, in the future, although it is time-consuming to collect data, we are planning to extend the dataset. The comparison of our study with previous studies that have proposed and implemented state-of-the-art methods of computer classification for ASD diagnosis has shown that our proposed method has a promising impact on early ASD diagnosis. Even with the considerable data limitation, the accuracy of the proposed method in this study outperforms other proposed methods, and the proposed method also has a considerably lesser computational resource requirement and input data complexity compared with other studies. Our proposed method is only outperformed by the proposed method of Ahmed et al. [31], which proposed the use of an eye-tracking dataset that reported a performance accuracy of 97.6%. Deep learning being computer vision algorithms that perform better with the increase in training data implies and indicates that our proposed method will increase its accuracy performance with the provision of more input data for training.

8. Conclusions

This research proposes the use of handwritten tasks of subjects in a study motivated by the early detection of ASD in subjects using the computer-aided diagnosis of ASD. The proposed method is aimed at devising a low-resource-demanding computer-aided ASD diagnosis that can be easily implemented in both health and educational institutions to enable a better management of people living with ASD. The proposal of the study saw the collection of a dataset suitable for carrying out its experiments, and by reviewing state-of-the-art ASD diagnosis studies, the dataset collected in this study is the first of its kind. Image processing techniques were applied to the dataset which includes both ASD and non-ASD subjects; processed images were then trained on a transfer learning network. The testing and training of the proposed model were conducted for each handwritten task individually and then estimated predictions are combined for the final prediction. The proposed model has shown promising results, where the accuracy, sensitivity, and specificity are calculated as 90.48%, 80%, and 100%, respectively, which encourages more research and experiments in this direction. The findings in this study with the proposed methodology indicate that the use of handwritten tasks as applied in this study has significant potential in contributing to the early diagnosis of ASD in children.
Based on the findings of this study, we recommend and, in the future, seek to utilize more data collection for the training and testing of deep learning networks using handwritten data acquired from both ASD and non-ASD subjects. This study has shown that handwritten task data have high performance and are significant in the diagnosis of ASD subjects. The recommendation of more data acquisition and experiments stems from the general principle of deep learning networks performing better with the more data they learn from.

Author Contributions

Writing—Original Draft, Resources and Data Collection, A.H.; Data Collection Design, A.H. and M.E.K.; Data Analysis, A.H. and U.O.; Literature Search and investigation, A.H., U.O. and M.E.K.; Writing—Review and Editing, U.O. and M.E.K.; Supervision: U.O. and M.E.K. All authors have read and agreed to the published version of the manuscript.

Funding

This research received no external funding.

Institutional Review Board Statement

The study was conducted according to guidelines of the Declaration of Helsinki and approved by the ethics committee of Cyprus International University.

Informed Consent Statement

Informed consent was provided by the parents and guardians of subjects before participating in data collection of the study.

Data Availability Statement

The dataset used in this study will be made available upon request to the corresponding author.

Conflicts of Interest

The authors declare that no conflict of interest.

References

  1. Lefter, R.; Ciobica, A.; Timofte, D.; Stanciu, C.; Trifan, A. A descriptive review on the prevalence of gastrointestinal disturbances and their multiple associations in autism spectrum disorder. Medicina 2019, 56, 11. [Google Scholar] [CrossRef] [PubMed] [Green Version]
  2. O’Reilly, C.; Lewis, J.D.; Elsabbagh, M. Is functional brain connectivity atypical in autism? A systematic review of EEG and MEG studies. PLoS ONE 2017, 12, e0175870. [Google Scholar] [CrossRef] [Green Version]
  3. Afif, I.Y.; Manik, A.R.; Munthe, K.; Maula, M.I.; Ammarullah, M.I.; Jamari, J.; Winarni, T.I. Physiological effect of deep pressure in reducing anxiety of children with ASD during traveling: A public transportation setting. Bioengineering 2022, 9, 157. [Google Scholar] [CrossRef] [PubMed]
  4. Mosadeghrad, A.M.; Pourreza, A.; Akbarpour, N. Economic burden of autism spectrum disorders in Iran. Tehran Univ. Med. J. 2019, 76, 665–671. [Google Scholar]
  5. Khan, N.Z.; Gallo, L.A.; Arghir, A.; Budisteanu, B.; Budisteanu, M.; Dobrescu, I.; Donald, K.; El-Tabari, S.; Hoogenhout, M.; Kalambayi, F.; et al. Autism and the grand challenges in global mental health. Autism Res. Off. J. Int. Soc. Autism Res. 2012, 5, 156–159. [Google Scholar] [CrossRef] [PubMed]
  6. Weitlauf, A.S.; Gotham, K.O.; Vehorn, A.C.; Warren, Z.E. Brief report: DSM-5 “levels of support:” A comment on discrepant conceptualizations of severity in ASD. J. Autism Dev. Disord. 2014, 44, 471–476. [Google Scholar] [CrossRef] [PubMed] [Green Version]
  7. Kim, S.H.; Lord, C. Combining information from multiple sources for the diagnosis of autism spectrum disorders for toddlers and young preschoolers from 12 to 47 months of age. J. Child Psychol. Psychiatry 2012, 53, 143–151. [Google Scholar] [CrossRef] [PubMed] [Green Version]
  8. Stone, W.L.; Coonrod, E.E.; Turner, L.M.; Pozdol, S.L. Psychometric properties of the STAT for early autism screening. J. Autism Dev. Disord. 2004, 34, 691–701. [Google Scholar] [CrossRef]
  9. Adamou, M.; Johnson, M.; Alty, B. Autism diagnostic observation schedule (ADOS) scores in males and females diagnosed with autism: A naturalistic study. Adv. Autism 2018, 4, 49–55. [Google Scholar] [CrossRef]
  10. Sritharan, B.; Koola, M.M. Barriers faced by immigrant families of children with autism: A program to address the challenges. Asian J. Psychiatry 2019, 39, 53–57. [Google Scholar] [CrossRef]
  11. Ashwood, K.; Gillan, N.; Horder, J.; Hayward, H.; Woodhouse, E.; McEwen, F.S.; Findon, J.; Eklund, H.; Spain, D.; Wilson, C.; et al. Predicting the diagnosis of autism in adults using the Autism-Spectrum Quotient (AQ) questionnaire. Psychol. Med. 2016, 46, 2595–2604. [Google Scholar] [CrossRef] [Green Version]
  12. Thabtah, F.; Kamalov, F.; Rajab, K. A new computational intelligence approach to detect autistic features for autism screening. Int. J. Med. Inform. 2018, 117, 112–124. [Google Scholar] [CrossRef]
  13. Dwyer, D.B.; Falkai, P.; Koutsouleris, N. Machine learning approaches for clinical psychology and psychiatry. Annu. Rev. Clin. Psychol. 2018, 14, 91–118. [Google Scholar] [CrossRef]
  14. Balas, V.E.; Roy, S.S.; Sharma, D.; Samui, P. (Eds.) Handbook of Deep Learning Applications; Springer: New York, NY, USA, 2019; Volume 136. [Google Scholar]
  15. Bianchini, M.; Dimitri, G.M.; Maggini, M.; Scarselli, F. Deep neural networks for structured data. In Computational Intelligence for Pattern Recognition; Springer: Cham, Switzerland, 2018; pp. 29–51. [Google Scholar]
  16. Cao, C.; Liu, F.; Tan, H.; Song, D.; Shu, W.; Li, W.; Zhou, Y.; Bo, X.; Xie, Z. Deep learning and it’s applications in biomedicine. Genom. Proteom. Bioinform. 2018, 16, 17–32. [Google Scholar] [CrossRef] [PubMed]
  17. Xu, K.; Feng, D.; Mi, H. Deep convolutional neural network-based early automated detection of diabetic retinopathy using fundus image. Molecules 2017, 22, 2054. [Google Scholar] [CrossRef] [PubMed] [Green Version]
  18. Wang, F.; Casalino, L.P.; Khullar, D. Deep learning in medicine—Promise, progress, and challenges. JAMA Intern. Med. 2019, 179, 293–294. [Google Scholar] [CrossRef]
  19. Dimitri, G.M.; Agrawal, S.; Young, A.; Donnelly, J.; Liu, X.; Smielewski, P.; Hutchinson, P.; Czosnyka, M.; Lió, P.; Haubrich, C. A multiplex network approach for the analysis of intracranial pressure and heart rate data in traumatic brain injured patients. Appl. Netw. Sci. 2017, 2, 1–12. [Google Scholar] [CrossRef] [PubMed]
  20. Khodatars, M.; Shoeibi, A.; Sadeghi, D.; Ghaasemi, N.; Jafari, M.; Moridian, P.; Khadem, A.; Alizadehsani, R.; Zare, A.; Kong, Y.; et al. Deep learning for neuroimaging-based diagnosis and rehabilitation of autism spectrum disorder: A review. Comput. Biol. Med. 2021, 139, 104949. [Google Scholar] [CrossRef] [PubMed]
  21. Shoeibi, A.; Khodatars, M.; Ghassemi, N.; Jafari, M.; Moridian, P.; Alizadehsani, R.; Panahiazar, M.; Khozeimeh, F.; Zare, A.; Hosseini-Nejad, H.; et al. Epileptic seizures detection using deep learning techniques: A review. Int. J. Environ. Res. Public Health 2021, 18, 5780. [Google Scholar] [CrossRef] [PubMed]
  22. Lord, C.; Elsabbagh, M.; Baird, G.; Veenstra-Vanderweele, J. Autism spectrum disorder. Lancet 2018, 392, 508–520. [Google Scholar] [CrossRef]
  23. Maenner, M.J.; Rice, C.E.; Arneson, C.L.; Cunniff, C.; Schieve, L.A.; Carpenter, L.A.; Braun, K.V.N.; Kirby, R.S.; Bakian, A.V.; Durkin, M.S. Potential impact of DSM-5 criteria on autism spectrum disorder prevalence estimates. JAMA Psychiatry 2014, 71, 292–300. [Google Scholar] [CrossRef] [PubMed] [Green Version]
  24. Ecker, C.; Marquand, A.; Mourão-Miranda, J.; Johnston, P.; Daly, E.M.; Brammer, M.J.; Maltezos, S.; Murphy, C.M.; Robertson, D.; Williams, S.C.; et al. Describing the brain in autism in five dimensions—Magnetic resonance imaging-assisted diagnosis of autism spectrum disorder using a multiparameter classification approach. J. Neurosci. 2010, 30, 10612–10623. [Google Scholar] [CrossRef] [Green Version]
  25. Jaliaawala, M.S.; Khan, R.A. Can autism be catered with artificial intelligence-assisted intervention technology? A comprehensive survey. Artif. Intell. Rev. 2020, 53, 1039–1069. [Google Scholar] [CrossRef] [Green Version]
  26. Takahashi, R.; Matsubara, T.; Uehara, K. Data augmentation using random image cropping and patching for deep CNNs. IEEE Trans. Circuits Syst. Video Technol. 2019, 30, 2917–2931. [Google Scholar] [CrossRef] [Green Version]
  27. Levy, S.; Duda, M.; Haber, N.; Wall, D.P. Sparsifying machine learning models identify stable subsets of predictive features for behavioral detection of autism. Mol. Autism 2017, 8, 65. [Google Scholar] [CrossRef] [PubMed] [Green Version]
  28. Heinsfeld, A.S.; Franco, A.R.; Craddock, R.C.; Buchweitz, A.; Meneguzzi, F. Identification of autism spectrum disorder using deep learning and the ABIDE dataset. NeuroImage Clin. 2018, 17, 16–23. [Google Scholar] [CrossRef]
  29. Sewani, H.; Kashef, R. An autoencoder-based deep learning classifier for efficient diagnosis of autism. Children 2020, 7, 182. [Google Scholar] [CrossRef]
  30. Zhou, T.; Xie, Y.; Zou, X.; Li, M. An Automated Assessment Framework for Speech Abnormalities related to Autism spectrum disorder. In Proceedings of the 3rd International Workshop on Affective Social Multimedia Computing (ASMMC), Stockholm, Sweden, 25 August 2017. [Google Scholar]
  31. Ahmed, I.A.; Senan, E.M.; Rassem, T.H.; Ali, M.A.; Shatnawi, H.S.A.; Alwazer, S.M.; Alshahrani, M. Eye Tracking-Based Diagnosis and Early Detection of Autism Spectrum Disorder Using Machine Learning and Deep Learning Techniques. Electronics 2022, 11, 530. [Google Scholar] [CrossRef]
  32. Kong, Y.; Gao, J.; Xu, Y.; Pan, Y.; Wang, J.; Liu, J. Classification of autism spectrum disorder by combining brain connectivity and deep neural network classifier. Neurocomputing 2019, 324, 63–68. [Google Scholar] [CrossRef]
  33. Haweel, R.; Shalaby, A.M.; Mahmoud, A.H.; Ghazal, M.; Seada, N.; Ghoniemy, S.; Casanova, M.; Barnes, G.N.; El-Baz, A. A Novel Grading System for Autism Severity Level Using Task-based Functional MRI: A Response to Speech Study. IEEE Access 2021, 9, 100570–100582. [Google Scholar] [CrossRef]
  34. Cilia, F.; Carette, R.; Elbattah, M.; Dequen, G.; Guérin, J.-L.; Bosche, J.; Vandromme, L.; Le Driant, B. Computer-aided screening of autism spectrum disorder: Eye-tracking study using data visualization and deep learning. JMIR Hum. Factors 2021, 8, e27706. [Google Scholar] [CrossRef] [PubMed]
  35. Albawi, S.; Mohammed, T.A.; Al-Zawi, S. Understanding of a convolutional neural network. In Proceedings of the 2017 International Conference on Engineering and Technology (ICET), Antalya, Turkey, 21–23 August 2017; pp. 1–6. [Google Scholar]
  36. Shin, H.C.; Roth, H.R.; Gao, M.; Lu, L.; Xu, Z.; Nogues, I.; Yao, J.; Mollura, D.; Summers, R.M. Deep convolutional neural networks for computer-aided detection: CNN architectures, dataset characteristics and transfer learning. IEEE Trans. Med. Imaging 2016, 35, 1285–1298. [Google Scholar] [CrossRef] [PubMed] [Green Version]
  37. Dawud, A.M.; Yurtkan, K.; Oztoprak, H. Application of deep learning in neuroradiology: Brain haemorrhage classification using transfer learning. Comput. Intell. Neurosci. 2019, 2019, 4629859. [Google Scholar] [CrossRef] [PubMed] [Green Version]
  38. Sermanet, P.; Eigen, D.; Zhang, X.; Mathieu, M.; Fergus, R.; LeCun, Y. Overfeat: Integrated recognition, localization and detection using convolutional networks. arXiv 2013, arXiv:1312.6229. [Google Scholar]
  39. Shaha, M.; Pawar, M. Transfer learning for image classification. In Proceedings of the 2018 Second International Conference on Electronics, Communication and Aerospace Technology (ICECA), Coimbatore, India, 29–31 March 2018; pp. 656–660. [Google Scholar]
  40. Bougias, H.; Georgiadou, E.; Malamateniou, C.; Stogiannos, N. Identifying cardiomegaly in chest X-rays: A cross-sectional study of evaluation and comparison between different transfer learning methods. Acta Radiol. 2020, 62, 0284185120973630. [Google Scholar] [CrossRef] [PubMed]
  41. Szegedy, C.; Liu, W.; Jia, Y.; Sermanet, P.; Reed, S.; Anguelov, D.; Erhan, D.; Vanhoucke, V.; Rabinovich, A. Going deeper with convolutions. In Proceedings of the IEEE Conference on Computer Vision and Pattern Recognition, Boston, MA, USA, 8–10 June 2015; pp. 1–9. [Google Scholar]
  42. Krizhevsky, A.; Sutskever, I.; Hinton, G.E. Imagenet classification with deep convolutional neural networks. Adv. Neural Inf. Process. Syst. 2012, 25, 1097–1105. [Google Scholar] [CrossRef] [Green Version]
  43. Jiddah, S.M.; Abushakra, M.; Yurtkan, K. Fusion of geometric and texture features for side-view face recognition using svm. Istat. J. Turk. Stat. Assoc. 2021, 13, 108–119. [Google Scholar]
  44. Sidey-Gibbons, J.A.; Sidey-Gibbons, C.J. Machine learning in medicine: A practical introduction. BMC Med. Res. Methodol. 2019, 19, 64. [Google Scholar] [CrossRef] [PubMed] [Green Version]
  45. DeVries, Z.; Locke, E.; Hoda, M.; Moravek, D.; Phan, K.; Stratton, A.; Kingwell, S.; Wai, E.K.; Phan, P. Using a national surgical database to predict complications following posterior lumbar surgery and comparing the area under the curve and F1-score for the assessment of prognostic capability. Spine J. 2021, 21, 1135–1142. [Google Scholar] [CrossRef] [PubMed]
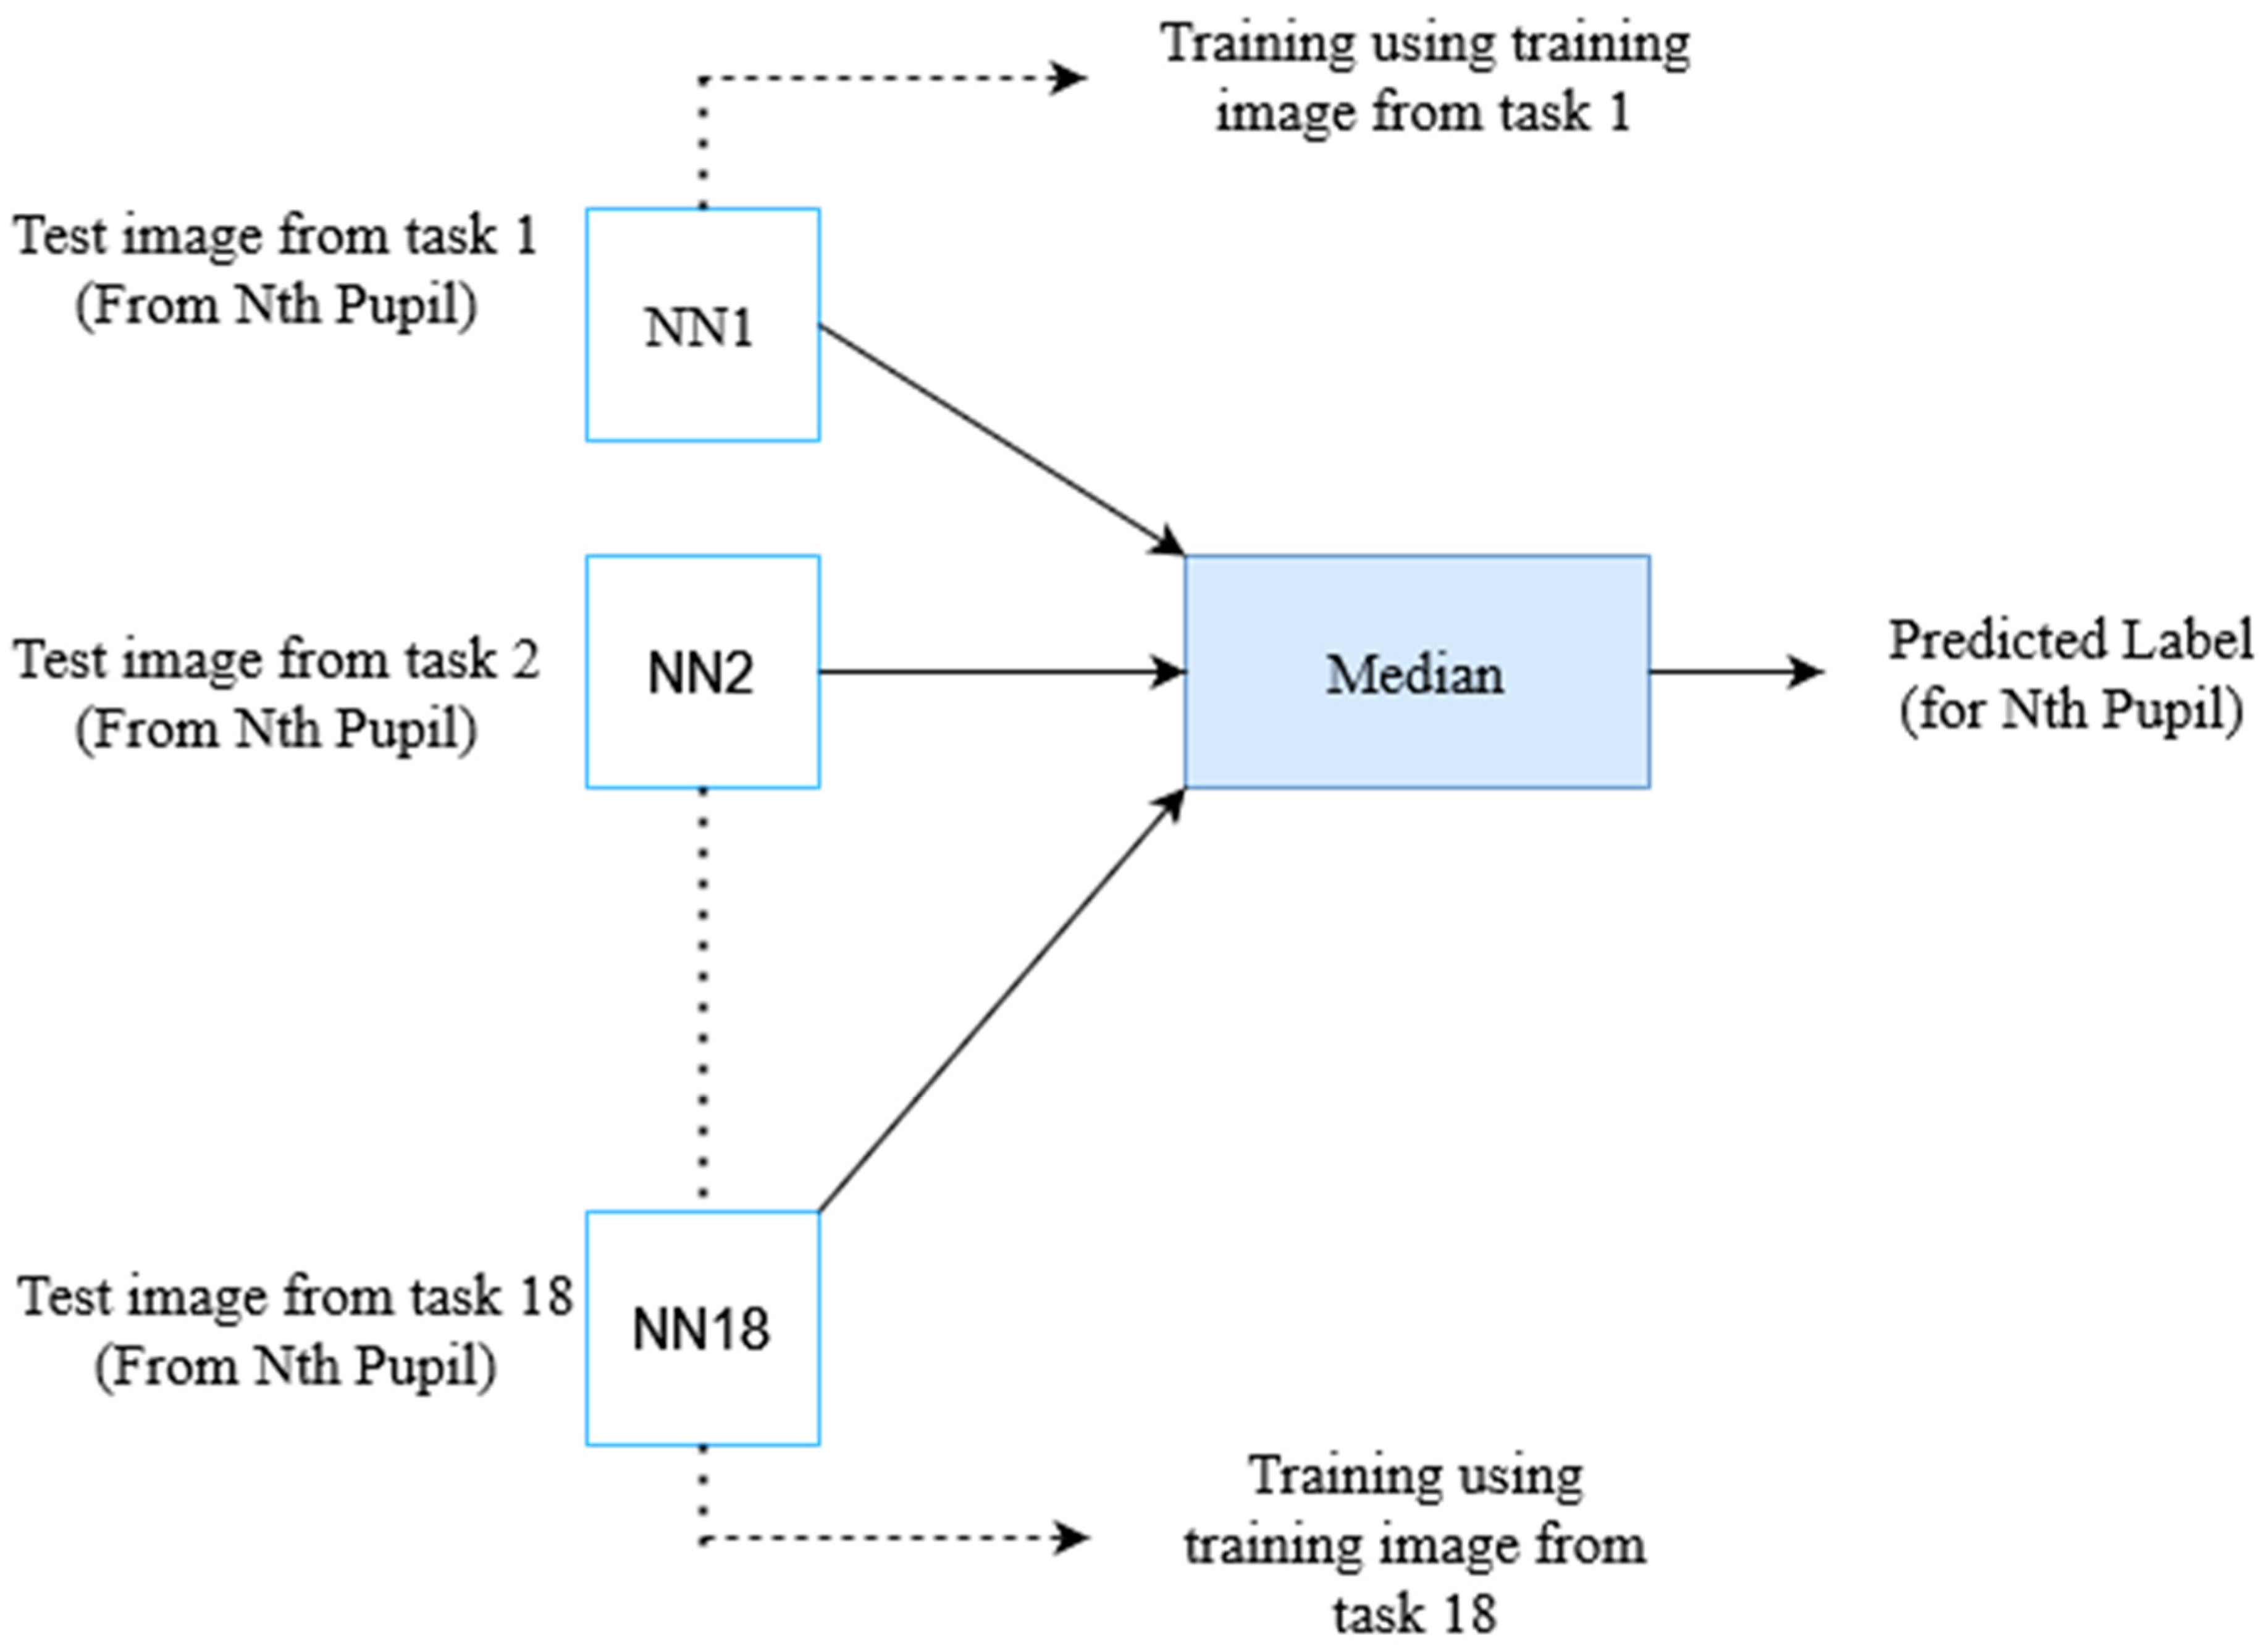
Figure 1. Block diagram depicting the proposed deep learning approach.
Electronics 12 00612 g001
Figure 2. (a) Task 1 with the template for drawing circles, (b) Task 2 with the template for drawing triangles, (c) Task 3 with the template for drawing squares, (d) Template for tasks without an outline or ruled lines to guide, (e) Template for tasks with outline ruled lines to guide.
Electronics 12 00612 g002
Figure 3. Example of all tasks for ASD and non-ASD subjects.
Electronics 12 00612 g003
Figure 4. Data preprocessing algorithm flowchart.
Electronics 12 00612 g004
Figure 5. This figure explaining the automatic preprocessing of the input image as follows: (a) Original input image; (b) Cropped image; (c) Adjusted image.
Electronics 12 00612 g005
Figure 6. Range of the ages of the subjects.
Electronics 12 00612 g006
Figure 7. Proposed methodology flowchart.
Electronics 12 00612 g007
Figure 8. Simplified GoogleNet architecture.
Electronics 12 00612 g008
Figure 9. The training and validation chart.
Electronics 12 00612 g009
Figure 10. Confusion matrix of combined handwritten task classification.
Electronics 12 00612 g010
Table 1. Previous studies on computerized ASD diagnosis.
StudyProposed MethodologyAccuracy (%)
Meaner et al. [23]DSM-5 diagnosis data/Autism and Developmental Disabilities Monitoring Network (ADDM)86.5
Ahmed et al. [31]Eye-tracking data images/GoogleNet95.5
Zhou et al. [30]Speech spectrogram/End-to-end deep neural network90
Heinsfeld et al. [28]Autism brain imaging data/SVM70
Sewani & Kashef [29]Autism brain imaging data/Auto encoder–CNN84.5
Kong et al. [32]Autism brain imaging data/Autoencoder–DNN90.39
Haweel et al. [33]Speech-activated brain response/SVM81
Cilia et al. [34]Eye-tracking data images/CNN90
Table 2. Average accuracy performance for five tested CNN models.
CNN ModelAccuracy (%)Sensitivity (%)Specificity (%)
Alexnet76.190.501
Resnet 1880.950.601
VGG 1685.710.701
Squeeze net90.480.801
GoogleNet90.480.801
Table 3. Comparison of results with previous studies.
Previous StudiesMethodologyAccuracy (%)Sensitivity (%)Specificity (%)F1 Score (%)
Ahmed et al. [31]Eye-tracking dataset/Deep learning97.697.097.0-
Sewani and Kashef [29]ABIDE dataset/Deep learning84.080.075.3-
Zhou et al. [30]Spectrogram/Deep learning90.0---
Our studyHandwritten dataset/Deep learning90.4880.0100100
Disclaimer/Publisher’s Note: The statements, opinions and data contained in all publications are solely those of the individual author(s) and contributor(s) and not of MDPI and/or the editor(s). MDPI and/or the editor(s) disclaim responsibility for any injury to people or property resulting from any ideas, methods, instructions or products referred to in the content.