
Review of Time Domain Electronic Medical Record Taxonomies in the Application of Machine Learning
 ,
,  ,
,  , ,
, ,  and
and 
Abstract
1. Introduction
- It identifies taxonomies within the field after a systemic search of research databases.
- It finds these taxonomies based on the principles of translational medicine so that the reader may find all the information needed for a translational solution in one place.
- It identifies the core challenges and advancements in each taxonomy and provides a rigorous volume of the literature to serve as a baseline.
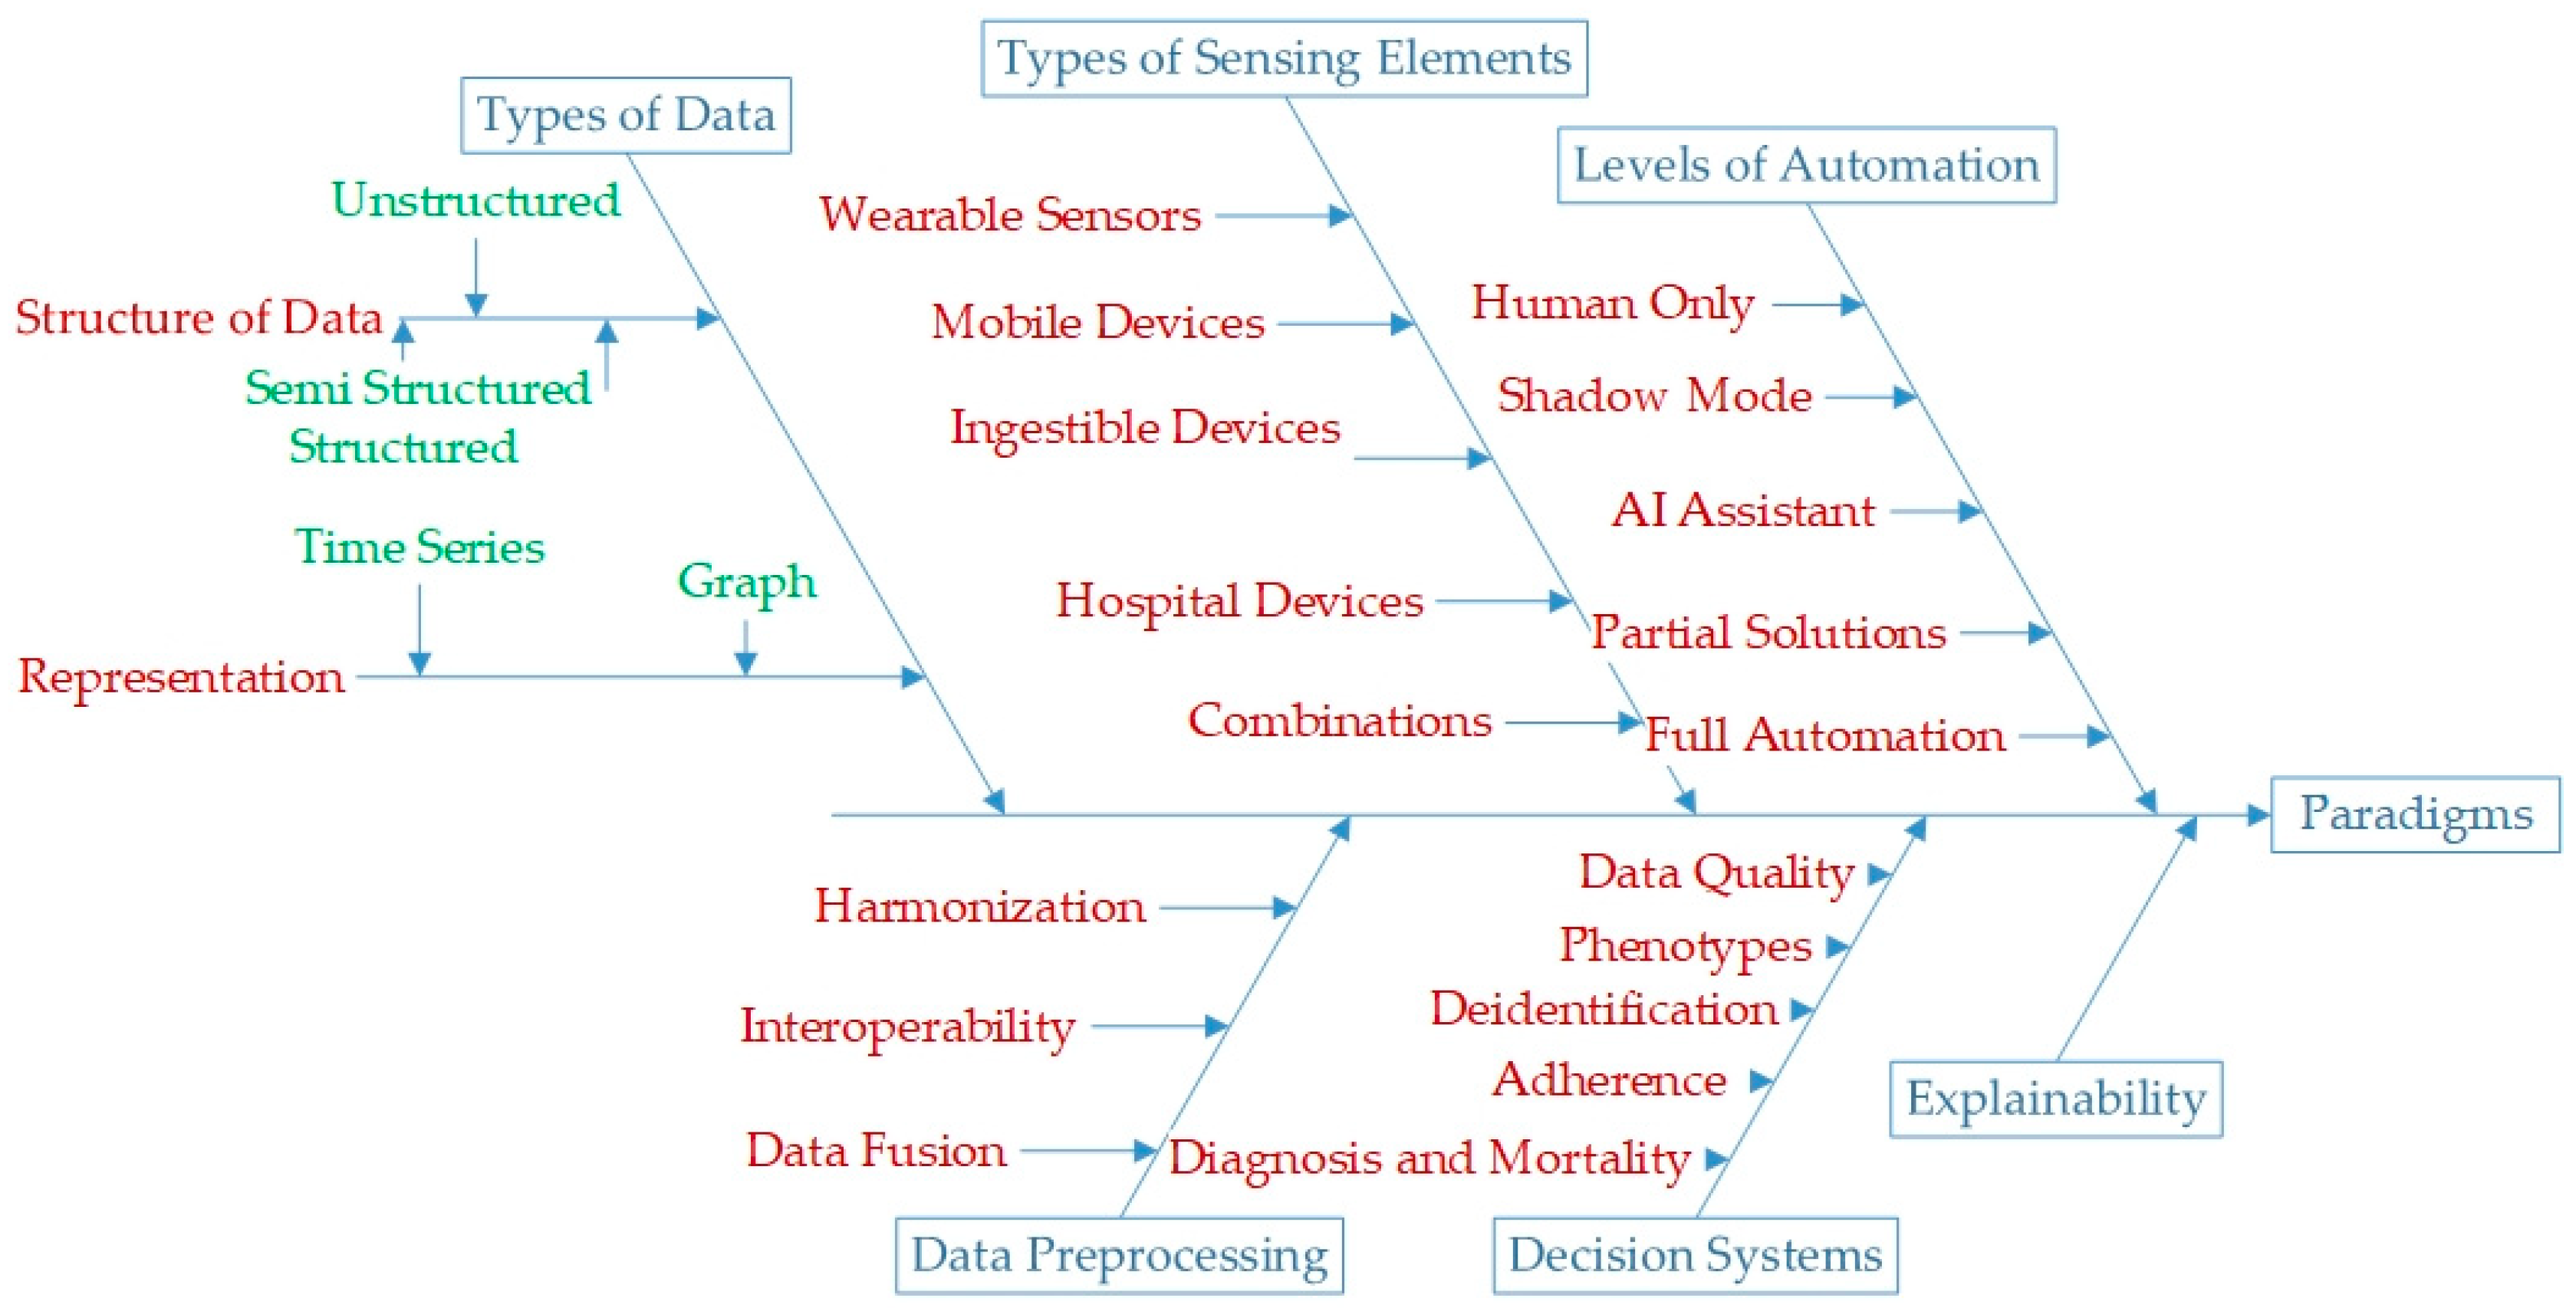
- What paradigms fall under the umbrella of AI in time series and graph-based healthcare data?
- What are the latest advances in these domains?
- What are the latest challenges in these taxonomies?
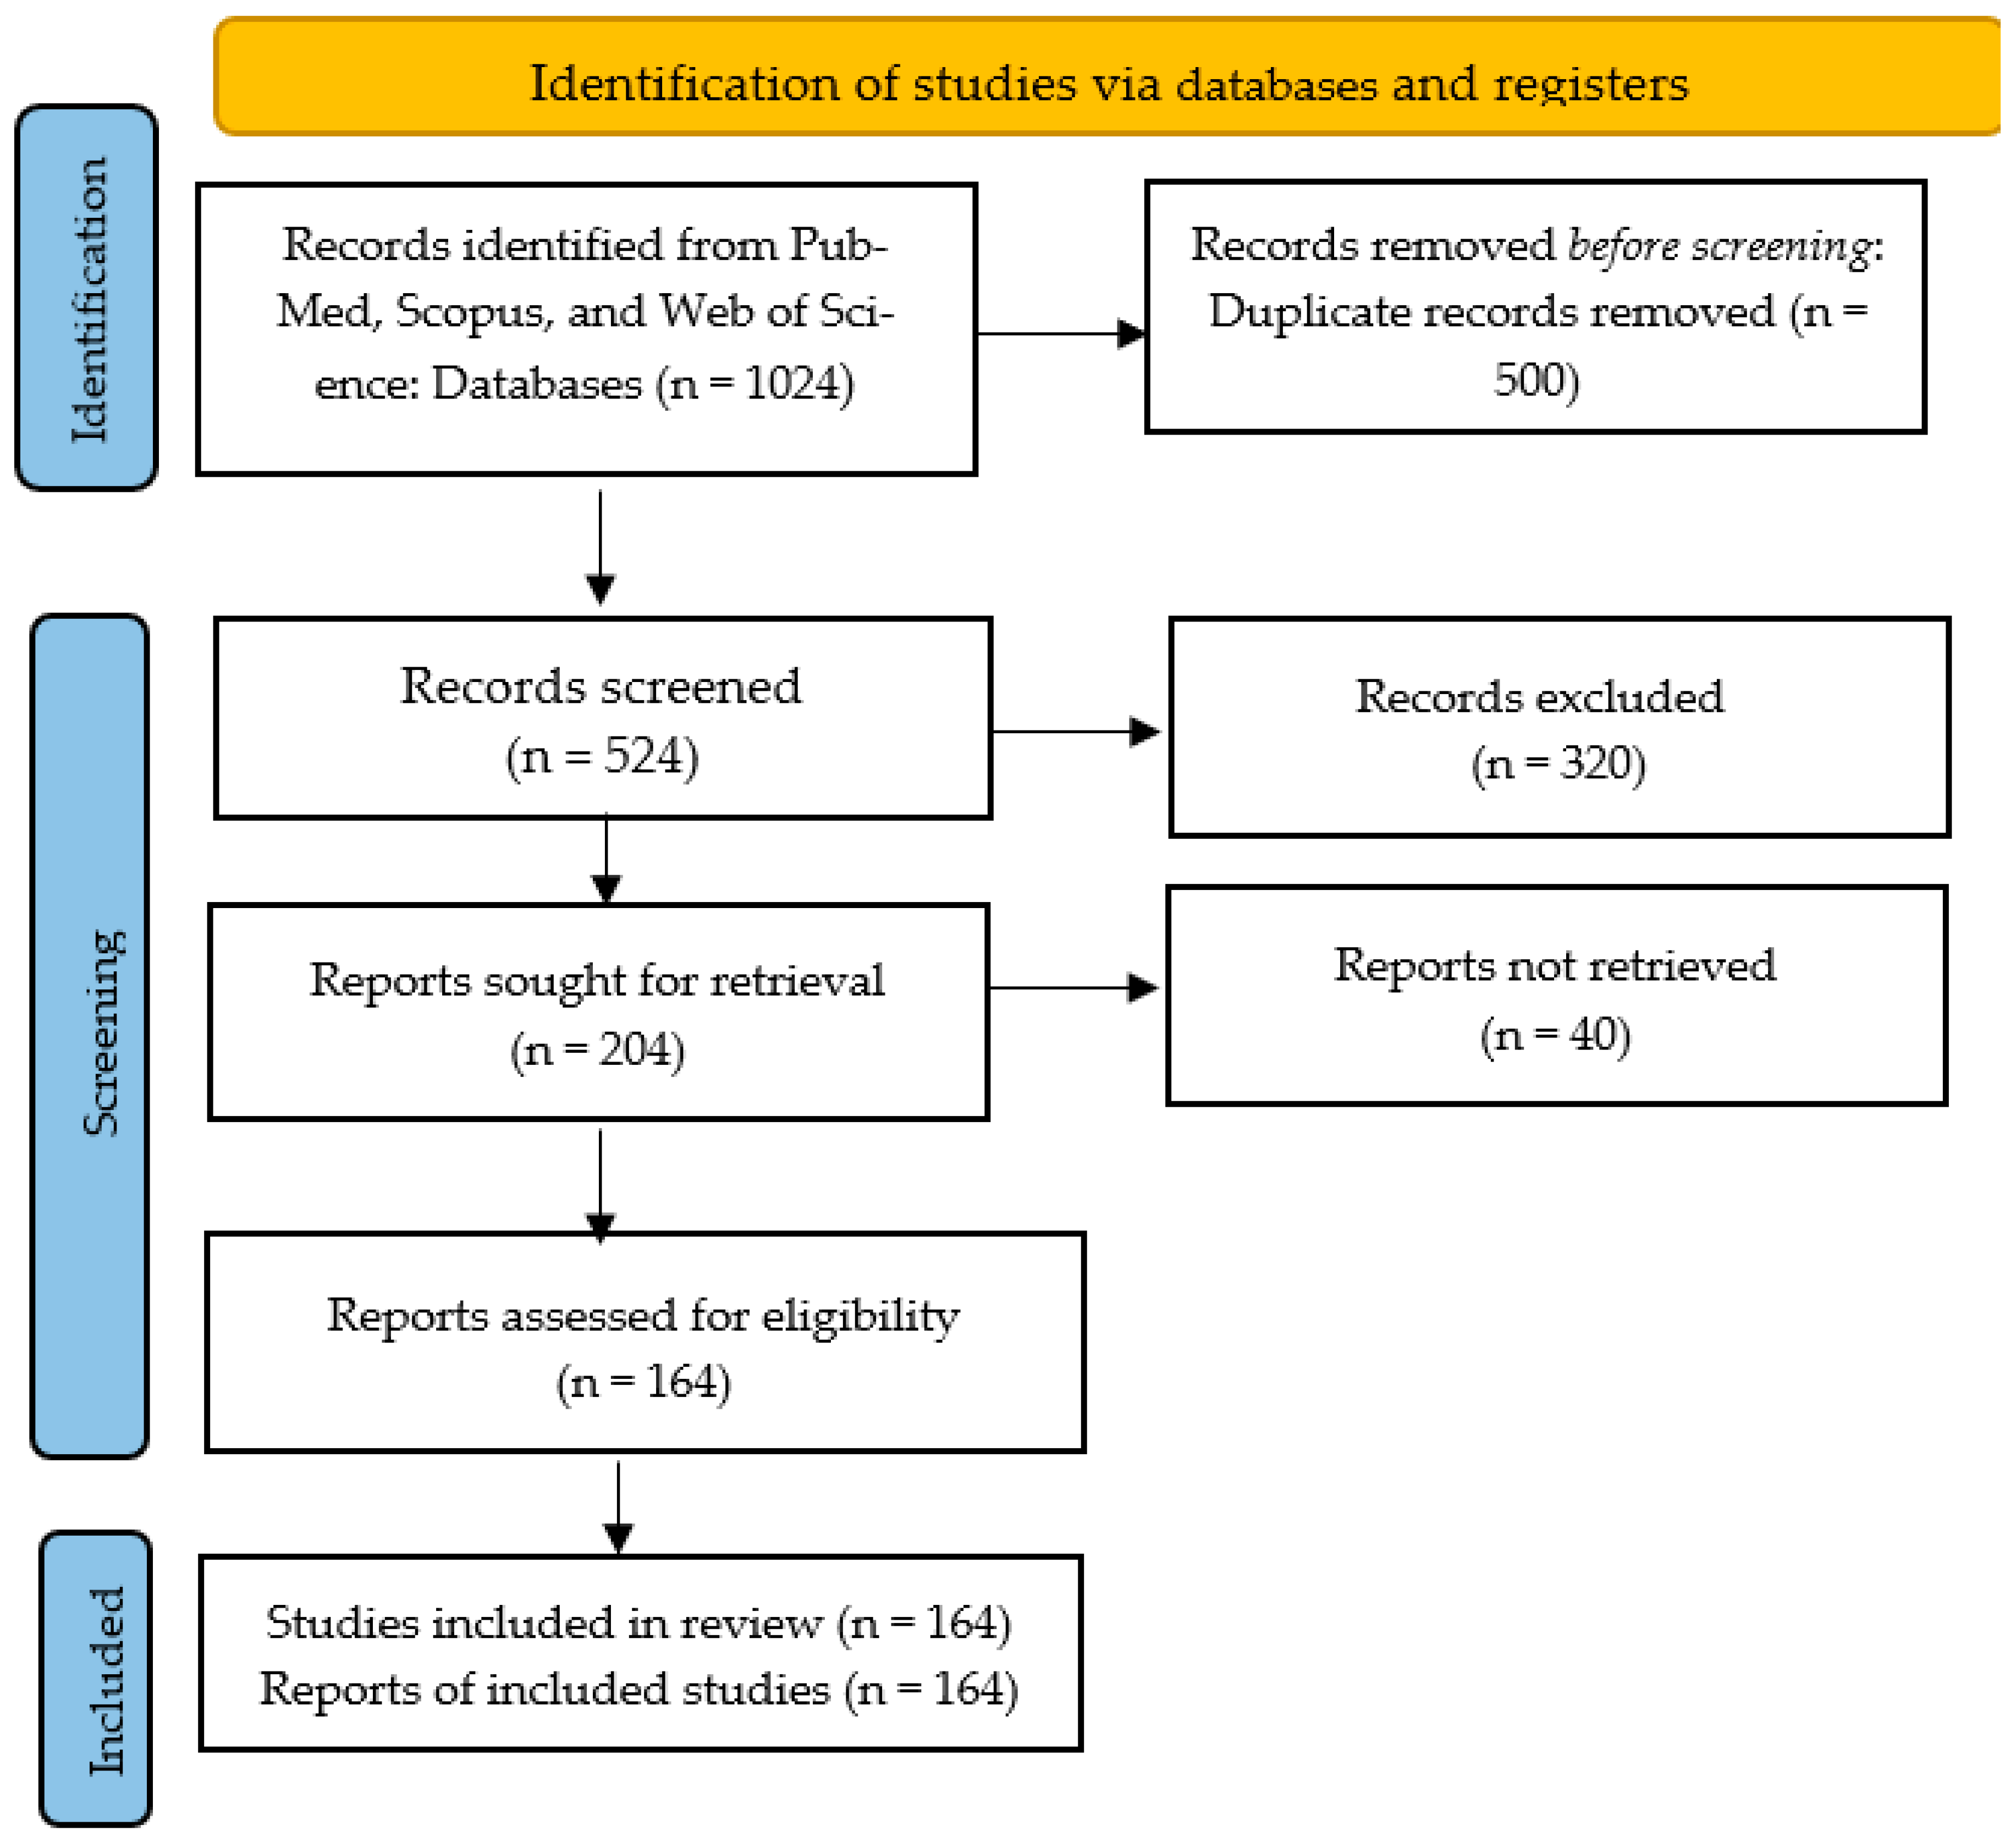
2. Materials and Methods
- What is the type of data?
- What kind of algorithm is used?
- What pre-processing methods are used?
- What post-processing methods are used?
- What data privacy standards are observed?
- What interoperability or fusion techniques are used?
3. Results
3.1. Types of Data
Representation of Data
- 1.
- Time series (tabular representation): Time-series data contain information from physiological events in the form of time-varying biomarkers. Three leading solutions are specific to this data type: motif or pattern detection, data generation/imputation, and time-series forecasting. Generative AI models can potentially overcome the lack of access to time-series data by synthetically producing the missing and unknown data; however, accuracy by patient needs to be proven for each application, where missing data can be missing readings within a time series or the complete absence of a time-series recording in the EHR. Guided evolutionary networks (GENs) combine artificial neural networks and optimization algorithms such as genetic algorithms. These are used to fuse various information sources [22,23]. GENs are also used to discover time-series motifs in ECG data [24]. Ref. [25] uses a multilayer perceptron for time-series forecasting in healthcare data. The following Table 2 presents a comparison of the representative literature.
- 2.
- Graph representation: Healthcare data are relational, which makes them suitable for graphical representation. Relational data are characterized by the relations or dependence that exists amongst the rows and columns [29]. Graph-based techniques are used for developing graph-based representations of healthcare data, identifying clinical pathways and phenotypes of disease, and performing predictive modelling of disease and interventions. For example, refs. [30,31] are some typical graph representations of healthcare data. Ref. [32] determines the temporal phenotypes based on graph representations of healthcare data. Ref. [33] is a fog-based temporal network graph analysis for the Chikungunya virus in India. Ref. [34] uses a proximity-preserving graph embedding to represent electronic health records for hypertension. Ref. [35] incorporates metadata of the patients along with their vitals and lab results to learn a graph representation of electronic healthcare data. Ref. [36] is a study that employs cryptographic techniques for information embedding in the healthcare data. Ref. [37] is another knowledge-graph-based phenotyping technique for subarachnoid hemorrhage. Ref. [38] is a graph-based visualization for sensitive outcomes in medicine for healthcare data. Ref. [39] is a graph-based channel fusion for wrist pulse detection. Ref. [40] uses graphs for learning a lower dimensional representation of drug–disease interaction. As illustrated in [41], the main applications of graphs in medical interventions are drug–drug interaction, drug–disease interaction, protein–protein interaction, medical term classification, and protein function prediction. The three main methods to realize these ends are matrix factorization, random walk, and neural network-based methods. These include Laplacian methods, as demonstrated in [42], deep walk methods, as shown in [43], and neural networks, as illustrated in [40]. Graph algorithms commonly used can be categorized into temporal data mining [44], causal and contextual [45], and patient enteric graphs [46].It is worth noting that there is no unique graph representation for sensor data or electronic medical records. Hence, most research focuses on developing graph-based presentations. One crucial research area is benchmarking and creating a numeric qualitative marker of adequate representation. There are several limitations of time-series- and graph-based healthcare data; these include data sparsity [47], noise [48], limited generalizability [49], and lack of context [49].
3.2. Structure of Data
- Structured data: This follows a definite set of rules or schemes [50]. The main issues when using ML and structured data are data generation, data fusion, pattern detection, privacy preservation, and prediction of outcomes. Privacy preservation is guided by HIPAA rules [51]. Generative algorithms are used extensively to impute the missing data in the structured datasets [52,53]. Data fusion is another typical application of ML for combining two different kinds of structured data [54,55]. Federated learning that trains the models based on data from various decentralized devices is used extensively for privacy preservation of healthcare data [56,57,58,59]. ML and structured data are also valuable in predicting the outcomes of interventions, for example, [60] analyzes the user’s choice in the event of alerts from clinical decision systems for potential drug–drug interference. Ref. [61] uses structured and unstructured data to find the social determinants of health characterized by social behavior, demographic features, and environmental factors of medical status and health care access.Ref. [62] is a systemic review of records from PubMed and Web of Science on the detection of strokes from structured data that found the leading keyword to be mortality and the most used algorithms to be neural networks, support vector machines, and XGBoost. Ref. [63] is another review that looked at the statistical and predictive machine learning models for cancer risk and found the cox model [64] is the most commonly used algorithm for predicting disease onset based on the input features. Ref. [65] used AI to auto-complete structured clinical records based on context. Ref. [66] is a model to detect probable cases of dementia using structured and unstructured data that uses a latent Dirichlet algorithm for feature extraction and a logistic regression model. The key issues of research for structured data in healthcare are detecting phenotypes from electronic health records [67,68], privacy and encoding of information [69,70,71,72], data harmonization from various sources [72], synthetic data generation for research [73,74,75], and fairness and bias in the structured data [76].
- Semi-structured data: These EMRs have no specific structure, enabling categorical data, meta-data, and numerical data to be entered in any field. The key areas in application of ML in unstructured data is in the conversion to structured data, predictive modeling, and interoperability of different kinds of data sources. For example, an application of ML with unstructured data for predictive modeling is used [77] to derive contextual information to generate semi-structured data from electronic medical records. Ref. [78] is a method to allocate resources from the knowledge of semi-structured healthcare data. Ref. [79] uses HL7 standards to develop the interoperability of structured, semi-structured, and unstructured data to develop obesity phenotypes. Ref. [80] is another such system that uses open EMRs to this end. Ref. [81] detects autism from semi-structured and unstructured data using a combination of skip-gram models.
- Unstructured data: Most EMRs are unstructured [82]. Key research areas for ML applications in unstructured data are conversion amongst the various kinds of data structure and predictive modeling. An example of predictive modeling using unstructured data [83] employs unstructured EMRs to phenotype depression in youth. Latent Dirichlet Analysis (LDA) and other dimensionality reduction methods are used to obtain the hidden information between different kinds of data and then leverage it for predictive modeling [84,85,86,87]. A priori algorithms and other Bayesian methods are used to convert unstructured data to structured data [37,88,89], and in so doing, these works can also combine with structured data to make predictions [90,91]. Another technique that is relevant to the conversion of unstructured data to structured data is distant supervision. Distant supervision is a method for labeling the data by utilizing the known structures of similar data [92,93]. Exploratory text analysis is also used for pattern analysis for predictive modeling in this [94,95].
3.3. Types of Sensing Elements
- Wearable sensors: These bridge the gap between assessment and onset prediction. The data sources measure the biomarkers from the physiological signals in real-time, making this a vital component of multi-omics profiling [96].
- Mobile devices: Along with real-time monitoring using mobile sensors, mobile devices also allow for input from the user, making them helpful in tracking medical adherence [97].
- Medical devices from hospitals: These include connected medical devices intended to enhance healthcare quality for people in the hospital [100].
- Combinations: The combination of the sensors enables the Internet of Medical Devices [101].
3.4. Data Preprocessing
- Data harmonization standards: These standards describe the preprocessing technique that prepares different kinds of data to become compatible with each other. It allows the AI to access a diversity of information through access to researcher and institution knowledge [102]. Some standards are specific to the medical cases they deal with [103,104,105]; however, there exists a set of medical means to ensure interoperability. The most common standards are Health Level 7 (HL7), openEHR, and ISO/IEEE 11073 Personal Health Data (PHD) standards [106], International Statistical Classification of Diseases version 10 (ICD-10) [107] and Current Procedural Terminology (CPT) codes [108]
- Intelligent interoperability: Here, ML or other algorithms are used to combine the information from different data sources, and particularly EMRs. In intelligent interoperability of healthcare components, artificial intelligence or some other rule-based systems are used to automatically draw the relevant information from the EMRs or sensor data. These systems use different algorithms to ensure the interoperability of various data sources. The following Table 5 elucidates such strategies. Although these systems allow for effective data communication while ensuring information integrity, one key issue is allowing for the encoding of categorical features so that the information is stored effectively.
- 3.
- Data Fusion: A physiological event can be observed with the help of various sensors, each sensing a unique aspect of the physiological event. The system has to fuse or combine information from different sensing elements for a holistic understanding of the event. This is done at multiple levels. In industry 4.0, healthcare systems, these sensing elements are spread across time and space (wearable sensors, ambulances, and hospitals). Fusing information from multiple sensors provides a more holistic picture of healthcare, including detection, phenotyping, disease progression, and other related data-powered solutions.Ref. [114] exhibits a combination of different layers of data fusion in connected healthcare, from individual sensors to detect medical events, to a network of connected devices, and finally, fusing information amongst various institutions. Ref. [115] displays a sensor fusion model between communication systems. Ref. [116] defines different levels of data fusion. These include signal level fusion, feature level fusion, and decision level fusion. Kalman Filtering is a popular statistics method for signal level fusion and is widely used in biomedical sensor networks. Weighted averages are also widely used to penalize sensors with more noise in a sensor network [117,118,119]. Particle filtering, amongst various other variants, is also used extensively for signal level fusion in sensor networks in healthcare [120]. Ref. [121] uses temporal evidence theory for signal level fusion for activity recognition. Feature level fusion means each sensing element’s features are calculated and fused. Ref. [122] calculates a linear combination of features to obtain a new feature. Ref. [123] is a weakly supervised program for feature-level fusion. Decision level fusion is a way to fuse decisions based on different information streams. There exist many such systems in the context of healthcare [124,125].The critical issue in all these is developing a plastic nature of fusion techniques. A plastic fusion technique would be flexible to change with the emerging problem because different features or data may have other significance for each model.
- Complexity—Data harmonization standards can be complex and may require significant resources to implement and maintain.
- Limited adoption—Not all electronic medical record systems may adopt the same data harmonization standards, which can limit the ability to exchange data between systems.
- Changing standards—Data standards can change over time, which can make it difficult to maintain compatibility with other systems.
- Privacy and security concerns—The exchange of patient data between systems can raise concerns about privacy and security. Careful measures must be taken to ensure that patient data are protected when they are shared between systems.
- Cost—Implementing and maintaining data harmonization standards can be expensive, particularly for smaller healthcare organizations.
- Intended use—some coding is designed for a different reason than it is used for, e.g., reimbursement versus treatment.
3.5. Decision Systems
- 1.
- Data Quality: The quality of the data acquired in healthcare is essential for the credibility of the predicted outcomes. Data quality issues are hard to identify in data with varying structures, shapes, dimensions, and sources. The dimensions of data quality, as elaborated by [126], are completeness (whether the relevant information is present), correctness (are the data correct), concordance (are they relatable to other data sources), plausibility (is any element in the EHRs making sense in the presence of other evidence), and currency (meaning how old are the data). These solutions will help to identify data quality issues, log them, encode them in metadata for datasets, help develop exclusion criteria of data based on its quality, and record the number of such problems. Ref. [127] is one such work that creates a framework to carry out all the tasks and uses probabilistic models to detect temporal stability and plausibility in biomedical data. It employs probabilistic change detection using Jensen–Shannon distance principles of statistical control of posterior beta distribution. Ref. [128] uses probability distribution distance to the same end. Ref. [129] is a measure of completeness by flagging incomplete data sources using the Delphi method. It also measures the same DQ dimension using patterns in the number of patients and compares them. Ref. [130] considers the data quality of radio frequency identification (RFID) in nine phases within healthcare systems.
- 2.
- Phenotypes: Phenotypes are the combination of an individual’s observable disease traits. The data from the electronic health record are a set of data points related to interventions and the change in the states measured in lab tests. The data help align heterogeneous disease progression into temporal phenotypes. This allows data science techniques to find the relation between disease, symptoms, and interventions. These are also linked to mortality prediction, disease progression, and observation of medically complex phenotypes. Most temporal phenotype identification methods deploy clustering techniques. Phenotypes are also used to identify rare diseases [131,132,133]. These methods are rule-based [133] and graph-theory-based [134].
- 3.
- Deidentification: De-identification of electronic medical records in an automatic manner is an active area of research where blockchain has recently been widely used [137,138]. Ref. [139] compares deep learning, rule-based systems, and shallow learning for de-identifying EMRs and argues that stacked learning is the most efficient ensemble technique. Ref. [140] deploys self-attention networks and stacked recurrent neural networks to de-identify the medical records. The main de-identification methods are neural networks, blockchain technology, and rule-based systems [140]. Some Internet of Medical Things (IoMT) schemes uses IoT protocols to preserve privacy while ensuring that critical information is relayed to the relevant stakeholder [141].
- 4.
- Adherence: Adherence to suggested and prescribed medical regimens is a crucial component of healthcare. Healthcare is an integrated process; hence, adherence is monitored by different sensing and AI techniques to ensure the efficacy of the interventions. The following Table 6 represents the various AI methods used to this end.The key challenge in this domain is access to relevant data as the disease progresses. Here, the importance of different features coming from the same sensors and additional sensors can change as the condition changes its phase.
- 5.
- Diagnosis and mortality prediction: Disease prediction can help speed up the process of health care and increase the prediction accuracy, leading to the correct treatment being administered earlier. In the case of critical systems, the idea of mortality prediction and their interplay with demographic information and phenotype can help save lives. It can also help in understanding the progression of the disease and can direct healthcare resources in the right direction.Ref. [151] contains a process for disease prediction using electronic health records. It uses convolutional neural networks (CNN) to this end. Ref. [152] uses hybrid machine learning techniques to predict cardiovascular diseases. It uses a combination of random forest and linear classification models. Ref. [153] develops a naive Bayes analytic model for disease prediction using electronic health records.
3.6. Explainability
3.7. Levels of Automation
- Human Only: Here, there is no AI involved, for example, the calculation of muscle atrophy using electromyogram (EMG) signals [172]. This process, however, involves the signal processing techniques for the representation of data.
- Shadow Mode: In shadow mode, the data generated by the interaction of the medical practitioner and other sources are logged, and the data are labeled using the judgment of a qualified physician. These data are used to train a machine learning or an optimization algorithm. One such system developed by the ICL team is a reinforcement learning framework optimizing interventions retrospectively that allows a regulatory compliant pathway to clinical testing. This technique is used for sepsis treatment in the ICU [54].
- AI Assistant: This level of decision making assistance provides the physician with suggestions. Some systems use these to detect cancers; for example, one such system uses biomedical images and structured data to detect hepatocellular carcinoma in the AI assistant model [173].
- Partial Solutions: Based on the data, the AI comes up with a diagnosis independently, but needs a physician’s input.
- Full Automation: All the tasks in healthcare are provided by AI alone.
4. Conclusions
Author Contributions
Funding
Institutional Review Board Statement
Informed Consent Statement
Data Availability Statement
Conflicts of Interest
References
- Hartl, D.; de Luca, V.; Kostikova, A.; Laramie, J.; Kennedy, S.; Ferrero, E.; Siegel, R.; Fink, M.; Ahmed, S.; Millholland, J.; et al. Translational precision medicine: An industry perspective. J. Transl. Med. 2021, 19, 245. [Google Scholar] [CrossRef] [PubMed]
- Jordan, L. The problem with Big Data in Translational Medicine. A review of where we’ve been and the possibilities ahead. Appl. Transl. Genom. 2015, 6, 3–6. [Google Scholar] [CrossRef] [PubMed]
- Ewusie, J.; Soobiah, C.; Blondal, E.; Beyene, J.; Thabane, L.; Hamid, J.S. Methods, Applications and Challenges in the Analysis of Interrupted Time Series Data: A Scoping Review. J. Multidiscip. Health 2020, 13, 411–423. [Google Scholar] [CrossRef]
- Ahmad, M.A.; Eckert, C.; Teredesai, A. Interpretable machine learning in healthcare. In Proceedings of the 2018 ACM International Conference on Bioinformatics, Computational Biology, and Health Informatics, Washington, DC, USA, 29 August–1 September 2018. [Google Scholar]
- Baum, E.B. On the capabilities of multilayer perceptrons. J. Complex. 1988, 4, 193–215. [Google Scholar] [CrossRef]
- Paganelli, A.I.; Mondéjar, A.G.; da Silva, A.C.; Silva-Calpa, G.; Teixeira, M.F.; Carvalho, F.; Raposo, A.; Endler, M. Real-time data analysis in health monitoring systems: A comprehensive systematic literature review. J. Biomed. Inform. 2022, 127, 104009. [Google Scholar] [CrossRef] [PubMed]
- Chen, J.X. The Evolution of Computing: AlphaGo. Comput. Sci. Eng. 2016, 18, 4–7. [Google Scholar] [CrossRef]
- Singh, S.P.; Wang, L.; Gupta, S.; Goli, H.; Padmanabhan, P.; Gulyás, B. 3D Deep Learning on Medical Images: A Review. Sensors 2020, 20, 5097. [Google Scholar] [CrossRef]
- Taghanaki, S.A.; Abhishek, K.; Cohen, J.P.; Cohen-Adad, J.; Hamarneh, G. Deep semantic segmentation of natural and medical images: A review. Artif. Intell. Rev. 2020, 54, 137–178. [Google Scholar] [CrossRef]
- Kumar, M.; Mishra, S.K. A comprehensive review on nature inspired neural network based adaptive filter for eliminating noise in medical images. Curr. Med. Imaging 2020, 16, 278. [Google Scholar] [CrossRef] [PubMed]
- Pavlič, J.; Tomažič, T.; Kožuh, I. The impact of emerging technology influences product placement effectiveness: A scoping study from interactive marketing perspective. J. Res. Interact. Mark. 2021, 16, 551–568. [Google Scholar] [CrossRef]
- Davy, C.; Bleasel, J.; Liu, H.; Tchan, M.; Ponniah, S.; Brown, A. Effectiveness of chronic care models: Opportunities for improving healthcare practice and health outcomes: A systematic review. BMC Health Serv. Res. 2015, 15, 1–11. [Google Scholar] [CrossRef] [PubMed]
- Chen, I.Y.; Joshi, S.; Ghassemi, M.; Ranganath, R. Probabilistic Machine Learning for Healthcare. Annu. Rev. Biomed. Data Sci. 2021, 4, 393–415. [Google Scholar] [CrossRef]
- Wang, F.; Cui, P.; Pei, J.; Song, Y.; Zang, C. Recent Advances on Graph Analytics and Its Applications in Healthcare. In Proceedings of the 26th ACM SIGKDD International Conference on Knowledge Discovery & Data Mining, Virtual Event, CA, USA, 6–10 July 2020. [Google Scholar]
- Gu, D.; Li, T.; Wang, X.; Yang, X.; Yu, Z. Visualizing the intellectual structure and evolution of electronic health and telemedicine research. Int. J. Med. Inform. 2019, 130, 103947. [Google Scholar] [CrossRef] [PubMed]
- Tran, B.X.; Nghiem, S.; Sahin, O.; Vu, T.M.; Ha, G.H.; Vu, G.T.; Pham, H.Q.; Do, H.T.; Latkin, C.; Tam, W.; et al. Modeling Research Topics for Artificial Intelligence Applications in Medicine: Latent Dirichlet Allocation Application Study. J. Med. Internet Res. 2019, 21, e15511. [Google Scholar] [CrossRef]
- Adnan, K.; Akbar, R.; Khor, S.W.; Ali, A.B.A. Role and Challenges of Unstructured Big Data in Healthcare. In Data Management, Analytics and Innovation; Springer: Berlin/Heidelberg, Germany, 2019; pp. 301–323. [Google Scholar]
- Krishna, S.; Boren, S.; Balas, E.A. Healthcare via Cell Phones: A Systematic Review. Telemed. e-Health 2009, 15, 231–240. [Google Scholar] [CrossRef]
- Bellamy, D.; Celi, L.; Beam, A. Evaluating progress on machine learning for longitudinal electronic healthcare data. arXiv 2020, arXiv:2010.01149. [Google Scholar]
- McCarthy, J.J. Optimal paradigms. In Paradigms in Phonological Theory; Linguistics Department Faculty Publication: Amherst, MA, USA, 2005; p. 55. [Google Scholar]
- Adithan, C. Principles of translational science in medicine: From bench to bedside. Indian J. Med. Res. 2017, 145, 408–409. [Google Scholar] [CrossRef]
- Liu, B.; Li, J.; Chen, C.; Tan, W.; Chen, Q.; Zhou, M. Efficient Motif Discovery for Large-Scale Time Series in Healthcare. IEEE Trans. Ind. Informatics 2015, 11, 583–590. [Google Scholar] [CrossRef]
- Balasubramanian, A.; Wang, J.; Prabhakaran, B. Discovering multidimensional motifs in physiological signals for personalized healthcare. IEEE J. Sel. Top. Signal Process. 2016, 10, 832–841. [Google Scholar] [CrossRef]
- Pereira, J.; Silveira, M. Learning representations from healthcare time series data for unsupervised anomaly detection. In Proceedings of the 2019 IEEE International Conference on Big Data and Smart Computing (BigComp), Kyoto, Japan, 27 February–02 March 2019. [Google Scholar]
- Kaushik, S.; Choudhury, A.; Sheron, P.K.; Dasgupta, N.; Natarajan, S.; Pickett, L.A.; Dutt, V. AI in healthcare: Time-series forecasting using statistical, neural, and ensemble architectures. Front. Big Data 2020, 3, 4. [Google Scholar] [CrossRef] [PubMed]
- Maweu, B.M.; Shamsuddin, R.; Dakshit, S.; Prabhakaran, B. Generating Healthcare Time Series Data for Improving Diagnostic Accuracy of Deep Neural Networks. IEEE Trans. Instrum. Meas. 2021, 70, 2508715. [Google Scholar] [CrossRef]
- Harutyunyan, H.; Khachatrian, H.; Kale, D.C.; Ver Steeg, G.; Galstyan, A. Multitask learning and benchmarking with clinical time series data. Sci. Data 2019, 6, 96. [Google Scholar] [CrossRef] [PubMed]
- Lipton, Z.C.; Kale, D.; Wetzel, R. Directly modeling missing data in sequences with rnns: Improved classification of clinical time series. In Proceedings of the 1st Machine Learning for Healthcare Conference, Los Angeles, CA, USA, 9–20 August 2016. [Google Scholar]
- Whitney, V.K.M. Relational data management implementation techniques. In Proceedings of the ACM SIGFIDET (now SIGMOD) Workshop on Data description, Access and Control, Ann Arbor, MI, USA, 1–5 May 1974. [Google Scholar]
- Zhang, Y.; Sheng, M.; Zhou, R.; Wang, Y.; Han, G.; Zhang, H.; Xing, C.; Dong, J. Hkgb: An inclusive, extensible, intelligent, semi-auto-constructed knowledge graph framework for healthcare with clinicians’ expertise incorporated. Inf. Process. Manag. 2020, 57, 102324. [Google Scholar] [CrossRef]
- Choi, E.; Bahadori, M.T.; Song, L.; Stewart, W.F.; Sun, J. GRAM: Graph-based attention model for healthcare representation learning. In Proceedings of the 23rd ACM SIGKDD international conference on knowledge discovery and data mining, Halifax, NS, Canada, 13–17 August 2017. [Google Scholar]
- Liu, C.; Wang, F.; Hu, J.; Xiong, H. Temporal phenotyping from longitudinal electronic health records: A graph based framework. In Proceedings of the 21th ACM SIGKDD international conference on knowledge discovery and data mining, Sydney, NSW, Australia, 10–13 August 2015. [Google Scholar]
- Sood, S.K.; Mahajan, I. A Fog-Based Healthcare Framework for Chikungunya. IEEE Internet Things J. 2017, 5, 794–801. [Google Scholar] [CrossRef]
- Wu, T.; Wang, Y.; Wang, Y.; Zhao, E.; Yuan, Y. Leveraging graph-based hierarchical medical entity embedding for healthcare applications. Sci. Rep. 2021, 11, 5858. [Google Scholar] [CrossRef] [PubMed]
- Winter, A.; Brigl, B.; Wendt, T. Modeling hospital information systems (part 1): The revised three-layer graph-based meta model 3LGM2. Methods Inf. Med. 2003, 42, 544–551. [Google Scholar] [PubMed]
- Sharma, N.; Bhatt, R. Privacy Preservation in WSN for Healthcare Application. Procedia Comput. Sci. 2018, 132, 1243–1252. [Google Scholar] [CrossRef]
- Malik, K.M.; Krishnamurthy, M.; Alobaidi, M.; Hussain, M.; Alam, F.; Malik, G. Automated domain-specific healthcare knowledge graph curation framework: Subarachnoid hemorrhage as phenotype. Expert Syst. Appl. 2019, 145, 113120. [Google Scholar] [CrossRef]
- Kalamaras, I.; Glykos, K.; Megalooikonomou, V.; Votis, K.; Tzovaras, D. Graph-based visualization of sensitive medical data. Multimed. Tools Appl. 2021, 81, 209–236. [Google Scholar] [CrossRef]
- Zhang, Q.; Zhou, J.; Zhang, B. Graph Based Multichannel Feature Fusion for Wrist Pulse Diagnosis. IEEE J. Biomed. Health Inform. 2020, 25, 3732–3743. [Google Scholar] [CrossRef] [PubMed]
- Finlayson, S.G.; LePendu, P.; Shah, N.H. Building the graph of medicine from millions of clinical narratives. Sci. Data 2014, 1, 140032. [Google Scholar] [CrossRef]
- Yue, X.; Wang, Z.; Huang, J.; Parthasarathy, S.; Moosavinasab, S.; Huang, Y.; Lin, S.M.; Zhang, W.; Zhang, P.; Sun, H. Graph embedding on biomedical networks: Methods, applications and evaluations. Bioinformatics 2019, 36, 1241–1251. [Google Scholar] [CrossRef] [PubMed]
- Zhang, W.; Chen, Y.; Li, D.; Yue, X. Manifold regularized matrix factorization for drug-drug interaction prediction. J. Biomed. Inform. 2018, 88, 90–97. [Google Scholar] [CrossRef]
- Kulmanov, M.; Khan, M.A.; Hoehndorf, R. DeepGO: Predicting protein functions from sequence and interactions using a deep ontology-aware classifier. Bioinformatics 2017, 34, 660–668. [Google Scholar] [CrossRef]
- Chen, L.; Li, X.; Sheng, Q.Z.; Peng, W.-C.; Bennett, J.; Hu, H.-Y.; Huang, N. Mining Health Examination Records—A Graph-Based Approach. IEEE Trans. Knowl. Data Eng. 2016, 28, 2423–2437. [Google Scholar] [CrossRef]
- Kaur, K.; Rani, R. Managing Data in Healthcare Information Systems: Many Models, One Solution. Computer 2015, 48, 52–59. [Google Scholar] [CrossRef]
- Thews, O.; Rohrbach, C.; Sergl, M.; Pommerening, K.; Müller, R. A Graph-Grammar Approach to Represent Causal, Temporal and Other Contexts in an Oncological Patient Record. Methods Inf. Med. 1996, 35, 127–141. [Google Scholar] [CrossRef]
- Liu, Y.; Song, Z.; Xu, X.; Rafique, W.; Zhang, X.; Shen, J.; Khosravi, M.R.; Qi, L. Bidirectional GRU networks-based next POI category prediction for healthcare. Int. J. Intell. Syst. 2021, 37, 4020–4040. [Google Scholar] [CrossRef]
- Rodeheaver, N.; Kim, H.; Herbert, R.; Seo, H.; Yeo, W.H. Breathable, Wireless, Thin-Film Wearable Biopatch Using Noise-Reduction Mechanisms. ACS Appl. Electron. Mater. 2022, 4, 503–512. [Google Scholar] [CrossRef]
- Yang, J.; Soltan, A.A.S.; Clifton, D.A. Machine learning generalizability across healthcare settings: Insights from multi-site COVID-19 screening. NPJ Digit. Med. 2022, 5, 69. [Google Scholar] [CrossRef] [PubMed]
- Palanisamy, V.; Thirunavukarasu, R. Implications of big data analytics in developing healthcare frameworks—A review. J. King Saud Univ. Comput. Inf. Sci. 2019, 31, 415–425. [Google Scholar] [CrossRef]
- Moore, W.; Frye, S. Review of HIPAA, part 1: History, protected health information, and privacy and security rules. J. Nucl. Med. Technol. 2019, 47, 269–272. [Google Scholar] [CrossRef]
- Zhang, Z.; Yan, C.; Lasko, T.A.; Sun, J.; Malin, B. SynTEG: A framework for temporal structured electronic health data simulation. J. Am. Med. Inform. Assoc. 2020, 28, 596–604. [Google Scholar] [CrossRef]
- Abedi, M.; Hempel, L.; Sadeghi, S.; Kirsten, T. GAN-Based Approaches for Generating Structured Data in the Medical Domain. Appl. Sci. 2022, 12, 7075. [Google Scholar] [CrossRef]
- Li, L.; Albert-Smet, I.; Faisal, A. Optimizing medical treatment for sepsis in intensive care: From reinforcement learning to pre-trial evaluation. arXiv 2020, arXiv:2003.06474. [Google Scholar]
- Klompas, M.; Kulldorff, M.; Vilk, Y.; Bialek, S.R.; Harpaz, R. Herpes Zoster and Postherpetic Neuralgia Surveillance Using Structured Electronic Data. Mayo Clin. Proc. 2011, 86, 1146–1153. [Google Scholar] [CrossRef] [PubMed]
- Aminifar, A.; Lamo, Y.; Pun, K.I.; Rabbi, F. A Practical Methodology for Anonymization of Structured Health Data; Linköping University Electronic Press: Linköping, Sweden, 2019. [Google Scholar]
- Kanwal, T.; Anjum, A.; Khan, A. Privacy preservation in e-health cloud: Taxonomy, privacy requirements, feasibility analysis, and opportunities. Clust. Comput. 2020, 24, 293–317. [Google Scholar] [CrossRef]
- Xu, R.; Baracaldo, N.; Zhou, Y.; Anwar, A.; Ludwig, H. Hybridalpha: An efficient approach for privacy-preserving federated learning. In Proceedings of the 12th ACM Workshop on Artificial Intelligence and Security, London, UK, 15 November 2019. [Google Scholar]
- Wibawa, F.; Catak, F.O.; Kuzlu, M.; Sarp, S.; Cali, U. Homomorphic Encryption and Federated Learning based Privacy-Preserving CNN Training: COVID-19 Detection Use-Case. In Proceedings of the 2022 European Interdisciplinary Cybersecurity Conference, Barcelona, Spain, 15–16 June 2022. [Google Scholar]
- Wright, A.; McEvoy, D.S.; Aaron, S.; McCoy, A.; Amato, M.G.; Kim, H.; Ai, A.; Cimino, J.J.; Desai, B.R.; El-Kareh, R.; et al. Structured override reasons for drug-drug interaction alerts in electronic health records. J. Am. Med. Inform. Assoc. 2019, 26, 934–942. [Google Scholar] [CrossRef] [PubMed]
- Vest, J.R.; Grannis, S.J.; Haut, D.P.; Halverson, P.K.; Menachemi, N. Using structured and unstructured data to identify patients’ need for services that address the social determinants of health. Int. J. Med. Inform. 2017, 107, 101–106. [Google Scholar] [CrossRef] [PubMed]
- Wang, W.; Kiik, M.; Peek, N.; Curcin, V.; Marshall, I.J.; Rudd, A.G.; Wang, Y.; Douiri, A.; Wolfe, C.D.; Bray, B. A systematic review of machine learning models for predicting outcomes of stroke with structured data. PLoS ONE 2020, 15, e0234722. [Google Scholar]
- Richter, A.N.; Khoshgoftaar, T.M. A review of statistical and machine learning methods for modeling cancer risk using structured clinical data. Artif. Intell. Med. 2018, 90, 1–14. [Google Scholar] [CrossRef] [PubMed]
- Therneau, T.M.; Grambsch, P.M. Modeling Survival Data: Extending the Cox Model; Springer: New York, NY, USA, 2000; pp. 39–77. [Google Scholar]
- Gopinath, D.; Agrawal, M.; Murray, L.; Horng, S.; Karger, D.; Sontag, D. Fast, Structured Clinical Documentation via Contextual Autocomplete. In Proceedings of the 5th Machine Learning for Healthcare Conference, Virtual, 7–8 August 2020. [Google Scholar]
- Shao, Y.; Zeng, Q.T.; Chen, K.K.; Shutes-David, A.; Thielke, S.M.; Tsuang, D.W. Detection of probable dementia cases in undiagnosed patients using structured and unstructured electronic health records. BMC Med. Inform. Decis. Mak. 2019, 19, 128. [Google Scholar] [CrossRef] [PubMed]
- Banda, J.M.; Seneviratne, M.; Hernandez-Boussard, T.; Shah, N.H. Advances in Electronic Phenotyping: From Rule-Based Definitions to Machine Learning Models. Annu. Rev. Biomed. Data Sci. 2018, 1, 53–68. [Google Scholar] [CrossRef] [PubMed]
- Sung, S.-F.; Lin, C.-Y.; Hu, Y.-H. EMR-Based Phenotyping of Ischemic Stroke Using Supervised Machine Learning and Text Mining Techniques. IEEE J. Biomed. Health Inform. 2020, 24, 2922–2931. [Google Scholar] [CrossRef] [PubMed]
- Boxwala, A.; Kim, J.; Grillo, J.M.; Ohno-Machado, L. Using statistical and machine learning to help institutions detect suspicious access to electronic health records. J. Am. Med. Inform. Assoc. 2011, 18, 498–505. [Google Scholar] [CrossRef] [PubMed]
- Lantz, E. Machine Learning for Risk Prediction and Privacy in Electronic Health Records. Ph.D. Thesis, The University of Wisconsin-Madison, Madison, WI, USA, 2016. [Google Scholar]
- Kim, S.; Lee, H.; Chung, Y.D. Privacy-preserving data cube for electronic medical records: An experimental evaluation. Int. J. Med. Inform. 2017, 97, 33–42. [Google Scholar] [CrossRef] [PubMed]
- Marble, H.D.; Huang, R.; Dudgeon, S.N.; Lowe, A.; Herrmann, M.D.; Blakely, S.; Leavitt, M.O.; Isaacs, M.; Hanna, M.G.; Sharma, A.; et al. A Regulatory Science Initiative to Harmonize and Standardize Digital Pathology and Machine Learning Processes to Speed up Clinical Innovation to Patients. J. Pathol. Inform. 2020, 11, 22. [Google Scholar] [CrossRef] [PubMed]
- Guan, J.; Li, R.; Yu, S.; Zhang, X. A method for generating synthetic electronic medical record text. IEEE/ACM Trans. Comput. Biol. Bioinform. 2019, 23, 173–182. [Google Scholar] [CrossRef]
- Chin-Cheong, K.; Sutter, T.M.; Vogt, J.E. Generation of heterogeneous synthetic electronic health records using GANs. In Proceedings of the Workshop on Machine Learning For Health (ML4H) at the 33rd Conference on Neural Information Processing Systems (NeurIPS), Vancouver, BC, Canada, 8–14 December 2019. [Google Scholar]
- Walonoski, J.A.; Kramer, M.; Nichols, J.; Quina, A.; Moesel, C.; Hall, D.; Duffett, C.; Dube, K.; Gallagher, T.; McLachlan, S. Synthea: An approach, method, and software mechanism for generating synthetic patients and the synthetic electronic health care record. J. Am. Med. Inform. Assoc. 2017, 25, 230–238. [Google Scholar] [CrossRef]
- Chen, I.Y.; Pierson, E.; Rose, S.; Joshi, S.; Ferryman, K.; Ghassemi, M. Ethical Machine Learning in Healthcare. Annu. Rev. Biomed. Data Sci. 2020, 4, 123–144. [Google Scholar] [CrossRef] [PubMed]
- Aggarwal, A.; Garhwal, S.; Kumar, A. HEDEA: A Python Tool for Extracting and Analysing Semi-structured Information from Medical Records. Health Inform. Res. 2018, 24, 148–153. [Google Scholar] [CrossRef] [PubMed]
- Makarova, E.; Lagerev, D. Methodology for Preprocessing Semi-Structured Data for Making Managerial Decisions in the Healthcare. In Proceedings of the InCEUR Workshop Proceedings of the 30th International Conference on Computer Graphics and Machine Vision, Saint Petersburg, Russia, 22–25 September 2020. [Google Scholar]
- Hong, N.; Wen, A.; Stone, D.J.; Tsuji, S.; Kingsbury, P.R.; Rasmussen, L.V.; Pacheco, J.A.; Adekkanattu, P.; Wang, F.; Luo, Y.; et al. Developing a FHIR-based EHR phenotyping framework: A case study for identification of patients with obesity and multiple comorbidities from discharge summaries. J. Biomed. Inform. 2019, 99, 103310. [Google Scholar] [CrossRef]
- Batra, S.; Sachdeva, S. Organizing standardized electronic healthcare records data for mining. Health Policy Technol. 2016, 5, 226–242. [Google Scholar] [CrossRef]
- Yuan, J.; Holtz, C.; Smith, T.H.; Luo, J. Autism spectrum disorder detection from semi-structured and unstructured medical data. EURASIP J. Bioinform. Syst. Biol. 2016, 2017, 3. [Google Scholar] [CrossRef]
- Miled, Z.B.; Haas, K.; Black, C.M.; Khandker, R.K.; Chandrasekaran, V.; Lipton, R.; Boustani, M.A. Predicting dementia with routine care EMR data. Artif. Intell. Med. 2020, 102, 101771. [Google Scholar] [CrossRef]
- Geraci, J.; Wilansky, P.; de Luca, V.; Roy, A.; Kennedy, J.L.; Strauss, J. Applying deep neural networks to unstructured text notes in electronic medical records for phenotyping youth depression. Evid.-Based Ment. Health 2017, 20, 83–87. [Google Scholar] [CrossRef] [PubMed]
- Goh, K.H.; Wang, L.; Yeow, A.Y.K.; Poh, H.; Li, K.; Yeow, J.J.L.; Tan, G.Y.H. Artificial intelligence in sepsis early prediction and diagnosis using unstructured data in healthcare. Nat. Commun. 2021, 12, 1–10. [Google Scholar] [CrossRef] [PubMed]
- Zuo, Z.; Li, J.; Xu, H.; Al Moubayed, N. Curvature-based feature selection with application in classifying electronic health records. Technol. Forecast. Soc. Chang. 2021, 173, 12112. [Google Scholar] [CrossRef]
- Xu, Z.; Chou, J.; Zhang, X.S.; Luo, Y.; Isakova, T.; Adekkanattu, P.; Ancker, J.S.; Jiang, G.; Kiefer, R.C.; Pacheco, J.A.; et al. Identifying sub-phenotypes of acute kidney injury using structured and unstructured electronic health record data with memory networks. J. Biomed. Inform. 2020, 102, 103361. [Google Scholar] [CrossRef] [PubMed]
- Zhao, M.; Havrilla, J.; Peng, J.; Drye, M.; Fecher, M.; Guthrie, W.; Tunc, B.; Schultz, R.; Wang, K.; Zhou, Y. Development of a phenotype ontology for autism spectrum disorder by natural language processing on electronic health records. J. Neurodev. Disord. 2022, 14, 32. [Google Scholar] [CrossRef] [PubMed]
- Song, B.; Feng, Y.; Li, X.; Sun, Z.; Yang, Y. Un-apriori: A novel association rule mining algorithm for unstructured EMRs. In Proceedings of the IEEE 19th International Conference on e-Health Networking, Applications and Services (Healthcom), Dalian, China, 12–15 October 2017. [Google Scholar]
- Kim, J.-C.; Chung, K. Associative Feature Information Extraction Using Text Mining from Health Big Data. Wirel. Pers. Commun. 2018, 105, 691–707. [Google Scholar] [CrossRef]
- Boustani, M.; Perkins, A.J.; Khandker, R.K.; Duong, S.; Dexter, P.R.; Lipton, R.; Black, C.M.; Chandrasekaran, V.; Solid, C.A.; Monahan, P. Passive digital signature for early identification of Alzheimer’s disease and related dementia. J. Am. Geriatr. Soc. 2020, 68, 511–518. [Google Scholar] [CrossRef]
- Chung, K.; Yoo, H.; Choe, D.-E. Ambient context-based modeling for health risk assessment using deep neural network. J. Ambient. Intell. Humaniz. Comput. 2018, 11, 1387–1395. [Google Scholar] [CrossRef]
- Ling, A.Y.; Kurian, A.W.; Caswell-Jin, J.; Sledge, G.W.; Shah, N.H.; Tamang, S.R. Using natural language processing to construct a metastatic breast cancer cohort from linked cancer registry and electronic medical records data. JAMIA Open 2019, 2, 528–553. [Google Scholar] [CrossRef] [PubMed]
- Wallace, B.C.; Kuiper, J.; Sharma, A.; Zhu, M.B.; Marshall, I.J. Extracting PICO Sentences from Clinical Trial Reports using Supervised Distant Supervision. J. Mach. Learn. Res. 2016, 17, 4572–4596. [Google Scholar]
- Lin, F.P.-Y.; Pokorny, A.; Teng, C.; Epstein, R.J. TEPAPA: A novel in silico feature learning pipeline for mining prognostic and associative factors from text-based electronic medical records. Sci. Rep. 2017, 7, 6918. [Google Scholar] [CrossRef] [PubMed]
- Bjarnadottir, R.I.; Lucero, R.J. What Can We Learn about Fall Risk Factors from EHR Nursing Notes? A Text Mining Study. eGEMs 2018, 6, 21. [Google Scholar] [CrossRef]
- Wang, L.; Lou, Z.; Jiang, K.; Shen, G. Bio-Multifunctional Smart Wearable Sensors for Medical Devices. Adv. Intell. Syst. 2019, 1, 1900040. [Google Scholar] [CrossRef]
- Sempionatto, J.R.; Montiel, V.R.-V.; Vargas, E.; Teymourian, H.; Wang, J. Wearable and Mobile Sensors for Personalized Nutrition. ACS Sens. 2021, 6, 1745–1760. [Google Scholar] [CrossRef]
- Chai, P.R.; Goodman, G.; Bustamante, M.; Mendez, L.; Mohamed, Y.; Mayer, K.H.; Boyer, E.W.; Rosen, R.K.; O’Cleirigh, C. Design and Delivery of Real-Time Adherence Data to Men Who Have Sex with Men Using Antiretroviral Pre-exposure Prophylaxis via an Ingestible Electronic Sensor. AIDS Behav. 2020, 25, 1661–1674. [Google Scholar] [CrossRef] [PubMed]
- Weitschies, W.; Müller, L.; Grimm, M.; Koziolek, M. Ingestible devices for studying the gastrointestinal physiology and their application in oral biopharmaceutics. Adv. Drug Deliv. Rev. 2021, 176, 113853. [Google Scholar] [CrossRef]
- Li, G.; Lian, W.; Qu, H.; Li, Z.; Zhou, Q.; Tian, J. Improving patient care through the development of a 5G-powered smart hospital. Nat. Med. 2021, 27, 936–937. [Google Scholar] [CrossRef]
- Muhammad, G.; Alshehri, F.; Karray, F.; El Saddik, A.; Alsulaiman, M.; Falk, T.H. A comprehensive survey on multimodal medical signals fusion for smart healthcare systems. Inf. Fusion 2021, 76, 355–375. [Google Scholar]
- Lucas, C.; Wong, P.; Klein, J.; Castro, T.B.R.; Silva, J.; Sundaram, M.; Ellingson, M.K.; Mao, T.; Oh, J.E.; Israelow, B.; et al. Longitudinal analyses reveal immunological misfiring in severe COVID-19. Nature 2020, 584, 463–469. [Google Scholar] [CrossRef] [PubMed]
- Batra, G.; Aktaa, S.; Wallentin, L.; Maggioni, A.P.; Wilkinson, C.; Casadei, B.; Gale, C.P. Methodology for the development of international clinical data standards for common cardiovascular conditions: European Unified Registries for Heart Care Evaluation and Randomised Trials (EuroHeart). Eur. Heart J. Qual. Care Clin. Outcomes 2021, 2021, qcab052. [Google Scholar] [CrossRef] [PubMed]
- Baxter, S.L.; Lee, A.Y. Gaps in standards for integrating artificial intelligence technologies into ophthalmic practice. Curr. Opin. Ophthalmol. 2021, 32, 431–438. [Google Scholar] [CrossRef]
- American Diabetes Association. Diabetes technology: Standards of medical care in diabetes—2021. Diabetes Care 2021, 44, S85–S99. [Google Scholar] [CrossRef] [PubMed]
- Laleci, G.B.; Dogac, A. A Semantically Enriched Clinical Guideline Model Enabling Deployment in Heterogeneous Healthcare Environments. IEEE Trans. Inf. Technol. Biomed. 2009, 13, 263–273. [Google Scholar] [CrossRef]
- Cartwright, D.J. ICD-9-CM to ICD-10-CM Codes: What? Why? How? Adv. Wound Care 2013, 2, 588–592. [Google Scholar] [CrossRef]
- Dotson, P. CPT® Codes: What Are They, Why Are They Necessary, and How Are They Developed? Mary Ann Liebert: New Rochelle, NY, USA, 2013. [Google Scholar]
- Gordon, W.J.; Catalini, C. Blockchain Technology for Healthcare: Facilitating the Transition to Patient-Driven Interoperability. Comput. Struct. Biotechnol. J. 2018, 16, 224–230. [Google Scholar] [CrossRef] [PubMed]
- Jabbar, R.; Fetais, N.; Krichen, M.; Barkaoui, K. Blockchain technology for healthcare: Enhancing shared electronic health record interoperability and integrity. In Proceedings of the IEEE International Conference on Informatics, IoT, and Enabling Technologies (ICIoT), Doha, Qatar, 2–5 February 2020; pp. 310–317. [Google Scholar]
- Pathak, N.; Misra, S.; Mukherjee, A.; Kumar, N. HeDI: Healthcare Device Interoperability for IoT-Based e-Health Platforms. IEEE Internet Things J. 2021, 8, 16845–16852. [Google Scholar] [CrossRef]
- Balakrishna, S.; Thirumaran, M. Semantic Interoperability in IoT and Big Data for Health Care: A Collaborative Approach. In Handbook of Data Science Approaches for Biomedical Engineering; Elsevier: Amsterdam, The Netherlands, 2020; pp. 185–220. [Google Scholar]
- Joshi, R.; Negi, S.; Sachdeva, S. Cloud Based Interoperability in Healthcare, in Computational Methods and Data Engineering; Springer: Berlin/Heidelberg, Germany, 2021; pp. 599–611. [Google Scholar]
- Dautov, R.; Distefano, S.; Buyya, R. Hierarchical data fusion for Smart Healthcare. J. Big Data 2019, 6, 19. [Google Scholar] [CrossRef]
- Hall, D.L.; Llinas, J. An introduction to multisensor data fusion. Proc. IEEE 1997, 85, 6–23. [Google Scholar] [CrossRef]
- Lee, H.; Park, K.; Lee, B.; Choi, J.; Elmasri, R. Issues in data fusion for healthcare monitoring. In Proceedings of the 1st International Conference on PErvasive Technologies Related to Assistive Environments, Athens, Greece, 16–18 July 2008. [Google Scholar]
- Djenouri, D.; Balasingham, I. New QoS and geographical routing in wireless biomedical sensor networks. In Proceedings of the Sixth International Conference on Broadband Communications, Networks, and Systems, Madrid, Spain, 14–16 September 2009. [Google Scholar]
- Choi, S.; Han, S.I.; Jung, D.; Hwang, H.J.; Lim, C.; Bae, S.; Park, O.K.; Tschabrunn, C.M.; Lee, M.; Bae, S.Y.; et al. Highly conductive, stretchable and biocompatible Ag–Au core–sheath nanowire composite for wearable and implantable bioelectronics. Nat. Nanotechnol. 2018, 13, 1048–1056. [Google Scholar] [CrossRef] [PubMed]
- Nathan, V.; Jafari, R. Particle Filtering and Sensor Fusion for Robust Heart Rate Monitoring Using Wearable Sensors. IEEE J. Biomed. Health Inform. 2017, 22, 1834–1846. [Google Scholar] [CrossRef]
- Brady, K.; Gwon, Y.; Khorrami, P.; Godoy, E.; Campbell, W.; Dagli, C.; Huang, T.S. Multi-modal audio, video and physiological sensor learning for continuous emotion prediction. In Proceedings of the 6th International Workshop on Audio/Visual Emotion Challenge, Amsterdam, The Netherlands, 16 October 2016. [Google Scholar]
- McKeever, S.; Ye, J.; Coyle, L.; Bleakley, C.; Dobson, S. Activity recognition using temporal evidence theory. J. Ambient. Intell. Smart Environ. 2010, 2, 253–269. [Google Scholar] [CrossRef]
- Cai, H.; Qu, Z.; Li, Z.; Zhang, Y.; Hu, X.; Hu, B. Feature-level fusion approaches based on multimodal EEG data for depression recognition. Inf. Fusion 2020, 59, 127–138. [Google Scholar] [CrossRef]
- Miao, F.; Liu, Z.-D.; Liu, J.-K.; Wen, B.; He, Q.-Y.; Li, Y. Multi-Sensor Fusion Approach for Cuff-Less Blood Pressure Measurement. IEEE J. Biomed. Health Inform. 2019, 24, 79–91. [Google Scholar] [CrossRef] [PubMed]
- Hossain, M.S.; Muhammad, G. Emotion-Aware Connected Healthcare Big Data Towards 5G. IEEE Internet Things J. 2017, 5, 2399–2406. [Google Scholar] [CrossRef]
- Chen, C.; Jafari, R.; Kehtarnavaz, N. A Real-Time Human Action Recognition System Using Depth and Inertial Sensor Fusion. IEEE Sens. J. 2015, 16, 773–781. [Google Scholar] [CrossRef]
- Weiskopf, N.G.; Weng, C. Methods and dimensions of electronic health record data quality assessment: Enabling reuse for clinical research. J. Am. Med. Inform. Assoc. 2013, 20, 144–151. [Google Scholar] [CrossRef]
- Fox, F.; Aggarwal, V.R.; Whelton, H.; Johnson, O. A data quality framework for process mining of electronic health record data. In Proceedings of the 2018 IEEE International Conference on Healthcare Informatics (ICHI), New York, NY, USA, 4–7 June 2018. [Google Scholar]
- Sáez, C.; Rodrigues, P.P.; Gama, J.; Robles, M.; Garcia-Gomez, J.M. Probabilistic change detection and visualization methods for the assessment of temporal stability in biomedical data quality. Data Min. Knowl. Discov. 2014, 29, 950–975. [Google Scholar] [CrossRef]
- Puttkammer, N.; Baseman, J.; Devine, E.; Valles, J.; Hyppolite, N.; Garilus, F.; Honoré, J.; Matheson, A.; Zeliadt, S.; Yuhas, K.; et al. An assessment of data quality in a multi-site electronic medical record system in Haiti. Int. J. Med. Inform. 2016, 86, 104–116. [Google Scholar] [CrossRef] [PubMed]
- Taggart, J.; Liaw, S.-T.; Yu, H. Structured data quality reports to improve EHR data quality. Int. J. Med. Inform. 2015, 84, 1094–1098. [Google Scholar] [CrossRef] [PubMed]
- Li, Q.; Zhao, K.; Bustamante, C.D.; Ma, X.; Wong, W.H. Xrare: A machine learning method jointly modeling phenotypes and genetic evidence for rare disease diagnosis. Anesthesia Analg. 2019, 21, 2126–2134. [Google Scholar] [CrossRef]
- Jia, J.; Wang, R.; An, Z.; Guo, Y.; Ni, X.; Shi, T. RDAD: A Machine Learning System to Support Phenotype-Based Rare Disease Diagnosis. Front. Genet. 2018, 9, 587. [Google Scholar] [CrossRef] [PubMed]
- Morley, K.I.; Wallace, J.; Denaxas, S.C.; Hunter, R.J.; Patel, R.S.; Perel, P.; Shah, A.D.; Timmis, A.D.; Schilling, R.J.; Hemingway, H. Defining Disease Phenotypes Using National Linked Electronic Health Records: A Case Study of Atrial Fibrillation. PLoS ONE 2014, 9, e110900. [Google Scholar] [CrossRef] [PubMed]
- Ash, J.A.; Rapp, P.R. A quantitative neural network approach to understanding aging phenotypes. Ageing Res. Rev. 2014, 15, 44–50. [Google Scholar] [CrossRef]
- Lee, C.; Rashbass, J.; van der Schaar, M. Outcome-Oriented Deep Temporal Phenotyping of Disease Progression. IEEE Trans. Biomed. Eng. 2020, 68, 2423–2434. [Google Scholar] [CrossRef]
- Tuyéras, R. Category theory for genetics II: Genotype, phenotype and haplotype. arXiv 2018, arXiv:1805.07004. [Google Scholar]
- Mayer, A.H.; da Costa, C.; Righi, R. Electronic health records in a blockchain: A systematic review. Health Inform. J. 2020, 26, 1273–1288. [Google Scholar] [CrossRef]
- Shi, S.; He, D.; Li, L.; Kumar, N.; Khan, M.K.; Choo, K.-K.R. Applications of blockchain in ensuring the security and privacy of electronic health record systems: A survey. Comput. Secur. 2020, 97, 101966. [Google Scholar] [CrossRef]
- Kim, Y.; Heider, P.; Meystre, S. Ensemble-based Methods to Improve De-identification of Electronic Health Record Narratives. AMIA Annu. Symp. Proceedings AMIA Symp. 2018, 2018, 663–672. [Google Scholar]
- Ahmed, T.; Al Aziz, M.; Mohammed, N. De-identification of electronic health record using neural network. Sci. Rep. 2020, 10, 18600. [Google Scholar] [CrossRef]
- Guan, Z.; Lv, Z.; Du, X.; Wu, L.; Guizani, M. Achieving data utility-privacy tradeoff in Internet of Medical Things: A machine learning approach. Futur. Gener. Comput. Syst. 2019, 98, 60–68. [Google Scholar] [CrossRef]
- Vaidyam, A.N.; Wisniewski, H.; Halamka, J.D.; Kashavan, M.S.; Torous, J.B. Chatbots and Conversational Agents in Mental Health: A Review of the Psychiatric Landscape. Can. J. Psychiatry 2019, 64, 456–464. [Google Scholar] [CrossRef] [PubMed]
- Abd-Alrazaq, A.; Safi, Z.; Alajlani, M.; Warren, J.; Househ, M.; Denecke, K. Technical Metrics Used to Evaluate Health Care Chatbots: Scoping Review. J. Med. Internet Res. 2020, 22, e18301. [Google Scholar] [CrossRef] [PubMed]
- Campbell, J.I.; Eyal, N.; Musiimenta, A.; Haberer, J.E. Ethical Questions in Medical Electronic Adherence Monitoring. J. Gen. Intern. Med. 2015, 31, 338–342. [Google Scholar] [CrossRef]
- Golshahi, J.; Ahmadzadeh, H.; Sadeghi, M.; Mohammadifard, N.; Pourmoghaddas, A. Effect of self-care education on lifestyle modification, medication adherence and blood pressure in hypertensive adults: Randomized controlled clinical trial. Adv. Biomed. Res. 2015, 4, 204–209. [Google Scholar]
- Molugulu, N.; Gubbiyappa, K.S.; Murthy, C.R.V.; Lumae, L.; Mruthyunjaya, A.T. Evaluation of self-reported medication adherence and its associated factors among epilepsy patients in Hospital Kuala Lumpur. J. Basic Clin. Pharm. 2016, 7, 105–109. [Google Scholar] [CrossRef] [PubMed]
- Bavan, L.; Surmacz, K.; Beard, D.; Mellon, S.; Rees, J. Adherence monitoring of rehabilitation exercise with inertial sensors: A clinical validation study. Gait Posture 2019, 70, 211–217. [Google Scholar] [CrossRef] [PubMed]
- Wang, L.; Fan, R.; Zhang, C.; Hong, L.; Zhang, T.; Chen, Y.; Liu, K.; Wang, Z.; Zhong, J. Applying Machine Learning Models to Predict Medication Nonadherence in Crohn’s Disease Maintenance Therapy. Patient Prefer. Adherence 2020, 14, 917–926. [Google Scholar] [CrossRef] [PubMed]
- Aldeer, M.; Javanmard, M.; Martin, R.P. A Review of Medication Adherence Monitoring Technologies. Appl. Syst. Innov. 2018, 1, 14. [Google Scholar] [CrossRef]
- Chai, P.R.; Castillo-Mancilla, J.; Buffkin, E.; Darling, C.; Rosen, R.K.; Horvath, K.J.; Boudreaux, E.D.; Robbins, G.K.; Hibberd, P.L.; Boyer, E.W. Utilizing an Ingestible Biosensor to Assess Real-Time Medication Adherence. J. Med. Toxicol. 2015, 11, 439–444. [Google Scholar] [CrossRef] [PubMed]
- Chen, M.; Hao, Y.; Hwang, K.; Wang, L.; Wang, L. Disease Prediction by Machine Learning Over Big Data from Healthcare Communities. IEEE Access 2017, 5, 8869–8879. [Google Scholar] [CrossRef]
- Mohan, S.; Thirumalai, C.; Srivastava, G. Effective Heart Disease Prediction Using Hybrid Machine Learning Techniques. IEEE Access 2019, 7, 81542–81554. [Google Scholar] [CrossRef]
- Venkatesh, R.; Balasubramanian, C.; Kaliappan, M. Development of Big Data Predictive Analytics Model for Disease Prediction using Machine learning Technique. J. Med. Syst. 2019, 43, 272. [Google Scholar] [CrossRef] [PubMed]
- Cooper, G.F.; Aliferis, C.F.; Ambrosino, R.; Aronis, J.; Buchanan, B.G.; Caruana, R.; Fine, M.J.; Glymour, C.; Gordon, G.; Hanusa, B.H.; et al. An evaluation of machine-learning methods for predicting pneumonia mortality. Artif. Intell. Med. 1997, 9, 107–138. [Google Scholar] [CrossRef]
- Rose, S. Mortality Risk Score Prediction in an Elderly Population Using Machine Learning. Am. J. Epidemiol. 2013, 177, 443–452. [Google Scholar] [CrossRef]
- van Doorn, W.P.; Stassen, P.M.; Borggreve, H.F.; Schalkwijk, M.J.; Stoffers, J.; Bekers, O.; Meex, S.J. A comparison of machine learning models versus clinical evaluation for mortality prediction in patients with sepsis. PLoS ONE 2021, 16, e0245157. [Google Scholar] [CrossRef] [PubMed]
- Raj, R.; Luostarinen, T.; Pursiainen, E.; Posti, J.P.; Takala, R.S.K.; Bendel, S.; Konttila, T.; Korja, M. Machine learning-based dynamic mortality prediction after traumatic brain injury. Sci. Rep. 2019, 9, 17672. [Google Scholar] [CrossRef]
- Rau, C.-S.; Kuo, P.-J.; Chien, P.-C.; Huang, C.-Y.; Hsieh, H.-Y.; Hsieh, C.-H. Mortality prediction in patients with isolated moderate and severe traumatic brain injury using machine learning models. PLoS ONE 2018, 13, e0207192. [Google Scholar] [CrossRef] [PubMed]
- Awad, E.; Dsouza, S.; Kim, R.; Schulz, J.; Henrich, J.; Shariff, A.; Bonnefon, J.-F.; Rahwan, I. The Moral Machine experiment. Nature 2018, 563, 59–64. [Google Scholar] [CrossRef] [PubMed]
- Wang, J.; Ji, J.; Zhang, M.; Lin, J.-W.; Zhang, G.; Gong, W.; Cen, L.-P.; Lu, Y.; Huang, X.; Huang, D.; et al. Automated Explainable Multidimensional Deep Learning Platform of Retinal Images for Retinopathy of Prematurity Screening. JAMA Netw. Open 2021, 4, e218758. [Google Scholar] [CrossRef] [PubMed]
- Zuallaert, J.; Godin, F.; Kim, M.; Soete, A.; Saeys, Y.; De Neve, W. SpliceRover: Interpretable convolutional neural networks for improved splice site prediction. Bioinformatics 2018, 34, 4180–4188. [Google Scholar] [CrossRef]
- Ribeiro, M.T.; Singh, S.; Guestrin, C. Model-agnostic interpretability of machine learning. arXiv 2016, arXiv:1606.05386. [Google Scholar]
- Visani, G.; Bagli, E.; Chesani, F. OptiLIME: Optimized LIME explanations for diagnostic computer algorithms. arXiv 2020, arXiv:2006.05714. [Google Scholar]
- Salih, A.; Galazzo, I.B.; Raisi-Estabragh, Z.; Petersen, S.E.; Gkontra, P.; Lekadir, K.; Menegaz, G.; Radeva, P. A new scheme for the assessment of the robustness of Explainable Methods Applied to Brain Age estimation. In Proceedings of the 2021 IEEE 34th International Symposium on Computer-Based Medical Systems (CBMS), Aveiro, Portugal, 7–9 June 2021. [Google Scholar]
- Shickel, B.; Loftus, T.J.; Adhikari, L.; Ozrazgat-Baslanti, T.; Bihorac, A.; Rashidi, P. DeepSOFA: A Continuous Acuity Score for Critically Ill Patients using Clinically Interpretable Deep Learning. Sci. Rep. 2019, 9, 1879. [Google Scholar] [CrossRef]
- Hartono, P. A transparent cancer classifier. Health Inform. J. 2018, 26, 190–204. [Google Scholar] [CrossRef] [PubMed]
- Park, S.; Kim, Y.J.; Kim, J.W.; Park, J.J.; Ryu, B.; Ha, J.-W. Interpretable Prediction of Vascular Diseases from Electronic Health Records via Deep Attention Networks. In Proceedings of the IEEE 18th International Conference on Bioinformatics and Bioengineering (BIBE), Taichung, Taiwan, 29–31 October 2018; pp. 110–117. [Google Scholar]
- Bernardini, M.; Romeo, L.; Misericordia, P.; Frontoni, E. Discovering the Type 2 Diabetes in Electronic Health Records Using the Sparse Balanced Support Vector Machine. IEEE J. Biomed. Health Inform. 2019, 24, 235–246. [Google Scholar] [CrossRef] [PubMed]
- Ming, Y.; Qu, H.; Bertini, E. RuleMatrix: Visualizing and Understanding Classifiers with Rules. IEEE Trans. Vis. Comput. Graph. 2018, 25, 342–352. [Google Scholar] [CrossRef] [PubMed]
- Xiao, C.; Ma, T.; Dieng, A.B.; Blei, D.M.; Wang, F. Readmission prediction via deep contextual embedding of clinical concepts. PLoS ONE 2018, 13, e0195024. [Google Scholar] [CrossRef] [PubMed]
- Montavon, G.; Lapuschkin, S.; Binder, A.; Samek, W.; Müller, K.-R. Explaining nonlinear classification decisions with deep Taylor decomposition. Pattern Recognit. 2017, 65, 211–222. [Google Scholar] [CrossRef]
- Silva, P.E.; Maldaner, V.; Vieira, L.; de Carvalho, K.L.; Gomes, H.; Melo, P.; Babault, N.; Cipriano, G.; Durigan, J.L.Q. Neuromuscular electrophysiological disorders and muscle atrophy in mechanically-ventilated traumatic brain injury patients: New insights from a prospective observational study. J. Crit. Care 2018, 44, 87–94. [Google Scholar] [CrossRef]
- Menegotto, A.B.; Becker, C.D.L.; Cazella, S.C. Computer-aided diagnosis of hepatocellular carcinoma fusing imaging and structured health data. Health Inf. Sci. Syst. 2021, 9, 20. [Google Scholar] [CrossRef]
- Simpson, S.; Kaufmann, M.C.; Glozman, V.; Chakrabarti, A. Disease X: Accelerating the development of medical countermeasures for the next pandemic. Lancet Infect. Dis. 2020, 20, e108–e115. [Google Scholar] [CrossRef]
- Higgins, M.K. Can we AlphaFold our way out of the next pandemic? J. Mol. Biol. 2021, 433, 167093. [Google Scholar] [CrossRef] [PubMed]
- Li, J.; Zhang, S.; Li, B.; Hu, Y.; Kang, X.-P.; Wu, X.-Y.; Huang, M.-T.; Li, Y.-C.; Zhao, Z.-P.; Qin, C.-F.; et al. Machine Learning Methods for Predicting Human-Adaptive Influenza A Viruses Based on Viral Nucleotide Compositions. Mol. Biol. Evol. 2019, 37, 1224–1236. [Google Scholar] [CrossRef]


| References | Time Series | Disease Specific | Translational Medicine |
|---|---|---|---|
| [12] | ✓ | X | X |
| [18] | ✓ | ✓ | X |
| [19] | X | ✓ | X |
| [16] | X | ✓ | X |
| [15] | ✓ | ✓ | X |
| [17] | ✓ | ✓ | X |
| Our work | ✓ | X | ✓ |
| References | Applications | Sensors | Generative | Predictive | Clinical | Imputation |
|---|---|---|---|---|---|---|
| [26] | Motif Discovery | ECG | ✓ | X | ✓ | X |
| [22] | Motif Discovery | ECG and EEG | ✓ | ✓ | X | ✓ |
| [24] | Anomaly Detection | ECG | X | ✓ | ✓ | X |
| [25] | Expenditure Calculation | Healthcare data | X | ✓ | ✓ | X |
| [27] | Benchmarking | MIMIC-III | X | ✓ | ✓ | X |
| [28] | Imputation | ECG, MIMIC | X | ✓ | ✓ | ✓ |
| References | Application | Techniques Used | Data | Contributions | Predictive | Descriptive |
|---|---|---|---|---|---|---|
| [32] | Temporal Phenotyping | Attention Models | MIMIC-III | 10% greater than RNN in disease prediction and 3% improved areas under ROC | ✓ | ✓ |
| [38] | Hinge Loss | Predicted congestive health failure with an 80% accuracy. The area under the curve for patient readmission increased by over 50% from the spectral clustering | ✓ | ✓ | ||
| [36] | Graph representation | Note Binning | STRIDE | Developed term and concept mappings | X | ✓ |
| [39] | Feature fusion | Multi-Channel feature fusion | Pressure and Photo–electric Sensors | 93.1% accuracy in predicting diabetes from pulse detection data. | X | X |
| References | Application | Techniques Used | Evaluation Metrics | Structured Data |
|---|---|---|---|---|
| [83] | Detection of clinical depression | NLP | Specificity:97%. Sensitivity:45% | X |
| [84] | Disease prediction | LDA | AUC 0.94, Sensitivity 0.87 and Specificity 0.87 | ✓ |
| [94] | HPV detection | NLP | AUC: 0.861 | X |
| [92] | Breast cancer detection | NLP | AUC 0.91, Sensitivity: 0.861, Specificity 0.878, Accuracy 0.870. | ✓ |
| Name | Properties | References |
|---|---|---|
| Blockchain technology | Focused on patients rather than healthcare providers. Data are linked to the patient, aggregated, and then sensitive information such as allergies is published on the blockchain, ensuring privacy and data immutability. | [109,110] |
| Internet of Things | It employs the principles of the internet of things for data interoperability. It uses the protocols of Message Queuing Telemetry Transport (MQTT) to publish the relevant patient information. | [111] |
| Dynamic Semantic Web services | It uses the dynamic semantic web to convert the data into the HL7 framework. | [112] |
| Cloud Based Interoperability | It uses cloud-based models, for example, amazon web services, Microsoft Azure, and IBM Watson, to convert it into an openEHR or HL7 standard. | [113] |
| Knowledge Graphs | Knowledge graphs are used for the interoperability of biomedical data. | [37] |
| Name | Summary | Application | References |
|---|---|---|---|
| Conversational Robot | Chatbot used for drug adherence | Drug Adherence | [142,143] |
| Ethics | Deliberates over the ethical questions arising from the usage of AI in Norm Adherence | Ethics | [144] |
| Lifestyle Modification | It uses a web app to help monitor adherence, lifestyle modifications, for Example, in the case of cancer. | Drug Adherence | [145] |
| Medication Adherence | It uses machine learning to perform binary classification of the medication adherence for Parkinson’s disease patients. | Remote Monitoring | [146] |
| Excercise Adherence | Uses machine learning models to estimate likelihood to adhere to a physical exercise regimen using accelerators and other data sources. | Predictive healthcare | [147] |
| Medication Adherence | Uses machine learning models to identify the likelihood of non-adherence to medication from electronic health records | Predictive healthcare | [148] |
| Medication Adherence | Uses data from wearable sensors to measure drug adherence for a specific cause. | Remote Monitoring | [149] |
| Medication Adherence | Uses cloud-based applications for medication adherence in home hospitalizations | Remote Monitoring | [150] |
Disclaimer/Publisher’s Note: The statements, opinions and data contained in all publications are solely those of the individual author(s) and contributor(s) and not of MDPI and/or the editor(s). MDPI and/or the editor(s) disclaim responsibility for any injury to people or property resulting from any ideas, methods, instructions or products referred to in the content. |
© 2023 by the authors. Licensee MDPI, Basel, Switzerland. This article is an open access article distributed under the terms and conditions of the Creative Commons Attribution (CC BY) license (https://creativecommons.org/licenses/by/4.0/).
Share and Cite
Ali, H.; Niazi, I.K.; Russell, B.K.; Crofts, C.; Madanian, S.; White, D. Review of Time Domain Electronic Medical Record Taxonomies in the Application of Machine Learning. Electronics 2023, 12, 554. https://doi.org/10.3390/electronics12030554
Ali H, Niazi IK, Russell BK, Crofts C, Madanian S, White D. Review of Time Domain Electronic Medical Record Taxonomies in the Application of Machine Learning. Electronics. 2023; 12(3):554. https://doi.org/10.3390/electronics12030554
Chicago/Turabian StyleAli, Haider, Imran Khan Niazi, Brian K. Russell, Catherine Crofts, Samaneh Madanian, and David White. 2023. "Review of Time Domain Electronic Medical Record Taxonomies in the Application of Machine Learning" Electronics 12, no. 3: 554. https://doi.org/10.3390/electronics12030554
APA StyleAli, H., Niazi, I. K., Russell, B. K., Crofts, C., Madanian, S., & White, D. (2023). Review of Time Domain Electronic Medical Record Taxonomies in the Application of Machine Learning. Electronics, 12(3), 554. https://doi.org/10.3390/electronics12030554