Abstract
This paper investigates the calibration methods appropriate to the phased array calibration in practical measurement setups. The rotating element electric field vector (REV) method, fast amplitude-only calibration method, and complex amplitude calibration method are compared and analyzed in the same measurement setup. The objective is to investigate the robustness of the discussed algorithms with different measurement ranges, with or without the support of array element on/off operation. A uniform rectangular array (URA) is used to validate the three different calibration methods. The measurement results indicate that array element on/off measurement in the far field is suitable to be a reference calibration method in practical setup. The REV and complex amplitude calibration methods present comparable accuracy while fast amplitude-only calibration method provides less accurate calibration results in this measurement. Further, it was demonstrated that with element on/off data available, same calibration accuracy can be achieved either in small or large measurement ranges for the three different calibration methods. However, when the element on/off data is not available, the array calibration accuracy deteriorates with small measurement range. This paper presents the method to calibrate the phased array antenna in near-field by using the element on/off data. This is a very useful method in massive production line calibration. The calibration errors of different calibration methods are analyzed. Furthermore, this paper also analyzes the uncertainty of each method.
1. Introduction
Phased array antennas play an important role in both military and civilian applications [1,2,3,4]. However, the large-scale application of phased array antennas in 5G communication is just beginning [5]. Efficient and accurate calibration is essential for both research and development (R&D) testing and massive production lines.
Internal calibration circuit employing radio frequency (RF) coupler is widely used to calibrate the RF front-end in early applications. However, the antenna elements cannot be included in the internal calibration circuit. Further, the influence of inconsistency and mutual coupling among antenna elements cannot be eliminated. The element aging and temperature variations in the phased array antenna have also drawn considerable attention from the industry. In order to reduce the cost of large-scale commercial deployment in the future, the internal calibration circuit will not be applicable. Therefore, there is a strong need for highly efficient and accurate calibration methods.
Many calibration methods have been developed for the phased array antennas. According to the existence of phase, the calibration methods are divided into vector measurement and scalar measurement [6,7,8,9,10,11,12,13,14,15,16,17,18,19,20,21]. Vector measurements are more efficient and accurate, while scalar measurement is more suitable for active antenna calibration without reference signals. According to the distance between the antenna array and probe antenna, the calibration methods are divided into far-field calibration and near-field calibration. Far-field calibration accuracy is less sensitive to the radiation pattern of the antenna array element and the probe antenna, and the geometry of the measurement setup. However, large-scale chamber, compact antenna test range (CATR), or plane wave generator (PWG) is required to approximate a plane wave in the quiet zone, which is cost-prohibitive. Near-field calibration is space efficient and particularly useful for massive production lines. However, the array calibration accuracy might suffer from the smaller measurement range. There is a strong need to understand how severely the measurement range would affect the array calibration accuracy and how to alleviate the problem.
Depending on whether there is a need to preset phases for array elements, the array calibration method can be grouped into two categories: near-field scanning calibration and presetting phase calibration. Near-field planar scanning is one of the basic methods in phased array measurements [3,4,5,6,22,23,24,25]. Most of the near-field scanning calibration methods require many complex field distribution measurements in the near-field region with high position precision, leading to time-consuming and complicated measurements. Among the presetting phase calibration methods, a famous and widely-used method is the rotating electric field vector (REV) method, which was first proposed by Seiji Mano [9] and developed by many authors [10,11,12]. The REV method is a typical scalar measurement method in which only the power of the field is collected by a single probe located at the far-field region of the antenna under test (AUT). In [13], the synthetic array approach was proposed to obtain the signals of the individual elements via standard matrix inversion techniques. Phase-toggling method [14] and multi-element phase-toggling method [15] can also obtain the amplitude and phase of the signals at a single position, similar to the synthetic array approach mentioned above. In [16,17], the orthogonal encoding and decoding algorithm is introduced to the phased array calibration, in which the complex weights of the individual elements are obtained simultaneously. An interesting method based on solving linear equations was proposed in [18], which offers a minimum number of required measurements. This method works when the probe antenna is placed either in the far-field or near-field region of the AUT and is not restricted by the bit-number of the digital phase shifters.
The objective of the paper is to investigate how the accuracy of calibration algorithms is affected in practical setups. We aim to address the following questions in our analysis:
- How to obtain the true initial phase and amplitude of per array element? A reference calibration method is required to determine the “ground truth”, which can be later used to evaluate the performance of discussed array calibration methods. Two straightforward measurements, i.e., “face-to-face” and “far-field element on/off” measurements, are compared and analyzed.
- How is the accuracy of calibration algorithms affected by the measurement range, with and without the support of element on/off operation? Element on/off operation might be difficult in practical base station (BS) products. In this case, we can utilize the measurement setup geometry to calculate the scattering coefficients between the probe antenna and the array elements for the phased array calibration.
- How robust are the discussed algorithms under the same measurement setting?
2. Array Calibration Methods
In this section, three array calibration methods are briefly revisited.
2.1. REV Method
The AUT elements can be sequentially calibrated by the REV method. The calibration is achieved by employing a probe to measure the power radiated by all elements. The measurement is implemented by tuning the phase of an element denoted as from to , while the phases of the other elements keep . Based on the superposition principle, the maximum and minimum power of the composite field denoted as and can be obtained with the phase shift of and , as shown in Figure 1. The composite field can be expressed as follows:
and can be described as:
where denotes the composite field with and representing the amplitude and phase of , respectively. and represent the amplitude and phase of the field radiated by the n-th element. The calibration accuracy is related to the bit number of the phase shifter, i.e., the phase tuning interval. However, it is inefficient and time-consuming to operate with small tuning interval. Curve fitting can be beneficial to achieve dense phase interval measurement.
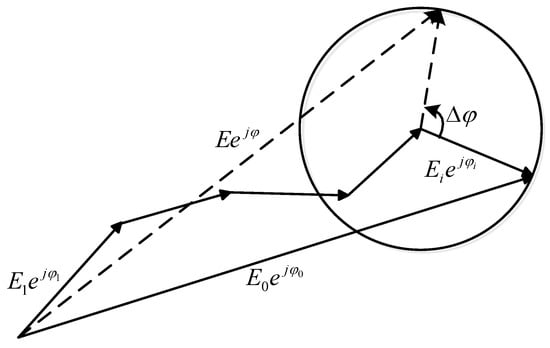
Figure 1.
The composite of electric field.
2.2. Fast Amplitude-Only Method
The fast amplitude-only method has been inspired by the REV method. The improvement is that only three phase states of an element, i.e., , , and are required, which greatly improves the calibration efficiency. Therefore, this method just takes measurements, with N representing the number of the AUT elements. The power of the composite field for each phase state is given by:
where with represents the measured signal power with and denoting the amplitude and phase of the composite field of all elements except the n-th one. and are the amplitude and phase of the n-th element, respectively. The calibration can be achieved by solving the nonlinear equations in (3) [26].
2.3. Complex Amplitude Calibration Method
Complex amplitude calibration method is a general calibration method with a single probe collecting the complex field radiated by all elements with a configured phase setup in the near-field or far-field of the AUT. The key is that the phase setting matrix requires careful design to guarantee a small condition number to ensure the calibration accuracy. The principle of this method is to solve a linear equation based on the phase setting matrix and the measured complex signals. The linear equation can be described as follows:
where is the coefficient matrix with denoting the phase shift of the n-th element in the m-th measurement for and . N represents the number of the AUT elements and M denotes the number of measurements (with ). The vector can be obtained via solving linear Equation (4), with and denoting the initial excitation of the n-th element and the scattering parameter between the probe and the n-th element, respectively. The vector denotes the complex array signal measured in the m-th measurement.
The least squares (LS) method can be used to calculate the initial excitation of each element through choosing appropriate phase setups which determines the calibration accuracy. In this paper, an improved multi-element phased array calibration method is used [27], which solves the deficiency of the method proposed in [18] by adding only one more measurement.
Both the REV method and the fast amplitude-only method are scalar measurements while the complex amplitude calibration method is a vector measurement. All three methods work in both far-field and near-field conditions in principle. The REV method requires measurements, with P denoting the number of togged phase settings. As discussed, the fast amplitude-only method requires only measurements. As for the complex amplitude method, it requires the minimum number of measurements, i.e., in principle [27].
3. Measurement Campaign and Results
3.1. Experimental Setup
A set of measurement campaigns were performed in an anechoic chamber to validate the discussed array calibration algorithms. As illustrated in Figure 2, the experimental system consists of (1) a two-port vector network analyzer (VNA) to record the channel frequency responses (CFRs), (2) a 32-port amplitude and phase control network system, (3) 32 wideband dual polarized four ridged horn antennas as transmit (Tx) DUT antennas connected to the control network, and (4) an axial grooved corrugated horn antenna as the receive (Rx) antenna. The amplitude and phase control network is implemented with a power splitting network, 8-bit digital phase shifters, and programmable attenuators with 60 dB dynamic tuning range. The preset complex excitation of each Tx antenna can be implemented with the control network system. A 16 × 16 uniform rectangular array (URA) is constructed at the Tx side with element spacing of 108 mm, though only 32 antenna elements in the center region of the URA were selected in the measurement campaign, as shown in Figure 2. According to the digital phase shifter specification, an amplitude uncertainty within dB and a phase uncertainty within might be expected for each phase state. The amplitude and phase control network is sensitive to room temperature change. Therefore, to improve the measurement accuracy, the room temperature was maintained stable during measurements, where a power deviation up to 0.1 dB and phase deviation up to 0.2° were achieved for repeated measurements. For each measurement, a frequency sweep from 3 GHz to 4 GHz with 1 GHz bandwidth and 1043 frequency samples were recorded in the VNA. The intermediate frequency (IF) was set to 1 kHz and the transmit power was set to 10 dBm in the VNA, respectively.
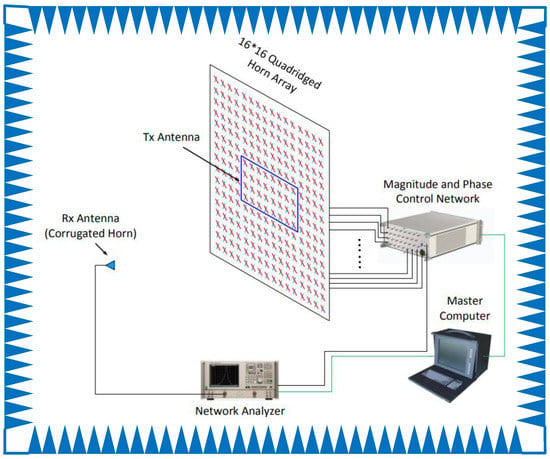
Figure 2.
Schematic of the experimental system.
3.2. Reference Calibration Measurements
To validate the effectiveness of the discussed array calibration algorithms, a reference calibration measurement (i.e., the ground truth measurement) is required. In the reference calibration measurement, a URA (which is selected at the center of the URA) was utilized. The initial phases of all the digital phase shifters were set to and the attenuators were set to 0 dB. In the ideal case, the relative power should be 0 dB and relative phase should be for all antenna elements. However, due to the intrinsic difference in radio frequency (RF) branches, some deviations might exist. In the reference calibration measurements, the objective is to identify the true initial excitations of all Tx antenna elements. Two reference measurements were carried out:
- In the first so-called “face-to-face” calibration measurement, the Rx antenna was moved in proximity to each of the Tx antenna elements, aligned and attached with the Tx antenna. Since the same antenna type was employed for the Tx and Rx element, a distance less than 0.1 mm can be achieved during the “face-to-face” calibration measurement. The signals can be transferred from the Tx to the Rx through this “wave-guide” setup. The basic assumption here is that the scattering parameter between the Rx antenna and the n-th Tx antenna is the same for due to the same measurement distance. Therefore, the initial excitation of the phased array elements can be directly recorded in the N measurements. The “face-to-face” calibration is adopted in the industry due to its simplicity and low requirement of the measurement range. However, this method might not be accurate, since the scattering parameter is highly sensitive to the distance in the near-field region of the antenna. Due to the inconsistency of the structure, the multiple reflection signals generated between the two “face-to-face” antennas are also different.
- In the other so-called “far-field on/off” calibration measurement, the Rx antenna was placed with a distance of 5.85 m as shown in Figure 3, which is larger than the Fraunhofer far-field distance of the URA at 3.5 GHz (around 4.9 m). At the Tx array side, we can enable one Tx antenna with digital phase shifter set to and attenuators, and meanwhile disable all the other Tx antennas (via setting dB in the associated programmable attenuators). Then we repeated the “on/off” procedure for all the N Tx antenna elements and recorded the respective frequency responses in the VNA. Under the far-field assumption, we have the same scattering parameter between the Rx antenna and the n-th Tx antenna element for . Again, the initial excitation of the Tx antenna elements of the phased array can be directly recorded in the N measurements.
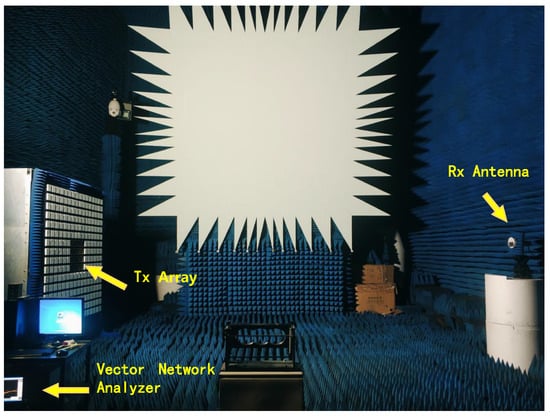 Figure 3. The front view of the experimental system with a measurement distance of 5.85 m.
Note that the “far-field on/off” calibration method can be used as the reference method in the paper since the on/off operation is supported with the experimental setup. The array calibration results at 3.5 GHz using the “far-field on/off” and “face-to-face” methods are shown in Figure 4. A power deviation up to dB and a phase deviation up to across the antenna elements can be observed for both reference calibration methods, indicating the different initial excitation among RF branches. The measured results demonstrated that the “face-to-face” method can only be used for rough array calibration, and it might be not sufficient for accurate antenna array calibration. In the analysis below, the “far-field on/off” calibration method can be selected as the reference to evaluate the accuracy of different array calibration results.
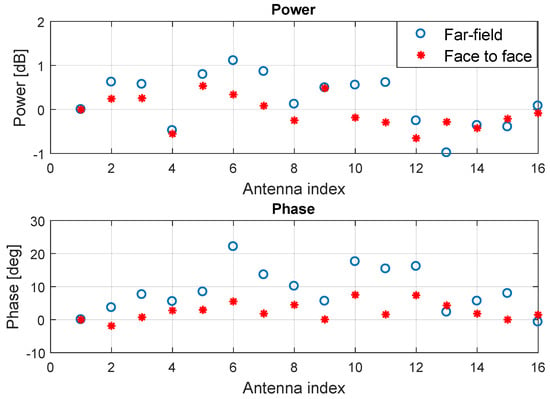
Figure 4.
A comparison between the “far-field element on/off” and “face-to-face” calibration measurement comparison. The power and phase values were normalized to the first antenna element for both methods.
3.3. Measurement Campaigns and Results
The Rx antenna was placed at two different distances to the Tx antenna in the measurement, m (as shown in Figure 3) and m (as shown in Figure 5). The objective was to investigate whether the discussed algorithms work in setups with different measurement ranges. For each measurement distance, three discussed array calibration algorithms were validated. For the REV method measurement, in total we performed (i.e., number of phase states × number of array elements) measurements. That is, the phase for each array element was swept from to with a step for each array element. For the fast amplitude measurement, three phase states, i.e., , , and per array element were swept. Therefore, we can reuse the subset of the measured data (with phase states , , and ) from the REV measurements for validating the fast amplitude calibration methods. For the complex amplitude calibration measurement, 33 new measurements were required due to the fact that the array elements were excited in a different manner with the control network. Note that for the REV and fast amplitude methods, only the power measurements are needed. The phase measurement results, though available in the VNA measurements, are not utilized. For demonstration purposes, we intentionally set 5 dB attenuation in the 24th RF chain and 0 dB attenuation in the other RF chains. Further, we set in the digital phase shifter in the 3rd RF branch and in the other RF branches on purpose.
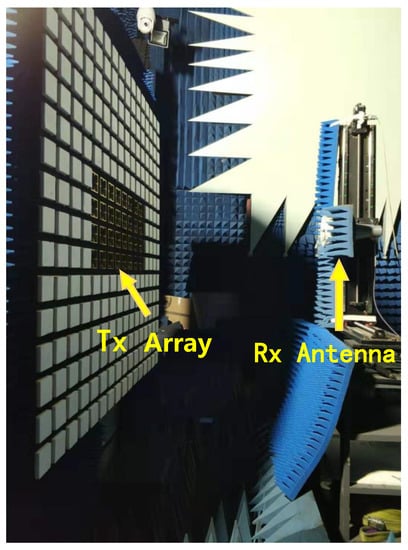
Figure 5.
The side view of the experimental system with a measurement distance of 1 m.
3.3.1. Time Domain Gating
As shown in Figure 3, a large reflector antenna exists in the anechoic chamber, which might introduce unintended reflections in the room. The channel impulse response (CIR) from one Tx antenna to the Rx antenna with a measurement distance of 5.85 m can be obtained via performing inverse Fourier transform of the measured CFR in the VNA. The relationship between the CIR and CFR can be described as:
The operators of and represent the Fourier transform and the inverse Fourier transform. As shown in Figure 6, a reflected path due to the reflector antenna, with a relative delay of 8 ns (corresponding to 2.4 m in distance) and power loss of around −20 dB to the line-of-sight direct path, exists. We can perform time-domain gating to remove the unwanted reflections as shown in Figure 6 (top). Once the time domain gate has been applied to the CIR data, the data can be converted back to the frequency domain. The time-gated CFR can now be evaluated in the frequency domain, as shown in Figure 6 (below). Array calibration results were performed at 3.5 GHz in the following analysis. Note that the same analysis can be performed to other selected frequency points as well.
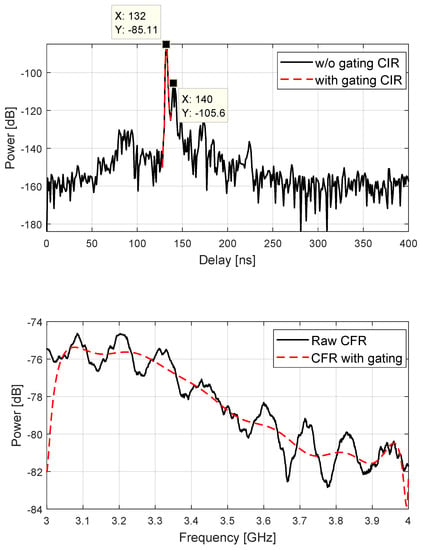
Figure 6.
The CIRs from one Tx antenna to Rx antenna with and without gating (top) and their associated CFRs (below).
3.3.2. Array Calibration in Far-Field and Near-Field
As explained earlier, we can obtain the scattering parameter between the Rx antenna and the n-th Tx antenna for following the “on/off” procedure for m and m. Utilizing the direct measured scattering coefficients, the array calibration results based on three discussed array calibration methods are shown in Figure 7 and Figure 8 for m and m, respectively. For simplicity, the REV method is denoted as “REV”, the fast amplitude-only calibration method is denoted as “Amp-only”, and the complex amplitude calibration method is represented as “Complex” in the following figures. For both distances, we can detect the target phase and amplitude settings in the RF branches accurately with all three methods (i.e., −5 dB amplitude for the 24th branch and 0 dB for other branches, for the 3rd branch and for other branches). The error levels for large distance and small distance are comparable, indicating that the three algorithms are effective in large or small measurement ranges. The performance of the three calibration methods is shown in Figure 9, for m as an example. The fast amplitude method (i.e., method 2) performs the worst among the three algorithms, with a power deviation up to dB and phase deviation ±3.5°. The REV method accuracy is comparable to the complex amplitude method, both with a power deviation up to ±0.5 dB and phase deviation ±1.5°. As explained earlier, the REV method requires power only measurements, with the largest required number of measurements. As for the complex amplitude methods, it needs complex amplitude measurements, but it also offers the least required number of measurements. Both algorithms are more robust compared to the fast amplitude method.
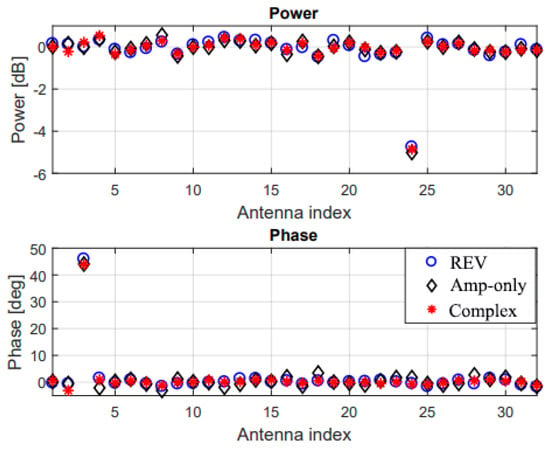
Figure 7.
Array calibration results based on three methods with m.
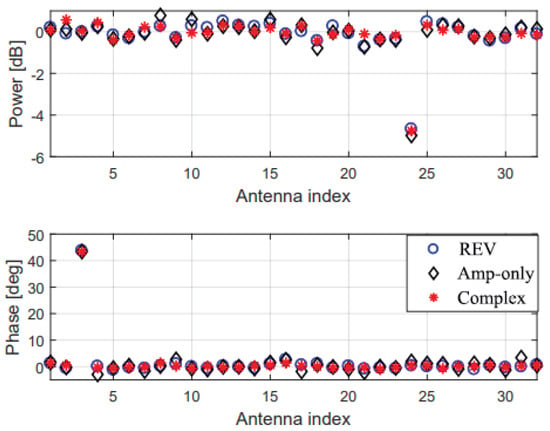
Figure 8.
Array calibration results based on three methods with m.
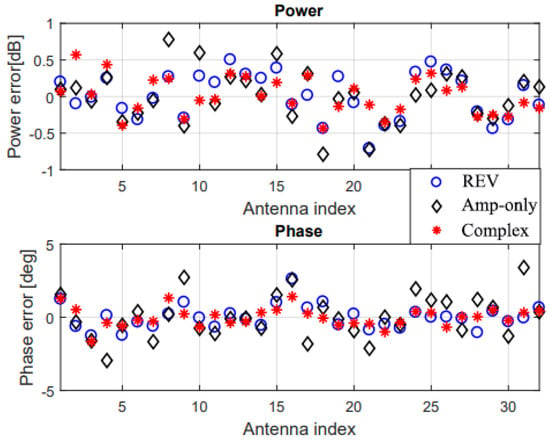
Figure 9.
Array calibration error based on three methods with m.
3.3.3. Scattering Coefficient Calculation
Though accurate, the on/off procedure to obtain scattering coefficients might not be supported for some active phased array systems due to the requirement of on/off operation of active RF chains. It is often required that accurate array calibration should be achieved with all Tx antenna elements active (i.e., with phase tuning only). The scattering coefficient includes the effect of the Rx antenna pattern, the propagation channel and the n-th Tx antenna pattern. Assuming free space propagation (i.e., no reflection present), we can calculate the scattering coefficient in principle as illustrated in Figure 10 as:
where denotes the complex antenna pattern of i-th Tx antenna at direction with , denotes the free space propagation coefficient from the i-th Tx antenna to the Rx antenna (which can be calculated directly with known distance between the i-th Tx antenna and the Rx antenna), and denotes the complex antenna pattern of Rx antenna at direction . In the far-field region, we can assume , , and . Typical same antenna designs are employed for the Tx antenna elements. Neglecting the deviations introduced due to manufacture and mutual coupling effects between array elements, we can further assume for . Therefore, in the far-field condition, we have , i.e., the same scattering parameter between the Rx antenna and the n-th Tx antenna element for .
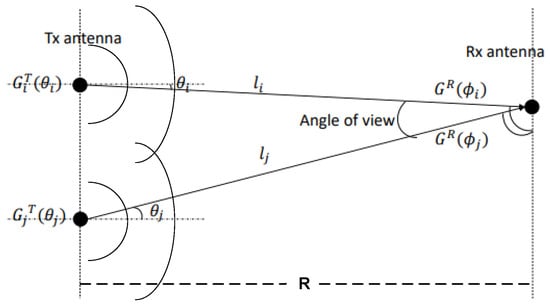
Figure 10.
Illustration of the measurement configuration.
In practice, can be directly obtained based on free space propagation formula for , once the distance between the Rx antenna and the i-th Tx antenna is known. As a part of the measurement system, the Rx antenna’s radiation pattern can be pre-measured and stored as well. In the analysis below, we assume and for , and therefore is directly calculated based on the system geometry configuration. This way to obtain the scattering coefficient for array calibration is highly desirable, since it is applicable for any phased array in principle without on/off operation.
The array calibration results based on the three discussed methods with for obtained via geometry configuration for m are shown in Figure 11 and the deviations with respect to “far-field on/off” calibration are shown in Figure 12. The Fraunhofer far-field distance of the URA at 3.5 GHz is around 15.8 m, which is larger than the physical dimension of the anechoic chamber. Therefore, the initial excitation based on the “far-field on/off” measurements performed at 5.85 m distance cannot be used directly as the reference. We need to calibrate out the propagation coefficients from the Rx antenna to the Tx antennas from the measured on/off data to get the correct initial excitations. Note that the initial excitations among RF branches are calibrated out from the results to ensure fair comparisons.
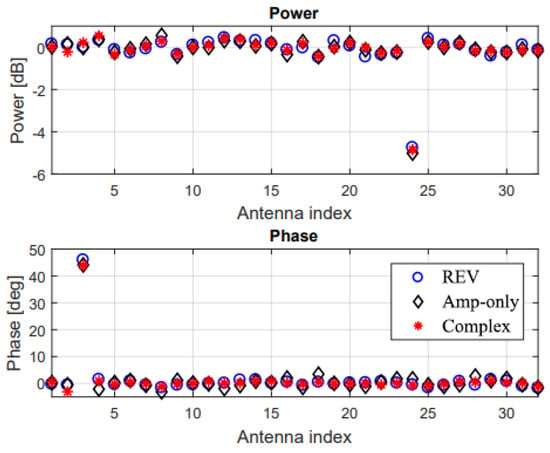
Figure 11.
Array calibration results based on three methods with scattering parameters obtained via geometry configuration ( m).
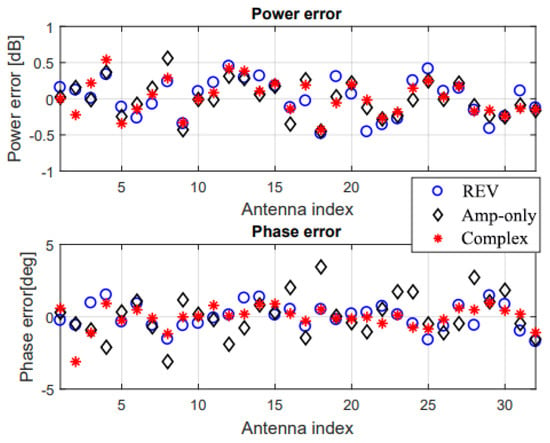
Figure 12.
Array calibration errors based on three methods with scattering parameters obtained via geometry configuration ( m).
We can detect the target phase and amplitude settings in the RF branches with all three methods as shown in Figure 11, where a power deviation up to dB and a phase deviation up to degrees can be observed with the three methods, as shown in Figure 12.
The array calibration results with for obtained via geometry configuration for m are shown in Figure 13 and the errors are shown in Figure 14. We can still roughly detect the target phase and amplitude settings in the RF branches with all three methods as shown in Figure 13, where a power deviation up to dB and a phase deviation up to can be observed with the three methods, as shown in Figure 14. However, the achieved accuracy significantly deteriorated compared to m shown in Figure 11. As discussed, the performance deterioration might be due to:
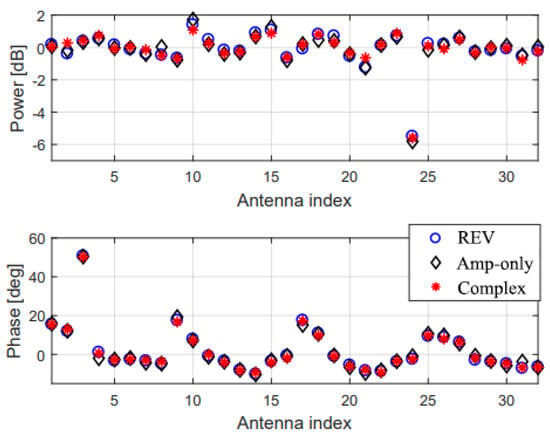
Figure 13.
Array calibration results based on three methods with scattering parameters obtained via geometry configuration ( m).
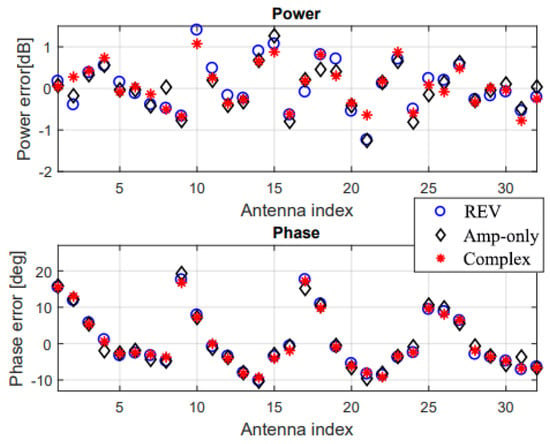
Figure 14.
Array calibration errors based on three methods with scattering parameters obtained via geometry configuration ( m).
- The far-field radiation pattern cannot be used directly in near-field.
- The angle of view of the Rx antenna with m is around , and thus the assumption for might be not valid for . In practice, we can calibrate out the impact of Rx antenna pattern, either based on the measured or simulated antenna patterns.
- The inaccurate positioning of the Rx antenna and Tx array in the measurement setup, which would introduce errors in calculating the propagation coefficient for . In the measurement, the placement of Rx antenna and Tx array was carefully calibrated with the help of lasers.
- The assumption for might be not valid. is limited to at the Tx side with m, indicating a non-negligible phase and amplitude pattern difference. However, this effect cannot be easily tackled, due to the fact that Tx element pattern cannot be easily measured and simulated models might be inaccurate due to coupling in practical configuration.
To further illustrate the impact of antenna patterns in near-field condition, the calibration errors of the URA and URA (which is selected from the center of the URA) are shown in Figure 15. As we can see, the large calibration error, especially the phase error, is mainly introduced by the border elements, which relate to significant phase and gain antenna pattern changes. The comparison of the peak error of the three calibration methods in different measurement distances is summarized in Table 1.
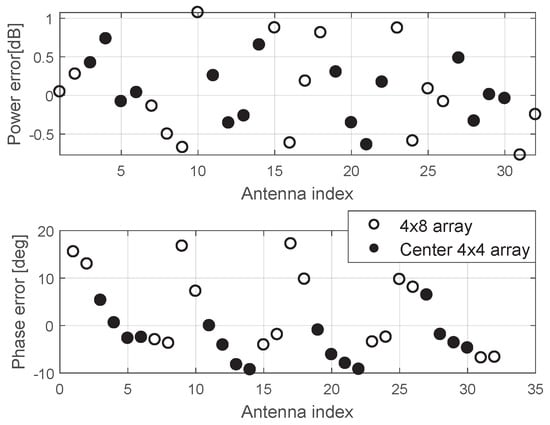
Figure 15.
The calibration errors for the URA and the centered URA with method 3.

Table 1.
The Comparison of The Peak Error of The Three Calibration Methods.
3.4. Measurement Uncertainty Budgets
The calibration uncertainty is introduced by the uncertainty of the measurement procedure and the calibration method. The uncertainty of the measurement procedure mainly comes from the polarization mismatch, installation, test environment, and the amplitude and phase control network. The uncertainties introduced by the polarization mismatch, installation, and test environment are the same in the three methods. However, the uncertainty introduced by the same amplitude and phase control network is related to the calibration method. The uncertainty of the REV method is introduced by the cosine curve recovery. In principle, the curve recovery is preciser with more steps of the phase control for the same cosine curve. In the fast amplitude-only method, only three phase states are used and the amplitude and phase errors introduced by the amplitude and phase control network are multiplied. In the complex amplitude calibration method, the number of measurements depends on the number of the AUT elements. Since the amplitude and phase errors introduced by the amplitude and phase control network are directly mapped to the calibration accuracy, the placement accuracy of the network directly determines the calibration uncertainty. The amplitude and phase of the calibration uncertainty in the three methods are listed in Table 2, where “Control Network” and “Combined” denotes the uncertainty introduced by the amplitude and phase control network and the combined uncertainty introduced by all factors. Different divisors based on the Standard 149-2021 [28] are used in the three calibration methods because of different principles of introducing the calibration uncertainty.

Table 2.
The Comparison of The Standard Uncertainties of The Three Calibration Methods.
4. Conclusions
This paper compares the calibration accuracy of the three calibration methods, i.e., REV, amplitude only method, and complex amplitude calibration method. The measurement results validate the effectiveness of the three algorithms in practice. The REV and complex amplitude calibration method present considerable accuracy, while the amplitude-only method offers worse calibration accuracy. If on/off data are measured in advance, the same calibration accuracy can be achieved in either small or large measurement ranges. The scattering coefficient can be obtained based on the array geometry for large measurement range scenario with good accuracy. However, for small measurement range, the calibration accuracy deteriorates due to near-field effects. In future work, the research will focus on how to improve the array calibration performance in small measurement range when on/off element operation cannot be supported.
Author Contributions
Conceptualization, Z.W. and W.F.; methodology, W.F.; software, X.B.; validation, C.P., Y.Z. and Z.W.; formal analysis, Y.Z. and Y.T.; data curation, F.Z.; writing—original draft preparation, C.P.; writing—review and editing, Y.T. All authors have read and agreed to the published version of the manuscript.
Funding
This research received no external funding.
Data Availability Statement
Data sharing not applicable.
Conflicts of Interest
The authors declare no conflict of interest.
References
- Wang, X.; Li, W.; Chen, V.C. Hand Gesture Recognition Using Radial and Transversal Dual Micro-Motion Features. IEEE Trans. Aerosp. Electron. Syst. 2022, 58, 5963–5973. [Google Scholar] [CrossRef]
- Wang, X.; Zhai, W.; Greco, M.; Gini, F. Cognitive Sparse Beamformer Design in Dynamic Environment via Regularized Switching Network. IEEE Trans. Aerosp. Electron. Syst. 2022, 9, 1–17. [Google Scholar] [CrossRef]
- Lee, J.J.; Ferren, E.M.; Woollen, D.P.; Lee, K.M. Near-field probe used as a diagnostic tool to locate defective elements in an array antenna. IEEE Trans. Antennas Propag. 1988, 6, 884–889. [Google Scholar] [CrossRef]
- Bucci, O.M.; Migliore, M.D.; Panariello, G.; Sgambato, P. Accurate diagnosis of conformal arrays from near-field data using the matrix method. IEEE Trans. Antennas Propag. 2005, 3, 1114–1120. [Google Scholar] [CrossRef]
- Migliore, M.D. A Compressed Sensing Approach for Array Diagnosis from a Small Set of Near-Field Measurements. IEEE Trans. Antennas Propag. 2011, 6, 2127–2133. [Google Scholar] [CrossRef]
- Hansen, T.B.; Yaghjian, A.D. Planar near-field scanning in the time domain. 2. Sampling theorems and computation schemes. IEEE Trans. Antennas Propag. 1994, 9, 1292–1300. [Google Scholar] [CrossRef]
- Zheng, X.; Gao, T.; Chen, X. Mid-field calibration technique of active phased array antennas. In Proceedings of the 2005 Asia-Pacific Microwave Conference Proceedings, Suzhou, China, 4–7 December 2005. 4p. [Google Scholar]
- Davis, D. Analysis of array antenna patterns during test. Microw. J. 1978, 21, 67. [Google Scholar]
- Mano, S.; Katagi, T. A method for measuring amplitude and phase of each radiating element of a phased array antenna. Electron. Commun. Jpn. Part I Commun. 1982, 65, 58–64. [Google Scholar] [CrossRef]
- Sorace, R. Phased array calibration. IEEE Trans. Antennas Propag. 2001, 49, 517–525. [Google Scholar] [CrossRef]
- Takahashi, T.; Konishi, Y.; Makino, S.; Ohmine, H.; Nakaguro, H. Fast measurement technique for phased array calibration. IEEE Trans. Antennas Propag. 2008, 56, 1888–1899. [Google Scholar] [CrossRef]
- Takahashi, T.; Konishi, Y.; Chiba, I. A novel amplitude-only measurement method to determine element fields in phased arrays. IEEE Trans. Antennas Propag. 2012, 60, 3222–3230. [Google Scholar] [CrossRef]
- Keizer, W.P. Fast and accurate array calibration using a synthetic array approach. IEEE Trans. Antennas Propag. 2011, 59, 4115–4122. [Google Scholar] [CrossRef]
- Lee, K.M.; Chu, R.S.; Liu, S.C. A built-in performance-monitoring/fault isolation and correction (PM/FIC) system for active phased-array antennas. IEEE Trans. Antennas Propag. 1993, 41, 1530–1540. [Google Scholar]
- Hampson, G.A.; Smolders, A.B. A fast and accurate scheme for calibration of active phased-array antennas. IEEE Antennas Propag. Soc. Int. Symp. 1999, 2, 1040–1043. [Google Scholar]
- Silverstein, S.D. Application of orthogonal codes to the calibration of active phased array antennas for communication satellites. IEEE Trans. Signal Process. 1997, 45, 206–218. [Google Scholar] [CrossRef]
- Lier, E.; Zemlyansky, M.; Purdy, D.; Farina, D. Phased array calibration and characterization based on orthogonal coding: Theory and experimental validation. IEEE Int. Symp. Phased Array Syst. Technol. 2010, 271–278. [Google Scholar] [CrossRef]
- Long, R.; Ouyang, J.; Yang, F.; Han, W.; Zhou, L. Multi-Element Phased Array Calibration Method by Solving Linear Equations. IEEE Trans. Antennas Propag. 2017, 65, 2931–2939. [Google Scholar] [CrossRef]
- Shipley, C.; Woods, D. Mutual coupling-based calibration of phased array antennas. In Proceedings of the 2000 IEEE International Conference on Phased Array Systems and Technology (Cat. No. 00TH8510), Dana Point, CA, USA, 21–25 May 2000; pp. 529–532. [Google Scholar]
- Gao, T.; Guo, Y.; Wang, J.; Chen, X. Large active phased array antenna calibration using MCM. In Proceedings of the IEEE Antennas and Propagation Society International Symposium. 2001 Digest. Held in conjunction with: USNC/URSI National Radio Science Meeting (Cat. No. 01CH37229), Boston, MA, USA, 8–13 July 2001; pp. 606–609. [Google Scholar]
- Shi, C.; Lu, Z. A Transmission Double-Line for the Calibration System of X-Band Active Phased-Array Antennas. IEEE Trans. Antennas Propag. 2008, 56, 3876–3878. [Google Scholar] [CrossRef]
- Aumann, H.M.; Fenn, A.J.; Willwerth, F.G. Phased array antenna calibration and pattern prediction using mutual coupling measurements. IEEE Trans. Antennas Propag. 1989, 7, 844–850. [Google Scholar] [CrossRef]
- Long, R.; Ouyang, J.; Yang, F.; Zhang, K.; Zhou, L. Calibration method of phased array based on near-field measurement system. In Proceedings of the 2014 IEEE Antennas and Propagation Society International Symposium (APSURSI), Memphis, TN, USA, 6–11 July 2014; Volume 7, pp. 1161–1162. [Google Scholar]
- Pierri, R.; D’Elia, G.; Soldovieri, F. A two probes scanning phaseless near-field far-field transformation technique. IEEE Trans. Antennas Propag. 1999, 5, 792–802. [Google Scholar] [CrossRef]
- Yaccarino, R.G.; Rahmat-Samii, Y. Phaseless bi-polar planar near-field measurements and diagnostics of array antennas. IEEE Trans. Antennas Propag. 1999, 47, 574–583. [Google Scholar] [CrossRef]
- Long, R.; Ouyang, J.; Yang, F.; Han, W.; Zhou, L. Fast Amplitude-Only Measurement Method for Phased Array Calibration. IEEE Trans. Antennas Propag. 2017, 4, 1815–1822. [Google Scholar] [CrossRef]
- Zhang, F.; Fan, W.; Wang, Z.; Zhang, Y.; Pedersen, G.F. Improved Over-the-air Phased Array Calibration Based on Measured Complex Array Signals. IEEE Antennas Wirel. Propag. Lett. 2019, 4, 1174–1178. [Google Scholar] [CrossRef]
- Standard 149-2021; IEEE Recommended Practice for Antenna Measurements. Developed by the Antennas and Propagation Standards Committee of the IEEE Antennas and Propagation Society. IEEE SA Standards Board: Piscataway, NJ, USA, 2021; Volume 9.
Disclaimer/Publisher’s Note: The statements, opinions and data contained in all publications are solely those of the individual author(s) and contributor(s) and not of MDPI and/or the editor(s). MDPI and/or the editor(s) disclaim responsibility for any injury to people or property resulting from any ideas, methods, instructions or products referred to in the content. |
© 2023 by the authors. Licensee MDPI, Basel, Switzerland. This article is an open access article distributed under the terms and conditions of the Creative Commons Attribution (CC BY) license (https://creativecommons.org/licenses/by/4.0/).