Article

Car Full View Dataset: Fine-Grained Predictions of Car Orientation from Images

1
Computer Science Department, National University of Science and Technology POLITEHNICA Bucharest, 060042 Bucharest, Romania
2
R&D Department, FORT S.A., 052034 Bucharest, Romania
3
Management Department, National University of Science and Technology POLITEHNICA Bucharest, 060042 Bucharest, Romania
4
Academy of Romanian Scientists, Str. Ilfov, Nr. 3, 050044 Bucharest, Romania
*
Author to whom correspondence should be addressed.
Electronics 2023, 12(24), 4947; https://doi.org/10.3390/electronics12244947
Submission received: 6 November 2023 / Revised: 1 December 2023 / Accepted: 6 December 2023 / Published: 9 December 2023
(This article belongs to the Special Issue Image and Video Processing Based on Deep Learning)

Abstract

:
The orientation of objects plays an important role in accurate predictions for the tasks of classification, detection, and trajectory estimation. This is especially important in the automotive domain, where estimating an accurate car orientation can significantly impact the effectiveness of the other prediction tasks. This work presents Car Full View (CFV), a novel dataset for car orientation prediction from images obtained by video recording all possible angles of individual vehicles in diverse scenarios. We developed a tool to semi-automatically annotate all the video frames with the respective car angle based on the walking speed of the recorder and manually annotated key angles. The final dataset contains over 23,000 images of individual cars along with fine-grained angle annotations. We study the performance of three state-of-the-art deep learning architectures on this dataset in three different learning settings: classification, regression, and multi-objective. The top result of 3.39° in circular mean absolute error (CMAE) shows that the model accurately predicts car orientations for unseen vehicles and images. Furthermore, we test the trained models on images from two different datasets and show their generalization capability to realistic images. We release the dataset and the best models while publishing a web service to annotate new images.

1. Introduction

Accurate car orientation prediction is a critical problem in various computer vision (CV) applications, particularly autonomous driving. Understanding the precise angle at which a car is positioned relative to the observer is essential for building intelligent systems capable of making informed decisions in dynamic traffic scenarios. Successful prediction of car orientation can positively impact the performance of tasks such as lane detection, path planning, object detection, and overall safety in autonomous vehicles.
Having the angle information of vehicles in an image can enhance the performance of machine learning (ML) models for many CV tasks. For example, it can be used to refine predictions of detection models by skewing the bounding box according to the car’s angle. The information on orientation can also be used as an additional feature in tracking moving vehicles by predicting the future position as well as searching for similar car angles in consecutive frames. In the case of vehicle classification based on manufacturer and model, knowing the angle of the car is crucial, as some distinctive features can only be seen from certain perspectives. For the segmentation of cars, the orientation encodes information about what parts are visible and need to be delimited.
In addition to improving the predictions of CV models, the angle information of vehicles can be important in deep learning (DL) pipelines. It can filter images based on specific tasks—for example, when working only with images of cars from the front and rear views, all images containing other angles can be removed. The angle annotation can ensure that the training images encompass a diverse range of perspectives, mitigating any potential data imbalance. Moreover, it can be used for training CV models with a curriculum [1] by initially using samples with normal orientations and progressively adding training images with more unusual angles.
Traditional approaches to car orientation prediction rely heavily on handcrafted features and heuristic-based methods, which may not generalize well to complex real-world scenarios. With the advent of deep neural architectures such as convolutional neural networks (CNNs) and vision transformers, a paradigm shift in CV was observed. Deep neural networks have demonstrated noteworthy capabilities in learning complex patterns and representations directly from raw image data, making them the most effective architectures for various vision tasks.
However, DL models require large and diverse datasets for training to achieve optimal performance and generalization. Existing car angle datasets are often limited in their scope, containing only a limited set of angles and lacking diversity observed in real-world scenarios.

Current Study Objective

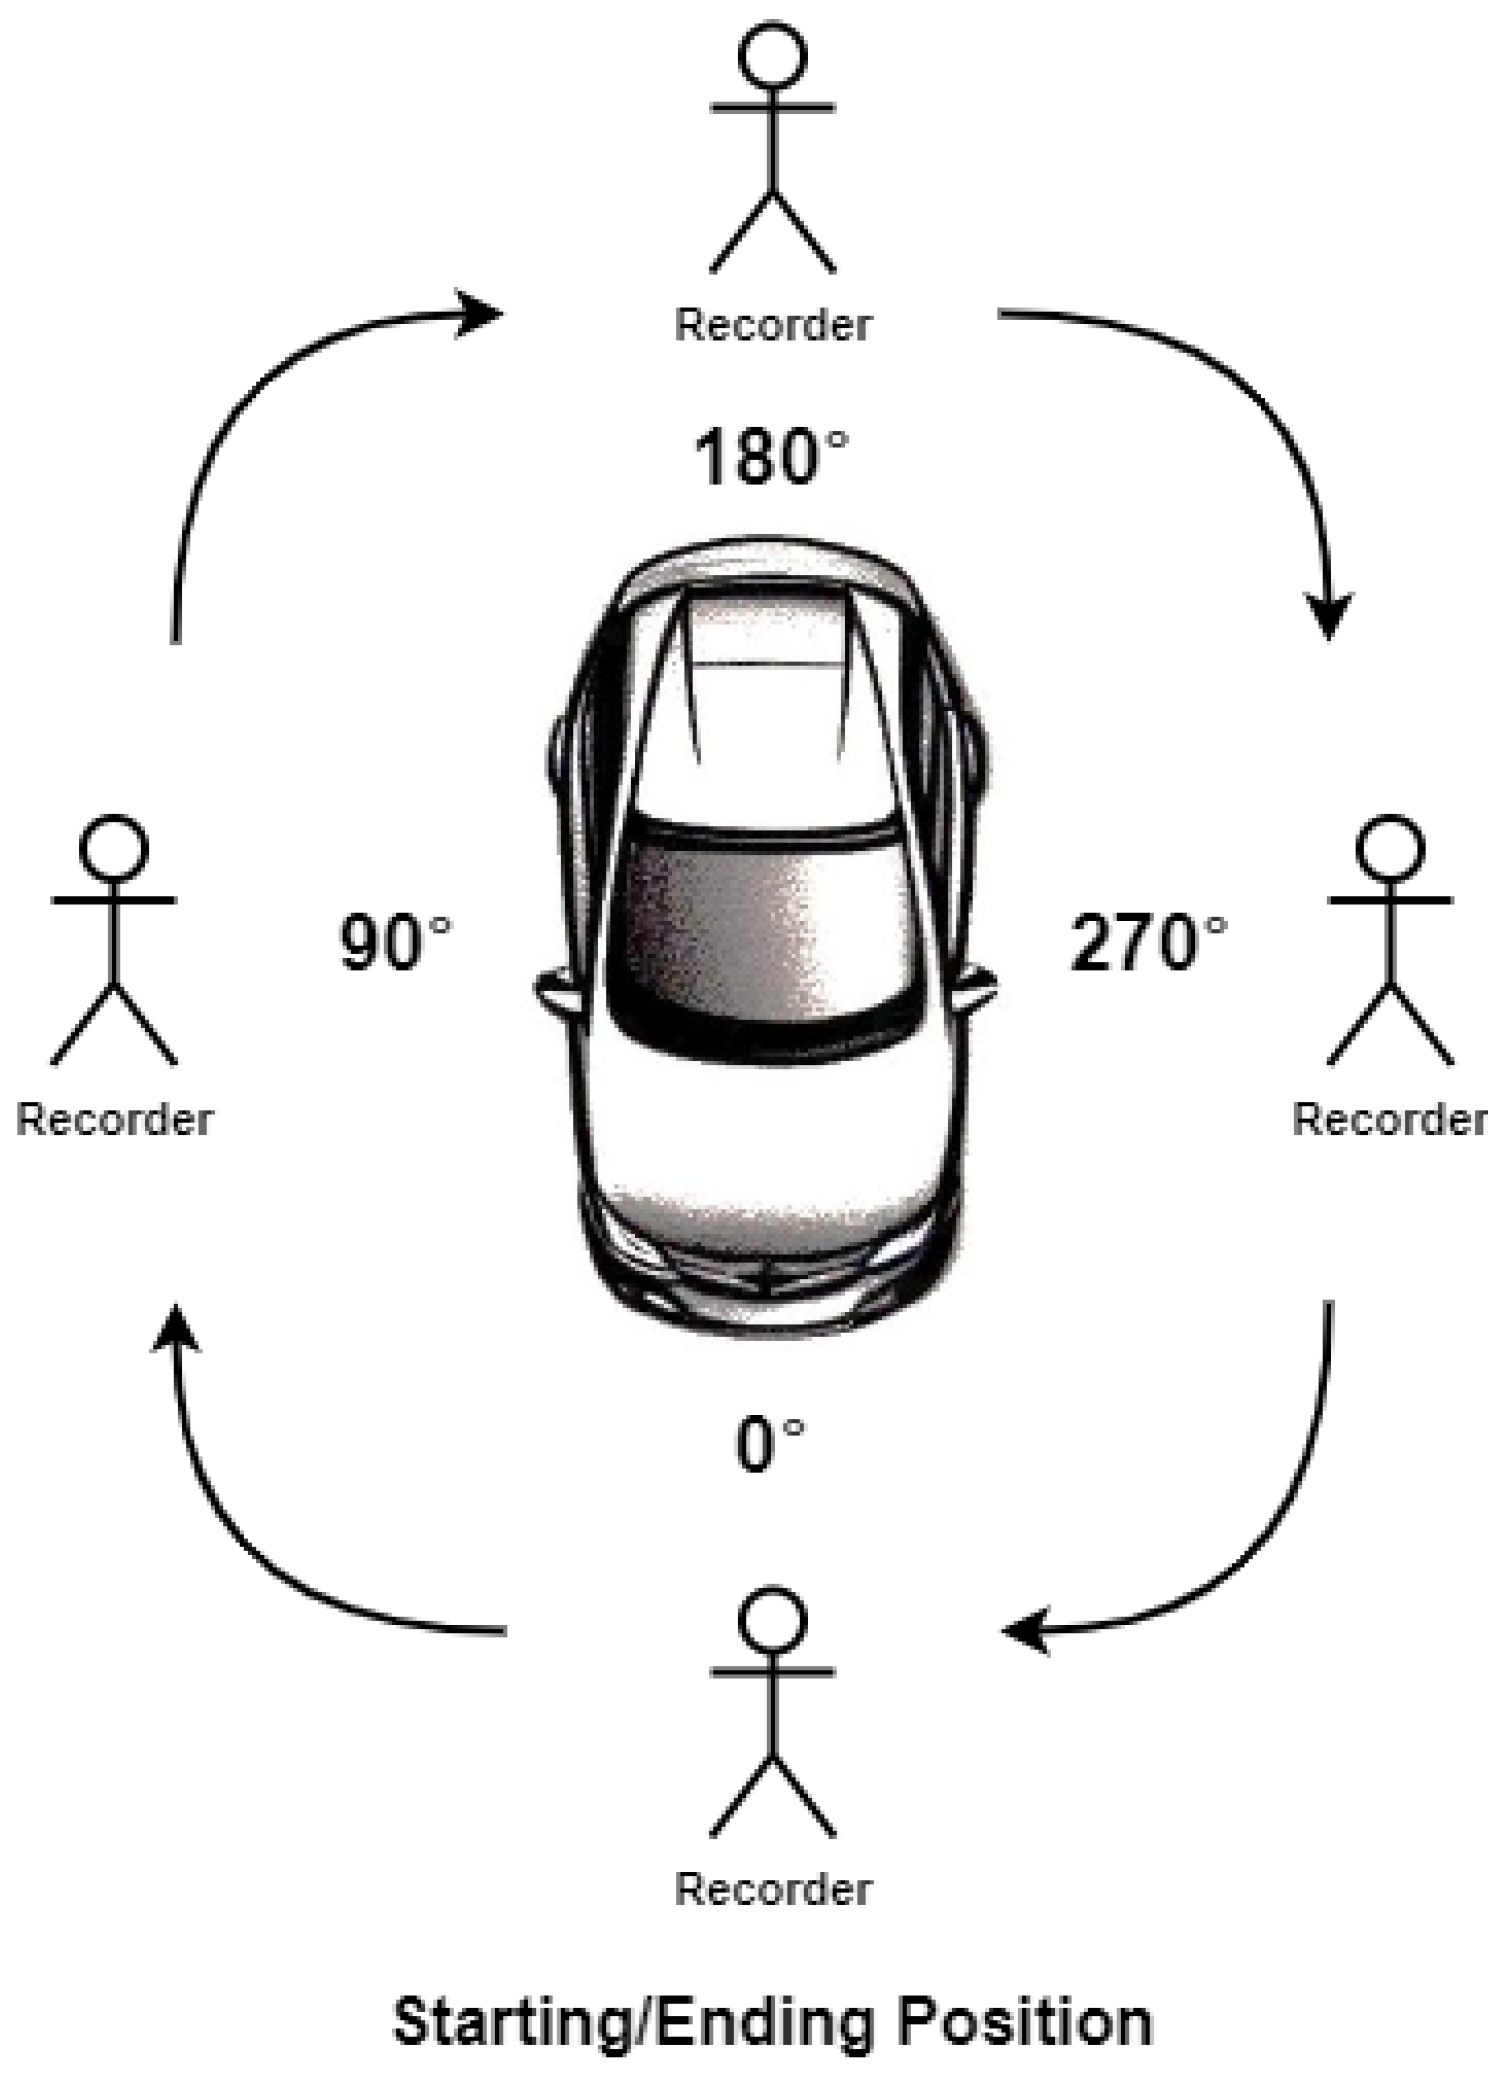
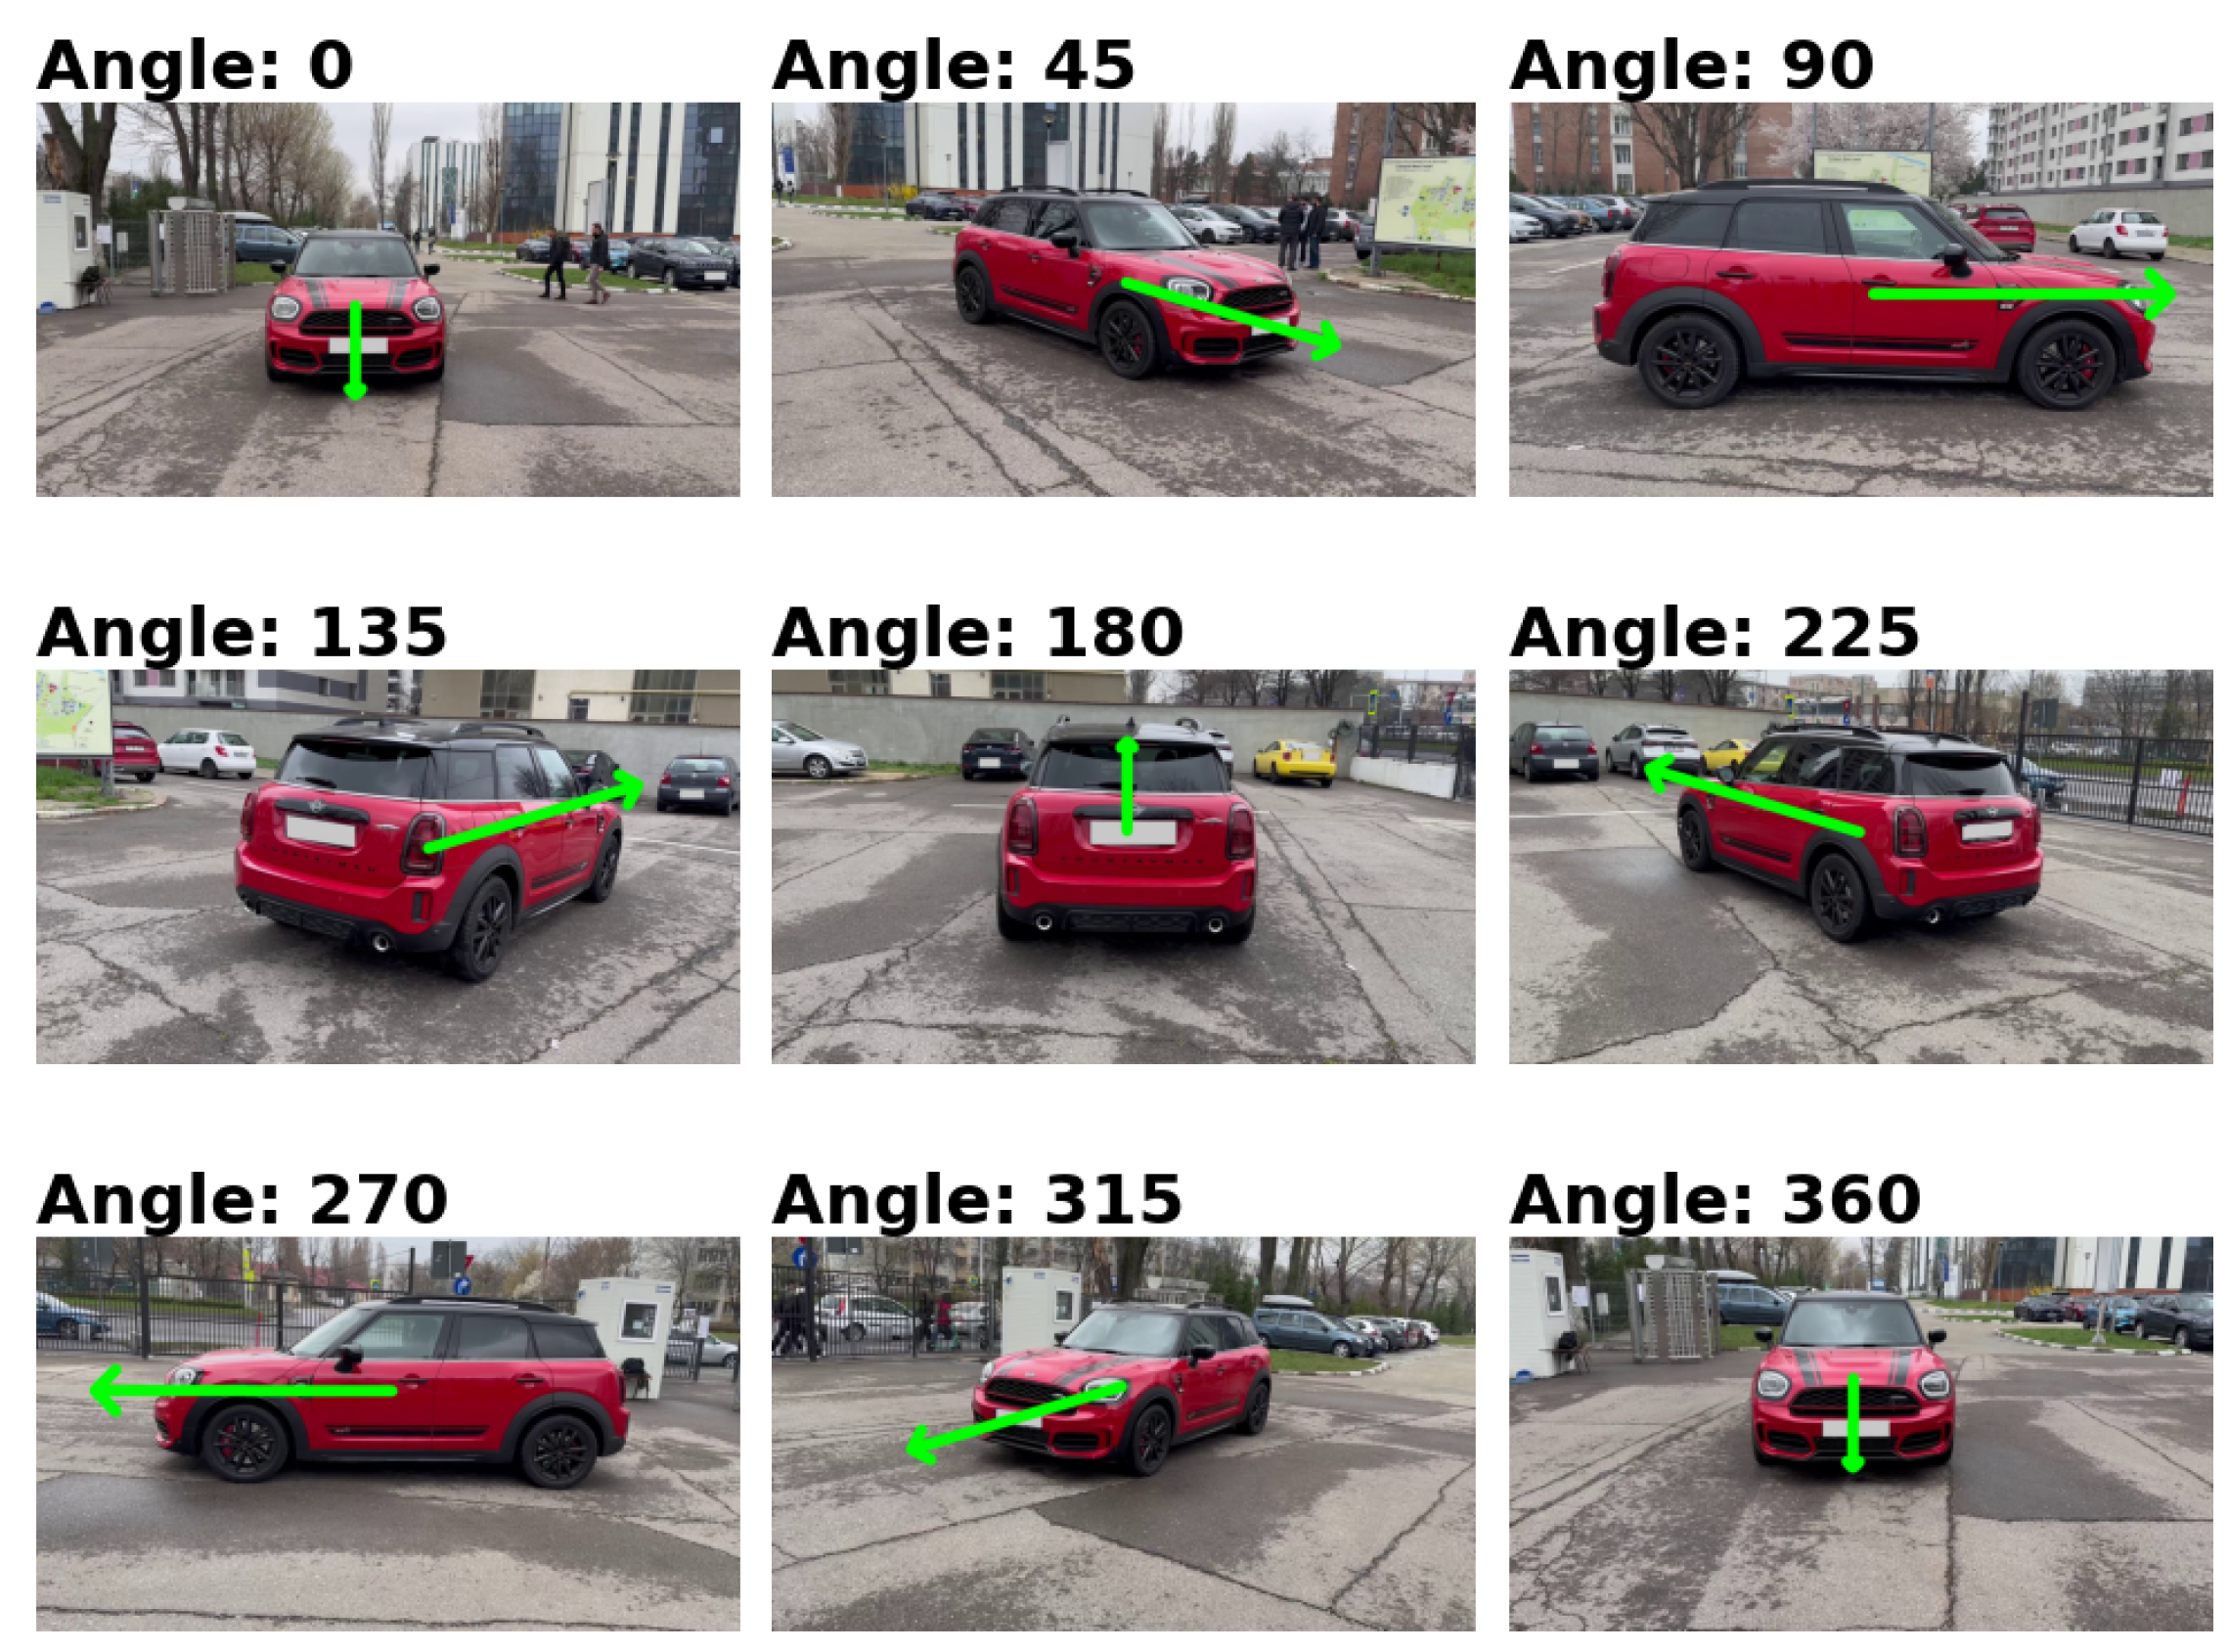
To address the previous limitation of existing datasets that do not specifically tackle car orientation, we introduce the Car Full View (CFV) dataset, a unique and comprehensive collection of images with accurately annotated car angles. Our dataset is meticulously obtained by recording individual cars from all possible angles by circling the vehicle, starting from the front and walking clockwise until returning to the initial position. To ensure diversity and representation of the full range of car orientations, we leverage advanced annotation techniques and proximity-based inference to automatically annotate images in-between the manually annotated angles.
In this work, we introduce the construction and characteristics of our CFV dataset and argue for its utility by training and evaluating a strong baseline of DL models with different backbones (i.e., ResNet [2], ConvNext [3], and Swin Transformer [4]) for car orientation prediction. Through extensive experimentation, we showcase the effectiveness of our dataset in improving model performance and generalization.
The main contributions of our work are as follows:
  • We present the CFV dataset, a novel dataset with fine-grained annotations for the orientation of vehicles in images collected from a wide range of settings.
  • We study the performance of state-of-the-art CV models on the proposed dataset and analyze the importance of training loss, initialization, and training-time augmentation, obtaining a circular mean absolute error of 3.39° and an accuracy of 93.97% with the top-performing architecture.
  • We showcase the importance of having labels for orientation by utilizing them to refine the predicted license plate bounding boxes. Our approach reduces the amount of relevant visual information lost after anonymization.
  • We argue for the effectiveness and generalization capabilities of our proposed dataset by using the top-performing model to annotate images from two different car datasets: Stanford Cars and Autovit.

2. Related Work

Image-based datasets of cars are relatively scarce and often constrained in scale, posing challenges to CV researchers. Collecting diverse and extensive datasets of cars can be challenging due to the complexity of real-world driving scenarios, variations in car models, orientations, and the need for precise annotations. Many researchers have turned to 3D simulations to generate synthetic data for training and testing their algorithms. While 3D simulations have proven valuable for advancing the field, good performance on synthetic data may not translate to good performance in realistic settings. Because of this, there is a need for more comprehensive, real-world image datasets to bridge the gap between simulated and real-world applications, ensuring that CV models can effectively handle the intricacies of actual road environments.
The task of predicting car orientation has been approached from aerial images, a context that can be relevant for traffic monitoring. The EAGLE dataset [5] consists of high-resolution images taken from an aerial view for orientation-informed vehicle detection. It contains 8280 high-resolution images with a total of over 215k vehicle instances. Wang et al. [6] proposed a method for detecting vehicles from unmanned aerial vehicle videos. Their architecture disentangles appearance information from orientation and scale, which makes the predictions robust to such variations. Tang et al. [7] presented an approach that not only detects vehicles from aerial images but also predicts the orientation, which is utilized to refine the bounding boxes. In contrast to these approaches, our dataset is designed for fine-grained orientation estimation from close-up images of vehicles.
The KITTI dataset [8] was constructed with the purpose of advancing autonomous driving research and contains data obtained from a moving vehicle in traffic with multiple sensors such as an RGB camera, LiDAR, and GPS. Based on this data, the authors obtain annotations for multiple tasks such as 3D object detection, 3D tracking, depth estimation, and optical flow. Multiple approaches have been introduced for the task of 3D object detection. Kim et al. [9] utilized a multi-modal approach for predicting the 3D bounding boxes based on both RGB and LiDAR data. Zheng et al. [10] proposed a teacher–student architecture that leveraged the point clouds obtained by the LiDAR sensor to obtain the 3D bounding boxes. Zhang et al. [11] attempted to solve the problem of occluded objects by generating multiple possible ground truths with the help of a variational auto-encoder.
Stanford Cars [12] is a dataset for fine-grained classification of vehicles in terms of make, model, and manufacturing year. The dataset consists of 196 vehicle classes and contains over 16,000 images annotated with the help of crowd-sourcing and majority voting. For the fine-grained classification task on Stanford Cars, multiple methods that achieve high performance have been proposed. Jia et al. [13] utilized a noisy large-scale dataset to pretrain their ALIGN model in a contrastive manner on text and image data and fine-tune the image encoder for classification. Ridnik et al. [14] proposed an attention-based classification head that scales better to a large number of classes than classic approaches while providing good efficiency. Liu et al. [15] proposed a CNN-based approach in which intermediary layers are treated as “experts” specialized in detecting certain discriminative regions. These layers pass on a prediction and an attention map with relevant information to the next layers, enabling more flexibility and creating diversity in the training data with augmentation based on the attention maps.
Dutulescu et al. [16] constructed a dataset for second-hand car price estimation based on one of the largest platforms for selling vehicles in the Romanian market. The dataset contained the text description of the car, vehicle specifications, information about add-ons, images of the car provided by the seller, and the listed price. The authors of the dataset provided a comprehensive study in which they determined the most relevant features for predicting an accurate price of the car. In a subsequent study [17], the authors explored the usage of neural networks for determining the car price and expanded their study to the car market of Germany, constructing a dataset from the mobile.de platform for selling cars. In our study, we utilize the Stanford Cars and Autovit datasets to analyze the performance of our models in scenarios and perspectives that differ from those encountered in the training set.
The nuScenes dataset [18] is a resource for advancing autonomous vehicle technology, offering a comprehensive sensor suite including six cameras, five radars, and one Lidar, providing a 360-degree field of view. It includes 1000 scenes, each with 20 s of data, annotated with 3D bounding boxes for 23 object classes and 8 attributes. With seven times more annotations and 100 times more images than KITTI [8], nuScenes [18] introduced novel 3D detection and tracking metrics, along with dataset analysis and baselines for Lidar and image-based methods. Yin et al. [19] introduced CenterPoint, a 3D object representation and detection framework in point-cloud data. CenterPoint focused on the challenges posed by 3D object orientations and employed a key point-based approach for object center detection. The proposed CenterPoint framework achieves state-of-the-art performance on the nuScenes benchmark for both 3D object detection and tracking. Yang et al. [20] proposed 3DSSD, a lightweight point-based 3D single-stage object detector that departs from prevalent voxel-based methods. Unlike point-based approaches, it eliminates upsampling layers and the refinement stage, opting for a fusion sampling strategy during downsampling for efficient detection of less representative points.
The Audi Autonomous Driving dataset (A2D2) [21] is a dataset that contains both recording of images and 3D point clouds, complemented by a rich array of annotations, including 3D bounding boxes, semantic segmentation, instance segmentation, and data derived from the automotive bus. The sensor suite of A2D2 [21] comprises six cameras and five LiDAR units, providing complete 360-degree coverage and enabling a comprehensive perception of the environment. This dataset encompasses 41,277 frames annotated with semantic segmentation images and point cloud labels. Notably, 12,497 frames within this collection also feature 3D bounding box annotations for objects within the frontal camera’s field of view. Zhang et al. [22] propose PolarNet, a Lidar-specific segmentation algorithm that distinguishes itself by employing a unique polar bird’s-eye-view representation. This representation efficiently balanced points across grid cells in a polar coordinate system, aligning the segmentation network’s attention with the challenging long-tailed distribution of points along the radial axis. Zhang et al. [23] introduced a multimodal fusion method designed to assess the contributions of different feature channels from sensors, particularly in the context of Lidar camera fusion networks. This method incorporated a channel attention module that enhanced cross-channel local interaction and assigned weights to feature channels, representing their contributions.
ApolloScape [24] is a dataset for autonomous driving research, addressing the need for large-scale data to train and evaluate perception models. It includes rich annotations, including semantic dense point clouds, semantic labeling, instance segmentation, and accurate location data across diverse driving scenarios. ApolloScape supports the development of algorithms that jointly consider multiple tasks, fostering advancements in multi-sensor fusion and multi-task learning in CV. It facilitates sensor fusion by integrating camera videos, GPS/IMU data, and a 3D semantic map, enhancing self-localization and semantic segmentation for autonomous driving. Li et al. [25] addressed the critical issue of ensuring the safety of autonomous driving cars by focusing on motion prediction, a core function of such vehicles. The authors previously introduced GRIP [26], a scheme designed for efficient trajectory prediction of traffic agents near autonomous cars, significantly improving prediction accuracy compared to state-of-the-art solutions. Chandra et al. [27] introduced an innovative approach to traffic forecasting in urban scenarios, combining spectral graph analysis with DL. Their model predicted both low-level information (future trajectories) and high-level information (road-agent behavior) using the trajectory data of each road agent.

3. Method

3.1. Dataset Development

3.1.1. Data Colection

Our CFV dataset was obtained by recording a series of videos using smartphone cameras positioned at a natural angle for the recorder. In order to record videos of different cars, we requested the help of volunteers. All participants recorded their vehicles and provided informed consent for publishing the anonymized images of their cars.
The high-level overview of the dataset collection procedure is shown in Figure 1. Participants were asked to make a video recording of their stationary vehicle by starting from the front of the car (0°) at about 3 m away and circling the vehicle clockwise while maintaining a consistent distance. While moving around the car, the camera was slightly angled so that the automobile was always in the center of the frame. Moreover, the whole car needed to be visible in all frames. The video ended when the camera reached the starting point in front of the car.
A video recording of an individual car takes approximately 1 to 2 min. All videos were taken in the clockwise direction. As there was no constraint with respect to the location of the videos, the dataset contains a wide range of realistic settings, such as outdoor environments and diverse lighting conditions. Most videos have around 2000–3000 frames, translating to a sufficient number of images for each angle value.

3.1.2. Data Annotation

We consider the front view of the car to be the 0° angle and the direction of the next angles to be counter-clockwise. The order of the key angles is shown in Figure 2.
We employed an internally developed semi-automatic annotation tool to annotate the CFV dataset. This involved a manual annotation process for identifying the frames which contain the car in the key angles (0°, 45°, 90°, 135°, 180°, 225°, 270°, 315°) shown in Figure 2. For each video, the tool offers candidate frames for the key angles based on the number of images in the recording. The annotators manually verify these candidate frames. The annotator can confirm that the candidate frame contains the car with the correct orientation or manually select another frame. This manual process of identifying the frames containing the key angles by verifying candidates takes approximately 1 min per video.
To annotate the remaining frames in the videos, we utilized a proximity-based inference technique that does not require any manual labeling. For each video frame that does not contain the car in any of the key angles, the tool identifies the closest key angle frames. This computation is performed based on the index of the current frame and the already established indices of the key angle frames. The angle of the current frame is calculated as a weighted average of the neighboring key angles, where the weights are determined based on proximity. A key angle closer to the current frame has a larger weight value. The proximity is determined based on the number of video frames in-between the current frame and the key angle frame.
In total, we collected 66 video recordings of different vehicles from which we obtained over 180,000 angle-annotated images. These images are captured in diverse settings and showcase all possible vehicle orientations, making them suitable for training DL architectures for tasks in the real world. Figure A1 in Appendix A shows samples of the proposed dataset along with their labels in a tabular format. The diversity of the CFV dataset is showcased in Figure 3. The proposed dataset contains all car orientations and is diverse in terms of car models, backgrounds, and lighting conditions.
Having a small number of unique vehicles in the dataset can lead to overfitting when training the CV model. This means that the trained orientation architecture can predict the angle only of similar cars. For this reason, it is important to have diversity in terms of car models. Figure 4 showcases the distribution of the CFV dataset in terms of the recorded cars. Since each video contains a different vehicle and there is a total of 49 unique car models, the CFV dataset has strong generalization capabilities to other car models.
Figure 5 and Figure 6 show that some videos and orientations have a larger weight in the final dataset as they appear more frequently. To achieve a balanced dataset in terms of images per individual cars and images per angle, we keep only 1 image for each angle degree of every car. For this, we keep every frame closest to a whole degree angle and round its angle annotation value to the closest whole degree. The resulting dataset contains 360 images (corresponding to 360-degree values from 0° to 359°) for each video. The final dataset has 23,760 images.

3.1.3. Data Anonymization

To anonymize the dataset, we remove the license plate in every image in an automatic manner. We utilize a YOLOv5 detection model [28] trained specifically to detect the bounding boxes of license plates. However, the bounding box prediction consists of 2 coordinates describing the top left and bottom right corners. Because of this, the bounding box is oriented horizontally and remains fixed in relation to the car’s rotation. This is a problem as a large portion of the bounding box does not contain the license plate, but meaningful visual information.
In order to solve this problem, we leverage car angle annotations, highlighting another benefit of having orientation information. Having all 4 coordinates of the horizontally oriented bounding box, we have 2 distinct cases: for the first and third quadrants (0°–90°, 180°–270°), the y coordinate of the top left corner is increased, whereas the y coordinate of the bottom right corner is decreased as the license plate is diagonal; in the second and fourth quadrants (90°–180°, 270°–360°), the y coordinate of the bottom left corner is increased, and the top right corner is decreased. The offset value by which these coordinates are increased and decreased is calculated as:
o f f s e t = α H a n g l e if a n g l e < 90 ° α H ( 180 ° a n g l e ) if 90 ° < a n g l e < 180 ° α H ( a n g l e 180 ° ) if 180 ° < a n g l e < 270 ° α H ( 360 ° a n g l e ) if 270 ° < a n g l e < 360 °
where H is the height of the license plate bounding box and α is an empirically determined constant equal to 135.
Figure 7 displays the improvement brought by our proposed angle-based refinement technique to the license plate bounding box predictions. The green box shows the coarse detections made by the license plate detection model. The filled-in white rectangle represents the final bounding box of the license plate. Our method of refining the bounding box based on the car angle significantly decreases the lost visual information. These results highlight the importance of having orientation data. Without it, an additional DL model for segmentation [29,30] or a more resource-intensive algorithm such as GrabCut [31] is required.
Based on our analysis, the detection model is unable to consistently find the license plates in frames where the car is seen from a diagonal angle. This happens most frequently between the following angles: 55°–65°, 115°–125°, 235°–245°, 295°–305°. Moreover, other cars than the main one could exist in the video frame. As such, finding the predictions that do not correspond to the main car is not trivial.
We automatically flag video frames that potentially do not have a license plate prediction for the main car by leveraging angle annotations and an additional detection model. We utilize a separate YOLOv7 architecture [32] trained for common objects detection on MSCOCO [33] to obtain the bounding box of the full car. The frames in which this model found no car are automatically flagged. Furthermore, frames with no detected license plate bounding box inside the car bounding box are automatically flagged except for the frames with car angle annotations between 75°–105° and 255°–285°; these ranges denote side views where the license plate should not be visible. All flagged frames were manually verified and corrected.

3.2. Neural Architectures

For the task of car orientation prediction, we experimented with multiple neural network architectures that are designed to process images: ResNet [2], ConvNeXt [3], and Swin Transformer [4]. We considered both random initialization of these models as well as weights pretrained on ImageNet [34]. We study 3 possible approaches to the problem of car orientation, namely a classification problem, a regression task, and a combination of both.

3.2.1. Orientation as a Classification Task

In order to treat the prediction of orientation as a classification task, we construct 8 different classes based on the fine-grained angle annotations. The classes are as follows: Front (337.5°–22.5°), Front-Right (22.5°–67.5°), Right (67.5°–112.5°), Back-Right (112.5°–157.5°), Back (157.5°–202.5°), Back-Left (202.5°–247.5°), Left (247.5°–292.5°), Front-Left (292.5°–337.5°). The 3 architectures are modified to output an 8-dimensional vector consisting of the class logits.
As an evaluation metric, we utilize the accuracy as the dataset is balanced in terms of samples per class. We employ the cross-entropy loss calculated as follows:
L C E = c = 1 M y c log ( p c )
where M is equal to the number of classes, y c is equal to 1 if the current sample has the class c and 0 otherwise, and p c is the predicted probability for class c.

3.2.2. Orientation as a Regression Task

We consider the car orientation prediction as a regression task by utilizing the raw angle values. For evaluation, we considered a mean angular error (MAE) metric for which the angular values are circular since 0° and 360° values are equal. For example, the absolute difference between the values of 1° and 359° is equal to 2°, and not 358°. We refer to this metric as circular mean absolute error (CMAE).
All architectures are modified to output a single number, which is normalized to have values between 0 and 1 with the help of a sigmoid activation. In order to obtain the result in degrees, the output value is multiplied by 360. To compute the CMAE metric, the difference is calculated in the radians domain, after which it is converted back into degrees. The CMAE is used as both training loss for the training data and evaluation metric for the testing samples. CMAE loss can be formulated as:
L C M A E = a t a n 2 ( s i n ( a a ^ ) , c o s ( a a ^ ) )
where a is the ground truth angle in radians, a ^ is the angle prediction in radians, and a t a n 2 is the arctangent operation with consideration of the quadrant.
We study the effect of 2 different types of augmentations: (a) weak augmentations in the form of random crops with the addition of color jittering, and (b) a custom version of RandAugment [35] that does not use any rotation-based transforms. In order to observe their increase in performance, we compare them against the case where no augmentation is utilized during training. Aside from the different types of augmentation, we utilize the same training hyperparameters used for the classification architectures.

3.2.3. Orientation as a Multi-Task

To improve the results of the previous two approaches, we train the network for both classification and regression at the same time. The 3 model variants are modified to first output the class prediction in the form of an 8-dimensional vector consisting of the probability values for each class. The class probability distribution and the extracted features are given as input to a linear layer for a fine-grained prediction of the angle. This approach has the advantage that the model first needs to make a coarse prediction in the form of a general orientation and then refine it to a numeric value.
In terms of augmentation, we only employ the weak augmentation setting as it obtains the best results by introducing sample diversity without adding too much noise. The loss employed for training is a combination of the losses from Equations (2) and (3), formulated as:
L C o m b i n e d = α L C E + L C M A E
where α is chosen to balance both losses and give more importance to the regression task.

3.3. Experimental Setup

We split the data into a training set consisting of 80% of the dataset and the testing set, which contains the rest of the images. The images in the testing set show different vehicles than those in the training set.
We train the deep learning models with the AdamW optimizer [36] and a step learning rate schedule that starts from a value of 0.0005 and is decreased by a multiplicative decay factor of 0.95 every 10 epochs for a total of 100 training epochs. We utilize images with a resolution of 224 × 224 and a batch size of 512. These hyperparameters were obtained as a result of a Bayesian hyperparameter optimization process using the wandb library. A total training time takes approximately 30 min for ResNet-based models, 60 min for ConvNeXt-based models, and 70 min for Swin-based models. All ResNet-based models utilize a ResNet-18 backbone, while the ConvNeXt-based and Swin-based models employ a small version of the architectures. We utilized an NVIDIA A100 with 80 GB of VRAM for all our experiments.

4. Results

This section presents quantitative and qualitative results for the proposed models on the test set of the CFV dataset. We present the results for the classification approach, regression approach, and finally for multi-task setting.
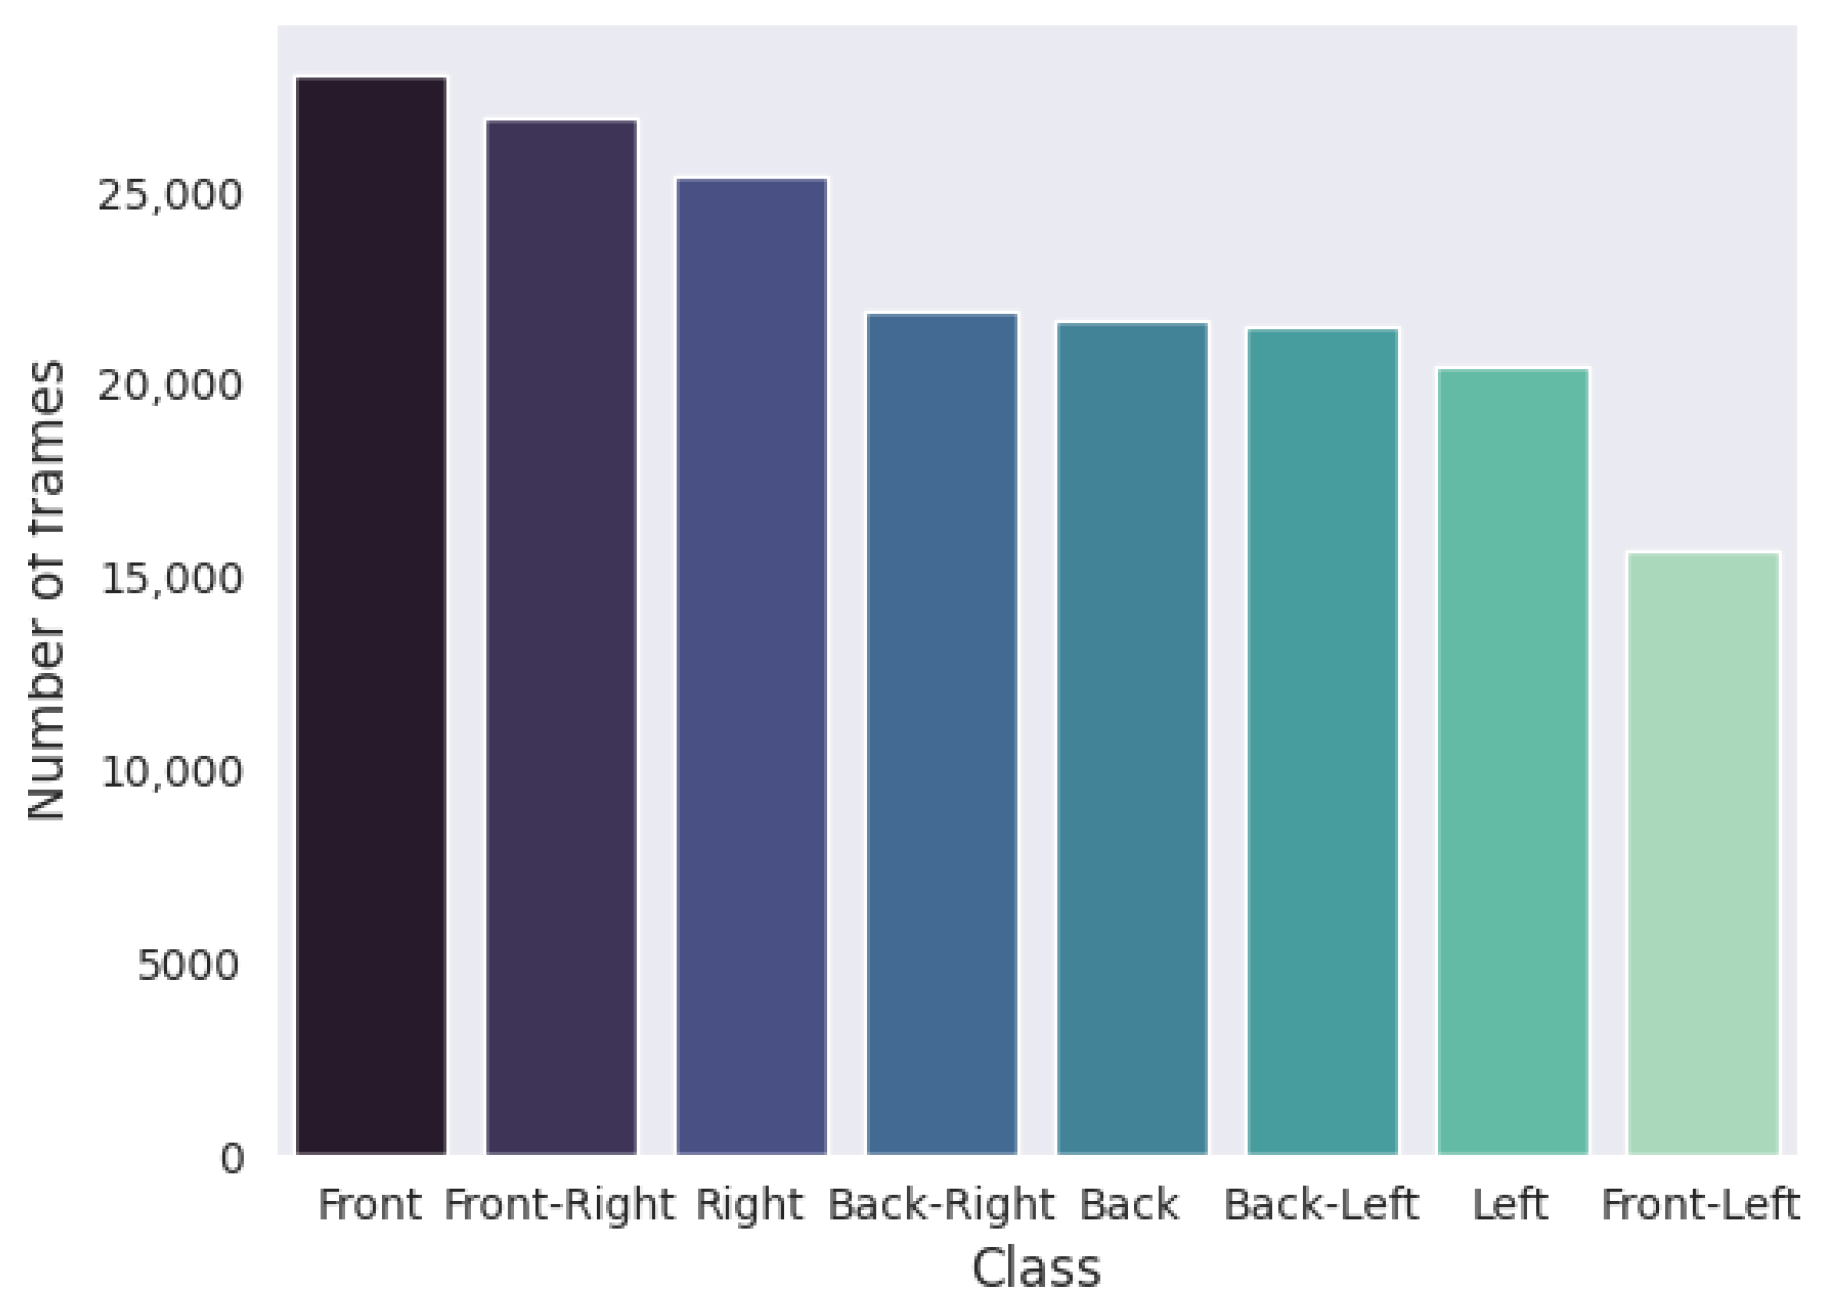
Table 1 shows the results of the classification models in terms of accuracy for orientation prediction based on the 8 defined classes. The ConvNeXt architecture overfits and cannot capture meaningful features when initialized randomly due to its extensive parameter count in relation to the limited training samples. In the case of weights pretrained on ImageNet, all architectures improve classification accuracy as opposed to random initialization, showing that the learned features extracted by early and intermediary layers are relevant to the prediction of orientation. ResNet obtains the highest classification accuracy in the random initialization scenario as it has the lowest amount of trainable parameters, making it more likely to fit the data. The ResNet and ConvNeXt models obtain the highest accuracy when fine-tuned from pretrained weights, proving that a convolutional backbone is more effective for this classification task.
Table 2 shows the experimental results of the regression architectures for car orientation estimation from images. The ConvNeXt architecture with weak augmentations obtains the smallest circular mean absolute error of 3.58°. For random initialization, we only show the results of the ResNet as it was the only model among the three capable of learning and not overfitting due to its smaller size. For the ConvNeXt and Swin Transformer, we only show the results of the models when starting from pretrained weights because they would require a larger amount of training data to be trained in the random initialization scenario.
The results argue that incorporating augmentation in the training process improves the overall performance of the models on new samples. The weak augmentation setting obtains better results than the custom version of RandAugment for all the regression models. This probably happens because the RandAugment algorithm introduces too much noise to the training samples which makes the model learn a slightly different distribution of the data. In contrast, the weak augmentation setting achieves a balance between introducing diversity in the training samples and avoiding excessive noise that might alter the true data distribution. The top performance obtained by the ConvNeXt model is to be expected since the architecture is an upgraded version of the ResNet model with more efficient modules. Furthermore, convolutional networks usually require less training data than vision transformers to generalize [37], which explains why the ConvNeXt model outperforms the Swin Transformer.
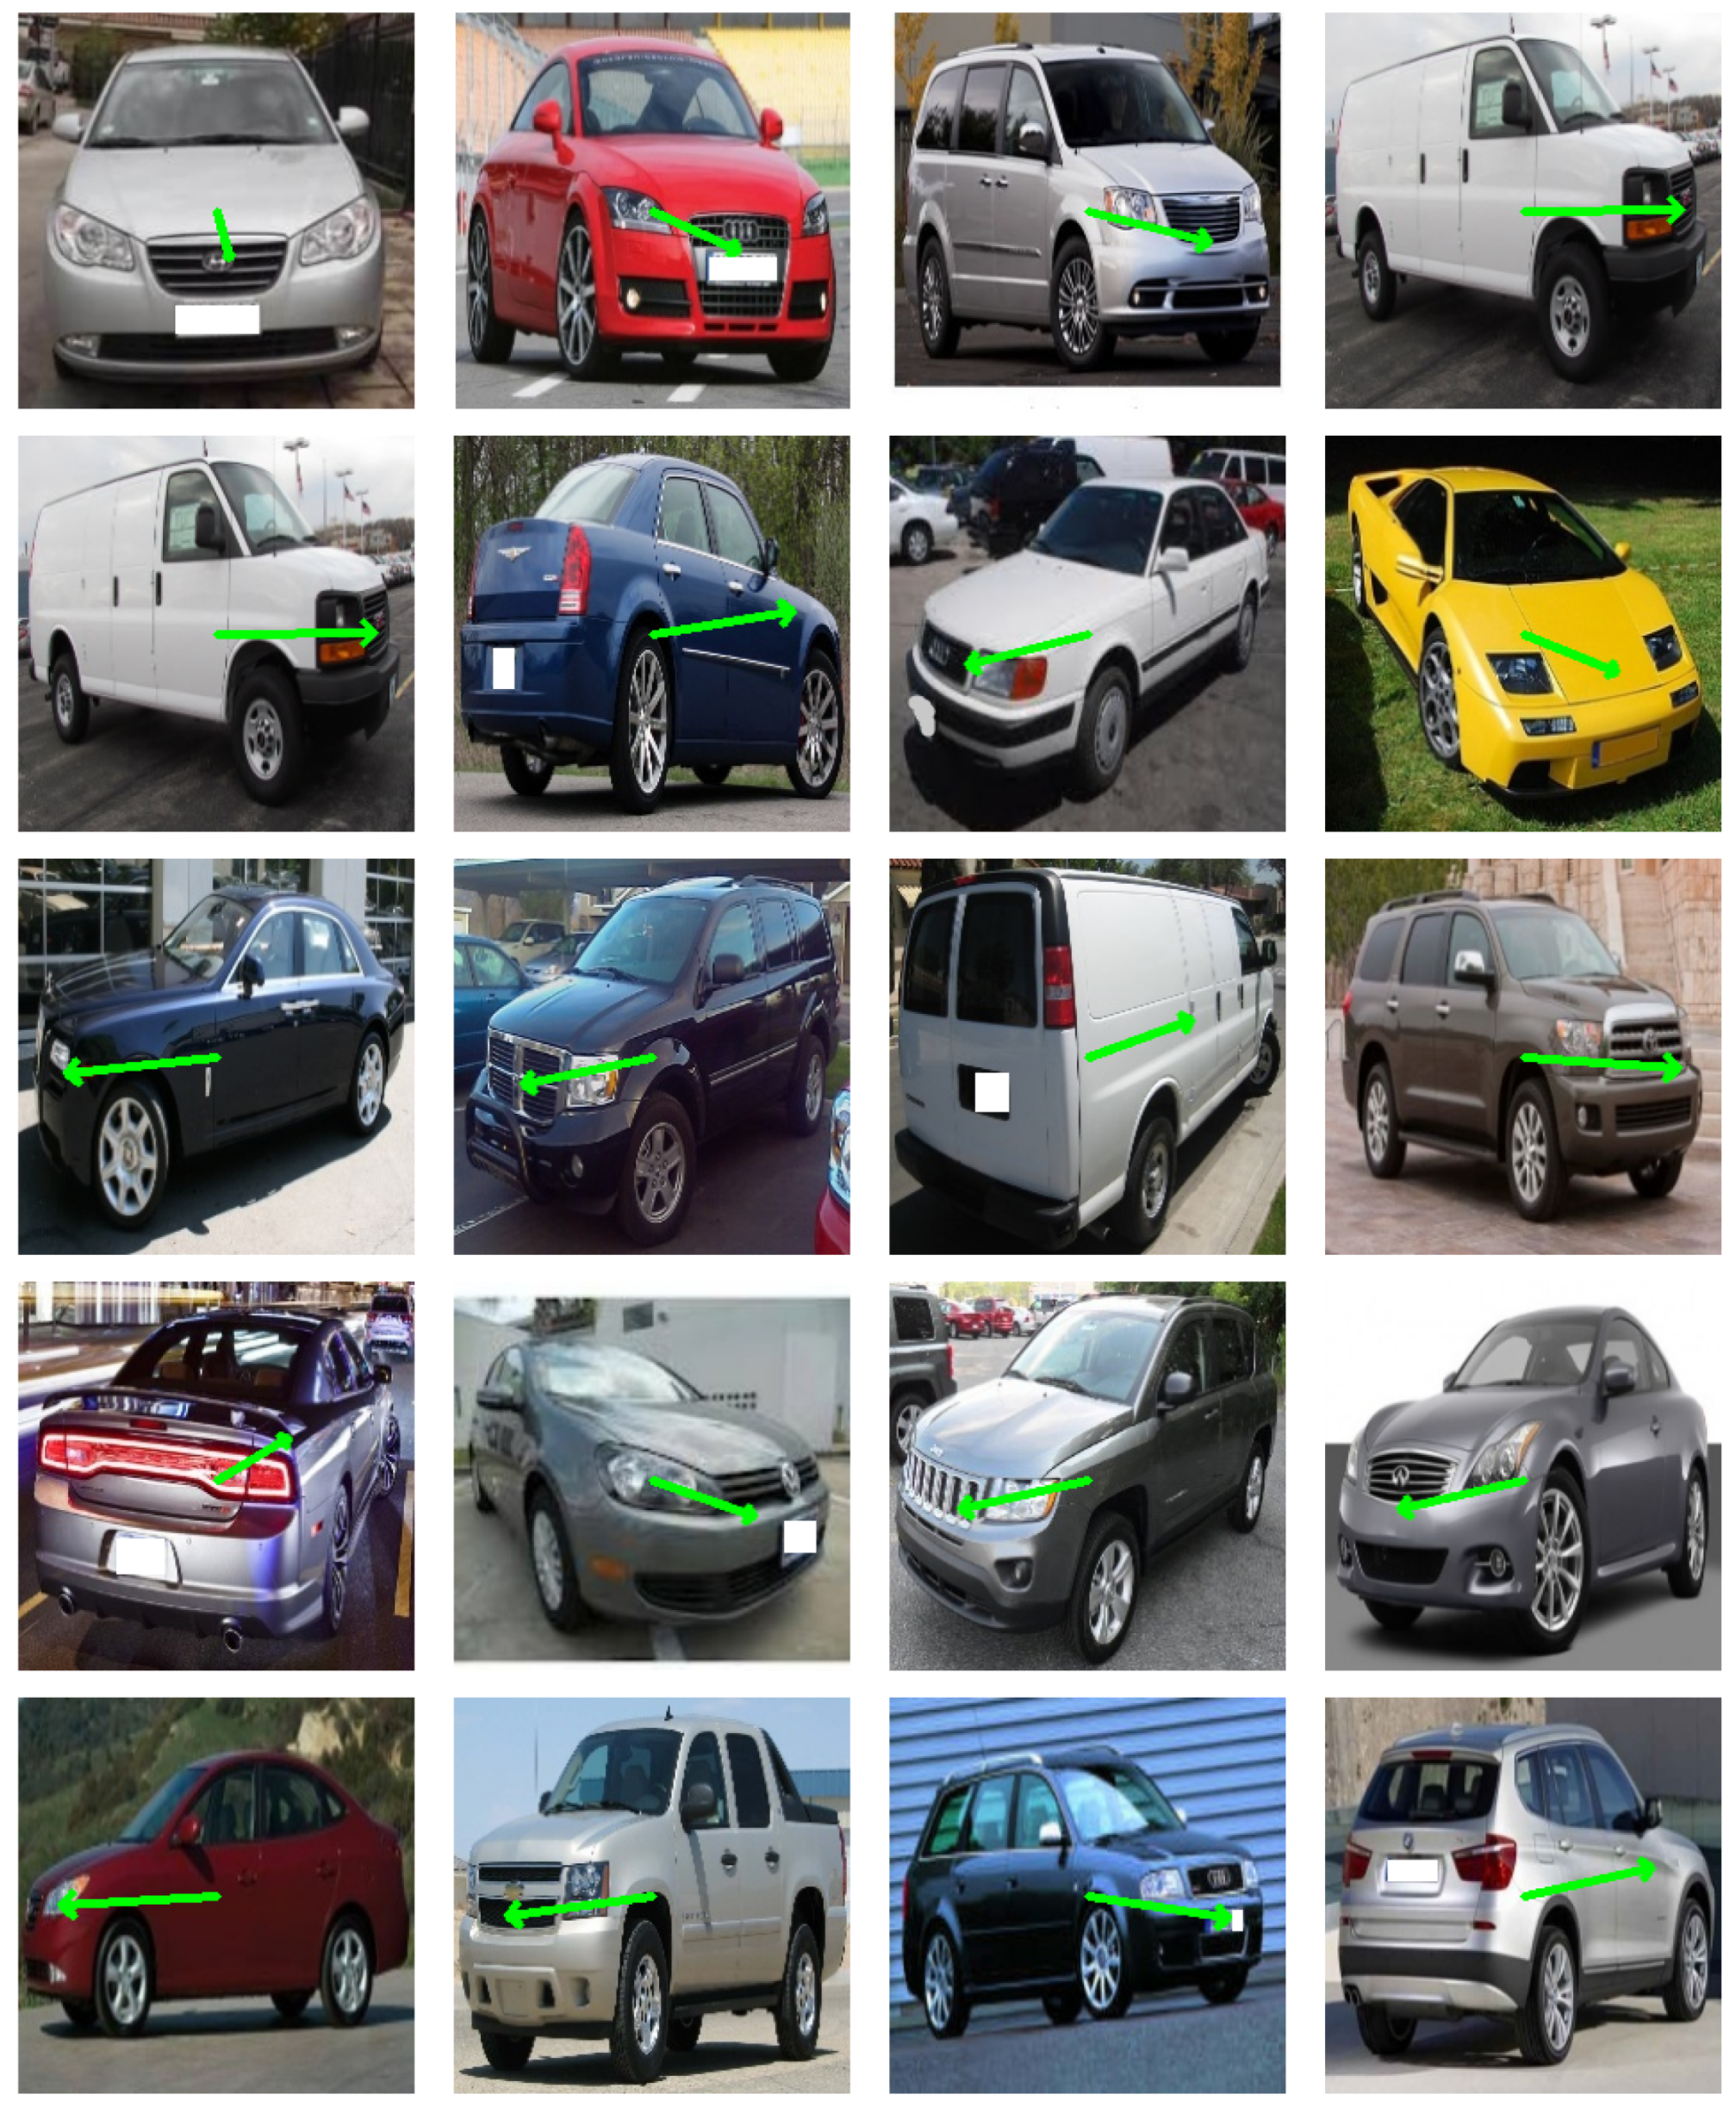
Figure 8 shows example predictions from the top-performing model in our experiments on the testing set. The trained model manages to generalize to cars that were not seen in the training set and makes predictions very close to the ground truth. For certain cases where the label is slightly incorrect, it even makes better predictions.
Table 3 shows the results of the three models trained with multi-task learning for car angle prediction. In the case of random initialization, only the ResNet architecture manages to learn relevant features and does not overfit. However, none of the models obtained a better performance for this initialization setting than in the case of single-task learning. This probably happens because of the difficulty of the task combined with the relatively small number of samples in comparison to the number of trainable parameters of the model. For initialization with ImageNet pretrained weights, the accuracy shows a slight improvement for all models in comparison to the single-task setting. Furthermore, the CMAE metric is improved compared to the exclusive regression task for all models in the case of fine-tuning pretrained weights. The ConvNeXt model obtains the top result with a CMAE value of 3.39°, which surpasses the previous best model by 0.19°.

5. Discussion

This section starts with a comparison of our dataset to other existing datasets introduced in the Related Work section. Next, we perform an analysis of our top-performing model trained for orientation prediction and discuss its limitations when considering test samples with the highest errors. Afterward, we study the performance of our top-performing model on images from different datasets that contain images of cars from more unusual perspectives. We showcase a real-world application of the orientation model by refining bounding box predictions of license plates based on the estimated car angle. Finally, we explore the reasons behind the predictions, arguing that the model takes global information into account and does not focus on local visual features.

5.1. Comparison to Existing Datasets

Table 4 compares the proposed CFV dataset with other vehicle image datasets. In contrast to the EAGLE dataset, which provides aerial images of vehicles, the CFV dataset is composed of images of cars taken from a close distance. The tasks of 3D detection and trajectory estimation are closely linked with the task of predicting the orientation of vehicles from images. However, while KITTI, nuScenes, A2D2, and ApolloScape focus on the diversity of objects and environments, our proposed dataset focuses on the diversity of angles, providing the full range of possible car orientations.

5.2. Limitations

We investigate the test images in which the orientation model makes the largest error compared to the ground truth. 
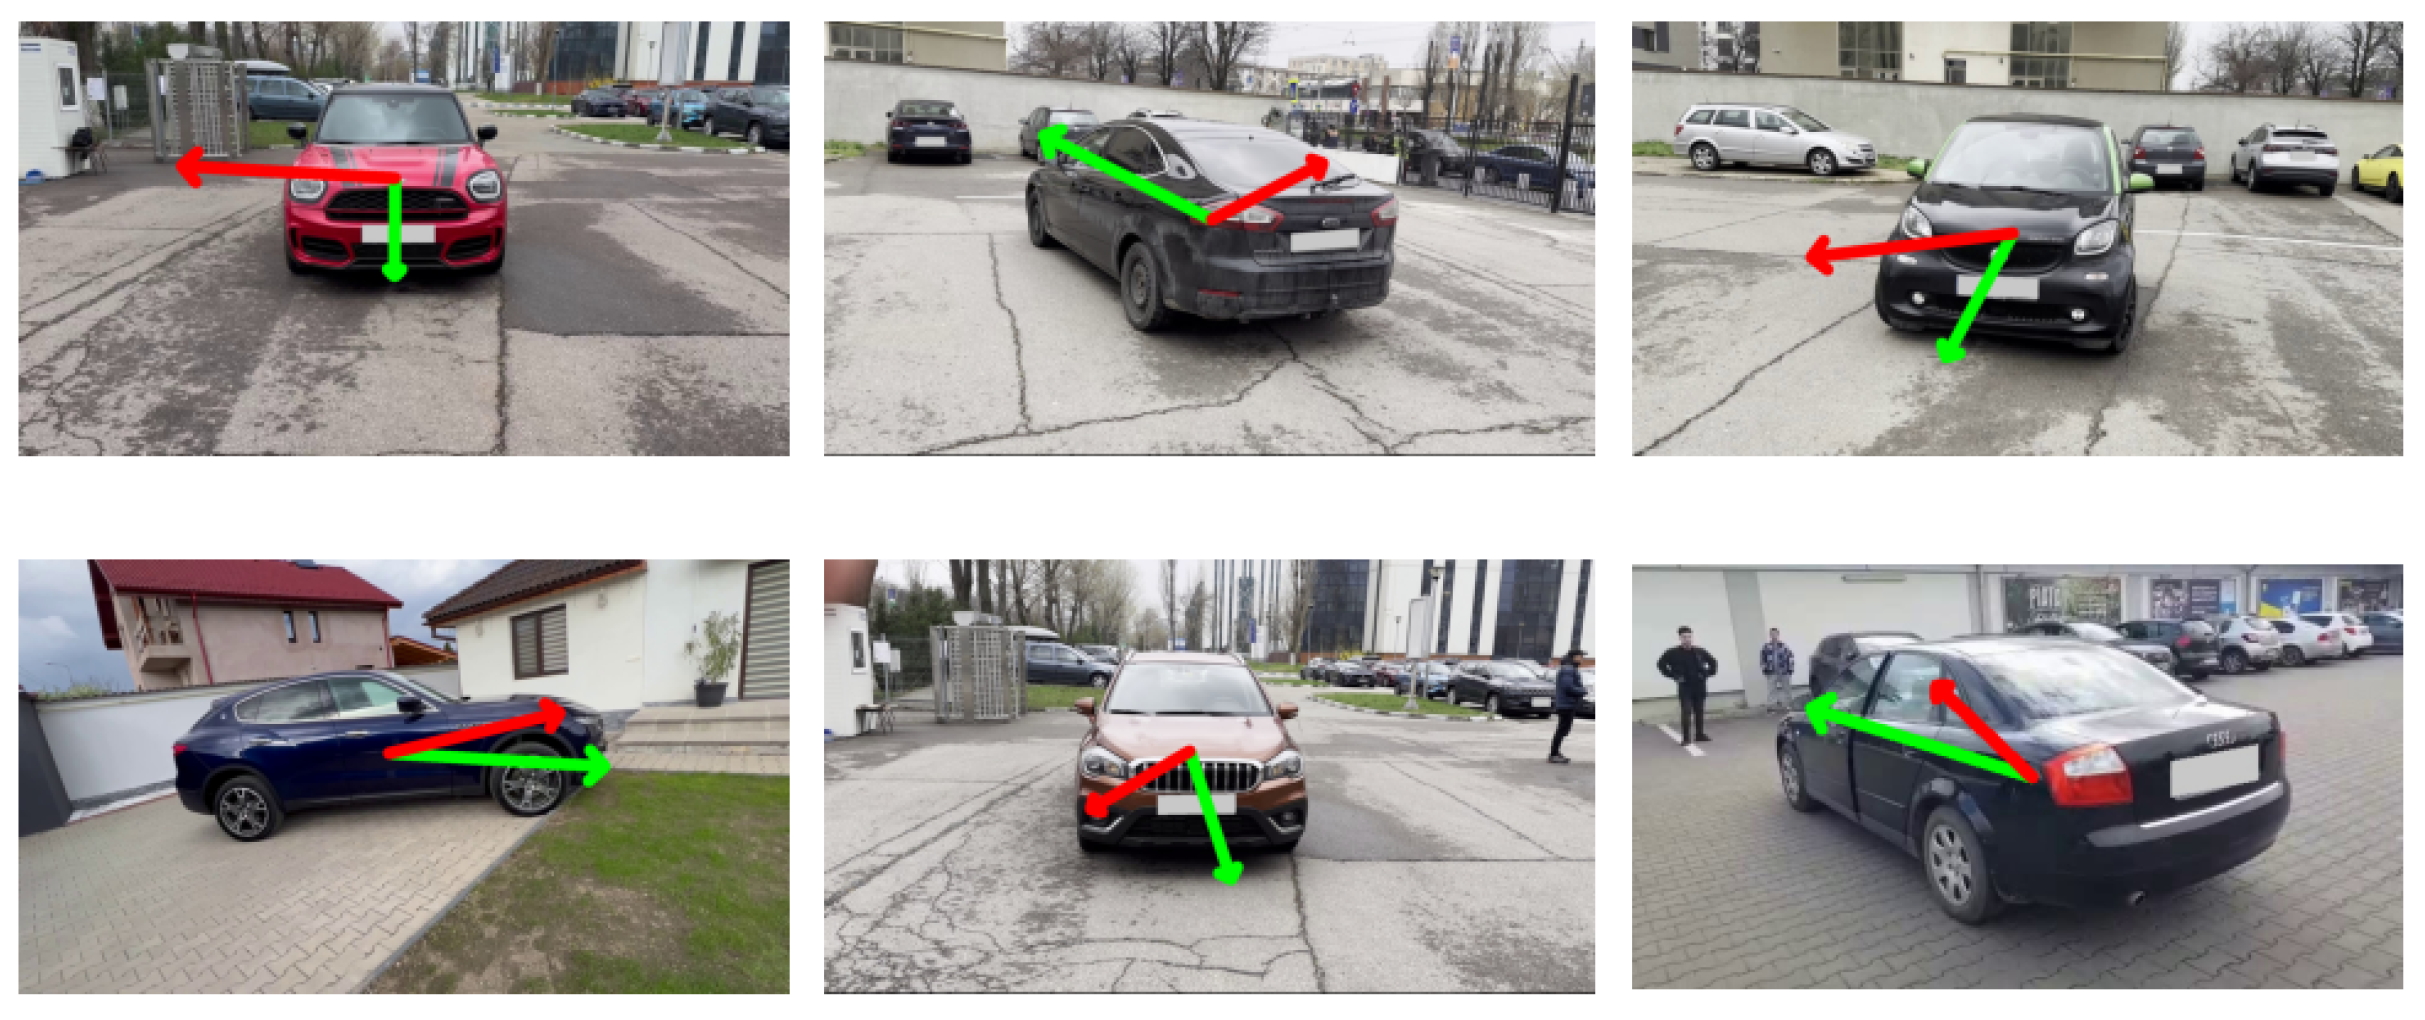
Figure 9 shows the samples with the highest CMAE, indicating the lowest performance of the orientation model.
A shared characteristic in five of the six samples from the figure is the presence of other vehicles in the background. This could explain the wrong prediction as the early and intermediary layers of the convolutional model extract relevant features of both the main and the background cars. When all the features are combined to make the prediction by the last layers, they may also consider the features extracted from background cars, which affect the output.
The presence of background cars, which impacts the prediction of the orientation model, could theoretically be decreased by cropping the image based on the bounding box obtained by the car detection model. However, we chose not to do so for multiple reasons. First, the YOLOv7 model could not detect the main car in all images from the CFV dataset. Second, cropping the image can result in a loss of context, which might make the orientation model focus on specific local features such as the headlights, license plates, or doors for the prediction instead of looking at the whole vehicle. Third, background cars would still not be fully eliminated as the main bounding box can contain a lot of background information from certain perspectives. Finally, only a small percentage of images with background cars actually impact the orientation prediction, and the samples in Figure 9, along with their adjacent angles, are the only ones that result in slightly large errors.

5.3. Cross-Dataset Testing

Our proposed models and training techniques achieve great performance and generalization on the testing samples of the proposed dataset. Because of these results, we test the models in more challenging cases on car images coming from other datasets that contain different data distributions and more unusual angles.
Stanford Cars [12] is a public dataset for fine-grained classification with 196 different classes of vehicles. A class is differentiated based on the make, model, or year of fabrication. However, it does not contain labels for the car’s orientation, which can be impactful in making a correct classification. This dataset has a large intra-class variation as the same car can differ significantly when visualized from another angle.
We also test our orientation prediction model on the Autovit dataset [16], which is a dataset consisting of car listings from the Autovit website, one of the most prominent platforms for selling cars in Romania. The dataset includes images, prices, and other vehicle-related information. Similarly to the previous example of Stanford Cars, this dataset does not include labels for the vehicle’s orientation in images.
To analyze the generalization capabilities of our proposed dataset, we train the multi-task models on CFV and test them on the Stanford and Autovit datasets. As the datasets do not contain orientation labels, we construct two testing sets by manually annotating 100 images from each dataset. The testing samples were randomly selected to ensure diversity in terms of vehicle models and orientation.
Table 5 shows the performance of the models for cross-dataset testing. The Swin Transformer obtains the highest performance on both testing sets with a CMAE value of 12.12° on Stanford Cars and 5.15° on Autovit. The fact that the Swin Transformer outperforms the ConvNeXt model shows that a slightly better performance on the CFV test set does not necessarily imply a better performance on images outside the training distribution. Despite this, the small CMAE values on these test sets prove that models trained on the CFV dataset have strong generalization capabilities and can estimate the orientation for vehicle models not seen during training.
The difference in performance between the Stanford Cars and Autovit datasets can be attributed to two factors: more unusual perspectives and greater disparity between car bodies. Because the Autovit dataset was collected from a car listing website, it contains vehicle images captured by the car owners in a similar manner to our data collection procedure—photos around the car from a natural height. On the other hand, Stanford Cars was collected from various online sources and can contain vehicle images captured from an unusual height. In terms of car bodies, both Autovit and CFV contain vehicle models prevalent in Europe. In contrast, Stanford Cars contains a majority of vehicle models mostly seen in North America. Hence, there is a larger discrepancy in terms of car bodies between the CFV dataset and Stanford Cars.
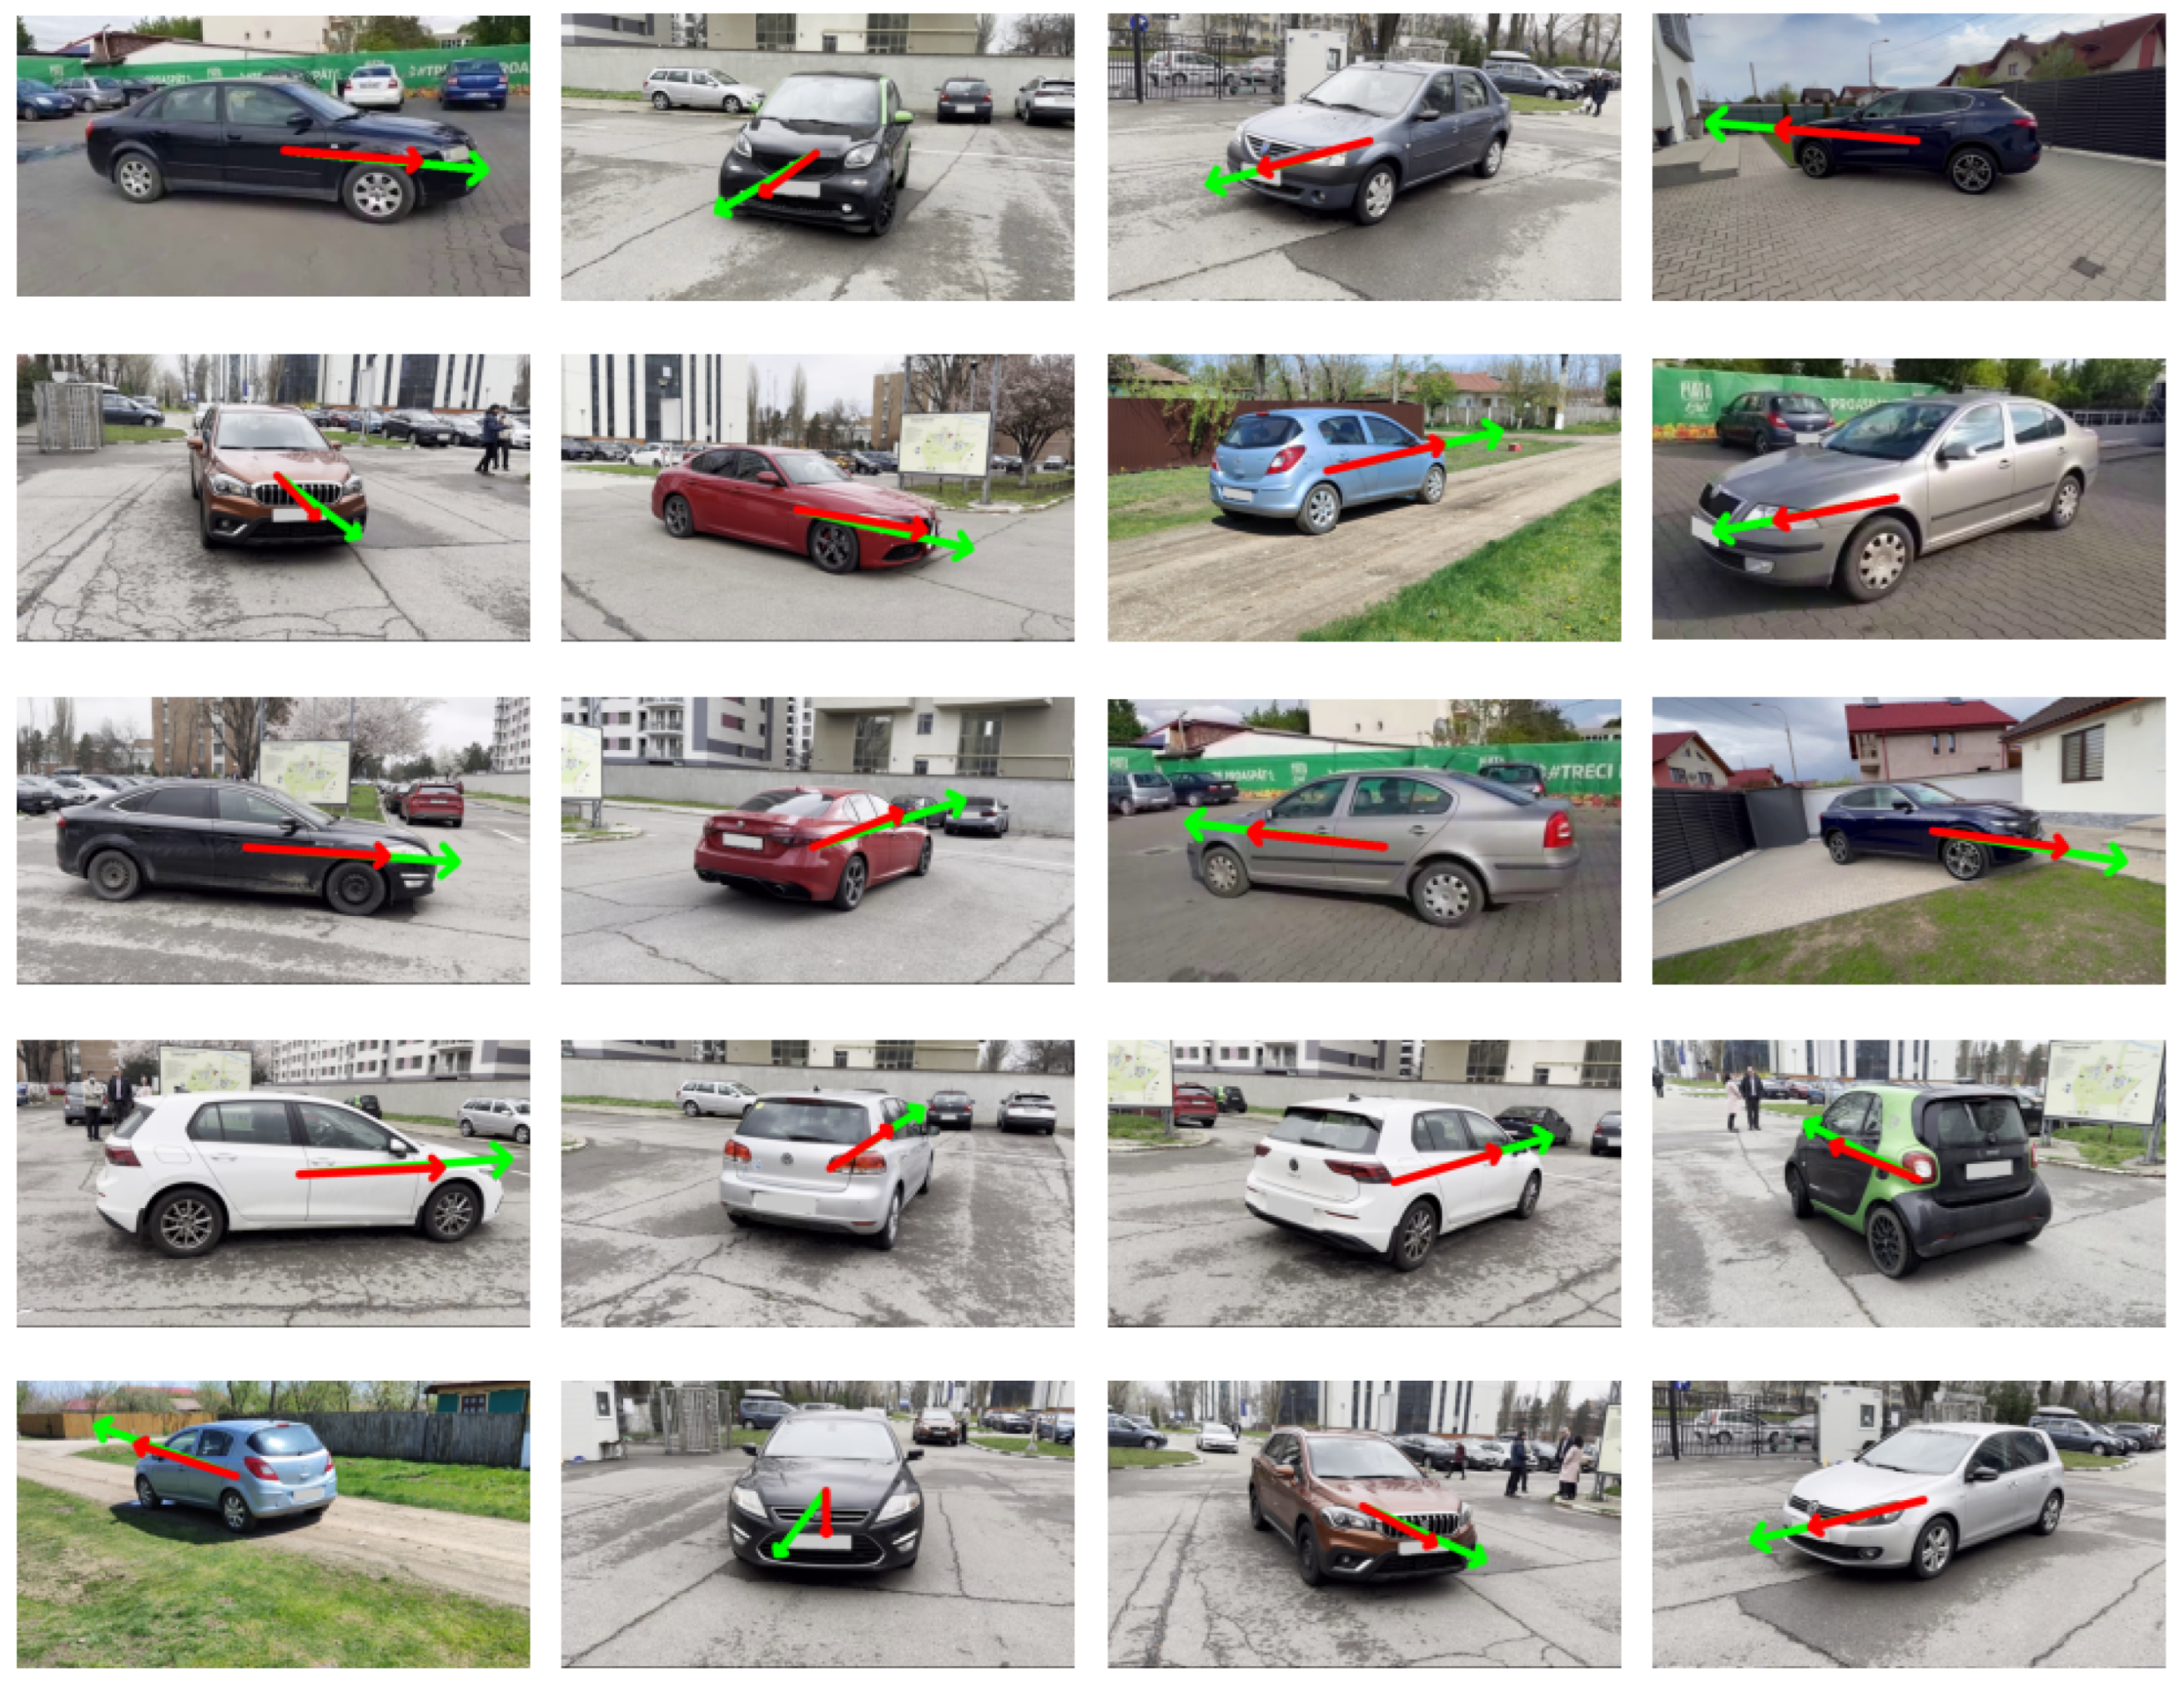
Figure 10 shows the qualitative results of our model tested on the Stanford Cars dataset. We observe that most predictions are close to the real orientation. This argues that our dataset has enough diversity, and the proposed training settings aid the model in generalizing to realistic images.
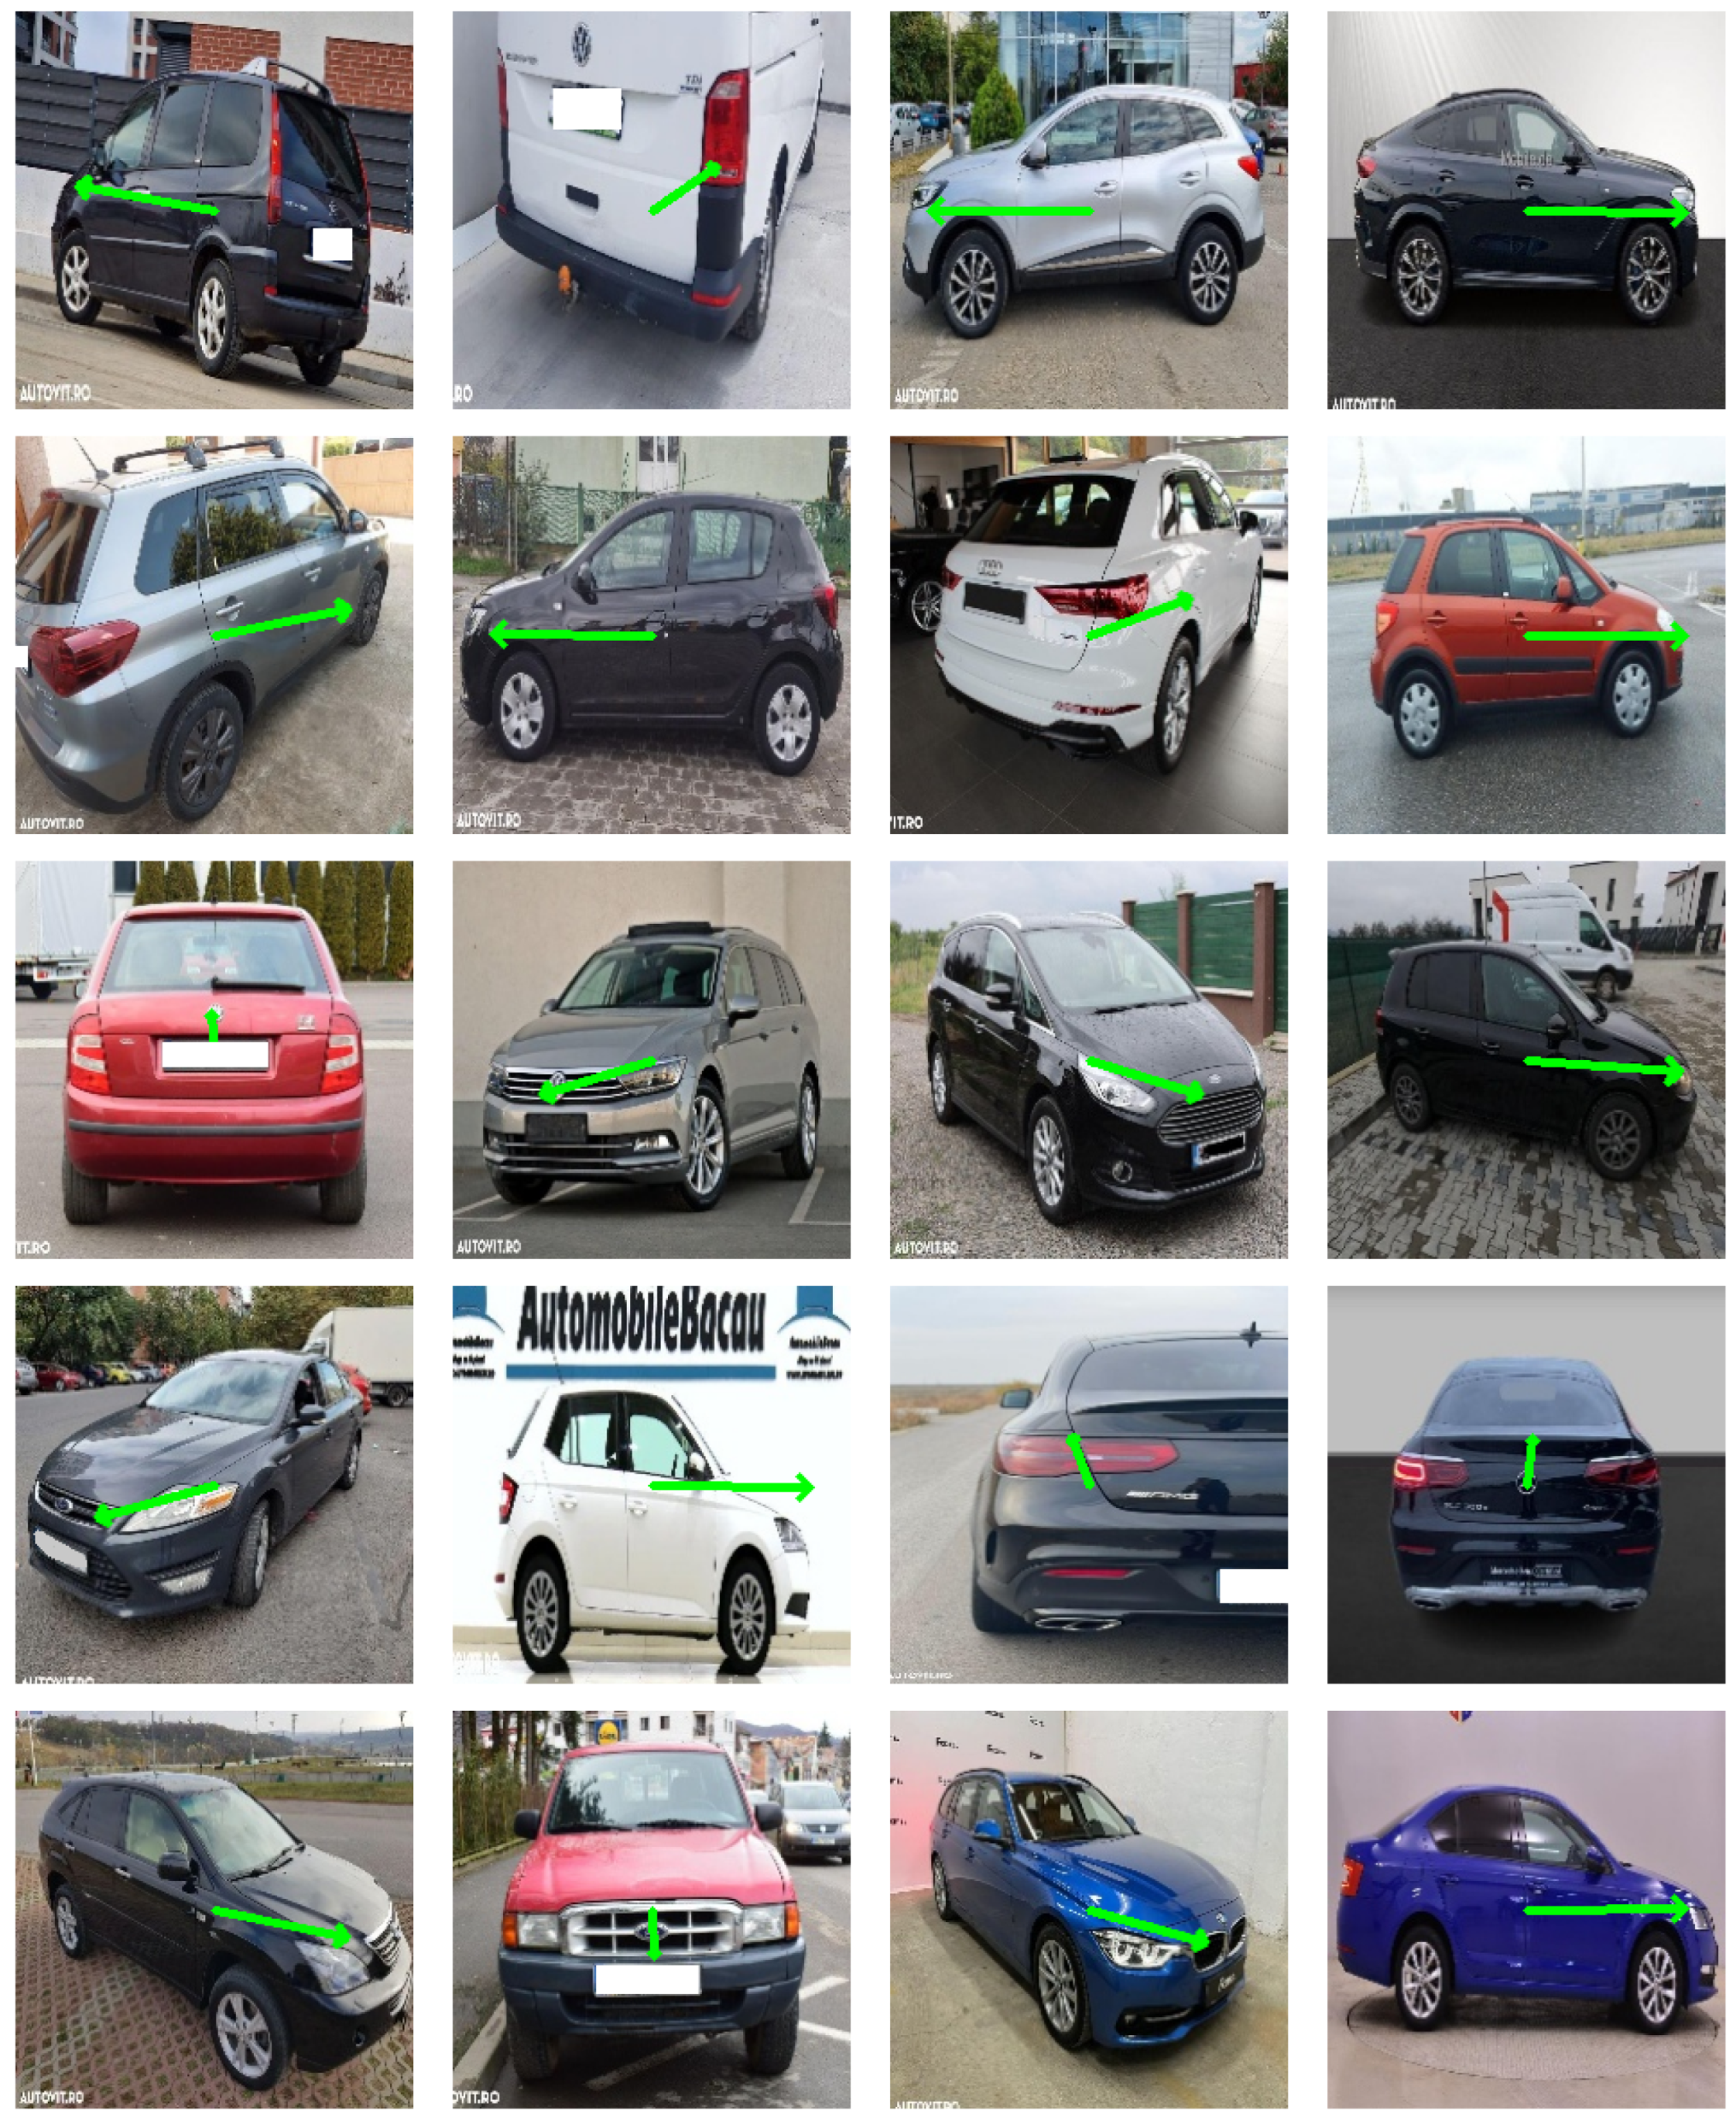
Figure 11 displays examples of predictions of our model on images from the Autovit dataset. As in the previous example, our model obtains results close to the real orientation. This further argues that our model is suited for realistic tasks and can be used to annotate datasets with helpful information.

5.4. Anonymization of Car Plates
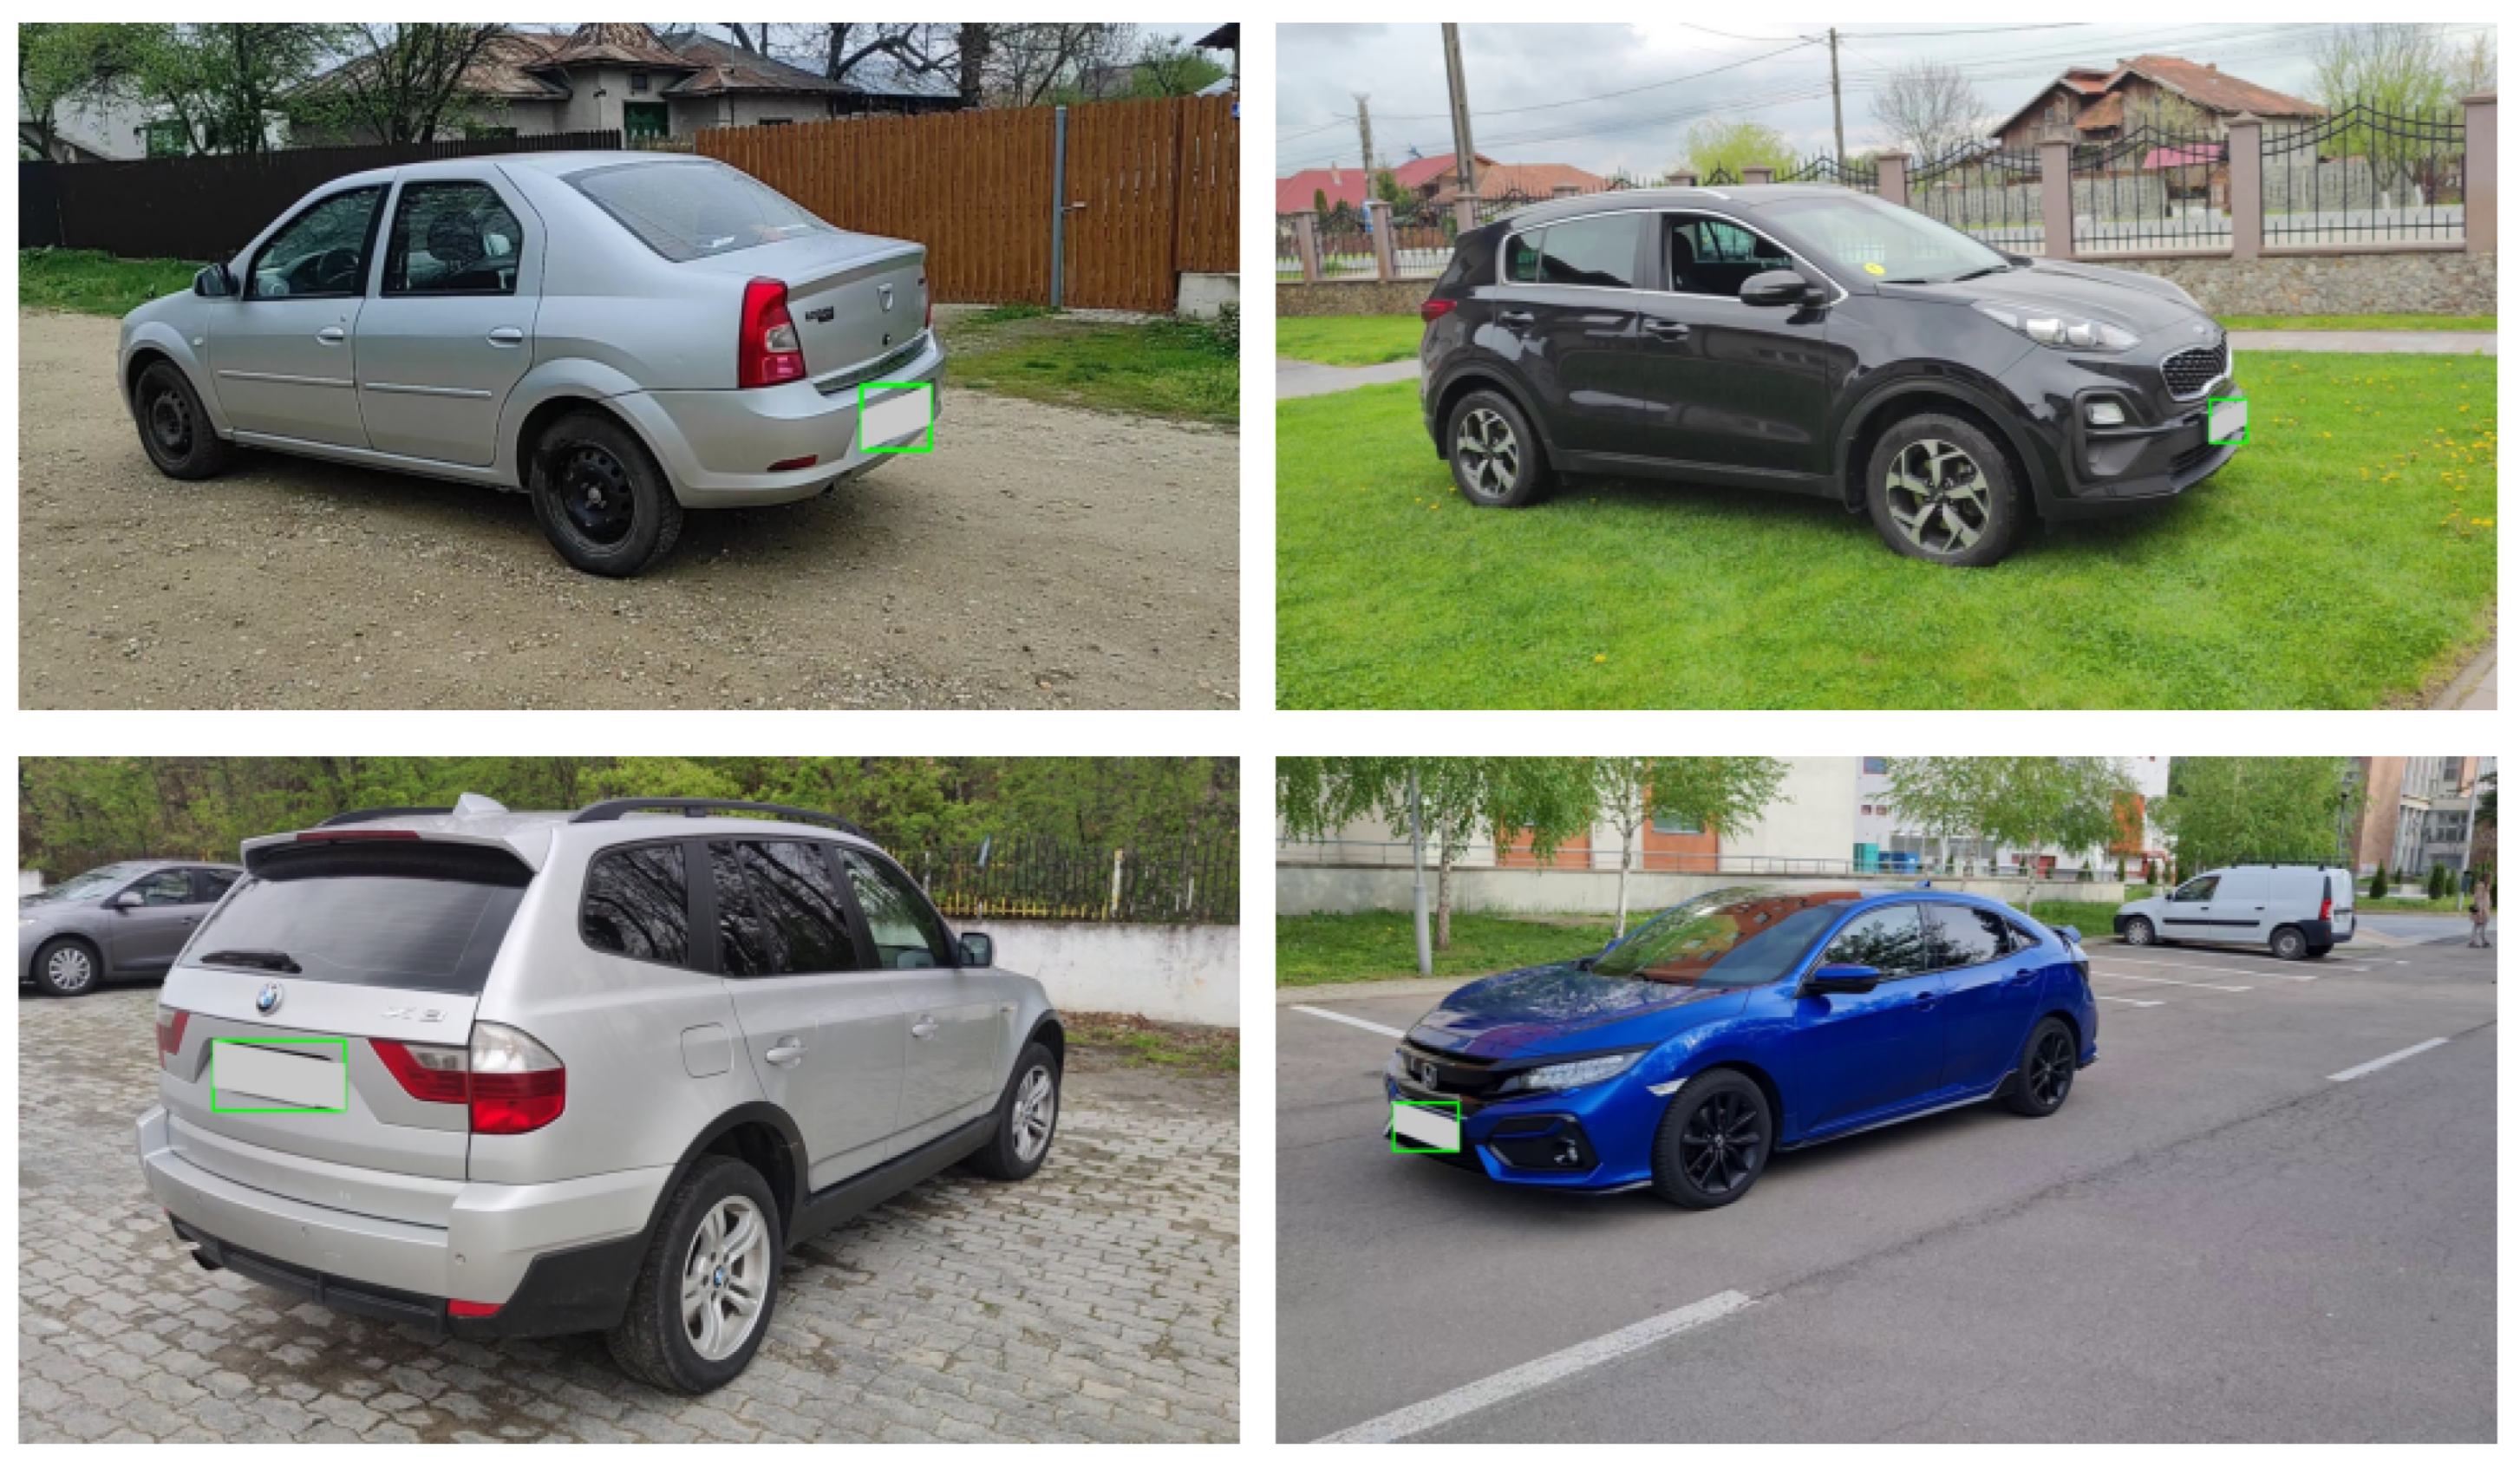
As shown in Figure 7, we can refine the bounding boxes of license plates based on ground truth angle values obtained in the dataset development phase. However, we are interested in the capability of refining license plate detections when there are unlabeled images of cars.
To analyze this, we experiment with car images from the Autovit dataset and utilize the same license plate detection model based on YOLOv5 [28]. This model detects coarse bounding boxes that contain a lot of car-related visual information apart from the license plate. Removing large parts of the car image can hinder the training process of the image processing architectures. To refine the predicted bounding boxes, we utilize our ConvNeXt multi-task model trained on the CFV dataset to obtain angle predictions on each image. The bounding boxes are modified in the same manner as in Section 3.1.3, by skewing them according to Equation (1).
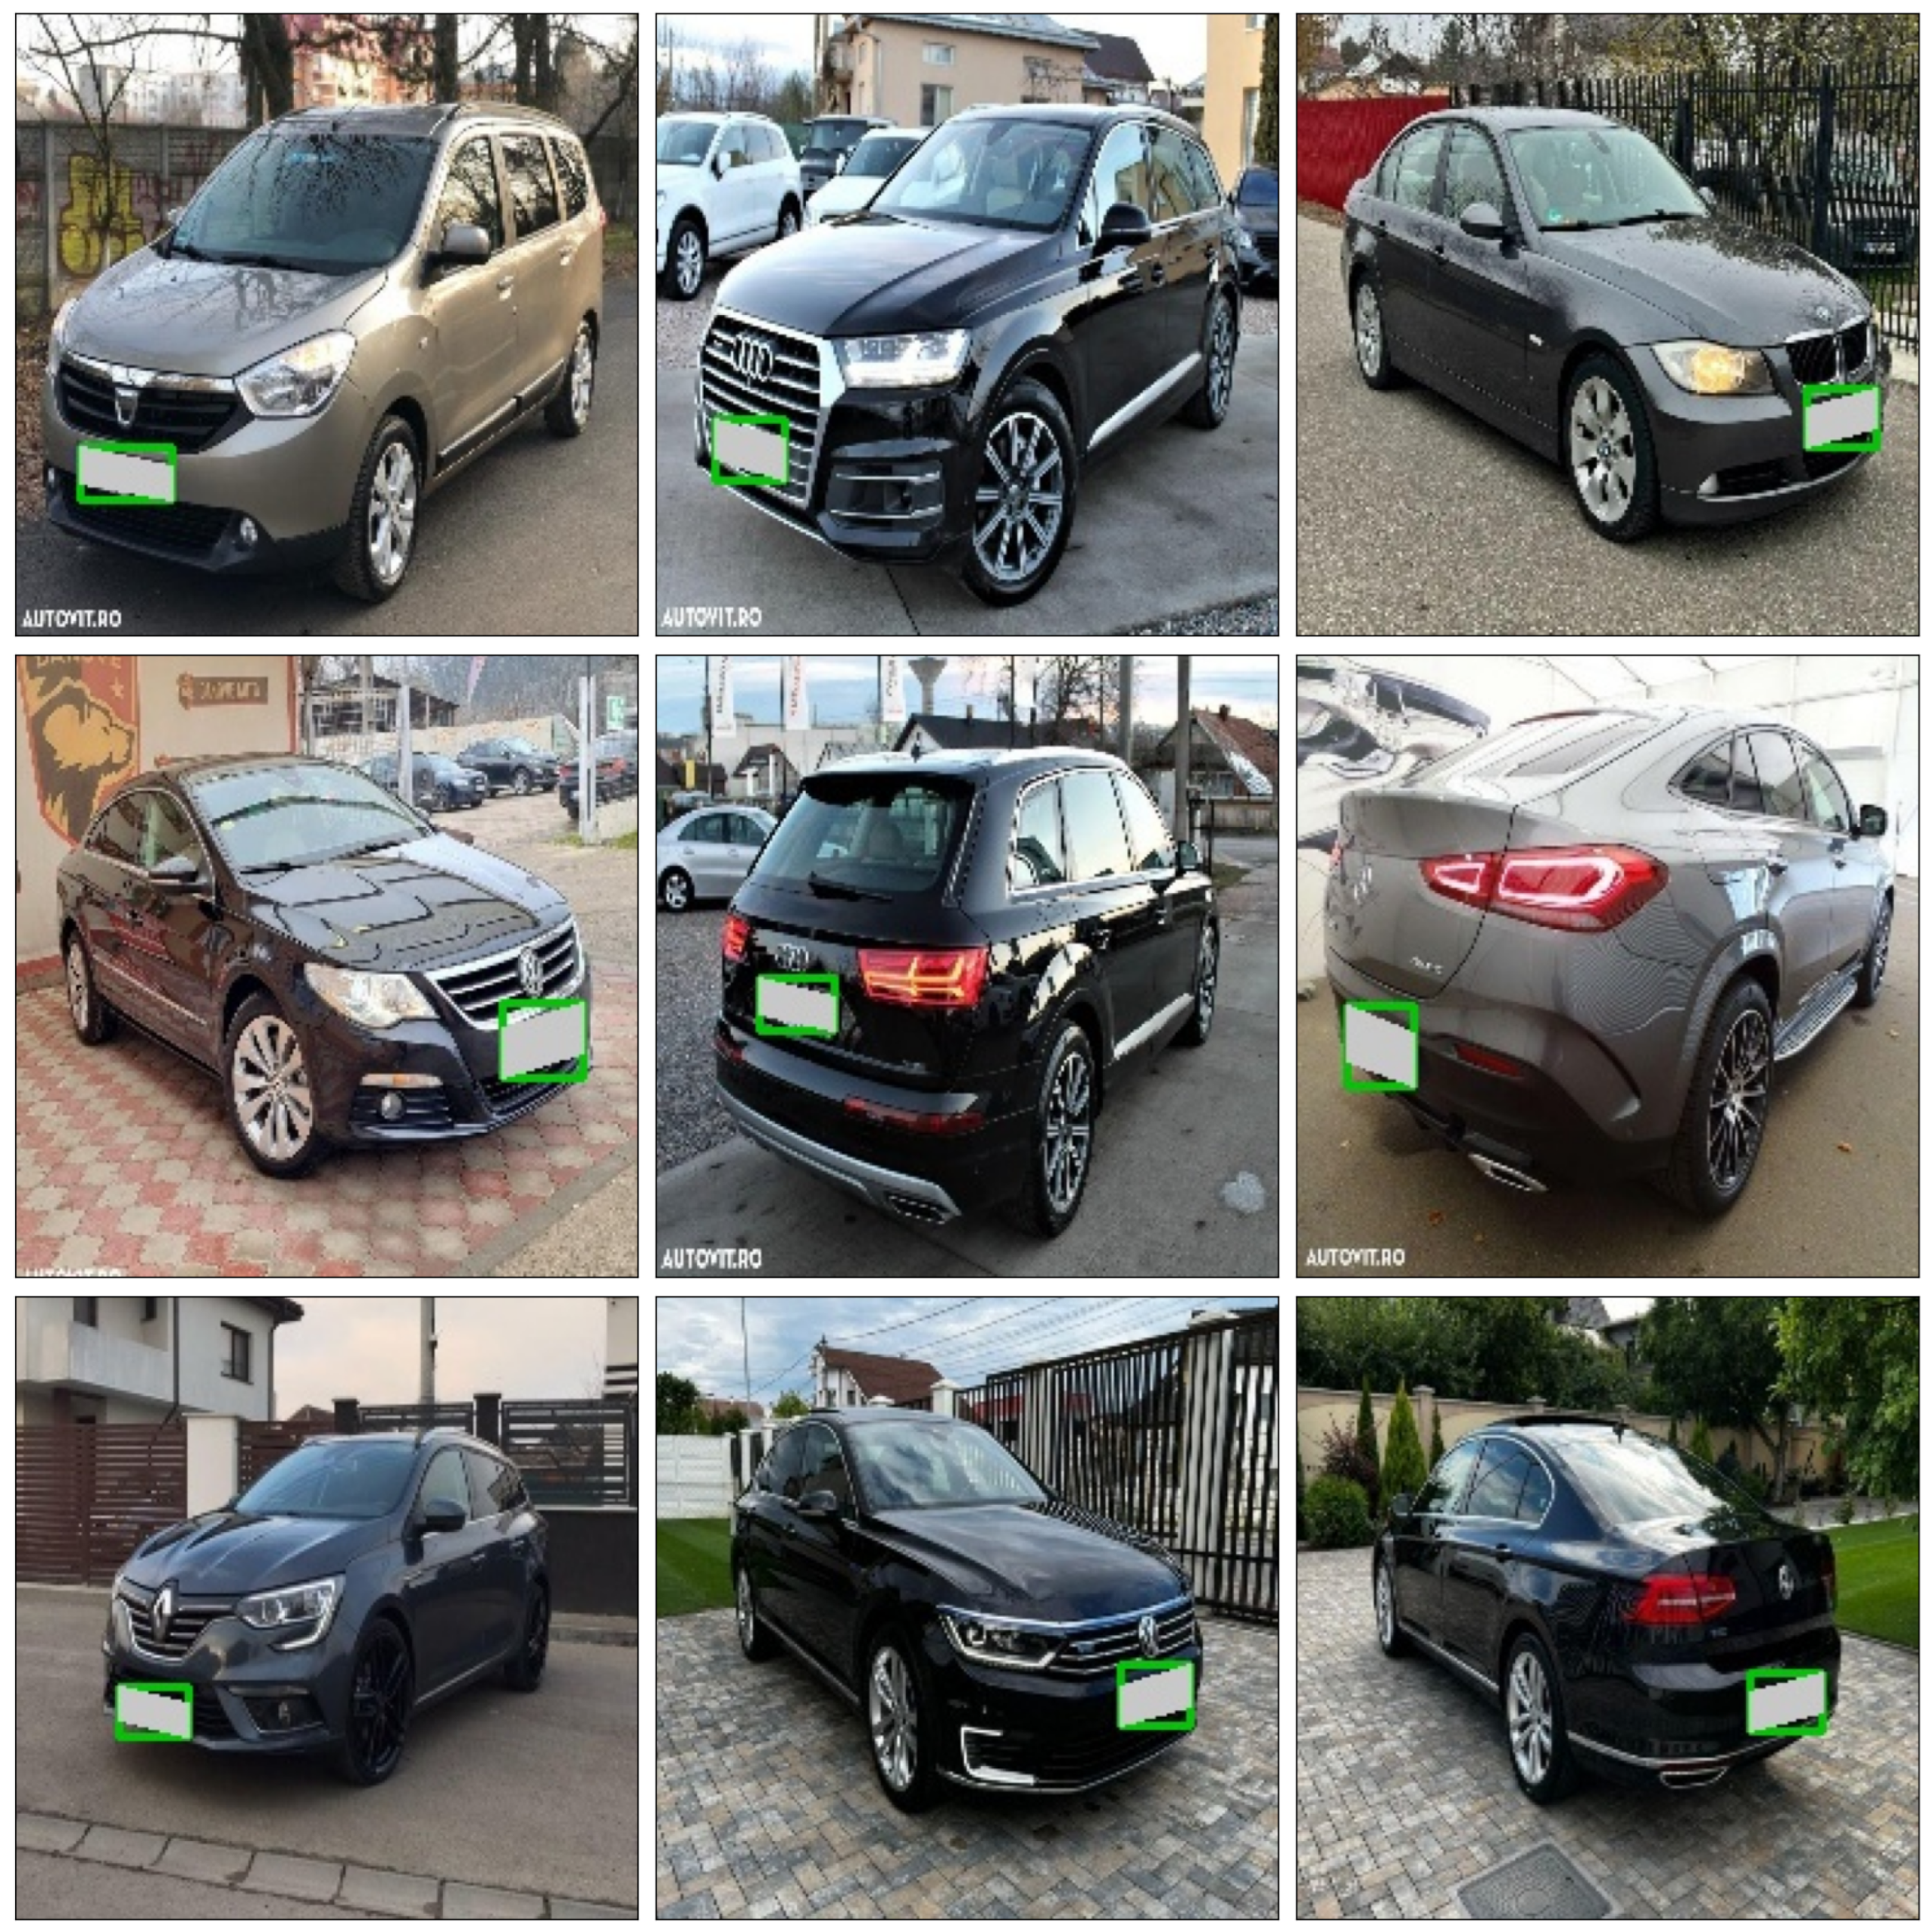
Figure 12 shows examples of anonymized car images from Autovit with our proposed method. Our refinement approach obtains improved bounding box predictions, which have the advantage of not removing as much visual information as the initial detections. This can make training deep learning models on anonymized images more robust as only the necessary pixels are removed while minimizing the lost visual data.

5.5. Explainability

We were also interested in understanding the reasons behind the predictions of the neural network and what features are the most relevant. As such, we utilize gradient-weighted class activation mapping (GradCAM) [38] to obtain explanations for the predictions of the model, which highlights the regions in the image that contributed most to the decision of the neural network.
Figure 13 displays the GradCAM activations of the ConvNeXt model for five different samples per class from the testing set. The results show that the whole car region determines the class prediction. This is important as looking for specific cues, such as license plates or headlights, can prove problematic in images where only a part of the car can be seen. Furthermore, the model might make incorrect predictions for cars not seen in the training set if it only looks at local visual information and not at the whole vehicle. This behavior is obtained because of the random crop augmentation, which can output images where the full car is not visible in the image, and the model must learn to look for other relevant features.
In addition, the deep learning model mostly focuses on the corner of the car and pays little attention to the full vehicle for certain images showing the vehicle at a diagonal angle. This probably happens because the model has learned to detect the specific shape and contour of the car when seen diagonally. However, this behavior does not always happen for images with cars at a diagonal angle, which may indicate that the contour and shape become important cues for cars not seen in the training set. Another possible explanation for this behavior could be the unusual vertical (pitch) angle. As we keep the pitch angle mostly constant and only vary the yaw angles, images with unusual vertical perspectives may generate unpredictable behavior for the model.

6. Conclusions and Future Work

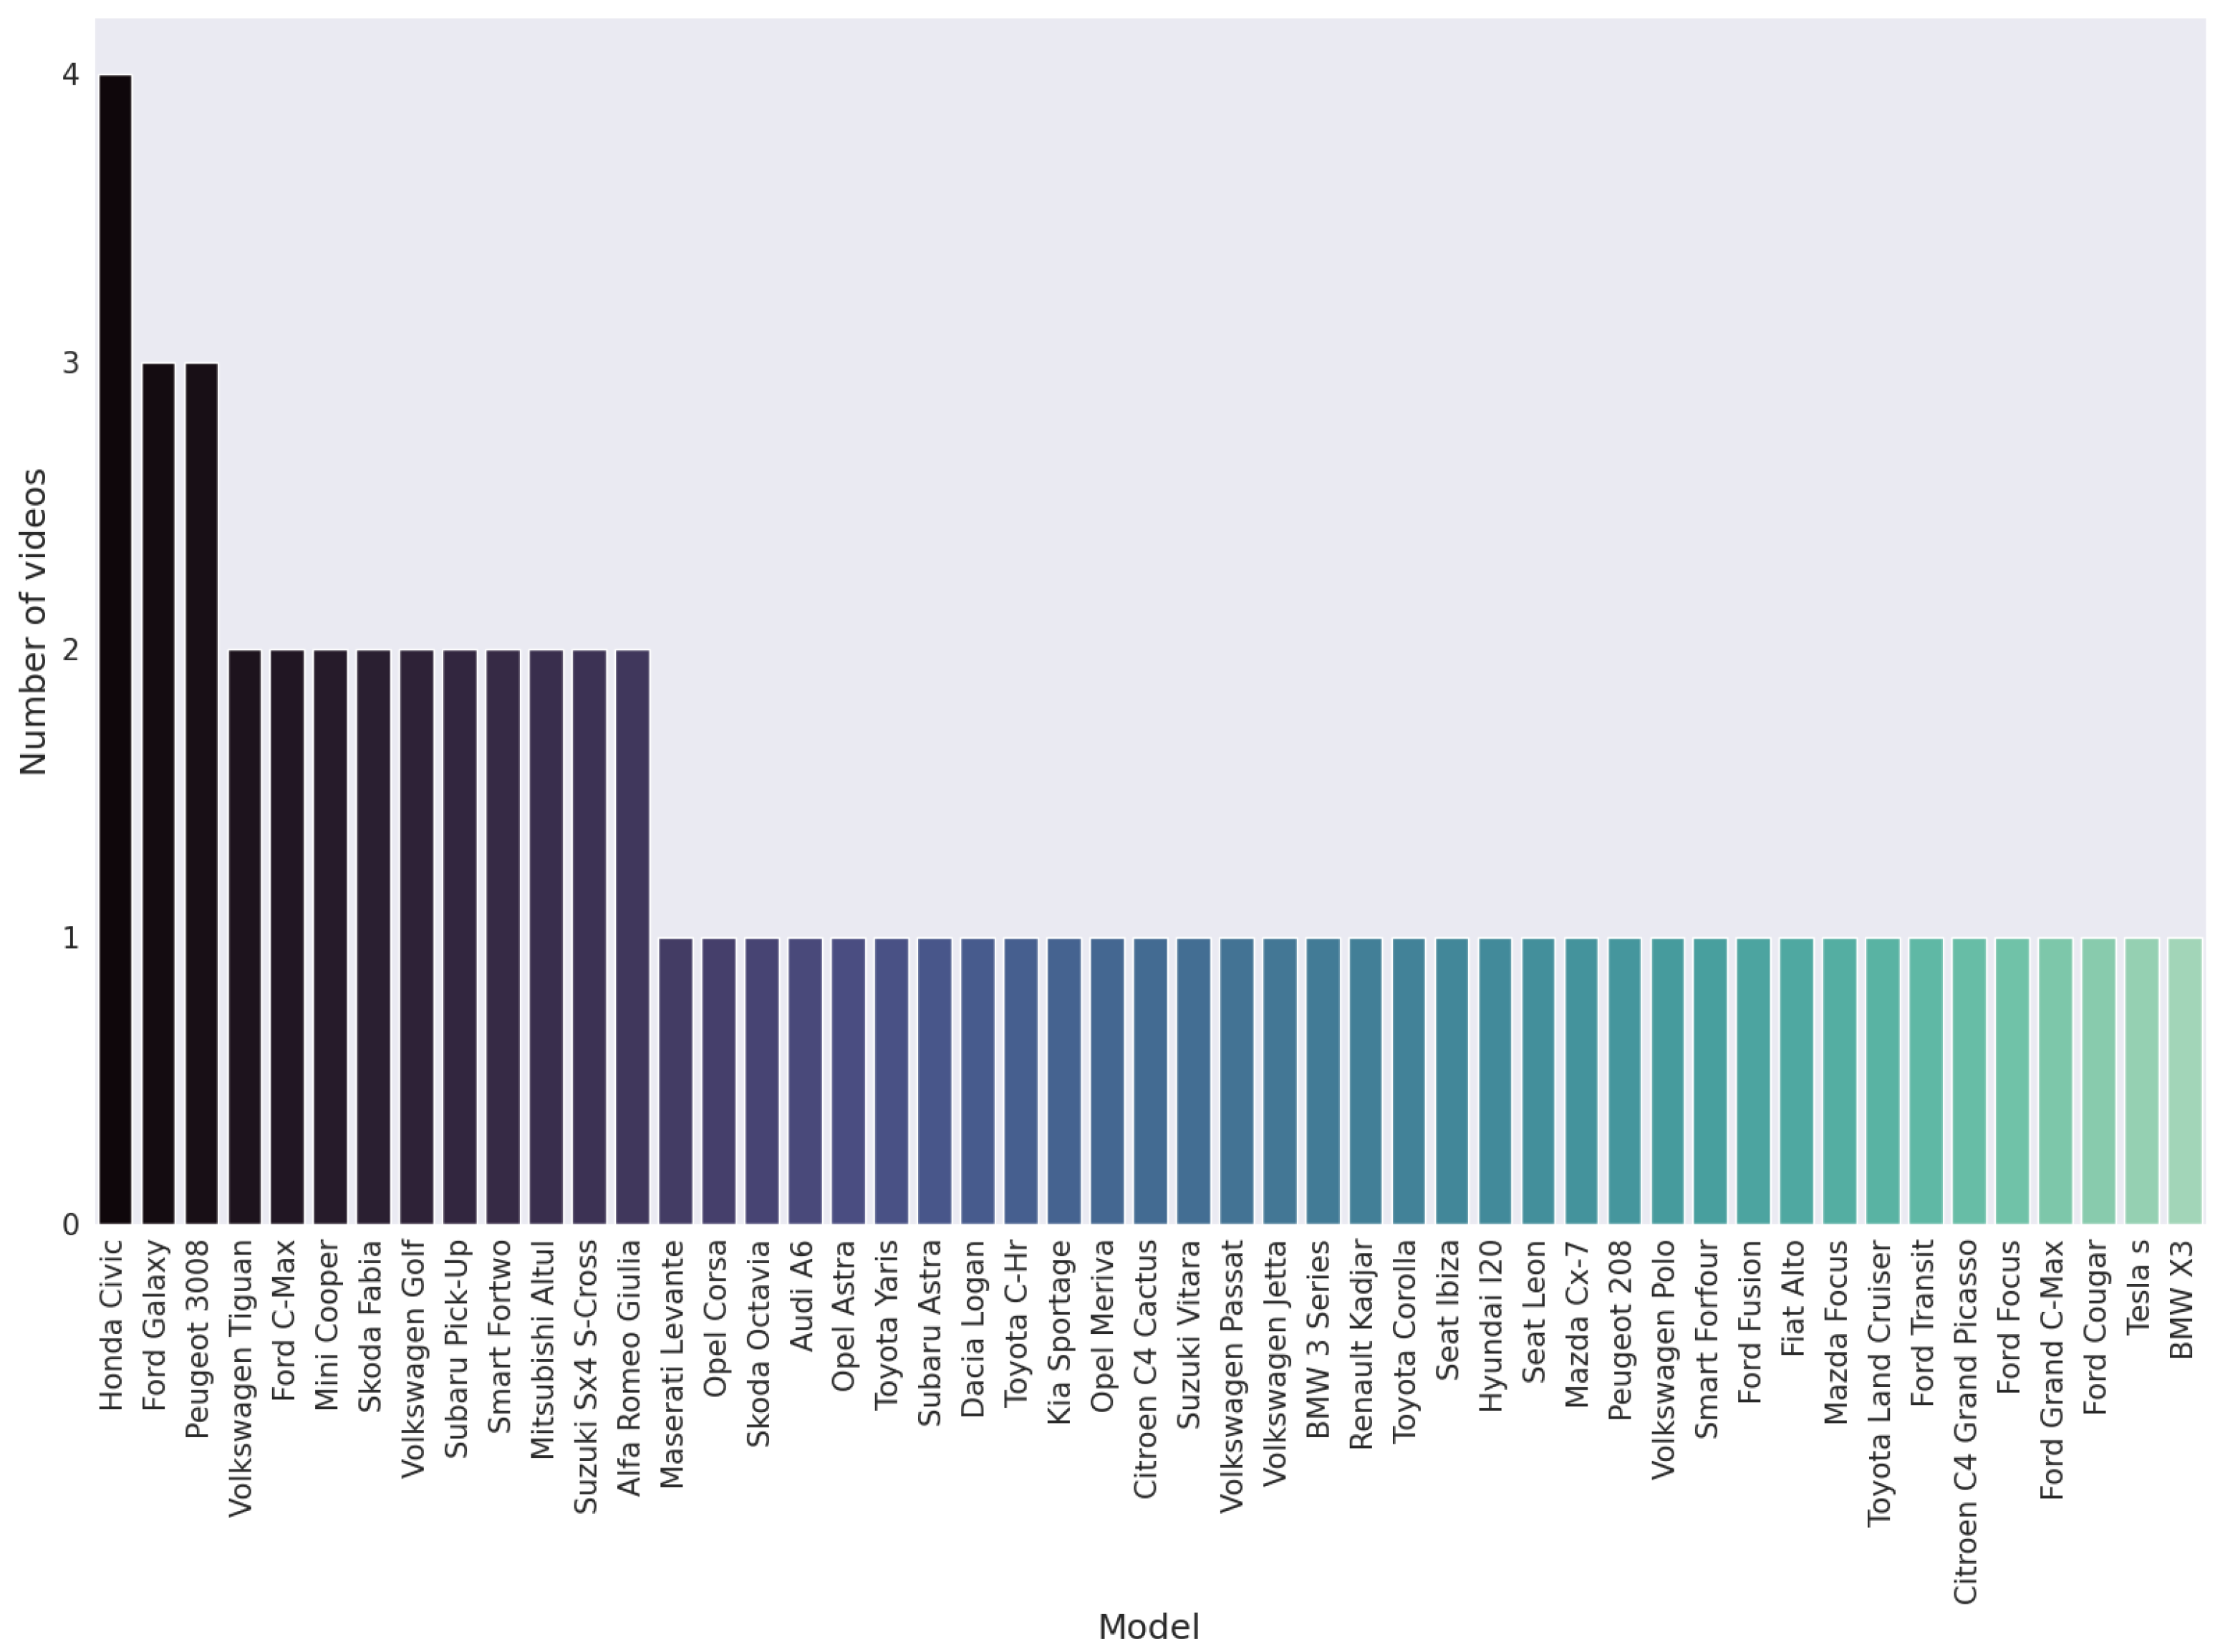
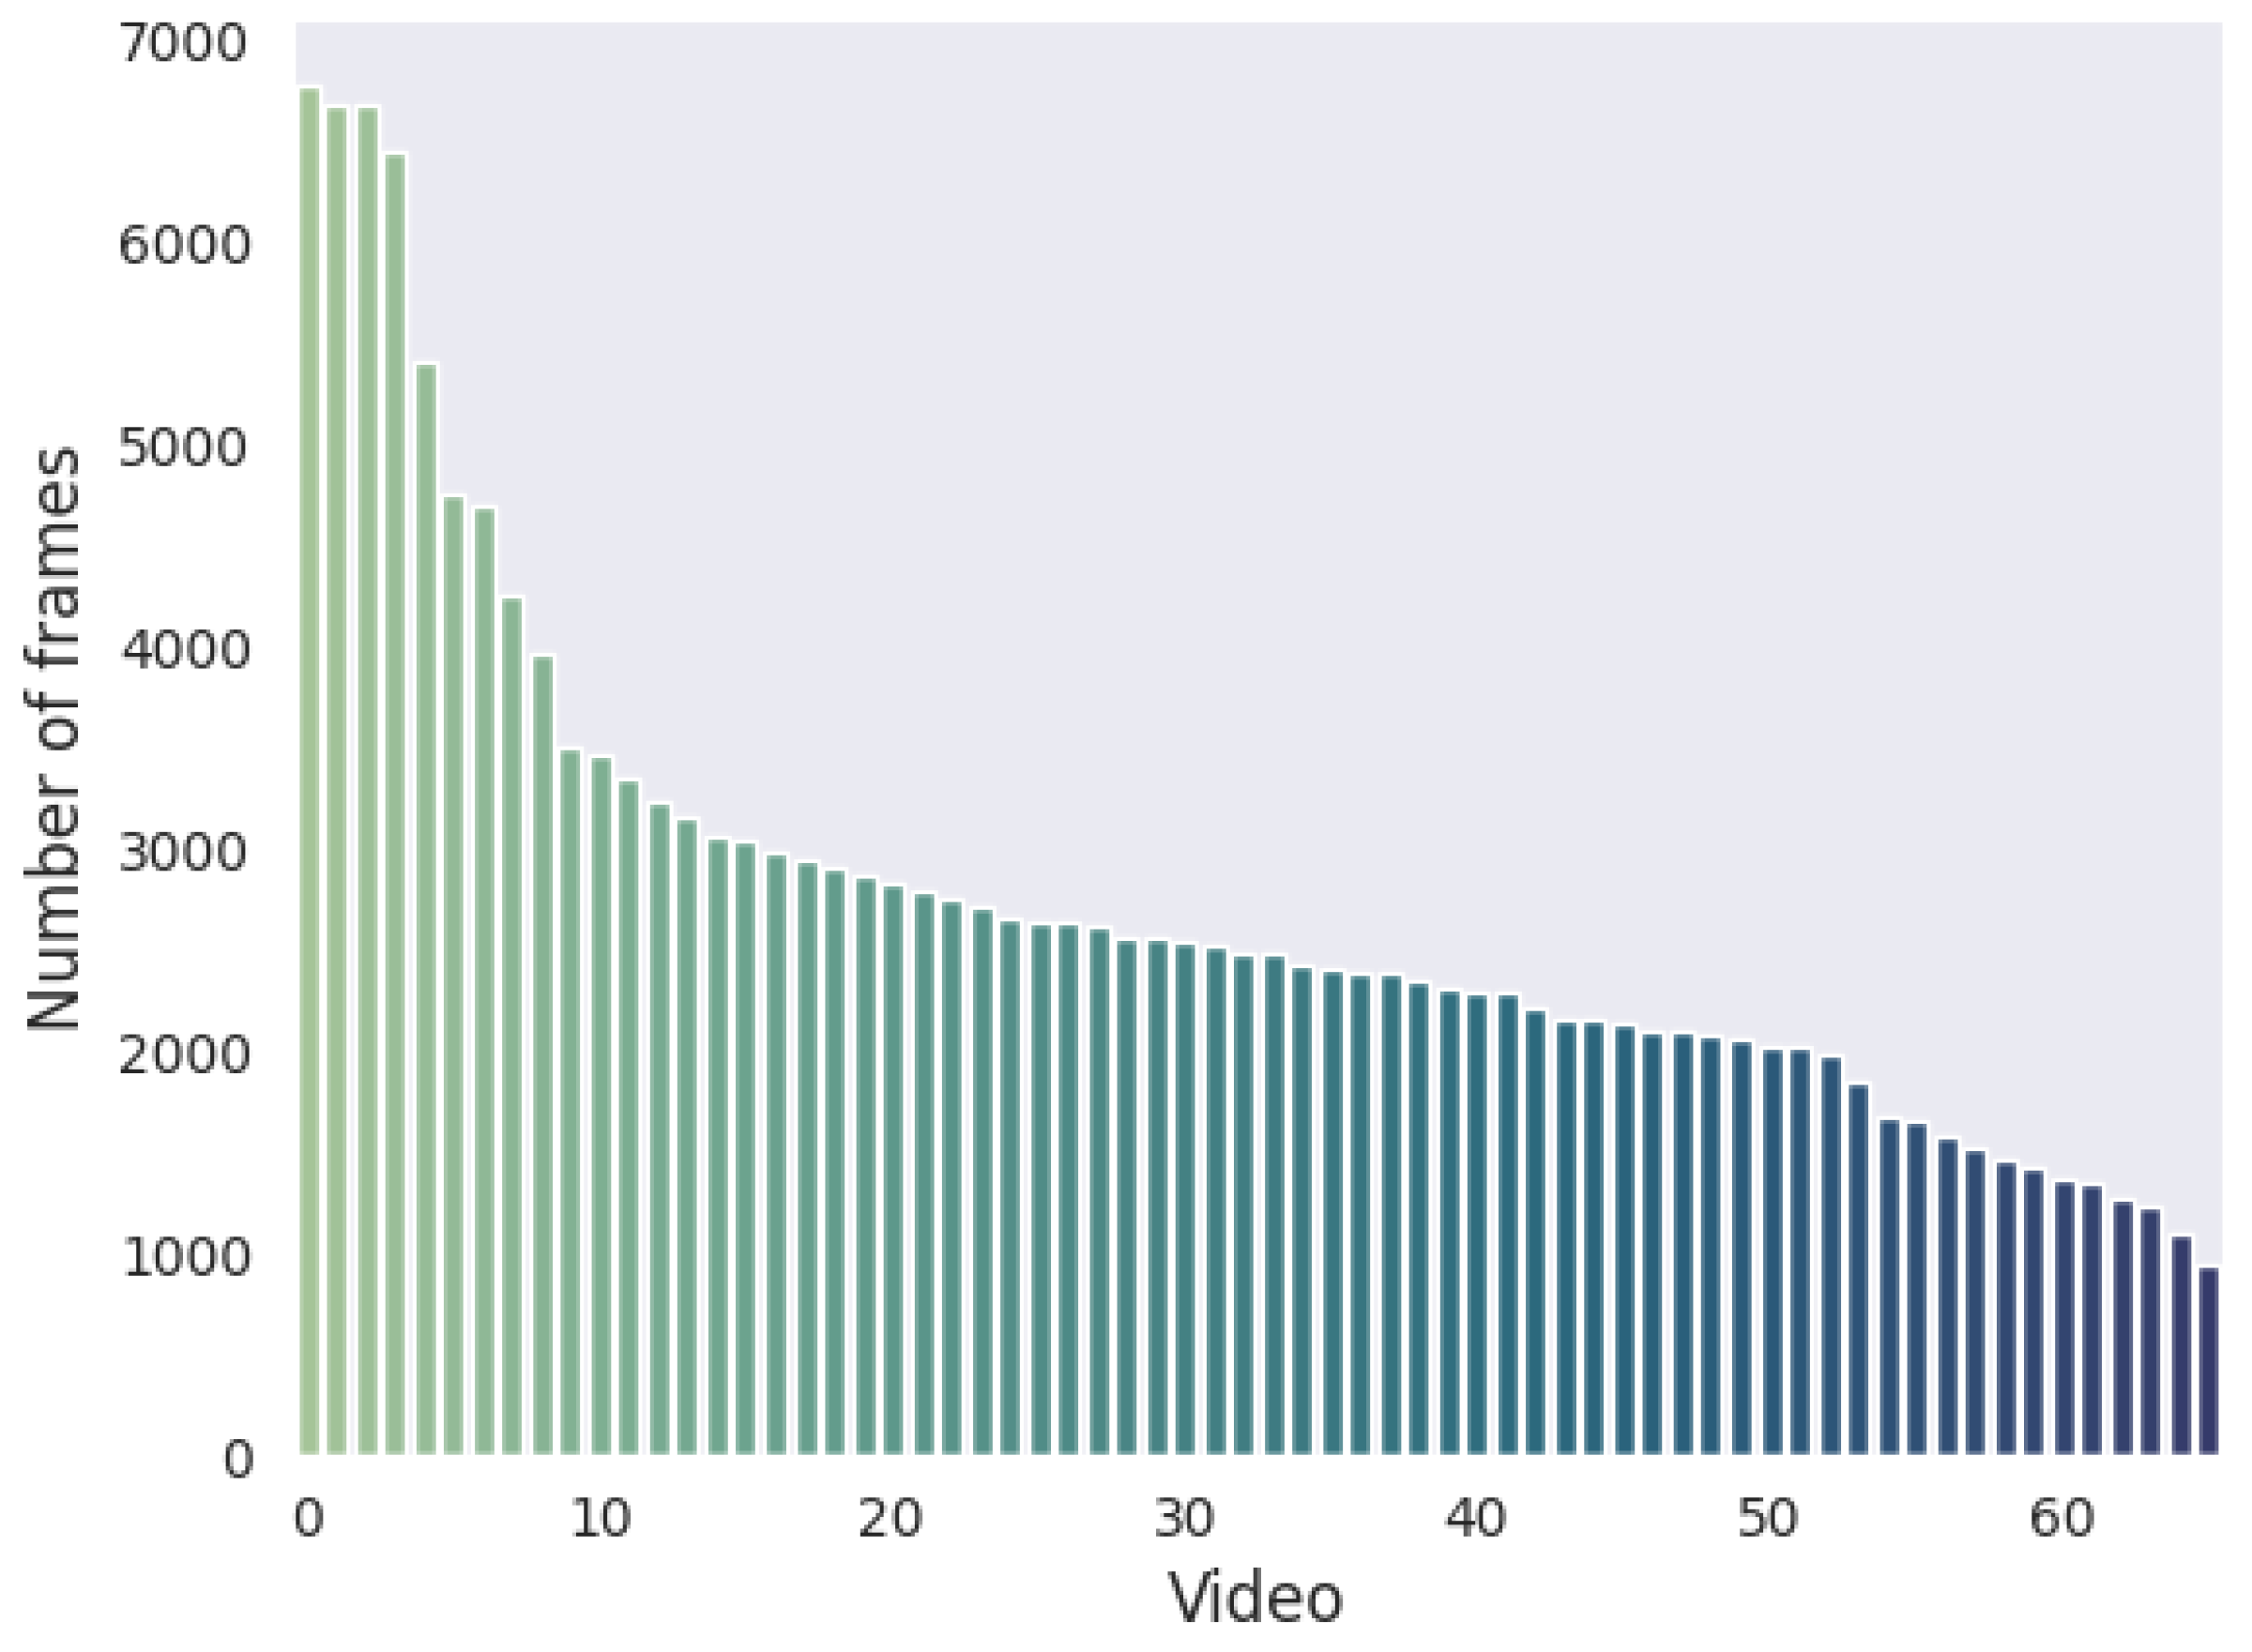
This work presents CFV, a novel dataset for estimating car orientation from images. We collected 66 videos of vehicles recorded by walking around the car in order to capture all possible angles. We annotate all the video frames by leveraging the manual annotations of the key angle frames and the speed of the recording person. Our dataset consists of over 23,000 labeled images that capture cars in diverse backgrounds, lighting, and weather conditions. Using state-of-the-art detection models and the proposed refinement of bounding boxes based on fine-grained angle annotations, we anonymize the images in the dataset by removing the license plates.
We experimented with three popular deep-learning architectures designed for image processing: ResNet, ConvNext, and Swin Transformer. We studied three different approaches to predicting the orientation of cars: first, a classification problem in which the model makes coarse predictions; second, a regression task where the model makes fine-grained predictions, and finally, a multi-objective problem where the model conditions the fine-grained estimation based on the coarse prediction. The best approach employing the ConvNeXt model obtained a CMAE of 3.39°, arguing that a coarse-to-fine approach is the most efficient strategy for predicting the fine-grained angle.
We studied the impact of two initialization approaches for our models: random initialization and initialization from pretrained weights on ImageNet. The results showed that initializing from pretrained weights and fine-tuning the models on our proposed dataset improved performance. For this reason, our dataset should be utilized for fine-tuning on the downstream task of orientation prediction and not for training from scratch.
We analyzed the impact of data augmentation techniques during training for the regression task. We first trained our models without any augmentation, then with weak augmentations that employed random cropping and color jittering, and finally with a custom version of RandAugment from which we removed rotation-based image transforms that affected the overall angle annotation. The results argued that the weak augmentation setting was the most effective as it struck a balance in terms of diversity in the training samples and excessively distorting the images.
We assessed the performance of our trained architectures in cross-dataset settings, where the models were tested on different car images than the ones obtained in our dataset. The qualitative results on Stanford Cars and Autovit datasets showed that the proposed training techniques on the CFV dataset produced models that generalize to realistic settings containing vehicles and perspectives not seen during training.
Our study lays the foundation for other tasks in the automotive domain dependent on object orientation, such as classification, detection, segmentation, and trajectory estimation. In terms of future work, we aim to use the predicted angle on images as an additional supervisory signal for improving the training of computer vision models for other tasks. One of our objectives is to incorporate angle prediction as a task for classification models that estimate the body type, manufacturer, and model of the car. Having angle prediction as an additional task can help the models identify distinctive features exclusive to specific areas of the vehicle. For instance, the manufacturer’s logo appears only on the front or back of the car.
Furthermore, we aim to incorporate the angle annotation obtained by a car orientation model to improve the performance of vehicle part segmentation models. By utilizing the angle and body information obtained from the image, we want to construct a graph of visible vehicle parts to be given as input to the segmentation model along with the image. The graph input enables the segmentation model to only look for visible parts that actually need to be segmented instead of searching for all known classes.

Author Contributions

Conceptualization, A.C., E.R., I.M. and M.D.; methodology, A.C.; software, A.C., P.B. and E.T.; validation, A.C.; formal analysis, A.C.; investigation, A.C.; resources, E.R., I.M. and M.D.; data curation, A.C., P.B. and E.T.; writing—original draft preparation, A.C., P.B. and E.T.; writing—review and editing, E.R., I.M., V.G. and M.D.; visualization, A.C.; supervision, M.D.; project administration, M.D. and V.G.; funding acquisition, M.D. All authors have read and agreed to the published version of the manuscript.

Funding

This work was funded by the “Automated car damage detection and cost prediction—InsureAI” project, Contract Number 30/221_ap3/22.07.2022, MySMIS code: 142909.

Institutional Review Board Statement

Ethical review and approval were not required for this study as it solely involved the analysis of visual features from anonymized car images. Informed consent was obtained to use the data, and all private data (license plates) was removed.

Informed Consent Statement

Informed consent was obtained from all subjects involved in the study.

Data Availability Statement

The dataset can be found at https://huggingface.co/datasets/fort-cyber/CFV-Dataset (accessed on 31 October 2023), while the code used for the experiments in this paper can be found at https://github.com/fort-cyber/car-orientation (accessed on 5 November 2023). The web service for angle annotation is available at: https://insurify.ai/angleDetection (accessed on 2 November 2023).

Conflicts of Interest

Authors Andy Catruna, Vladimir Ghita, Emilian Radoi, Irina Mocanu and Mihai Dascalu were employed by the company FORT S.A. The remaining authors declare that the research was conducted in the absence of any commercial or financial relationships that could be construed as a potential conflict of interest.

Abbreviations

The following abbreviations are used in this manuscript:
CFVCar Full View
CMAECircular Mean Absolute Error
CNNConvolutional Neural Network
CVComputer Vision
DLDeep Learning
GradCAMGradient-weighted Class Activation Mapping
MAEMean Angular Error
MLMachine Learning

Appendix A

Figure A1. Samples from the CFV Dataset.
Electronics 12 04947 g0a1

References

  1. Bengio, Y.; Louradour, J.; Collobert, R.; Weston, J. Curriculum learning. In Proceedings of the 26th Annual International Conference on Machine Learning, Montreal, QC, Canada, 14–18 June 2009; pp. 41–48. [Google Scholar] [CrossRef]
  2. He, K.; Zhang, X.; Ren, S.; Sun, J. Deep residual learning for image recognition. In Proceedings of the IEEE Conference on Computer Vision and Pattern Recognition, Las Vegas, NV, USA, 26 June–1 July 2016; pp. 770–778. [Google Scholar] [CrossRef]
  3. Liu, Z.; Mao, H.; Wu, C.Y.; Feichtenhofer, C.; Darrell, T.; Xie, S. A convnet for the 2020s. In Proceedings of the IEEE/CVF Conference on Computer Vision and Pattern Recognition, New Orleans, LA, USA, 18–24 June 2022; pp. 11976–11986. [Google Scholar] [CrossRef]
  4. Liu, Z.; Lin, Y.; Cao, Y.; Hu, H.; Wei, Y.; Zhang, Z.; Lin, S.; Guo, B. Swin transformer: Hierarchical vision transformer using shifted windows. In Proceedings of the IEEE/CVF International Conference on Computer Vision, Montreal, QC, Canada, 11–17 October 2021; pp. 10012–10022. [Google Scholar] [CrossRef]
  5. Azimi, S.M.; Bahmanyar, R.; Henry, C.; Kurz, F. Eagle: Large-scale vehicle detection dataset in real-world scenarios using aerial imagery. In Proceedings of the 2020 25th International Conference on Pattern Recognition (ICPR), Milan, Italy, 10–15 January 2021; IEEE: Piscataway, NJ, USA, 2021; pp. 6920–6927. [Google Scholar] [CrossRef]
  6. Wang, J.; Simeonova, S.; Shahbazi, M. Orientation-and scale-invariant multi-vehicle detection and tracking from unmanned aerial videos. Remote Sens. 2019, 11, 2155. [Google Scholar] [CrossRef]
  7. Tang, T.; Zhou, S.; Deng, Z.; Lei, L.; Zou, H. Arbitrary-oriented vehicle detection in aerial imagery with single convolutional neural networks. Remote Sens. 2017, 9, 1170. [Google Scholar] [CrossRef]
  8. Geiger, A.; Lenz, P.; Stiller, C.; Urtasun, R. Vision meets robotics: The kitti dataset. Int. J. Robot. Res. 2013, 32, 1231–1237. [Google Scholar] [CrossRef]
  9. Kim, Y.; Park, K.; Kim, M.; Kum, D.; Choi, J.W. 3D Dual-Fusion: Dual-Domain Dual-Query Camera-LiDAR Fusion for 3D Object Detection. arXiv 2022, arXiv:2211.13529. [Google Scholar]
  10. Zheng, W.; Tang, W.; Jiang, L.; Fu, C.W. SE-SSD: Self-ensembling single-stage object detector from point cloud. In Proceedings of the IEEE/CVF Conference on Computer Vision and Pattern Recognition, Nashville, TN, USA, 20–25 June 2021; pp. 14494–14503. [Google Scholar] [CrossRef]
  11. Zhang, Y.; Zhang, Q.; Zhu, Z.; Hou, J.; Yuan, Y. GLENet: Boosting 3D object detectors with generative label uncertainty estimation. Int. J. Comput. Vis. 2023, 131, 3332–3352. [Google Scholar] [CrossRef]
  12. Krause, J.; Stark, M.; Deng, J.; Fei-Fei, L. 3d object representations for fine-grained categorization. In Proceedings of the IEEE International Conference on Computer Vision Workshops, Sydney, Australia, 2–8 December 2013; pp. 554–561. [Google Scholar] [CrossRef]
  13. Jia, C.; Yang, Y.; Xia, Y.; Chen, Y.T.; Parekh, Z.; Pham, H.; Le, Q.; Sung, Y.H.; Li, Z.; Duerig, T. Scaling up visual and vision-language representation learning with noisy text supervision. In Proceedings of the International Conference on Machine Learning, PMLR, Virtual, 18–24 July 2021; pp. 4904–4916. [Google Scholar]
  14. Ridnik, T.; Sharir, G.; Ben-Cohen, A.; Ben-Baruch, E.; Noy, A. Ml-decoder: Scalable and versatile classification head. In Proceedings of the IEEE/CVF Winter Conference on Applications of Computer Vision, Waikoloa Village, HI, USA, 4–6 January 2023; pp. 32–41. [Google Scholar] [CrossRef]
  15. Liu, D.; Zhao, L.; Wang, Y.; Kato, J. Learn from each other to Classify better: Cross-layer mutual attention learning for fine-grained visual classification. Pattern Recognit. 2023, 140, 109550. [Google Scholar] [CrossRef]
  16. Dutulescu, A.; Iamandei, M.; Neagu, L.M.; Ruseti, S.; Ghita, V.; Dascalu, M. What is the Price of Your Used Car? Automated Predictions using XGBoost and Neural Networks. In Proceedings of the 2023 24th International Conference on Control Systems and Computer Science (CSCS), Bucharest, Romania, 24–26 May 2023; IEEE: Piscataway, NJ, USA, 2023; pp. 418–425. [Google Scholar] [CrossRef]
  17. Dutulescu, A.; Catruna, A.; Ruseti, S.; Iorga, D.; Ghita, V.; Neagu, L.M.; Dascalu, M. Car Price Quotes Driven by Data-Comprehensive Predictions Grounded in Deep Learning Techniques. Electronics 2023, 12, 3083. [Google Scholar] [CrossRef]
  18. Caesar, H.; Bankiti, V.; Lang, A.H.; Vora, S.; Liong, V.E.; Xu, Q.; Krishnan, A.; Pan, Y.; Baldan, G.; Beijbom, O. nuScenes: A Multimodal Dataset for Autonomous Driving. In Proceedings of the 2020 IEEE/CVF Conference on Computer Vision and Pattern Recognition, CVPR 2020, Seattle, WA, USA, 13–19 June 2020; IEEE: Piscataway, NJ, USA, 2020. [Google Scholar] [CrossRef]
  19. Yin, T.; Zhou, X.; Krahenbuhl, P. Center-Based 3D Object Detection and Tracking. In Proceedings of the IEEE/CVF Conference on Computer Vision and Pattern Recognition (CVPR), Nashville, TN, USA, 20–25 June 2021; pp. 11784–11793. [Google Scholar] [CrossRef]
  20. Yang, Z.; Sun, Y.; Liu, S.; Jia, J. 3DSSD: Point-Based 3D Single Stage Object Detector. In Proceedings of the IEEE/CVF Conference on Computer Vision and Pattern Recognition (CVPR), Seattle, WA, USA, 13–19 June 2020. [Google Scholar] [CrossRef]
  21. Geyer, J.; Kassahun, Y.; Mahmudi, M.; Ricou, X.; Durgesh, R.; Chung, A.S.; Hauswald, L.; Pham, V.H.; Mühlegg, M.; Dorn, S.; et al. A2D2: Audi Autonomous Driving Dataset. arXiv 2020, arXiv:2004.06320. [Google Scholar]
  22. Zhang, Y.; Zhou, Z.; David, P.; Yue, X.; Xi, Z.; Gong, B.; Foroosh, H. PolarNet: An Improved Grid Representation for Online LiDAR Point Clouds Semantic Segmentation. In Proceedings of the IEEE/CVF Conference on Computer Vision and Pattern Recognition (CVPR), Seattle, WA, USA, 13–19 June 2020. [Google Scholar] [CrossRef]
  23. Zhang, X.; Li, Z.; Gao, X.; Jin, D.; Li, J. Channel Attention in LiDAR-camera Fusion for Lane Line Segmentation. Pattern Recognit. 2021, 118, 108020. [Google Scholar] [CrossRef]
  24. Huang, X.; Wang, P.; Cheng, X.; Zhou, D.; Geng, Q.; Yang, R. The ApolloScape Open Dataset for Autonomous Driving and Its Application. IEEE Trans. Pattern Anal. Mach. Intell. 2020, 42, 2702–2719. [Google Scholar] [CrossRef] [PubMed]
  25. Li, X.; Ying, X.; Chuah, M.C. GRIP++: Enhanced Graph-based Interaction-aware Trajectory Prediction for Autonomous Driving. arXiv 2019, arXiv:1907.07792. [Google Scholar]
  26. Li, X.; Ying, X.; Chuah, M.C. GRIP: Graph-based Interaction-aware Trajectory Prediction. In Proceedings of the 2019 IEEE Intelligent Transportation Systems Conference (ITSC), Auckland, New Zealand, 27–30 October 2019; pp. 3960–3966. [Google Scholar] [CrossRef]
  27. Chandra, R.; Guan, T.; Panuganti, S.; Mittal, T.; Bhattacharya, U.; Bera, A.; Manocha, D. Forecasting Trajectory and Behavior of Road-Agents Using Spectral Clustering in Graph-LSTMs. IEEE Robot. Autom. Lett. 2020, 5, 4882–4890. [Google Scholar] [CrossRef]
  28. Redmon, J.; Divvala, S.; Girshick, R.; Farhadi, A. You only look once: Unified, real-time object detection. In Proceedings of the IEEE Conference on Computer Vision and Pattern Recognition, Las Vegas, NV, USA, 26 June–1 July 2016; pp. 779–788. [Google Scholar] [CrossRef]
  29. Badrinarayanan, V.; Kendall, A.; Cipolla, R. Segnet: A deep convolutional encoder-decoder architecture for image segmentation. IEEE Trans. Pattern Anal. Mach. Intell. 2017, 39, 2481–2495. [Google Scholar] [CrossRef] [PubMed]
  30. Chen, L.C.; Papandreou, G.; Kokkinos, I.; Murphy, K.; Yuille, A.L. Deeplab: Semantic image segmentation with deep convolutional nets, atrous convolution, and fully connected crfs. IEEE Trans. Pattern Anal. Mach. Intell. 2017, 40, 834–848. [Google Scholar] [CrossRef] [PubMed]
  31. Rother, C.; Kolmogorov, V.; Blake, A. “GrabCut” interactive foreground extraction using iterated graph cuts. ACM Trans. Graph. (TOG) 2004, 23, 309–314. [Google Scholar] [CrossRef]
  32. Wang, C.Y.; Bochkovskiy, A.; Liao, H.Y.M. YOLOv7: Trainable bag-of-freebies sets new state-of-the-art for real-time object detectors. In Proceedings of the IEEE/CVF Conference on Computer Vision and Pattern Recognition, Vancouver, BC, Canada, 18–22 June 2023; pp. 7464–7475. [Google Scholar] [CrossRef]
  33. Lin, T.Y.; Maire, M.; Belongie, S.; Hays, J.; Perona, P.; Ramanan, D.; Dollár, P.; Zitnick, C.L. Microsoft coco: Common objects in context. In Proceedings of the Computer Vision—ECCV 2014: 13th European Conference, Zurich, Switzerland, 6–12 September 2014; Part V13. Springer: Berlin/Heidelberg, Germany, 2014; pp. 740–755. [Google Scholar] [CrossRef]
  34. Deng, J.; Dong, W.; Socher, R.; Li, L.J.; Li, K.; Fei-Fei, L. Imagenet: A large-scale hierarchical image database. In Proceedings of the 2009 IEEE Conference on Computer Vision and Pattern Recognition, Miami, FL, USA, 20–25 June 2009; IEEE: Piscataway, NJ, USA, 2009; pp. 248–255. [Google Scholar] [CrossRef]
  35. Cubuk, E.D.; Zoph, B.; Shlens, J.; Le, Q.V. Randaugment: Practical automated data augmentation with a reduced search space. In Proceedings of the IEEE/CVF Conference on Computer Vision and Pattern Recognition Workshops, Seattle, WA, USA, 13–19 June 2020; pp. 702–703. [Google Scholar] [CrossRef]
  36. Loshchilov, I.; Hutter, F. Decoupled weight decay regularization. arXiv 2017, arXiv:1711.05101. [Google Scholar]
  37. Yuan, K.; Guo, S.; Liu, Z.; Zhou, A.; Yu, F.; Wu, W. Incorporating convolution designs into visual transformers. In Proceedings of the IEEE/CVF International Conference on Computer Vision, Montreal, QC, Canada, 11–17 October 2021; pp. 579–588. [Google Scholar] [CrossRef]
  38. Selvaraju, R.R.; Cogswell, M.; Das, A.; Vedantam, R.; Parikh, D.; Batra, D. Grad-cam: Visual explanations from deep networks via gradient-based localization. In Proceedings of the IEEE International Conference on Computer Vision, Venice, Italy, 22–29 October 2017; pp. 618–626. [Google Scholar] [CrossRef]
Figure 1. Depiction of the dataset collection procedure.
Electronics 12 04947 g001
Figure 2. Examples of the key angles obtained from a video of an individual vehicle (green arrows show the orientation labels).
Electronics 12 04947 g002
Figure 3. Samples from the proposed dataset (green arrows show the orientation labels).
Electronics 12 04947 g003
Figure 4. The number of videos in the dataset for each car model.
Electronics 12 04947 g004
Figure 5. Number of frames for all 8 orientation classes.
Electronics 12 04947 g005
Figure 6. Number of frames for each video recording.
Electronics 12 04947 g006
Figure 7. Examples of anonymized images from the proposed dataset (the green boxes show initial coarse detections, while the filled-in white rectangles show refined detections).
Electronics 12 04947 g007
Figure 8. Predictions of the ConvNeXt model on the test set of the CFV dataset (red arrows depict the model’s predictions while green arrows show the actual labels).
Electronics 12 04947 g008
Figure 9. Samples with the highest circular absolute error (red arrows depict the model’s predictions while green arrows show the actual labels).
Electronics 12 04947 g009
Figure 10. Predictions on the Stanford Cars dataset (green arrows show the orientation predictions).
Electronics 12 04947 g010
Figure 11. Predictions on the Autovit dataset (green arrows show the orientation predictions).
Electronics 12 04947 g011
Figure 12. Examples of refined anonymization predictions (the green boxes show initial coarse detections, while the filled-in white rectangles show refined detections).
Electronics 12 04947 g012
Figure 13. GradCAM activations of the classification model for the first 5 classes (the red color highlights areas with the highest importance while the blue color highlights areas with the lowest importance).
Electronics 12 04947 g013
Table 1. The accuracy of the classification models in both cases of weight initialization (bold denotes the best results).
ModelRandom InitializationImageNet Pretrained
ResNet85.04%93.83%
ConvNeXt17.27%93.83%
Swin84.45%93.59%
Table 2. The performance of the regression deep learning architectures in terms of CMAE for all types of augmentation techniques (bold denotes the best performance).
ModelNo AugmentationWeak AugmentationRandAugment
ResNet (Rand. Init.)68.19°31.23°48.58°
ResNet14.81°5.89°7.85°
ConvNeXt4.99°3.58°3.67°
Swin4.69°4.10°4.50°
Table 3. The performance of the multi-task models for both random initialization and ImageNet pretrained weights (bold denotes the best results).
InitializationModelAccuracyCMAE
RandomResNet68.99%33.25°
ConvNeXt16.42%89.75°
Swin14.68%89.63°
ImageNetResNet93.93%5.57°
ConvNeXt93.97%3.39°
Swin93.93%3.53°
Table 4. Comparison between the CFV dataset and other vehicle image datasets.
Dataset# Images# VehiclesTasksParticularity
EAGLE [5]8280215,986 instancesDetection, orientationAerial view
KITTI [8]12,000+100,000 instances3D detection, tracking, depth, optical flowMultimodal
Stanford Cars [12]16,185196 typesClassification-
Autovit [16]59,45015,253 uniqueClassification, price estimationIncludes text and car features
nuScenes [18]1.4M1M instances3D detection, trackingMultimodal
A2D2 [21]41,2771M instances3D detection, segmentationMultimodal
ApolloScape [24]140,00070,000 instances3D detection, trajectory, segmentationMultimodal
CFV (Ours)23,76066 uniqueOrientationFull range of angles
Table 5. The performance of the top-performing models in cross-dataset settings (bold denotes the best results).
DatasetModelCMAE
StanfordResNet17.40°
ConvNeXt13.44°
Swin12.12°
AutovitResNet11.96°
ConvNeXt5.99°
Swin5.15°
Disclaimer/Publisher’s Note: The statements, opinions and data contained in all publications are solely those of the individual author(s) and contributor(s) and not of MDPI and/or the editor(s). MDPI and/or the editor(s) disclaim responsibility for any injury to people or property resulting from any ideas, methods, instructions or products referred to in the content.

