1. Introduction
Occupancy sensing is an important component of building energy management. Data about real-time occupancy or data on historical occupancy patterns can be used to adjust heating and ventilation timing and rates, lighting, and cleaning schedules [
1]. The two most common occupancy sensors are passive infrared (PIR) and ultrasound (US) sensors, both of which estimate occupancy by detecting physical movement, and thus often inaccurately indicate vacancy when occupants are sedentary. These errors lead users to set long delay periods, such that the room is assumed to be occupied long after the last-detected movement, which reduces energy savings potential and the accuracy of occupancy data [
2].
To overcome the drawbacks of traditional PIR and US sensors, new technologies, such as hybrid (combining PIR and ultrasound in one sensor) [
3], infrared time-of-flight [
4], video [
5], CO
[
6], thermopile array [
7,
8], chair sensors [
9], and radar sensors [
7,
10,
11,
12,
13,
14,
15,
16] have been in development, with some of them emerging in the market. New approaches to signal processing are also being developed to improve the accuracy of occupancy detection, reduce false-vacancy signals, and add features such as count estimation. These approaches include deep-learning based approaches [
17,
18], as well as time-frequency and wavelet signal processing [
19]. The installation cost, privacy concerns, lag times, or persistent inability to detect sedentary individuals has prevented sensors that can truly detect the presence of sedentary occupants from penetrating the market. However, recent developments in Doppler-radar occupancy sensing are promising because they detect breathing motion [
10,
12,
13] and are being shown to reliably detect the presence of sedentary occupants in realistic settings [
14], including in vehicle cabins [
20,
21,
22].
Many different Doppler radar architectures have been used for occupancy sensing, including quadrature heterodyne continuous wave (CW) [
15], single-channel heterodyne CW [
7], quadrature direct conversion CW [
10], frequency-modulated CW [
12,
13], and single-channel direct-conversion CW [
14]. A single channel direct down-conversion CW Doppler radar presents a simple radio architecture suitable for compact low-cost implementation; however, its detection sensitivity varies with antenna position [
11]. A 24 GHz radar system was demonstrated effective for detection of human breathing regardless of antenna position; however, higher propagation loss and higher hardware cost are still limiting factors at millimeter-wave frequencies [
11]. While the single-channel direct-conversion Doppler-radar sensors have been successfully tested under both laboratory and realistic conditions, there exists no comprehensive testing method for benchmarking their performance.
To the best of the authors’ knowledge, the test methods developed by the Lighting Research Center (LRC) [
23] and the National Electrical Manufactures Association (NEMA) [
24] are the only two existing test methods that fully describe how to characterize the performance of PIR occupancy sensors. The latter is regarded as a standard in the industry. The NEMA standard defines test procedures for ‘major’ and ‘minor’ motion. The test is conducted in a specified x-by-y area divided into a
×
grid. The device under test (DUT) is mounted per the manufacturer’s instructions or as provided by the test method. Major-motion testing is performed by a human subject traveling through grids parallel to either the x or y axis from center to center. If the DUT detects the movement, that cell is recorded as a success. Minor-motion testing is performed using a robotic arm placed in a test grid. If the DUT detects a
motion of the robotic arm, that cell is recorded as a success. In the end, the NEMA test will generate a map of
×
squares in which the detection area of the major motion and the detection area of the minor motion are marked out individually.
While the NEMA test method provides a tool to generate data to predict performance of traditional products, it is developed specifically for detection of large motions using PIR sensors. Doppler radar sensors can detect human presence based on human respiration, and thus require testing of detection of small motions, representing human breathing. In addition, single-channel CW radar architecture requires consideration of antenna placement for robust assessment.
This paper presents the design and implementation of a mobile target developed specifically to represent human breathing and a test method for assessing sensitivity of a single-channel CW Doppler-radar occupancy sensor. Devices and methods have not previously been reported to enable comparison of coverage patterns of detection of stationary occupants that are only breathing, and have not taken into account the variation in sensitivity within each wavelength of range that is inherent in this type of occupancy sensor. This novel target and method enable reproducible generation of coverage patterns for detection of occupancy based solely on breathing motion for single-channel CW Doppler radar-based occupancy sensors.
2. Mechanical Target
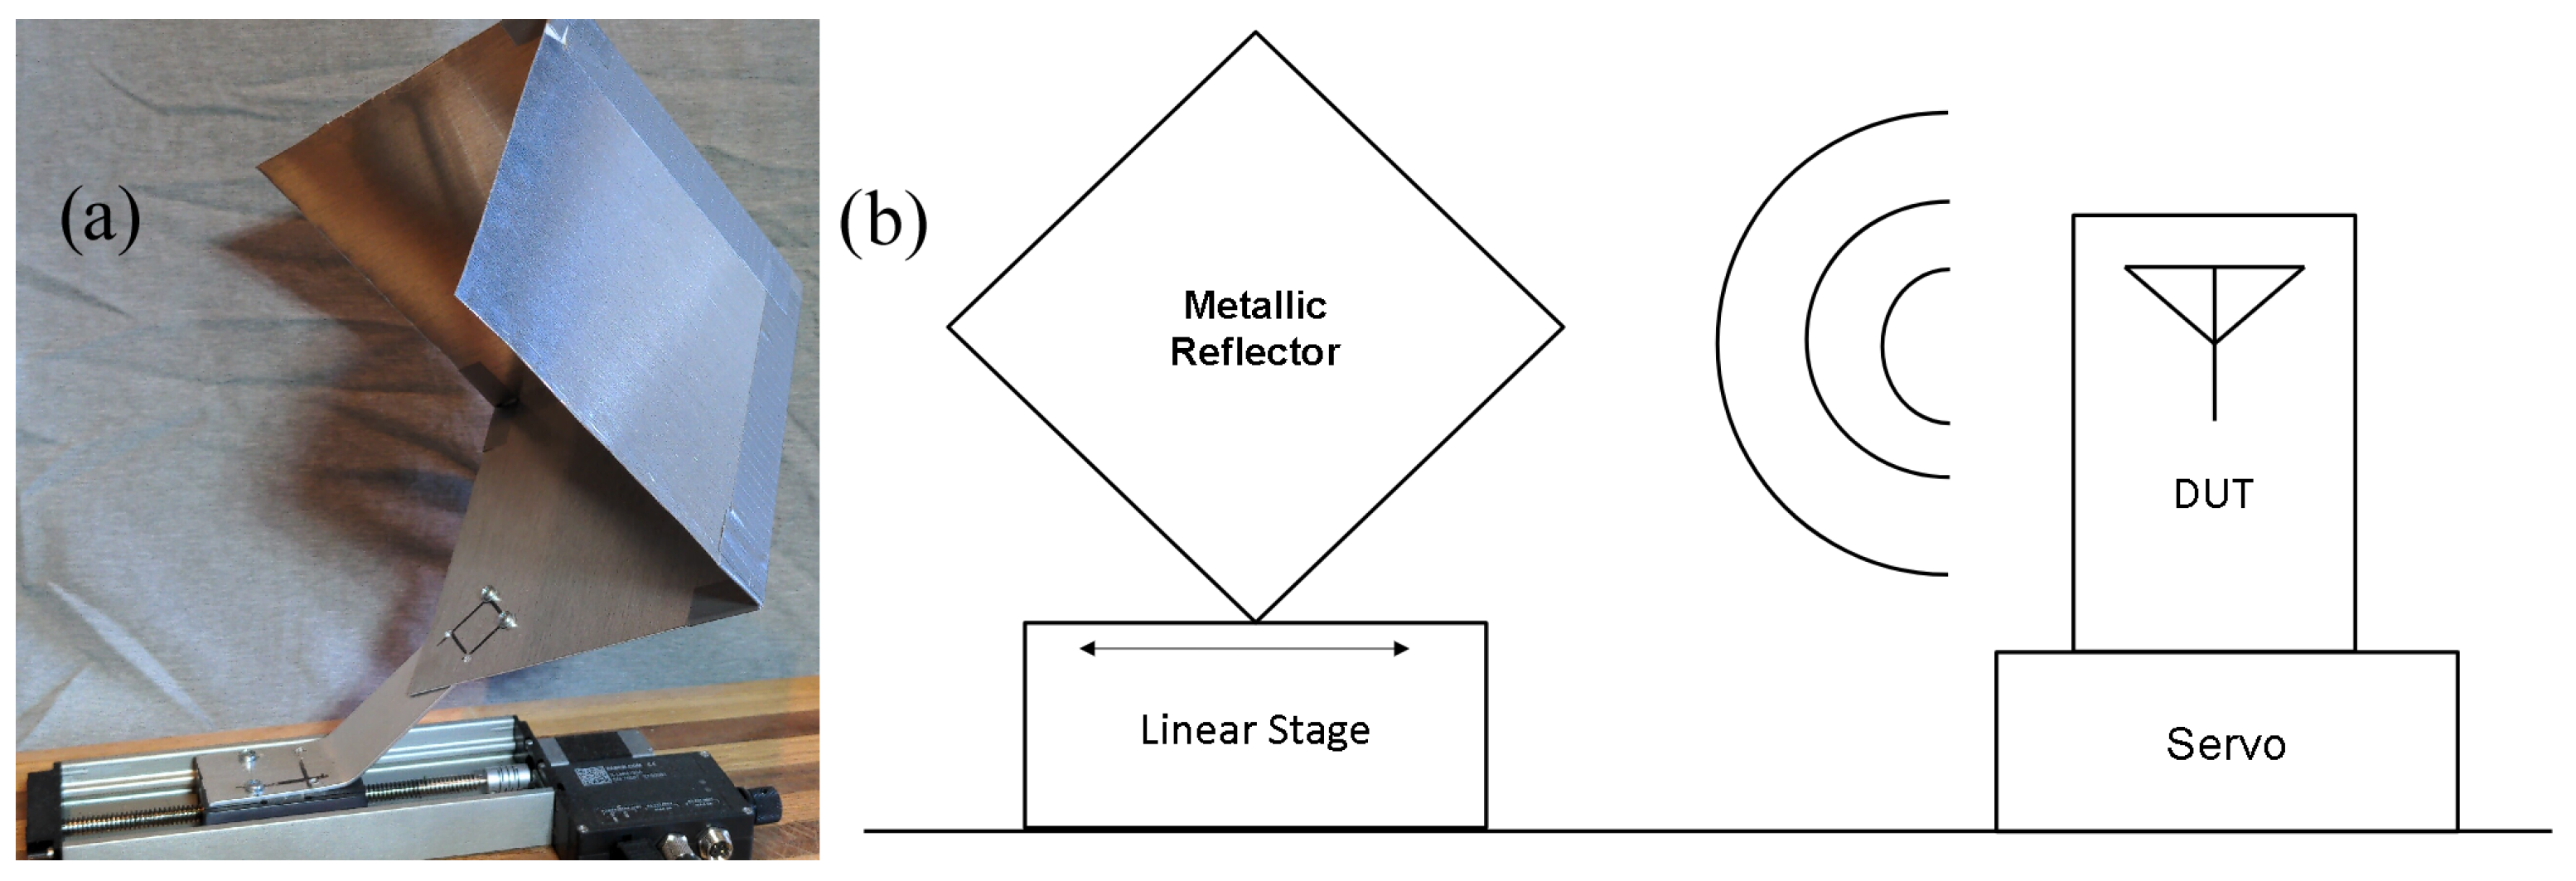
To measure the performance of the DUT, we use a target consisting of a programmable mover stage with a mounted metallic reflector, shown in
Figure 1a. The mover stage itself typically consists of a controller, a servo, and a platform mounted to a screw attached to the servo; the mover operates such that as the servo turns the screw, the position and rate of movement of the platform can be precisely controlled along the axis of motion. A diagram of the test setup is shown in
Figure 1b. The metallic reflector reflects the electromagnetic signal emitted by the DUT antenna during operation.
While both NEMA and Lutron already define targets for fine-motion tests (3
× 15
or 4
× 6
robotic arms, respectively, that ‘wave’ at
) [
24,
25], these targets are still intended to simulate a relatively large arm motion. By contrast, the target described herein is intended to simulate a much smaller motion resulting from human breathing.
For a single antenna system, the power
(W) received at the antenna from a given target is expressed in (
1):
where
is the transmitted power (W),
G is the antenna gain,
is the transmit frequency wavelength (m),
is the radar cross section (RCS) of the target
, and
R is the range between antenna and target (m). For a mechanical test setup intended to approximate the behavior of a human target, matching
requires
of the mechanical target be matched to that of a human target (as all other variables are unchanged).
Body posture, BMI, and gender produce different effective RCS [
26,
27,
28] in the range between 0.2–2
. Mechanical target
of ∼1
was selected as an average value of
for a sedentary human target, taking into consideration effective RCS variation with body position with respect to the antenna [
26,
27,
28]. The trihedral corner reflector type was selected for having a high RCS per unit size of the reflector elements, ease of manufacturing, and a relatively wide (∼±60
) 3 dB beam width. This corner reflector angular characteristic of RCS reduces sensitivity to antenna-target alignment mismatches, which is particularly important for testing sensor range at larger distances of up to 7 m. The RCS of this reflector type is provided by (
2) [
29].
where
L is the edge length of each of the three square reflector elements, and
is the wavelength corresponding to the transmit frequency of the transmitter. Per (
2), an edge length of 14 cm was selected for the reflector elements, yielding
of
to
at transmit frequencies between 2.4–2.5 GHz.
The above approximation for the reflector RCS is only valid when the radar is operating in the far field. The far-field requirement is satisfied when
where
d is the radar-target distance, and
D is the largest dimension of the moving area of the target [
27]. For the trihedral reflector with 14 cm edges,
D is the diagonal corner-to-corner distance of the cube formed by the reflector edges, so therefore
, thus requiring
. This requirement is satisfied for all test cases described in this paper.
The square reflector elements and the mounting post are cut from sheet aluminum available from a typical hardware store. Reflector elements are bonded together via standard mechanical techniques (e.g., pressure-sensitive tape). The assembled reflector is attached to the linear stage via mounting holes on the top of the stage (the stage used requires M3 × 0.5 screws).
The mover stage is a Zaber X-LHM100A linear stage; it has a built-in controller that communicates with a PC via USB, and supports multiple programming languages, including C++, Python, and Matlab. The stage is capable of arbitrary movement anywhere along the axis, and the provided libraries have native support for the sinusoidal movement paths utilized in the test method, which is implemented via Matlab. Per the manufacturer specifications, the stage has a unidirectional accuracy of 125 µm, repeatability less than 4 µm, and a speed resolution of 76 nm/s. The metallic reflector is affixed to the mover stage via mount holes on top of the mover stage. The target is programmed to oscillate at a freqeuncy of 0.3 Hz with a peak-to-peak displacement amplitude of 1 cm. Normal respiration displacement ranges from 4 mm–12 mm in a frequency range of 0.2 Hz–0.34 Hz (12–20 breaths per minute). At 2.4 GHz, with the corresponding wavelength of 12.5 cm, maximum respiration displacement would be less than 10% of the wavelength.
3. Device under Test
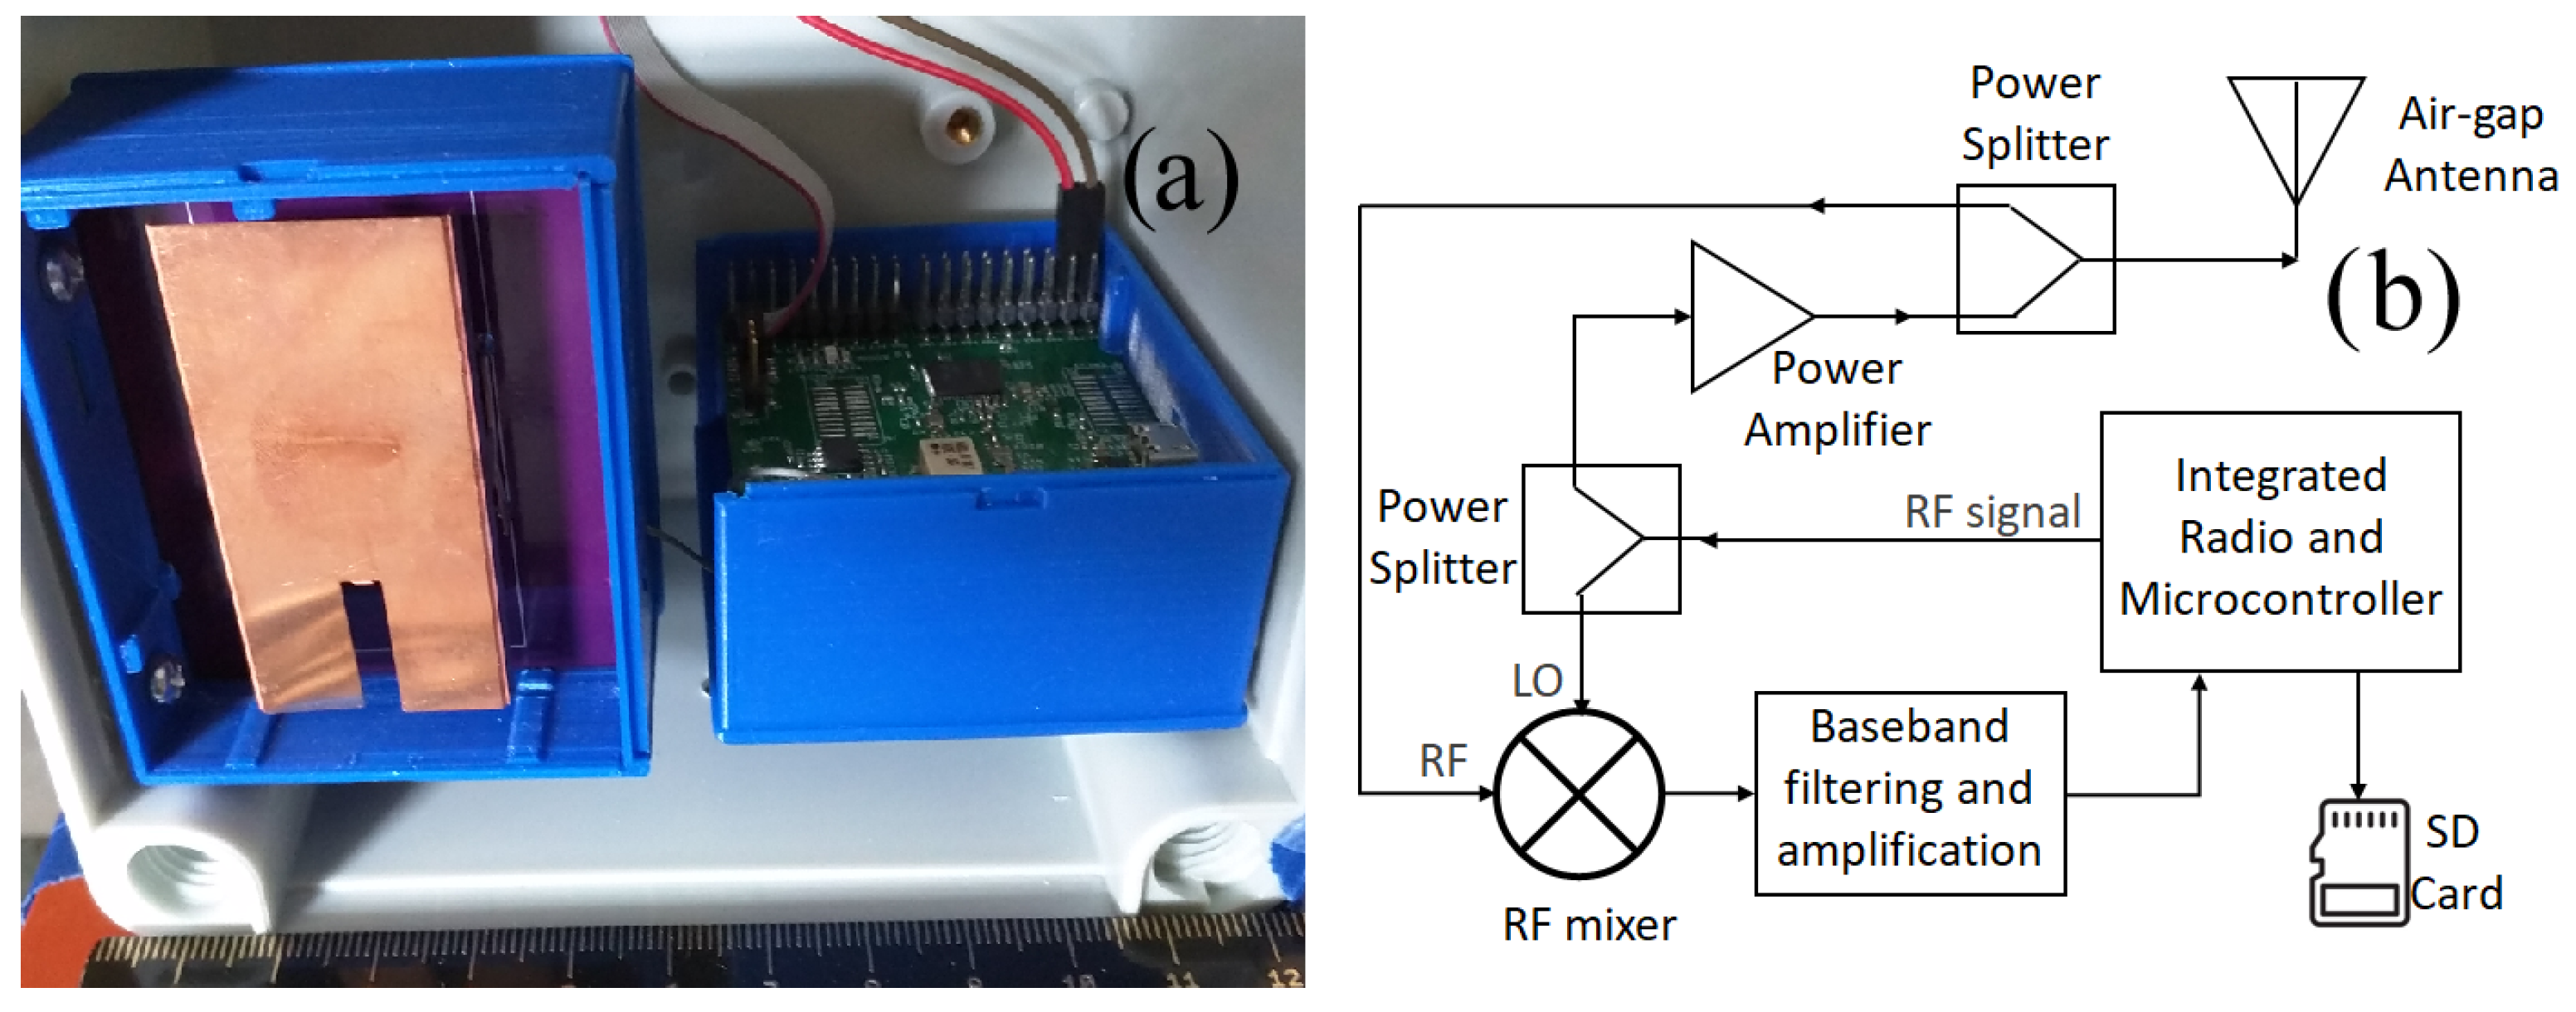
The True Presence Occupancy Detection Sensor (TruePODS) used as the DUT in this paper is shown in
Figure 2 [
14]. It is comprised of a programmable microcontroller with a built-in radio and ADC, a custom-designed antenna that performs as both transmitter and receiver, an RF signal chain, and signal-conditioning electronics that perform the function of a baseband signal amplifier.
The RF transmitter operates inside the standard ISM radio band (transmit frequency can be set between 2.4 to 2.5 GHz), with a peak power level of 16 dBm at the antenna port (a total radiated power of ∼40 ). The 2.4 GHz ISM band is used for low propagation loss and readily available low-cost radio components. Single channel instead of an in-phase/quadrature (IQ) receiver design lowers the hardware footprint and signal processing complexity.
The microcontroller radio transmits an RF signal which is split and sent to the LO port of the mixer and the power amplifier prior to transmission at the antenna. The received signal is fed to the RF port of the mixer which down converts the target signal to baseband. The baseband signal is then filtered and amplified before feeding to the microcontroller for digitization and processing. The custom-designed antenna is an air-gap patch antenna with a 3 dB beamwidth of about . An SD card slot permits local storage of the received signal data for later analysis.
4. Test Method
To quantify the performance of a DUT, we defined a testing method to measure the system’s real-world sensitivity. This method is designed to be automated and easily repeatable. The method specifies the DUT is deployed in an open room that is free of objects (e.g., open doors, fans, people, etc.) other than the computer-controlled mobile target placed in a fixed position at a specified distance from the DUT, and at which the DUT’s antenna is pointed.
Mounted to the target is a reflector comprised of metallic plates that reflect the signal emitted by the DUT back to the antenna. By programming the target to move with a periodic motion while the DUT transmits and records data (which can be recorded either by computer via a debug interface or to the local storage), we achieve a reasonable simulation of a breathing sedentary human target whose motion is readily repeatable.
Note that due to how the received reflected target signal mixes with the transmitted signal in the mixer of the homodyne receiver in the DUT, the desired output signal is subject to periodic attenuation, where the amount of attenuation is a function of the transmit frequency and the distance between the antenna and the center position of the oscillating target. Positions of minimal attenuation are called optimum points, while those of maximum attenuation are called null points. These points alternate and regularly repeat at distance intervals of
, where
is the wavelength of the transmit signal [
11]. For a DUT transmitting at 2.4 GHz,
is
, and thus the distance between adjacent null and optimum points occurs every
. The result is that small changes in the position of the target or the DUT in the test setup can render the output data unusable, since different tests would have different unknown attenuation values. To correct for this, the target is programmed to repeat its periodic motion multiple times, with each iteration increasing the initial distance between the antenna and target by some fractional amount of the distance between null and optimum points, with the step value chosen to ensure passage through at least one null and one optimum point, requiring a total change in the radar-target distance of
. This technique has previously been demonstrated [
30]. For example, for a 2.4 GHz transmit signal in a test where the target is set to repeat its sequence eight times, the distance increment between each of the eight test sequences will be set to
, yielding output data where the target moved through both one null and one optimum. This ensures each test will contain data on one each of null and optimum points, and allows for direct comparison of different test sets (e.g., comparing just optimum values). During each part of the null/optimum test, the mobile target oscillates with a sinusoidal pattern, with an amplitude of 5 mm at a chosen frequency (typically ∼0.3
) for at least 60 s. This null/optimum effect is observed in human measurements [
31]; however, due to the topology of the human body and the small null to optimum distance of only 15.625 mm at 2.4 GHz, it is not likely that a human subject would be exactly at a null point at any given time.
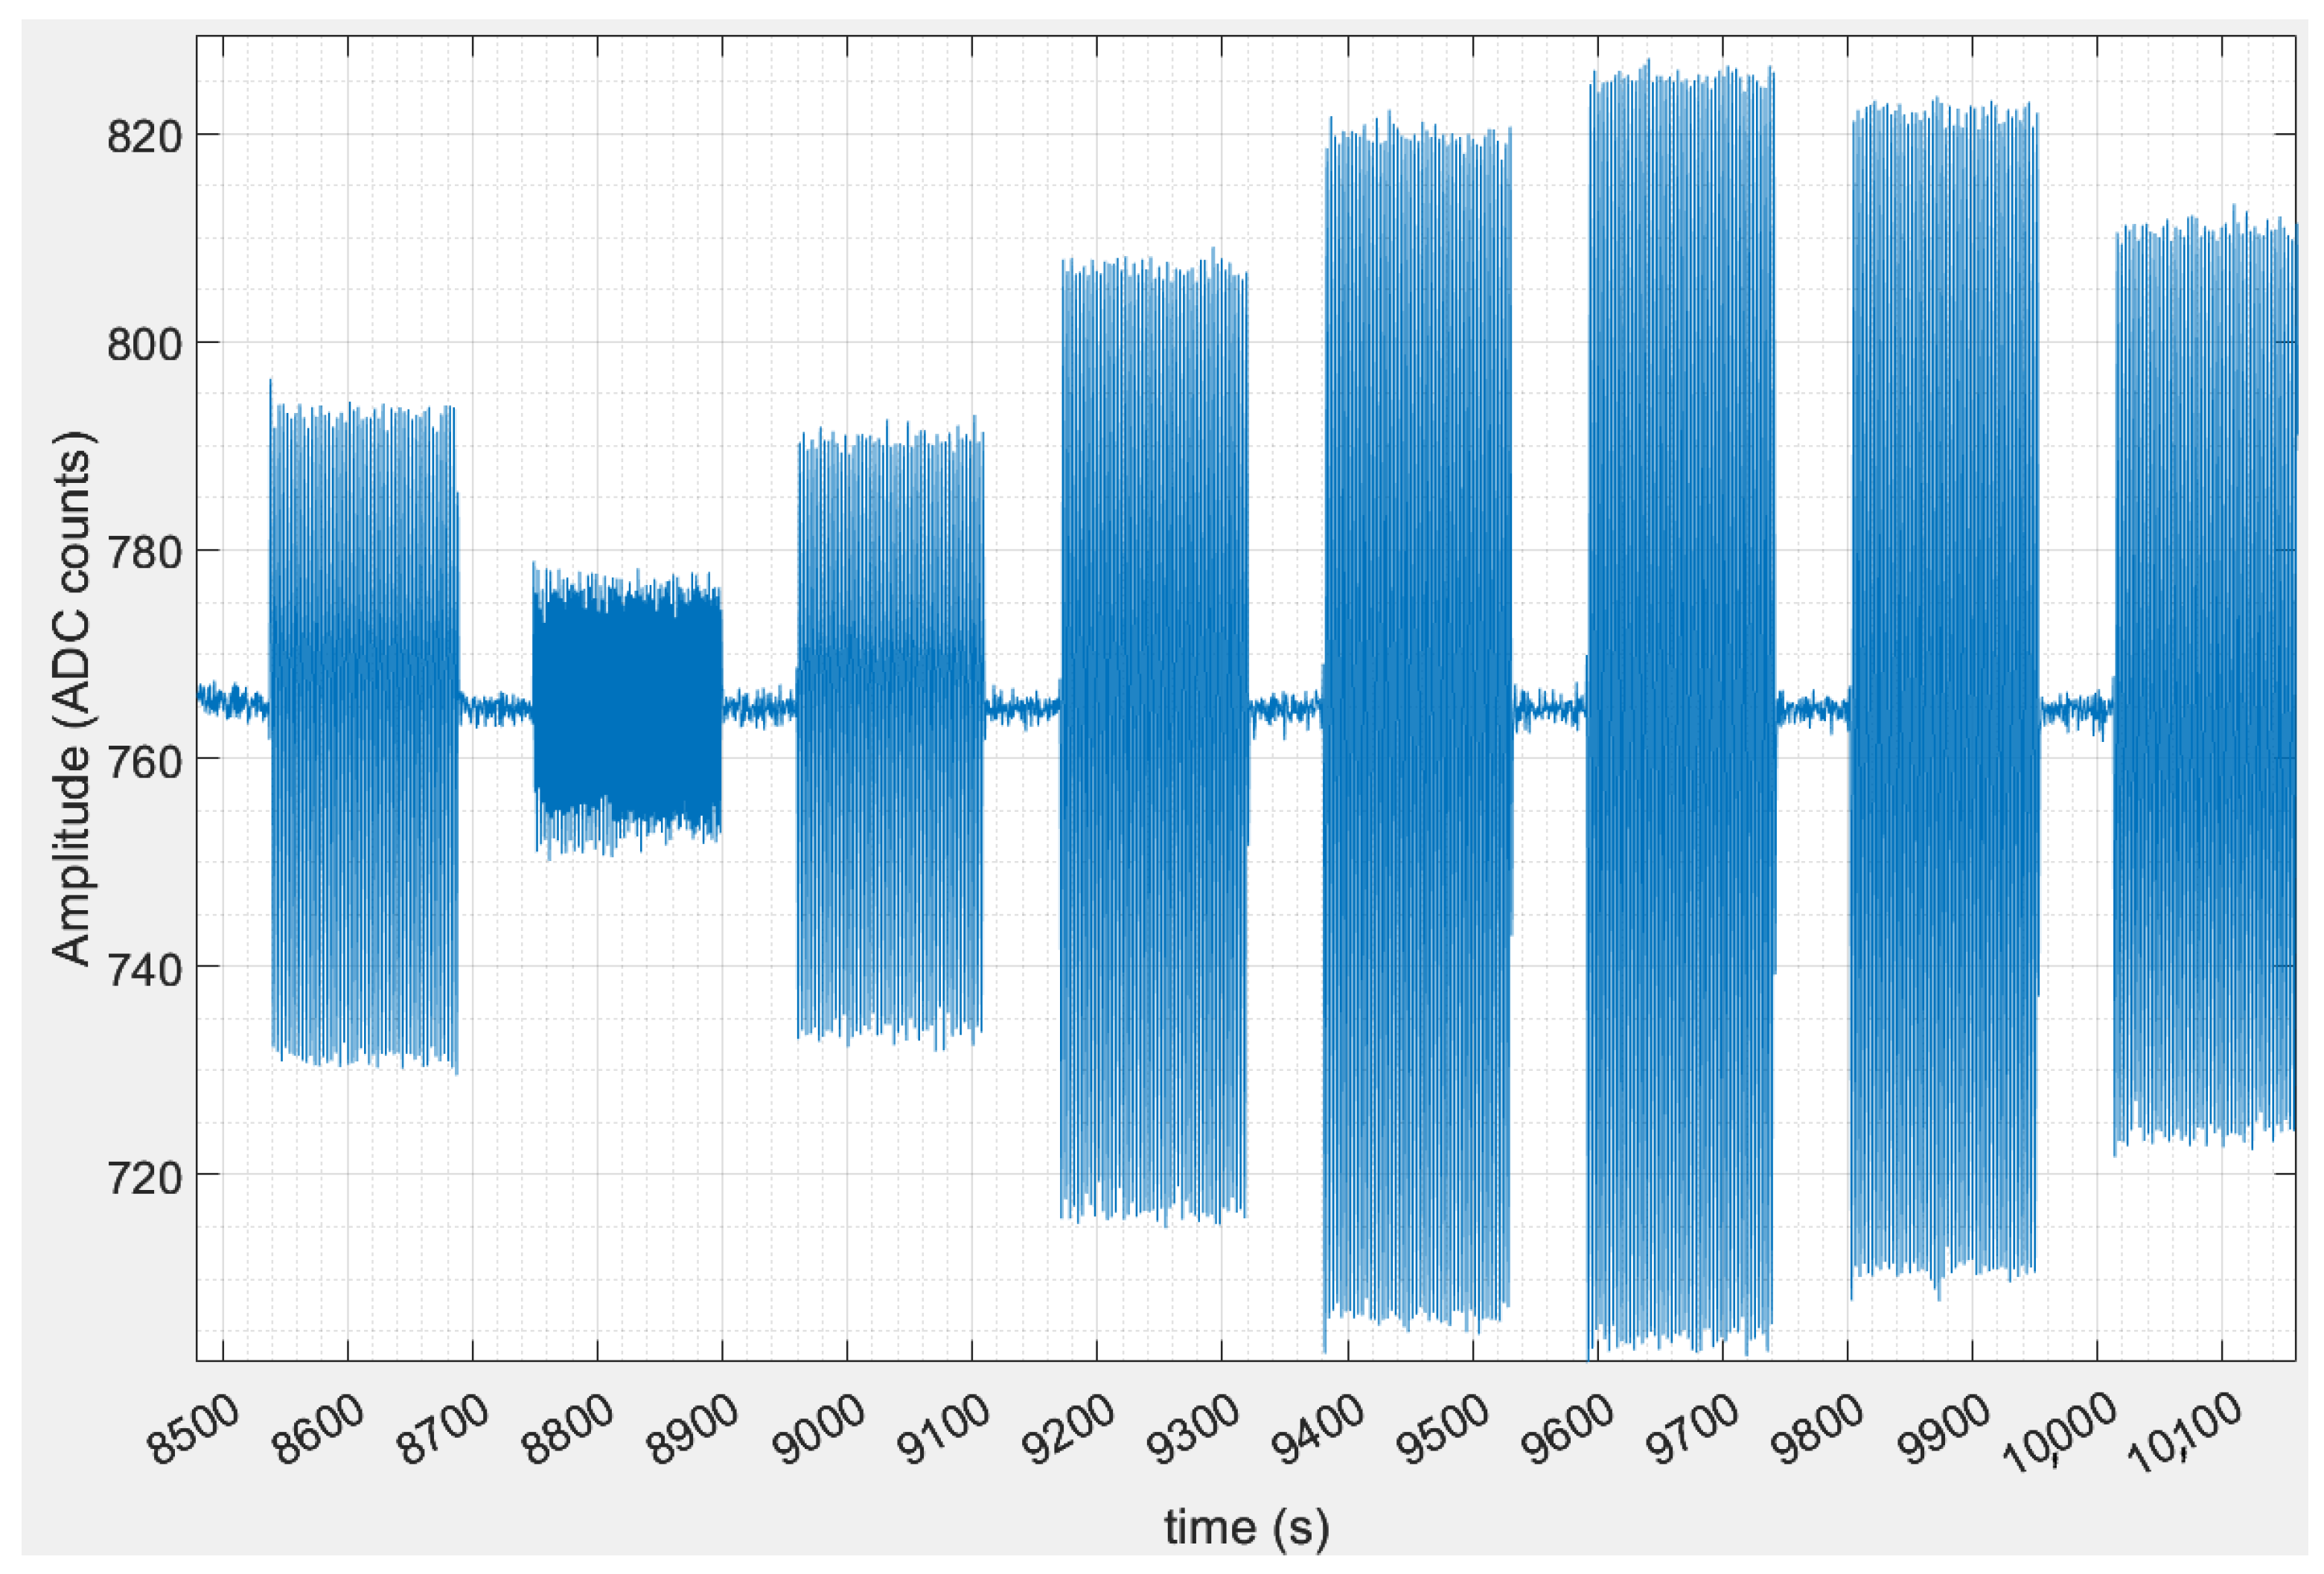
An example of the resulting time-domain output data generated using this technique is shown in
Figure 3. The shown data is an eight-loop subset of a longer test run, where the displayed time-domain data is FIR filtered with corners at
and
and order = 300. DUT transmit frequency was 2.4 GHz, yielding
, and the initial target distance is
. Target frequency of oscillation was
, with an amplitude of 5 mm. For the eight-loop sequence used, the distance increment between loops was
. The amplitude axis is presented as digitized counts in the analog-to-digital converter; the ADC uses 11 bits of resolution over the 3.3 V range of the input signal, yielding a conversion factor of 1.611 mV per ADC count.
5. Results
5.1. Validation
To measure the output signal amplitudes of measurements made with the mover, the mover was programmed to move to a new position, pause for a period of time, and then start moving with a sinusoid with the frequency and amplitude specified for the test. The output of the radar was processed in MATLAB to divide the signal into periods where the mobile target was stationary and where it was moving. The signals in these periods were bandpass filtered with a 0.1–1 Hz passband using a 300-order FIR filter. A discrete Fourier Transform using a fast Fourier transform algorithm was applied to each of a series of sliding windows for each period where the target was moving, and then amplitudes were retrieved for the FFT peaks at the expected target frequency (e.g., 0.3 Hz for the mobile target) for each window. In each case, a 30 s rectangular window with 10 s of overlap is used, generating several amplitude values for each mover period. Note that with the 100 Hz sampling rate used by the DUT, the number of FFT points used for all of the FFTs presented in this manuscript were 3000, 2000, or 1000, for the 30 s, 20 s, or 10 s wide sampling windows used, respectively.
For the mobile target, the sliding windows of FFT amplitudes were derived for each of the optimum-point, mid-point, and null-point cases. In the sample data shown in
Figure 3, these points correspond to the periods for
to
with an average amplitude of ∼120 ADC counts pk-pk,
to
with an average amplitude of ∼90 ADC counts pk-pk, and
to
with an average amplitude of ∼25 ADC counts pk-pk, respectively. The regions where amplitudes are below ∼10 ADC counts (e.g., from about
to
) are
delays between each test sequence where the target does not move at all, and thus show the noise floor; these delays provide identifiable gaps between each test sequence. This data was compared against data taken for a human target, where the human target was instructed to sit still in a chair and regulate breathing rate by using a metronome. For the human target, data was recorded for
and processed using the same filtering and windowing (except in a few cases,
of overlap was used, to increase the total number of windows to compensate for the increased irregularity of the human target’s motion). The human target data was repeated multiple times using slightly different seating arrangements, to capture a variety of orientations that could affect the sensitivity of the radar. These orientations include the following: 1. The radar is placed 1 m above the floor, with the antenna main lobe pointed parallel to the floor at the target who is seated facing the radar with a sternum height of about 90 cm (this is analagous to the testing with the mobile target); 2. Radar raised to 1.78 m and the radar angled at a declination of
; 3. Radar declination angle increased to
; 4. Radar raised to 2.55 m, declination increased to
, and target sternum height reduced to 60 cm. In all human-target cases, the radar is aimed full-frontal at the human target, since this orientation is expected to yield an average RCS compared to side and back [
27,
28].
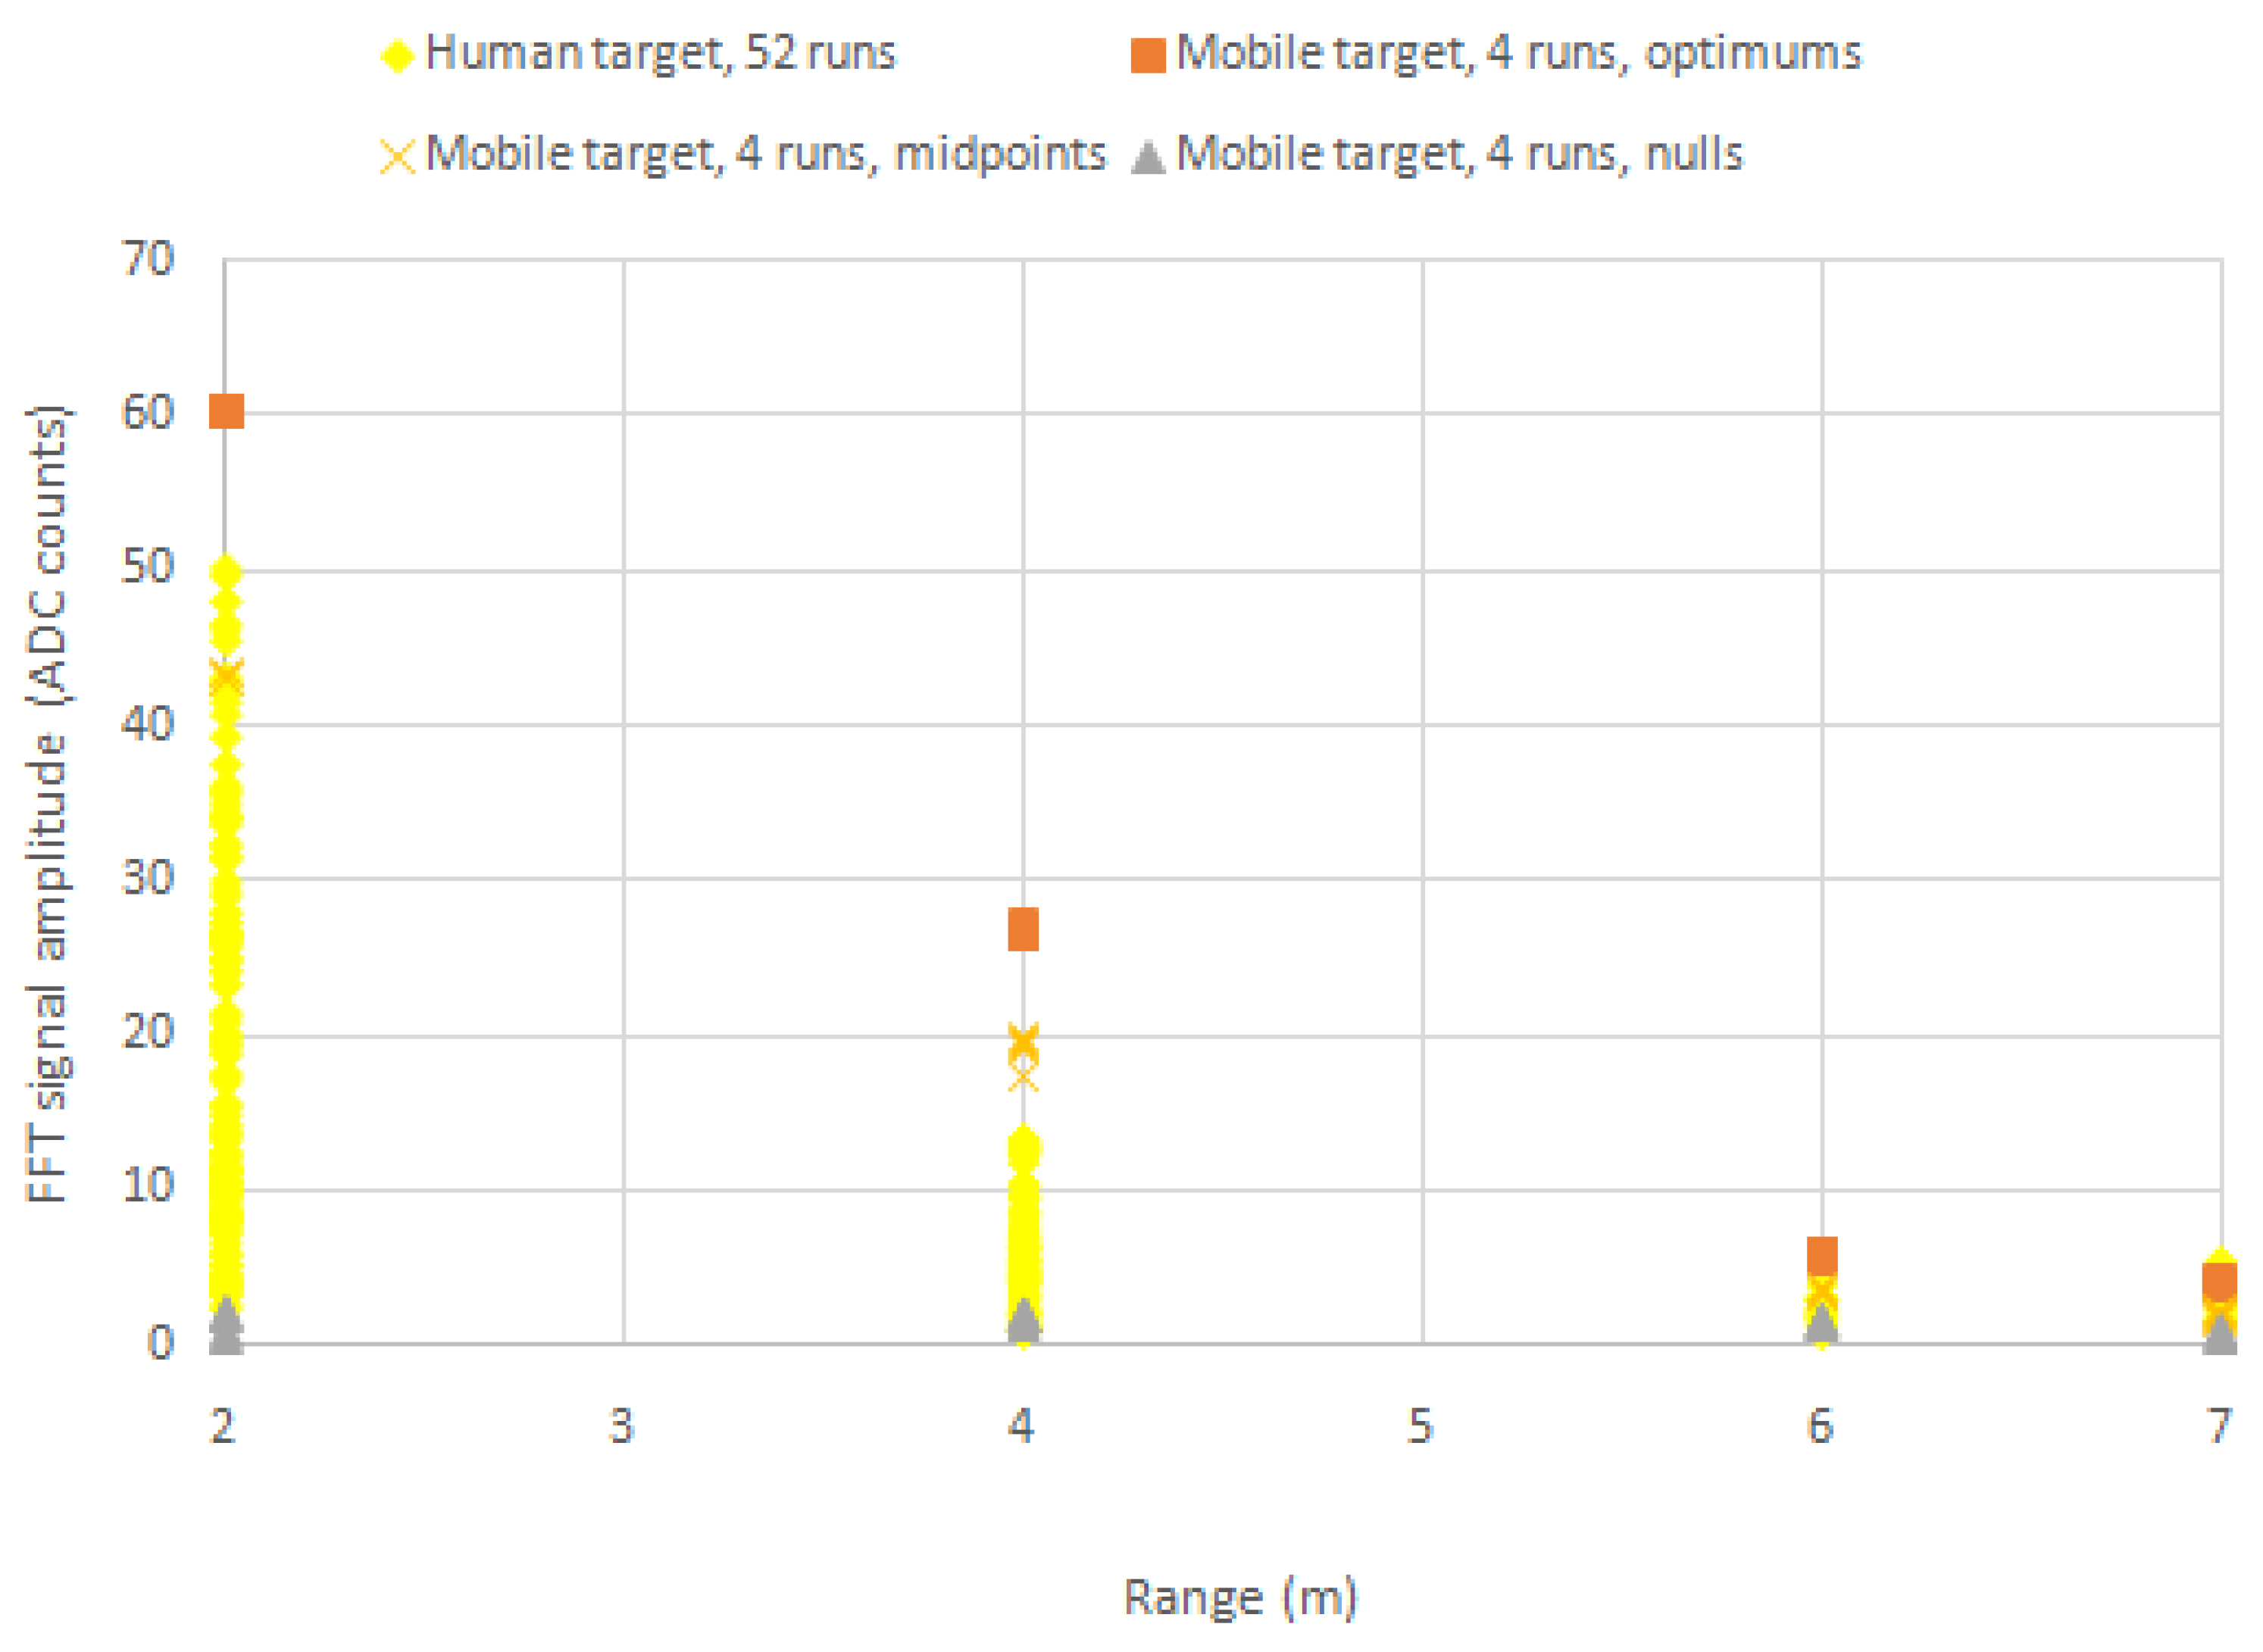
The resulting data for both the mobile and human target are plotted as amplitude of the corresponding FFT peak vs. target distance, as shown in
Figure 4. For each target, the listed distance is the horizontal distance between the target and the DUT, and does not account for the changes in effective radar-target distance due to the various radar-to-target orientations provided above. Effective distance will be slightly larger than the range bin (2, 4, 6, or 7 m) listed, depending on the orientation used for a given test run. For each test run, a 30 s sliding window was applied to the time-domain data over the length of the run, an FFT was applied, and the amplitude of the peak corresponding to the target’s frequency of oscillation (0.3 Hz for the mobile target, and either 0.2 Hz or 0.33 Hz for the human target) was recorded for each window. For the mobile target, the sliding window used 10 s of overlap. For the human target, either 20 s or 10 s of overlap was used. The plot shows that the human target data varies broadly over the course of multiple test sequences, but generally fall within the range defined by the null and optimum point values established by the mobile target, demonstrating the mobile target as a reasonable substitute for a human target.
Also, note how the data points for the various sliding windows for the mover are all clustered around similar values, visible in
Figure 4, which shows the uniformity and repeatability of the mobile target. Contrast this to the human target data which varies substantially from test to test, including across sliding windows of individual test sequences.
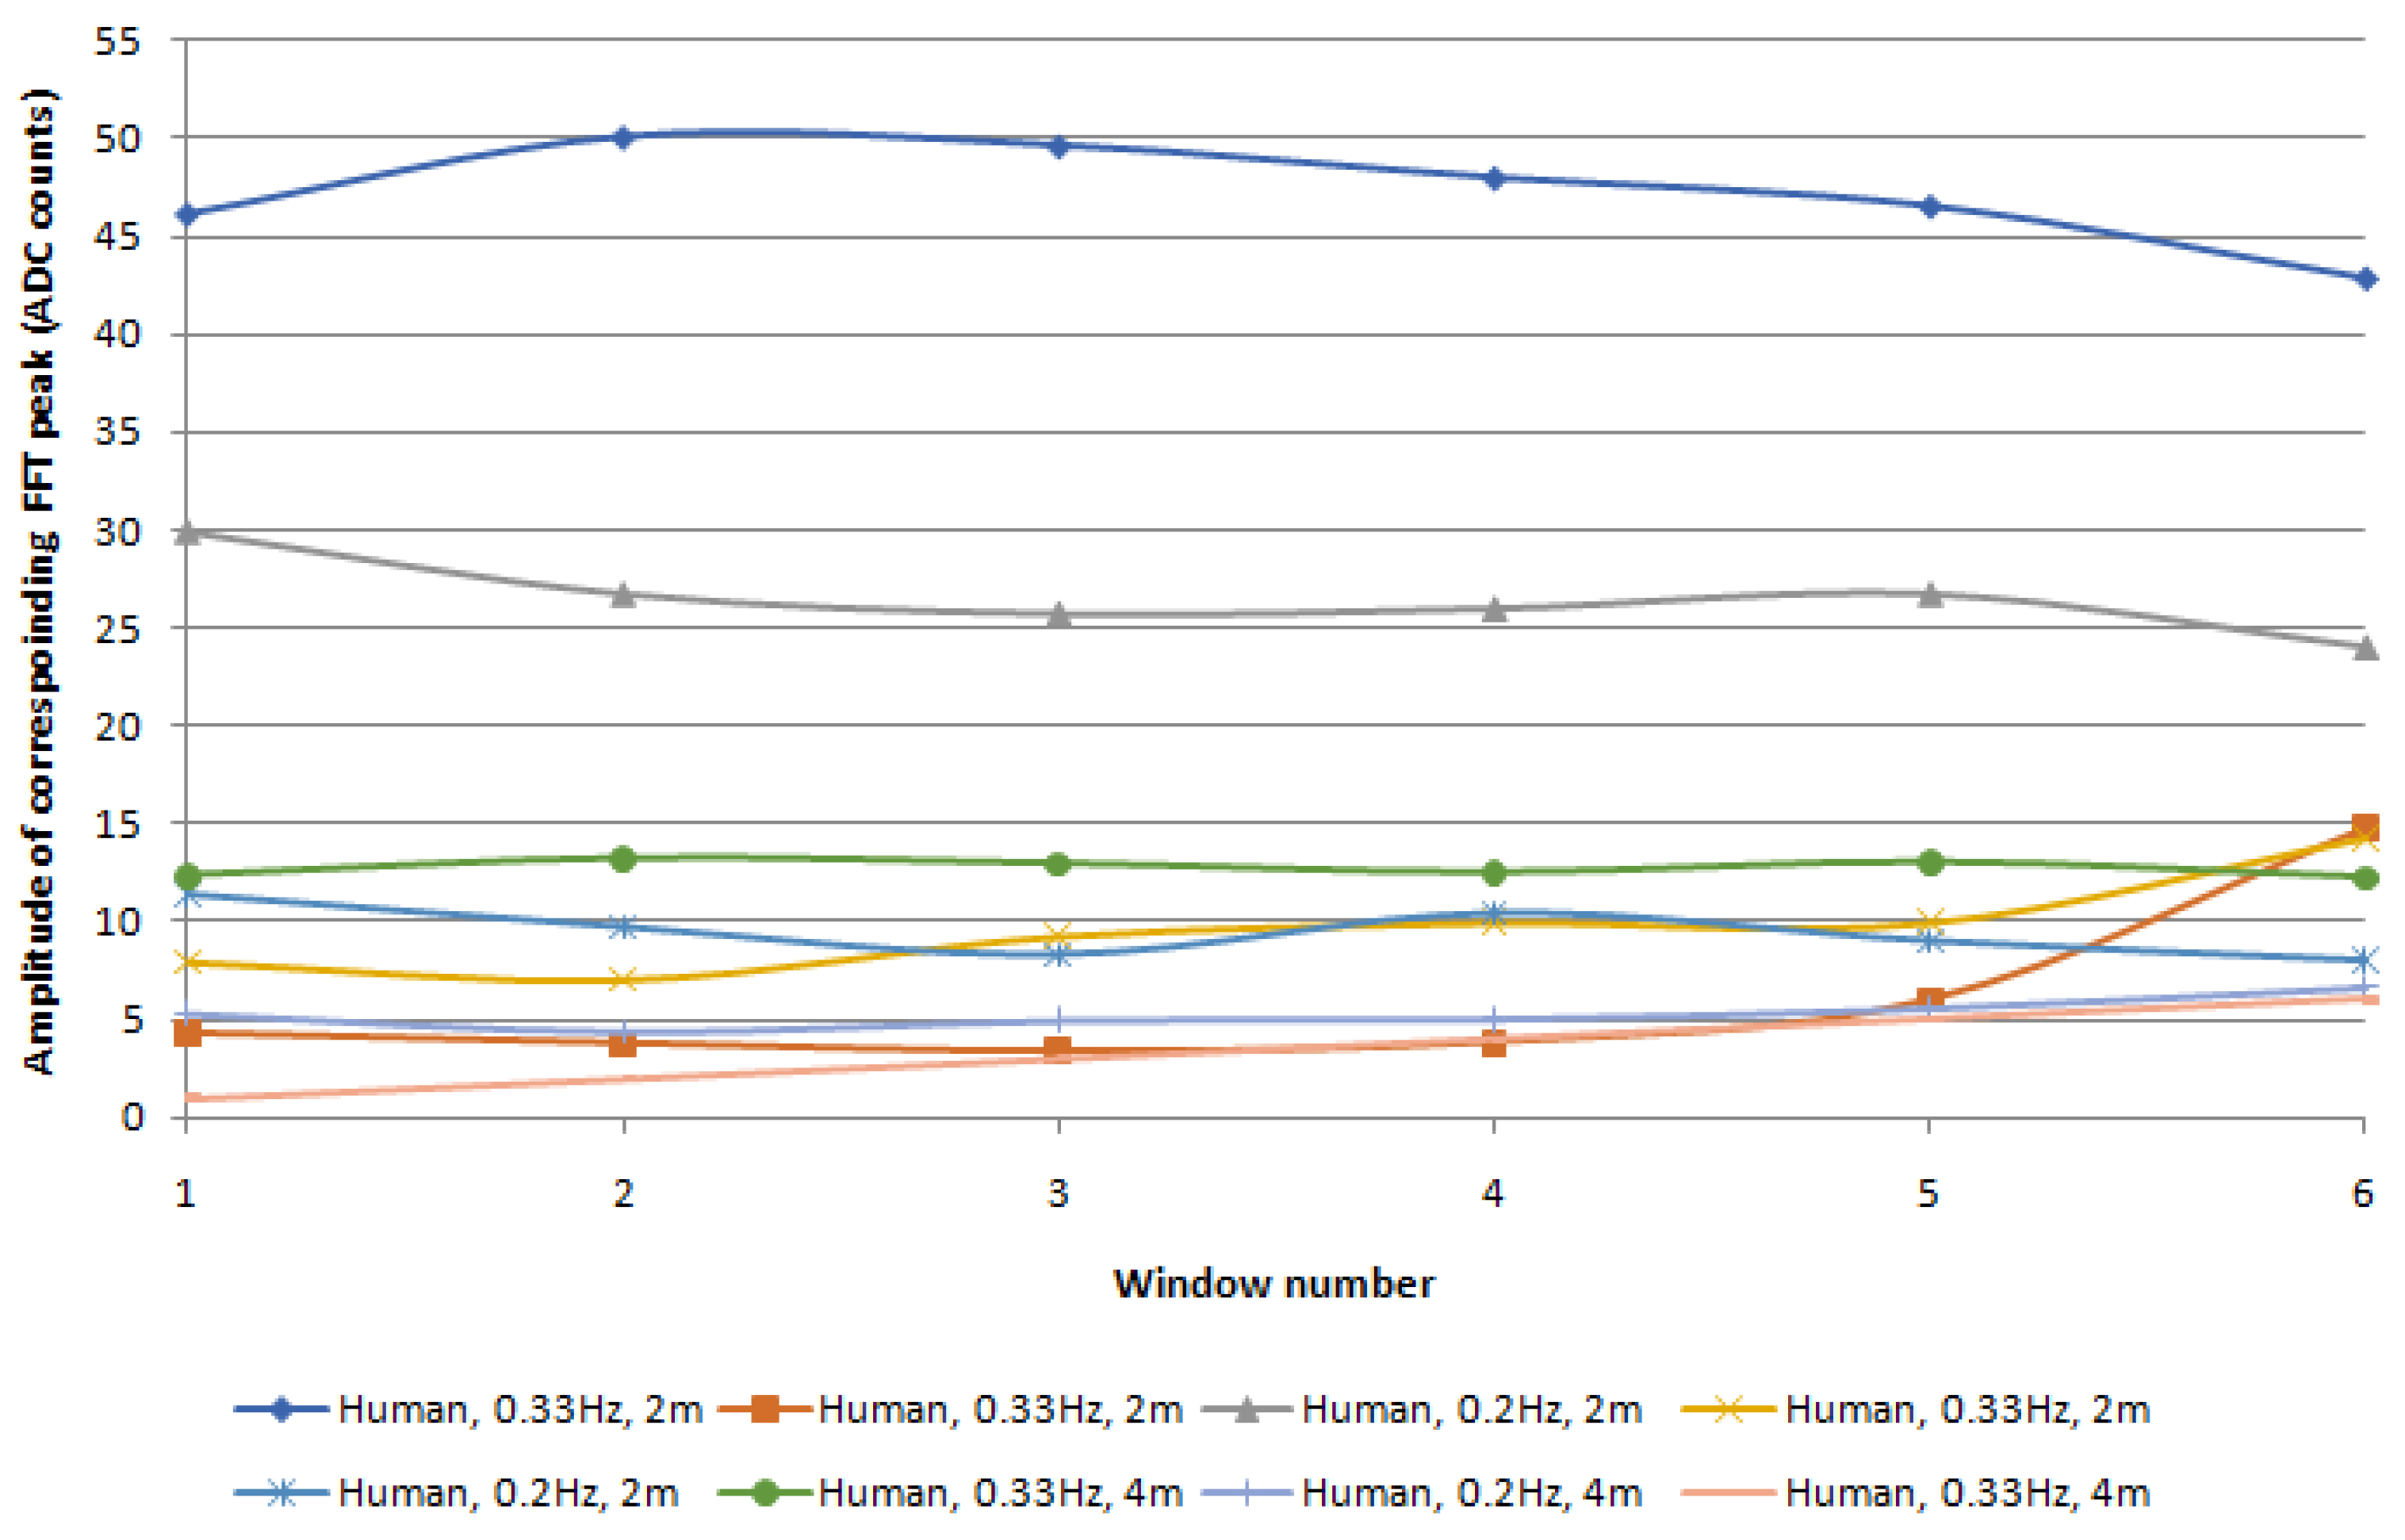
Figure 5 plots the test data for several of the human target tests, showing individual test runs plotted and window number vs. FFT amplitude of the corresponding frequency peak for the target, for 30 s sliding windows with 10 s of overlap. This better shows the variability within individual test runs.
5.2. Angle Testing
Angle testing is performed to generate a coverage diagram, showing the range for the DUT within which a target will be detected via a detection algorithm developed in a previous study [
14]. Here, data was taken at antenna-to-target distances of 2, 4, and 6 m, with the relative antenna-to-target angle set from
to
in
increments where
indicates the target is in the center of the antenna’s main radiation lobe.
The mechanical-target angle testing data is first processed to divide it into subsections that include the data for each range and angle combination (e.g., 2
@
), which is further subdivided into the optimum, midpoint, and null point data for that specific range and angle. The detection algorithm first calculates the bandpower between 0.1–0.5 Hz using the 60 s idle-target radar data that immediately precedes the moving-target data for each subsection and uses it to determine the threshold value. The calculated bandpower of idle target radar data are then fed to a Kernel fitting function using Matlab to find its average and standard deviation (STD).
Figure 6 shows the Kernel distribution of the bandpower of idle target radar data. The calculated mean and STD of the fitted Kernel distribution are 1.5
and 1.3
, respectively. The threshold is set as the mean plus 1.5 times the STD, to optimize detection rates [
14]. The algorithm then calculates the bandpower in the same bandwidth for the moving-target data. Detection is considered successful if the moving-target bandpower exceeds the threshold value. A polar plot showing the detection results for the DUT at various range and angle combinations is shown in
Figure 7.
For the cases of both the optimum and midpoint amplitude data, the plot shows that the DUT successfully detected the target at all tested angles at the 2 m and 4 m ranges, and at most of the angles at 6 m (excluding only the , , , and cases). As expected, performance was not as good when considering the null-point amplitude data, showing good, but not complete, detection at each of 2 m and 4 m distances, and successful detection at only one angle at 6 m.
These results demonstrate acceptable sensitivity for targets out to at least a 6 m distance over at least a
cone. As visible in
Figure 7, the sensitivity inside the cone is not uniform with respect to the ± angle offset (e.g., sensitivity for
is not the same as for
at 6 m); the positive angles generally yield higher sensitivity than the corresponding negative angle, as seen in the optimum and midpoint data sets at 6 m. The lower sensitivity in the negative offset angles is due to positioning of the TruePODS electronics relative to the antenna position inside the mounting enclosure; rather than being centered behind the antenna, the electronics are positioned such that they are closer to the straight line path from the antenna and target at negative angles, thus causing greater interference for targets positioned at those angles.
The polar plot shows the coverage pattern for the moving target, which represents a human occupant that is completely stationary except for breathing. Where nulls, midpoints, and optimums are detected, the false-negative rate should be near zero.
Figure 6 shows the probability distribution of the empty room data. With this distribution, when the threshold is set at the mean plus
standard deviations, the false positive rate is
. Previously developed methods [
24,
25] can be used to determine the coverage area for small motions and large motions.
It should be noted how the results obtained here are conservative compared to the results in [
14] in which the DUT was tested in a more realistic environment. Since the objective of this paper is to present a tool and a procedure to evaluate the sensitivity of a single-channel CW Doppler-radar sensor, a metal mechanical target is used instead of a human target, while the DUT is placed on a servo. Due to the size of the lab space used and the servo’s rotational limit of motion, the maximum distance tested was 6 m, and the maximum angle width tested was
, but this does not represent the operational limits of the DUT. In [
14], when the DUT was mounted near the top of the wall of a 3.4 m × 8.5 m conference room, the respiratory rate of a sedentary seated human subject was detected in the two far corners which were over 9 m from the sensor, and in one near corner which was at a
offset angle from the sensor.


