Article

Simulation of an Ultrafast Charging Station Operating in Steady State

by
Alexandra Blanch-Fortuna
,
David Zambrano-Prada
,
Martín Gállego-Casals
and
Luis Martinez-Salamero
*
Group of Automatic Control and Industrial Electronics (GAEI), Department of Electrical, Electronic and Automatic Control Engineering, School of Electrical and Computer Engineering, Campus Sescelades, Rovira I Virgili University, 43007 Tarragona, Spain
*
Author to whom correspondence should be addressed.
Electronics 2023, 12(23), 4811; https://doi.org/10.3390/electronics12234811
Submission received: 26 October 2023 / Revised: 19 November 2023 / Accepted: 26 November 2023 / Published: 28 November 2023

Abstract

:
This report presents the analysis, study, and simulation of an ultrafast charging station (UFCS) for electric vehicles (EVs) operating in steady state. The electrical architecture of the charging station uses an ac bus plus two dc buses and it is supported by a storage system based on batteries and super-capacitors. The power demand of the EVs is established taking into account the electric characteristics of their batteries and the availability of the station charging points. The analysis introduces a supervisory control based on a state machine description for different operating modes, which eventually facilitates fault detection in the electrical architecture. In addition, the study proposes different methods to handle the required energy for the charging demand and a procedure for the correct sizing of both the energy storage system and the input transformer. In laboratory experiments in a reduced-scale storage system, a SCADA supervision with CAN communication has proved successful in gathering data corresponding to modes of charge and discharge in batteries and super-capacitors, and subsequently displaying them on a computer screen.

1. Introduction

Fast charging of EVs is a technical and commercial response to mitigate range anxiety while maintaining driving reliability on long-distance journeys. Fast charging stations are composed of stalls similar in shape to a gasoline supplier, with two points of dc voltage providing between 50 kW and 150 kW of maximum power at each point. However, while a conventional vehicle requires around 5 min to fill the gasoline tank, fast charging implies a span of time between 10 and 30 min. In this context, ultrafast charging of EVs intends to reduce the charging time to less than 10 min, which automatically increases the power supply up to 350–400 kW [1]. By combining two points of supply, the existing charging stalls fulfill the high power requirements [2,3,4,5,6,7].
Under the latter conditions, a UFCS with several charging points requires a huge amount of electric energy to handle the high power consumption demand. This involves the connection of the charging station to the medium-voltage (MV) network to ensure the supply of high levels of power and the inclusion of an energy storage system (ESS) to guarantee the reliability of the charging operation [8,9]. The weakest point of the resulting electrical architecture is in many cases the redundant use of power stages, which results in a reduction in the total efficiency of the station [10].
Figure 1 shows the electrical architecture of a UFCS based on a microgrid proposed in [11]. The charging station is supplied by an MV network through a solid state transformer (SST) [12] and distributes internally the electric power by means of an ac bus of 220 V and two dc buses of 600 V and 1500 V, respectively. The 600 V dc bus is an accessory network connected to a photovoltaic panel and a wind generator allowing the insertion of renewable energy sources [13]. The 1500 V dc is devoted to ultrafast charging at four supplying points, each one handling 350 kW. The bus voltage level allows the EV connection in the voltage battery range between 400 and 800 V. The number of charging points is the result of an analysis based on Monte Carlo simulations of the electric characteristics of commercial EVs [14] and real traffic data in the highway AP-7 connecting Barcelona and Tarragona in Spain [15]. The four charging points in simultaneous operation would yield a maximum power of 1.5 MW by assuming 95% efficiency in the power converters.
The ESS is of a hybrid type, consisting of a battery pack and an array of super-capacitors, and is located in the 1500 V dc bus with the aim of handling a direct flux of power to the charging points. The hybrid proposal facilitates the power distribution by relaxing the requirements on the batteries and increasing their lifetime at the same time [16,17]. Nonetheless, the effects of the dynamic transference between batteries and super-capacitors are not covered in the static analysis reported here, in which the ESS will be considered a single storage element.
The electrical architecture in [11] was controlled by means of seven operating modes involving grid-connected and islanded operations [18], having been defined by the flux of power among SST, ESS, and the four charging points. In addition, the work in [11] illustrated by simulation the UFCS operation, supplying 100 EVs in one day with different charging profiles and constraining the SST maximum power to 630 kVA. On the other hand, the study did not contemplate real operating conditions with constraints imposed by the faults in the system or by charging procedures, ensuring 100% of charge to the EVs arriving at the station.
The work reported here aims to correct the mentioned limitations in [11] by extending and improving the operating modes first, and then considering a queue policy for the charging points, which eventually implies reviewing the system sizing reported in that paper. With this aim, the simulation presented here intends to reproduce the internal events in the electrical architecture of the UFCS that deal with energy management across one day of service, measured on the scale of hours or minutes. Therefore, the simulation does not cover lower scales of time like that of milliseconds, which could be used in other types of analysis to describe the interactions between the batteries and the super-capacitors in the ESS.
With this in mind, the objectives of our study can be summarized as follows:
(i)
Define a control system that handles the operating modes of the UFCS, taking into account the internal state of the station, the degree of occupancy of the charging points, and eventually the internal working faults.
(ii)
Devise a procedure to establish the appropriate size of the ESS, considering the constraints imposed by the UFCS operation.
(iii)
Establish a flexible approach for the supervision and control of UFCS electrical architecture.
The rest of the paper is organized as follows. Section 2 presents the seven operating modes of the system together with a fault detection machine and a queue control algorithm, which eventually constitutes the core of the UFCS centralized control. Two strategies for power distribution between SST and ESS are proposed in Section 3, where the appropriate sizing of the ESS is also performed by combining static and dynamic analyses corresponding to one operating day. A scaled prototype of the ESS is described in Section 4, consisting of a super-capacitor, a pack of batteries, and a SCADA supervision system. Conclusions and future research works are summarized in Section 5.

2. Centralized Control Description

The proposed UFCS manages the flow of energy among SST, ESS, and the four charging points (ChPs) through three interdependent subsystems by means of a centralized control, namely (i) a state machine that handles the station operating modes, (ii) a fault detection system, and (iii) a queue administrator and power distribution supervisor in the ChPs. Each subsystem and its interaction with the rest are explained in the following paragraphs.

2.1. Operating Modes

The core of the centralized control is a state machine that handles the transition among the seven operating modes from the power balance in the 1500 V dc bus, given by expression (1).
P S S T + P E S S = P E V
If there are no constraints in the available power supplied by the LV ac mains, the degree of ESS utilization will establish the UFCS operation. The ESS availability comprises an effective working range between 40% and 90% of its state of charge (SOC). The ESS will provide power to the bus just in the case of SST incapacity to supply the ChP demand or in a blackout situation. Hence, the ESS power ( P E S S ) at a given instant will be a function of the maximum available power ( P S S T M a x ) in the SST at that instant and the power required by the station ( P E V ) to charge each EV within a desired interval of 5 min and can be expressed as follows:
P E S S = f ( P S S T M a x , P E V )
Taking into account the above description, we can establish a first categorization of the station functioning in two groups, i.e., interaction between SST and ESS or islanded operation.
There are four operating modes in the first group, which are characterized by the grid connection in all of them and differ in the relation between the demanded power by the ChPs and the maximum available power in the SST given by P S S T M a x = 600 kW.
When P E V P S S T m a x , the system is in direct charging mode and the SST supplies power to the ChPs. In the case of an excess of power, the surplus can be used to charge the ESS with a power P E S S C h a r g i n g . If P E V > P S S T m a x , two operating modes are possible depending on the SOC level of the ESS. In particular, if the SOC is in the range defined for the ESS and the maximum power of the latter ( P E S S M a x = 800 kW) combined with the SST power is sufficient to cover the power demand, the operating mode is denominated as complementary charging. In the opposite case, in which the power demand P E V exceeds the sum of power of SST and ESS or the ESS is out of the usable range, the corresponding mode is called limited charging. In the latter mode, the UFCS cannot guarantee the battery charging in 5 min, and therefore, the available power must be distributed among the operative ChPs according to a delivery policy determined by subsystem (iii).
If there are no vehicles in the station, the available power in the SST keeps the ESS recharging continuously while waiting to provide service, this operating mode being denominated as standby.
In the absence of reliability in the charging or in the presence of electrical failures in the grid, the UFCS will operate in three islanded modes, in which ESS will be the only power supplier to the ChPs. In the first mode, denominated as autonomous mode, the ChPs are limited to the maximum power P E S S M a x of the hybrid storage system. If the SOC of the ESS falls under 40% during the latter mode, the station will enter into burnout mode, in which the station will ensure service to the EVs already inside but will not provide any charging to new EVs arriving to the UFCS. When the charge of the last EV is completed, the burnout mode will lead operation directly to disconnection mode, while waiting for energy supply restoration from the SST or from another source of energy capable of providing the required power through the ESS, e.g., the use of a renewable energy source or a change in the pack of batteries.
Table 1 summarizes the operating modes described above. Each mode is represented by either one or several mathematical equations and operating ranges describing the internal conditions of the station.

2.2. Fault Detection Supervisor

The fault detection supervisor works in parallel to the state machine that establishes the operating modes and restricts the internal states of the UFCS depending on the fault location and after having determined the new possible states for operation. This is carried out by locating the fault origin and subsequently disconnecting it through the power converters, which are the energy processing elements in the different buses of the microgrid. Each converter operation requires both voltage and current sensing and acts simultaneously as data collector and active switch.
We assume for the system simulation that the SST, the ESS, and the ChPs have a single switch in each case, which disconnect them from the microgrid in case of fault detection. Table 2 illustrates the available operating states depending on the fault location.
It is worth mentioning that the supervision described here does not perform an analysis of the possible causes of the fault, which is important in a real implementation, but it is not relevant for the general simulation reported in this work.

2.3. Queue and Power Distributor Management System

Handling the operating modes and the fault detection together ensures the power flow from the sources to the ChPs, taking into account the internal conditions of the UFCS. Nonetheless, it is necessary to supervise the access of the EVs to the station and determine the distribution of the available power to each EV by unifying both tasks in a single subsystem operation.
Figure 2 shows the flowchart of the queue and power distributor management system from the arrival of an EV at the UFCS until it leaves the station. If there is a ChP available, the EV will be placed there and the charging will start, provided that it is possible to supply the power demanded by the vehicle. The lower limit of the delivered power is fixed to 50 kW, taking into account that the UFCS has to ensure at least one fast charging. For the sake of simplicity, the occupation of the points of charge is arranged in order, so ChP1 is the first point to be occupied, followed by ChP2, ChP3, and ChP4.
If no power is available to charge the EV, the vehicle will enter into the queue to wait a maximum time of ten minutes for the supply of the required power. After that lapse of time, the vehicle is dismissed because the UFCS cannot provide the charge.
On the contrary, if no ChP is available when the EV arrives, the vehicle will remain waiting until a ChP is vacant. It can be expected that up to four EVs can remain in that situation, waiting for access for a maximum time of 20 min, which is the time necessary to recharge a vehicle with fast charging.
On the other hand, the power distribution among the ChPs can be performed according to three different policies:
(a)
Hierarchical order, in which the order of arrival establishes the priority. The first EV has all the power, thus reducing the available power for the following vehicles.
(b)
Equal consumption, in which all the EVs absorb the same amount of power from the station.
(c)
Percentage consumption, i.e., each EV absorbs an amount of power established by its energy capacity. Hence, a vehicle with a large capacity will benefit from a higher value of charging power than other EVs with less capacity, even if the available power changes.
Procedure (a) applies to the arrival of one EV to the station, while (b) and (c) are used when the operating mode changes, especially in modes that limit the station maximum deliverable power to the ChPs, like the limited mode or the islanded modes. If the EV takes one hour for charging due to the lack of power in the desired charging interval, the vehicle will be dismissed from the station before complete charging is attained.
Figure 3 and Figure 4 illustrate an example of the queue and power distribution management system for a 35 min operation interval during which 10 EVs arrive at the station. An ESS capacity of 500 kWh, 56% of SOC, and a percentage distribution procedure have been assumed. The charging profile of the EVs is represented by a constant power characteristic (CP) until 80% of SOC is reached. Note that CP is a straightforward way to obtain the required energy in the first minutes of charge [10]. In addition, an extra time of 90 s is included to take into account the human interaction in the manual connection and disconnection of the charging cable.
Figure 3 is divided in two parts. Figure 3a shows the power profile of the 10 EVs arriving at the station and Figure 3b illustrates the occupancy time of each ChP together with the waiting time to access the charging points of each vehicle in a group of four. When the EV corresponding to the first profile (blue solid line in Figure 3a) leaves ChP1, it is then replaced by the EV that was waiting in the queue (green discontinuous line in Figure 3b), which occupies ChP1. This replacement takes place three more times in the rest of the ChPs. In the first 10 min, one of the EVs has been forced to quit because there was no free waiting position in the queue.
On the other hand, Figure 4a,b show, respectively, the simulations of the power balance in the UFCS and the SOC of the ESS. The orange line in Figure 4a represents the power delivered to the points of charge; the yellow line corresponds to the ESS power and the blue line describes the power absorbed from the grid. In minute 15 of the simulation, the SOC of ESS reaches the 40% limit and stops delivering power. Thus, the UFCS limits the maximum power to 600 kW of the ESS and changes the operating mode. Under the new conditions, the available power is less than the demanded power in the four occupied charging points, which implies a rearrangement in the power delivered to the ChPs according to the power distribution procedure selected.

3. ESS Sizing

3.1. Energy Management Procedure

If we take into account only the power demand in the charging points, each EV will represent a consumption of approximately 28 kWh in terms of energy capacity [11]. With this reference and assuming 100 EVs per day, the station ESS should have a capacity of around 2.8 MWh in its operating range, i.e., 40–90% of the SOC. This is an upper bound considering that ESS is responsible for delivering all the energy to the vehicles.
Nonetheless, it is necessary to use an appropriate energy and power distribution management procedure among ChPs, ESS, and SST in order to establish a reasonable value of the ESS capacity, considering the circumstances of the daily operation of the UFCS. In this sense, two different energy management strategies can be used, namely load leveling and load shifting.
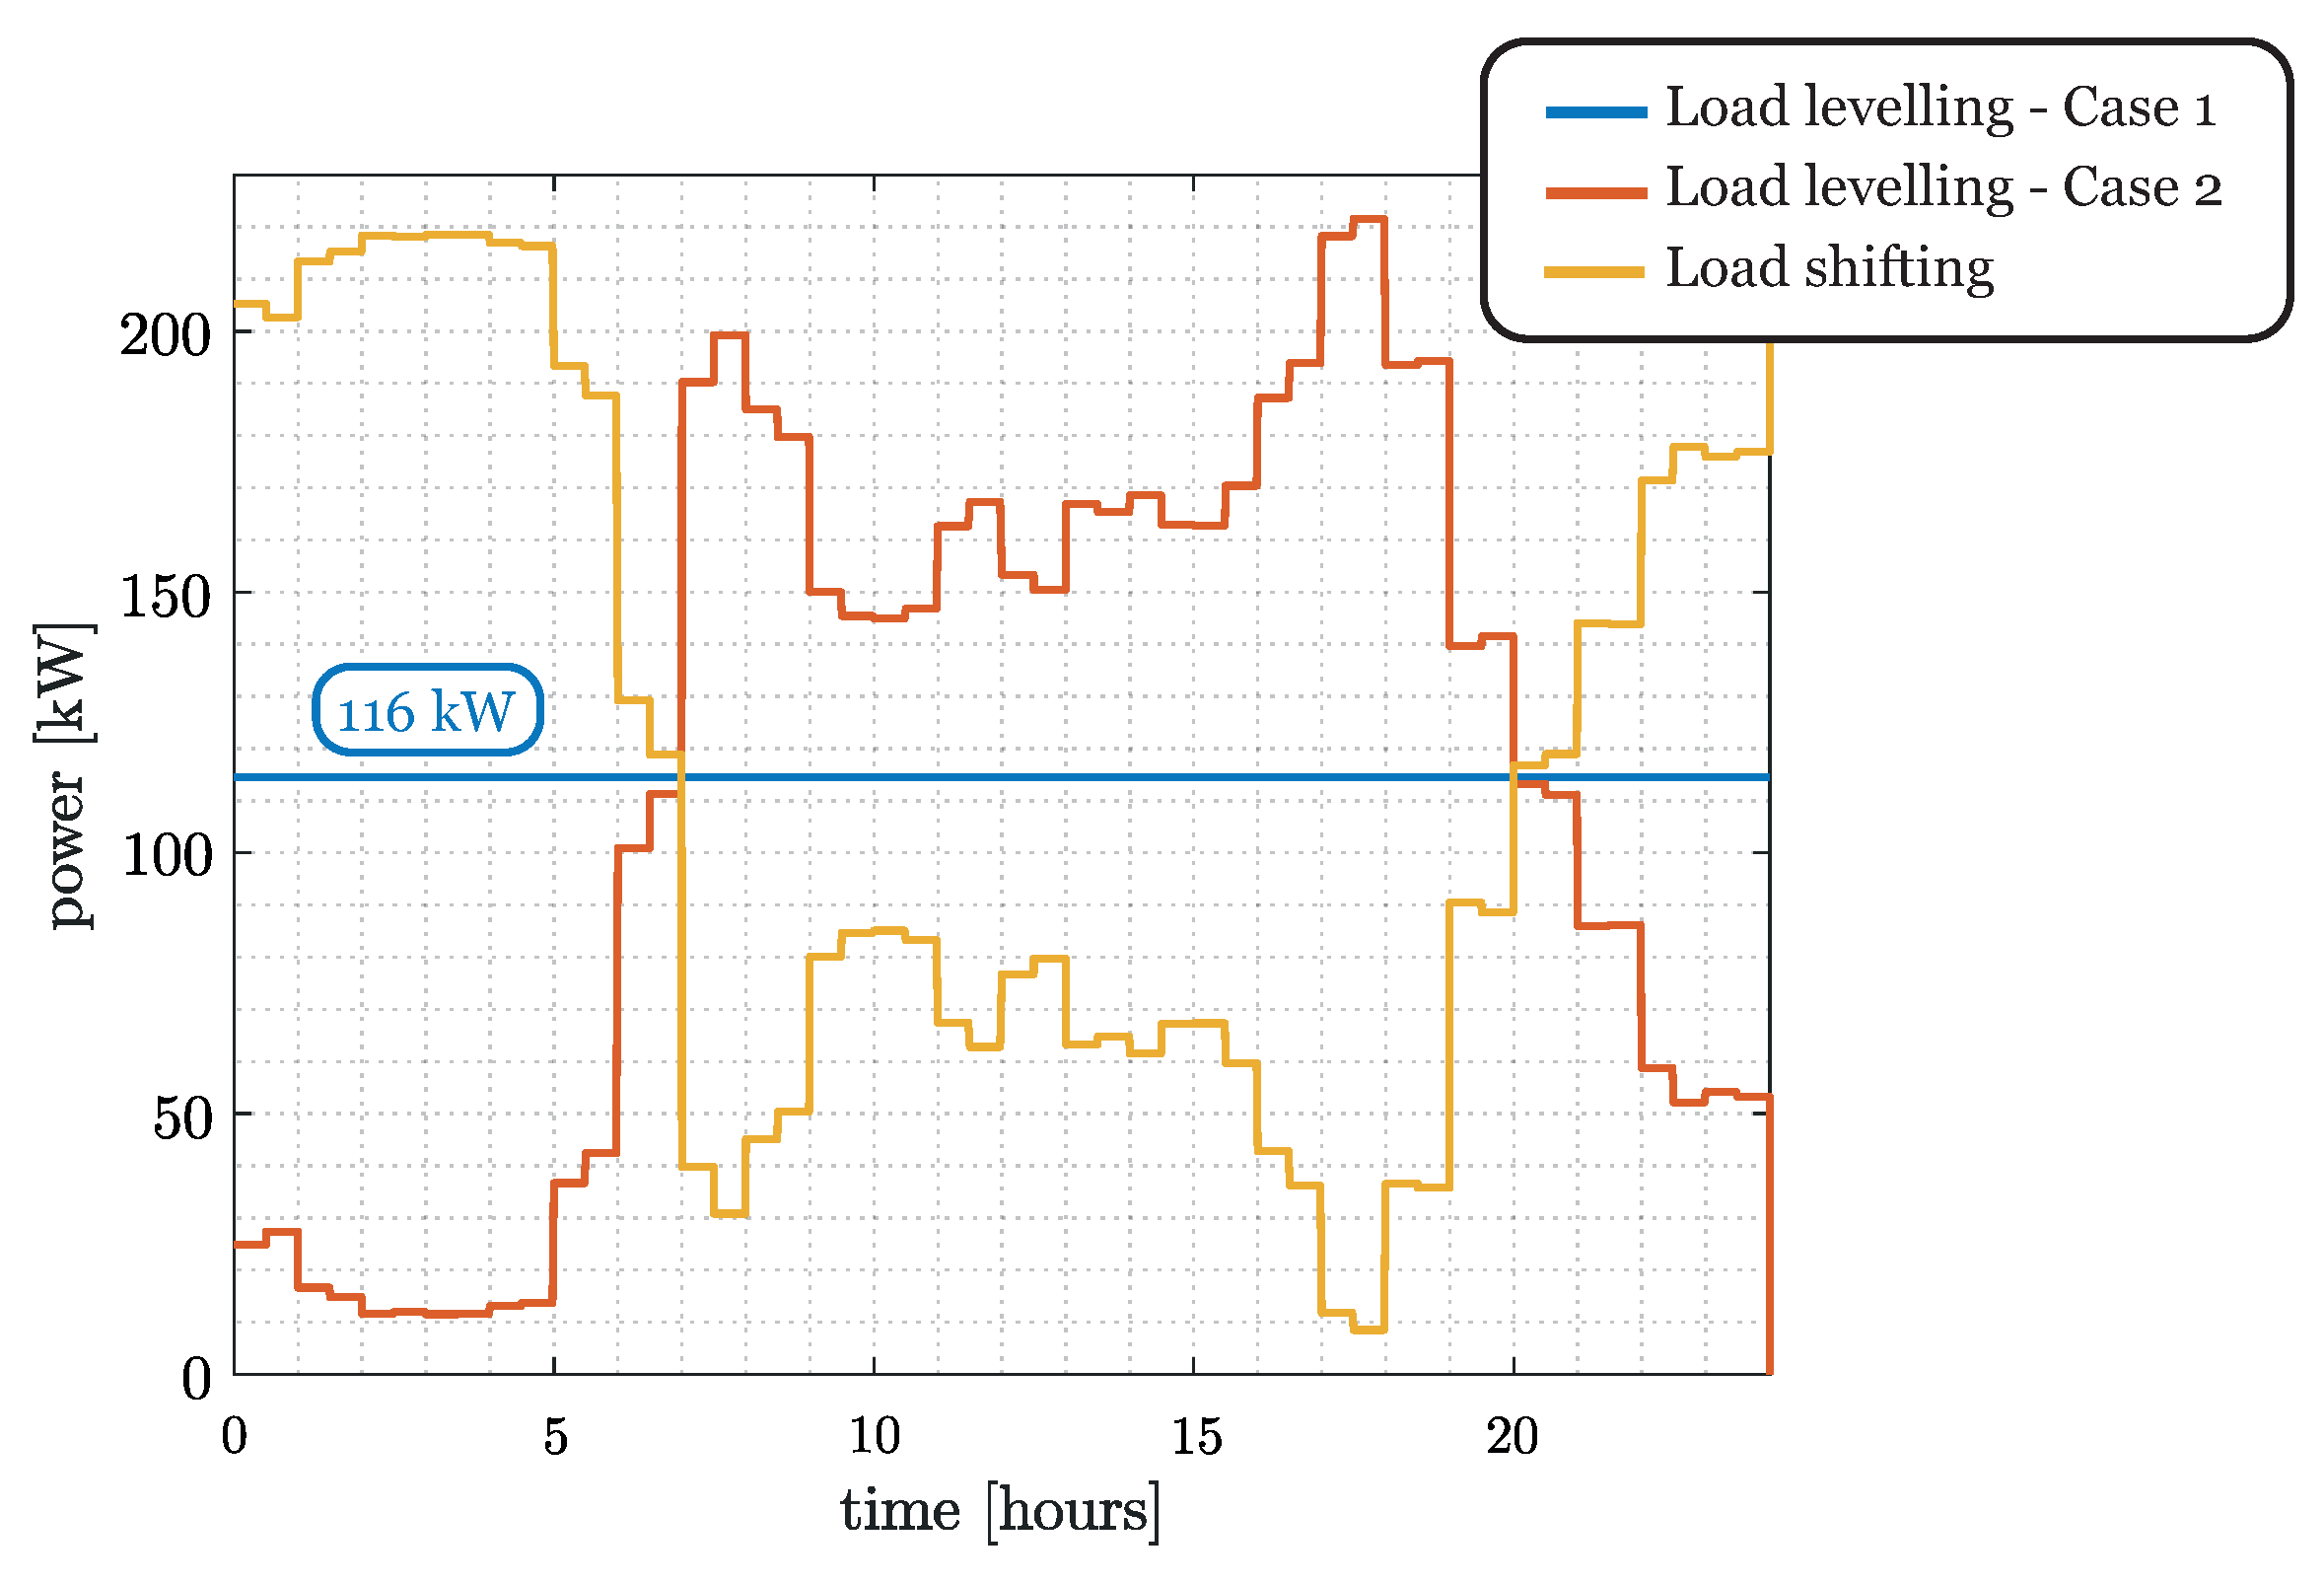
Load leveling assigns the power distribution proportionally between SST and ESS, considering a consumption value that reflects a possible power demand per hour in one day of operation of the UFCS. In this work, we establish two types of load leveling for energy management. The first method is based on a continuous consumption profile and is equal to the daily mean power value demanded by the ChPs (Case 1), while the second one is based in the average consumption profile every 30 min (Case 2).
The load shifting approach is the opposite of the leveling technique, since the ESS stores energy in valley hours and delivers the energy during the service peaks, thus alleviating the demand on the grid. The load shifting is performed with respect to the 30 min average consumption used in the above-mentioned Case 2.
It is assumed in our study that the SST ensures a regular power delivery in both strategies. Figure 5 shows the UFCS estimated consumption profiles according to the three management procedures described above. In reference [11], the expected number of daily vehicles in the UFCS was 100 for the current traffic conditions. In order to consider a possible increase in that figure in the following years, we have considered in this paper 150 and 200 EVs per day, which represents an increment of 50% and 100% in the current capacity.
A first approach to computing the capacity can be carried out by establishing the difference between the expected demand profile of the station and the real demand in the ChPs. This calculation determines the total necessary energy in each management procedure but does not take account of the energy flow. We denominate this approach the static method, and it allows establishing an upper bound of the ESS sizing. Table 3 shows the average results for 500 operating days predicted by simulation using the static method with each management policy. Note that the final capacity corresponds to the total capacity of the ESS, although in the design, only 50% of that value has to be considered as the operative range.
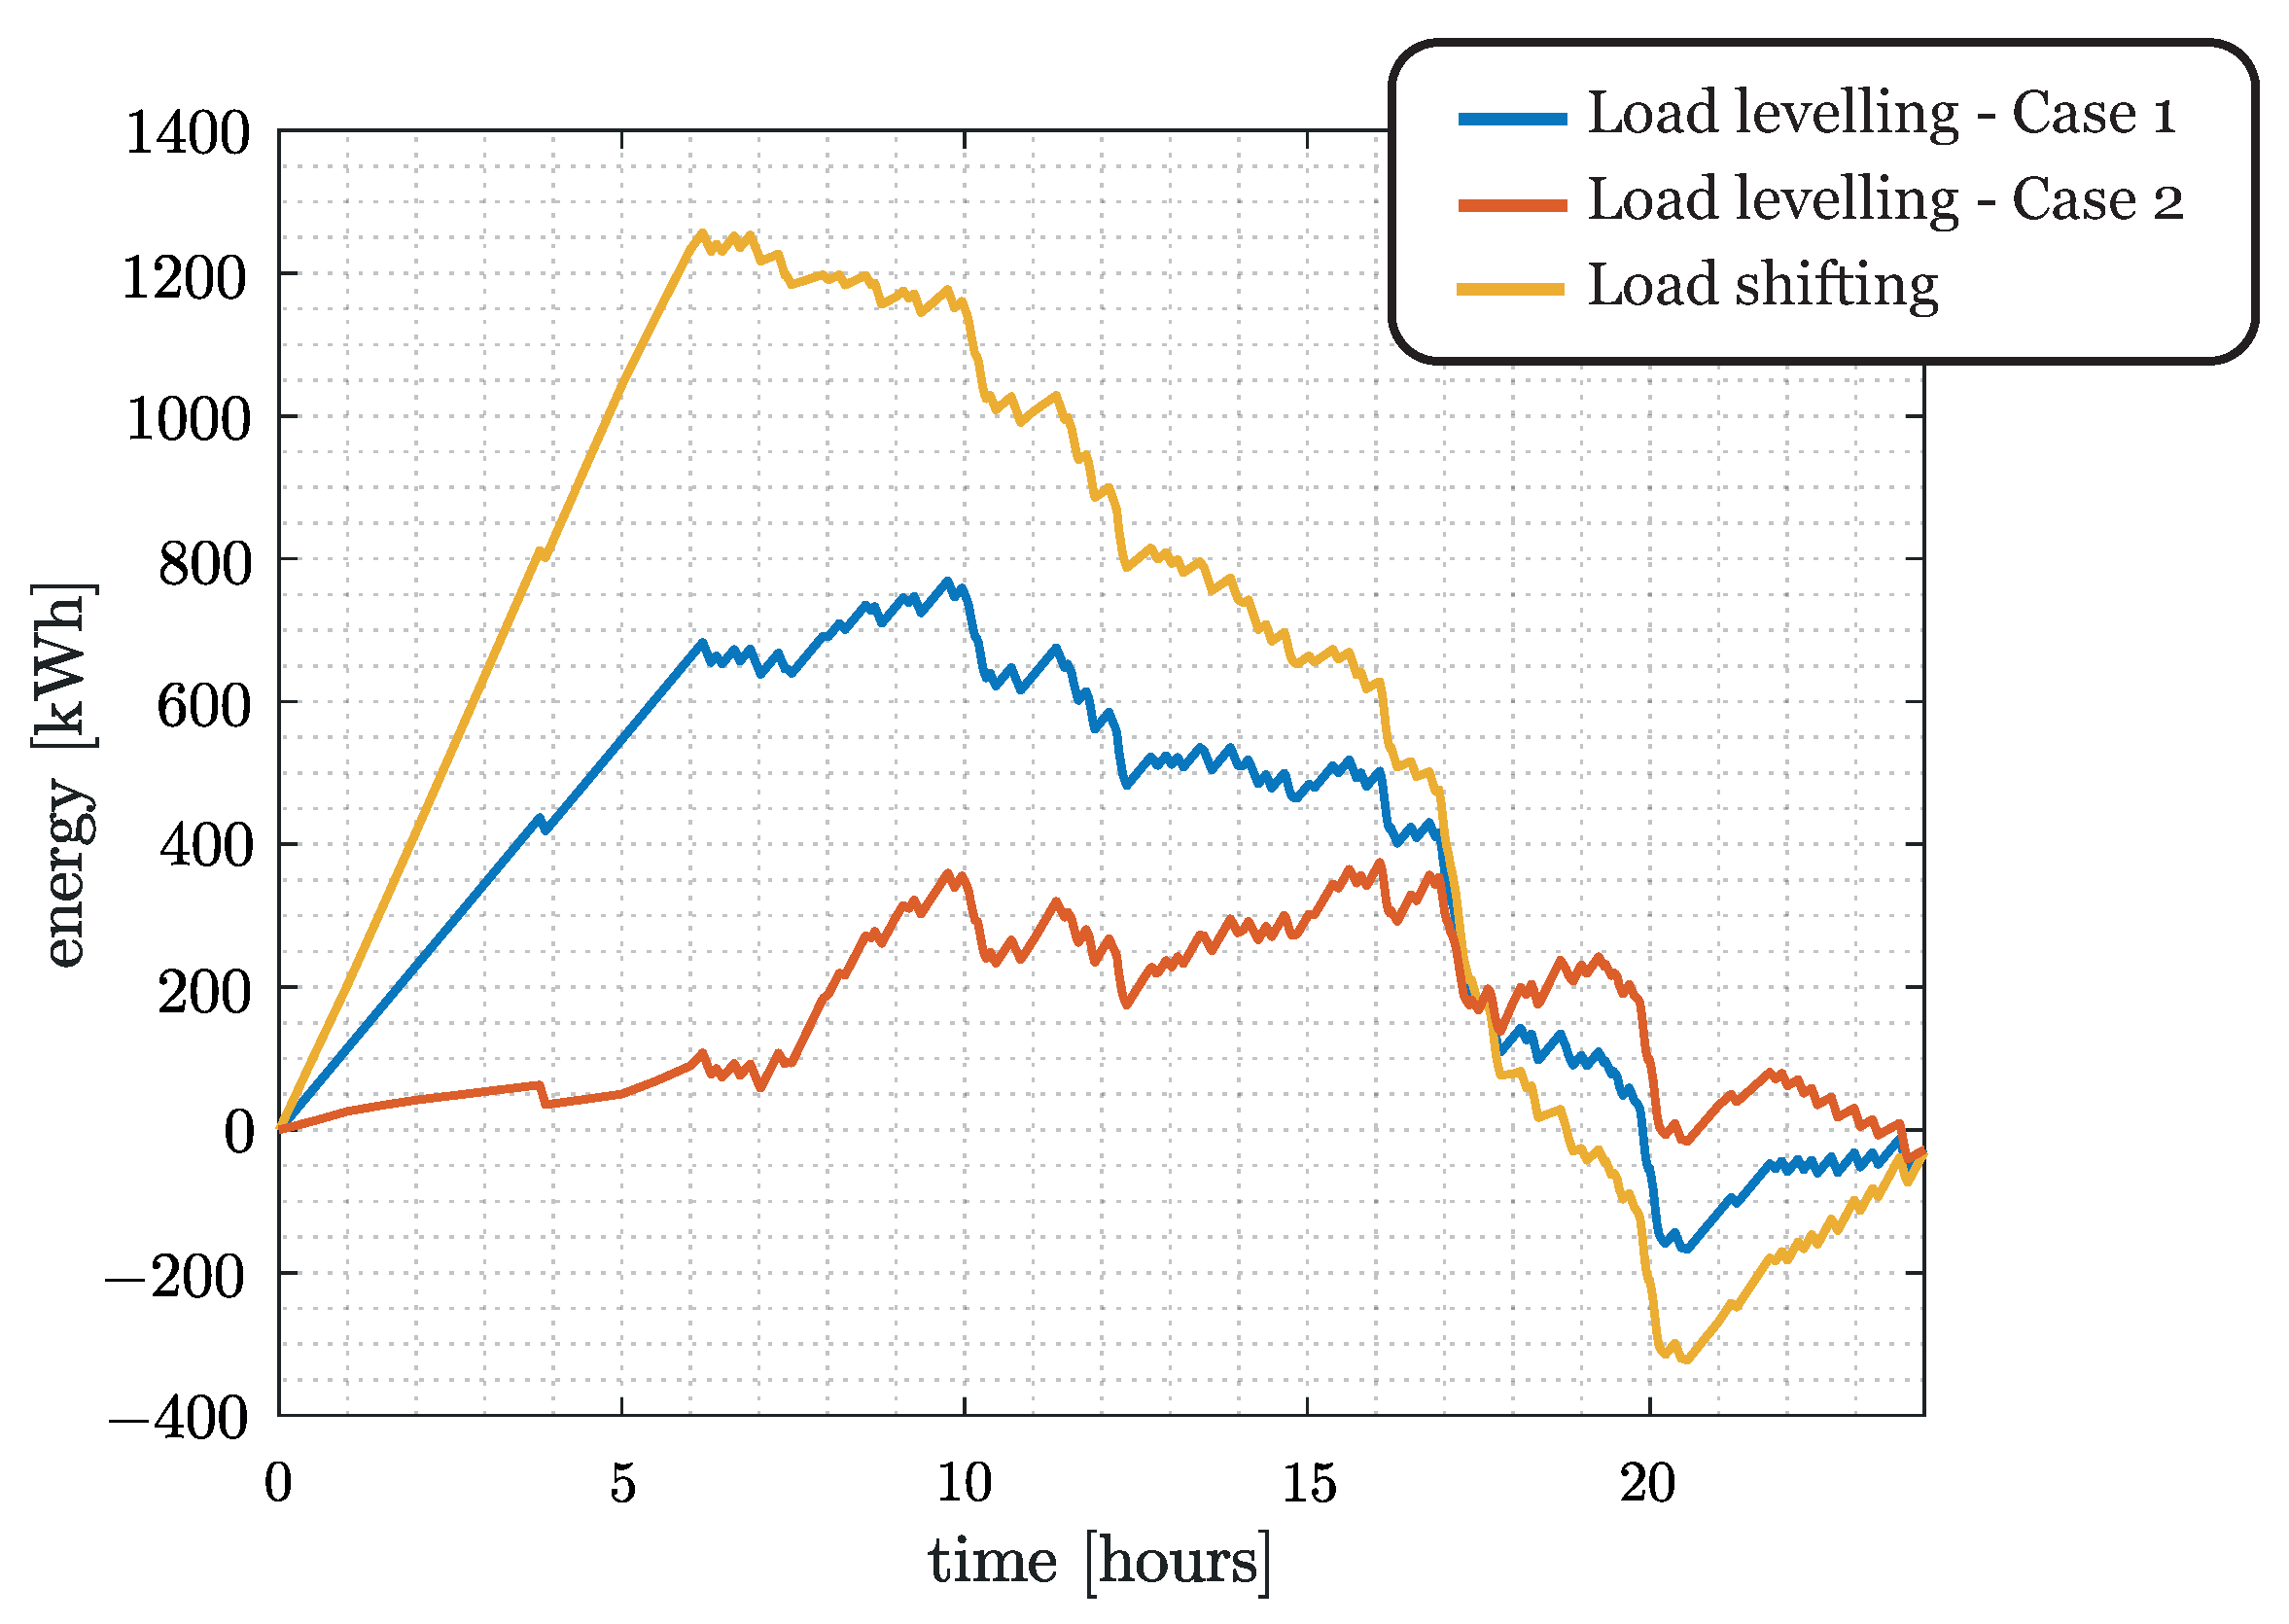
Figure 6 shows the energy flow dynamics generated in the ESS during UFCS operation according to the employed energy management procedure. Instead of considering the total amount of energy, a second approach based on Figure 6 uses the ESS complete operation range during both charging and discharging processes and results in a smaller value of the capacity.
Different indexes can be used to calculate the capacity related to the operation range. Figure 7 illustrates the dynamic behavior for one-day operation when the load shifting profile is used. The first hours correspond to the total load phase, which is followed by the delivery phase of that stored load to the ChPs as the day goes by. Thus, a capacity equal to the total range between two processes indicates the correct operation with respect to the selected management system.
Table 4 summarizes the obtained results on average for each management procedure using the dynamic method for a total range calculated after 500 operating days. It can be observed that there is a reduction in the calculated capacity with respect to the value estimated by the static approach.
Figure 6 shows a significant difference with respect to both maximum and minimum values of the energy flow dynamics. An indicator taking the largest value with respect to zero, i.e., the beginning of the day at 0 h, provides a partial range that corresponds to the minimum value required for UFCS operation. Table 5 summarizes the obtained results on average for 500 operating days, considering the mentioned partial range.
In the performed simulations, the queue and power distribution management system ensures the availability of the service near 100%, in spite of the increase in the number of EVs. Table 6 summarizes the waiting times and the dismissed vehicles over 500 operating days.

3.2. Event Simulation

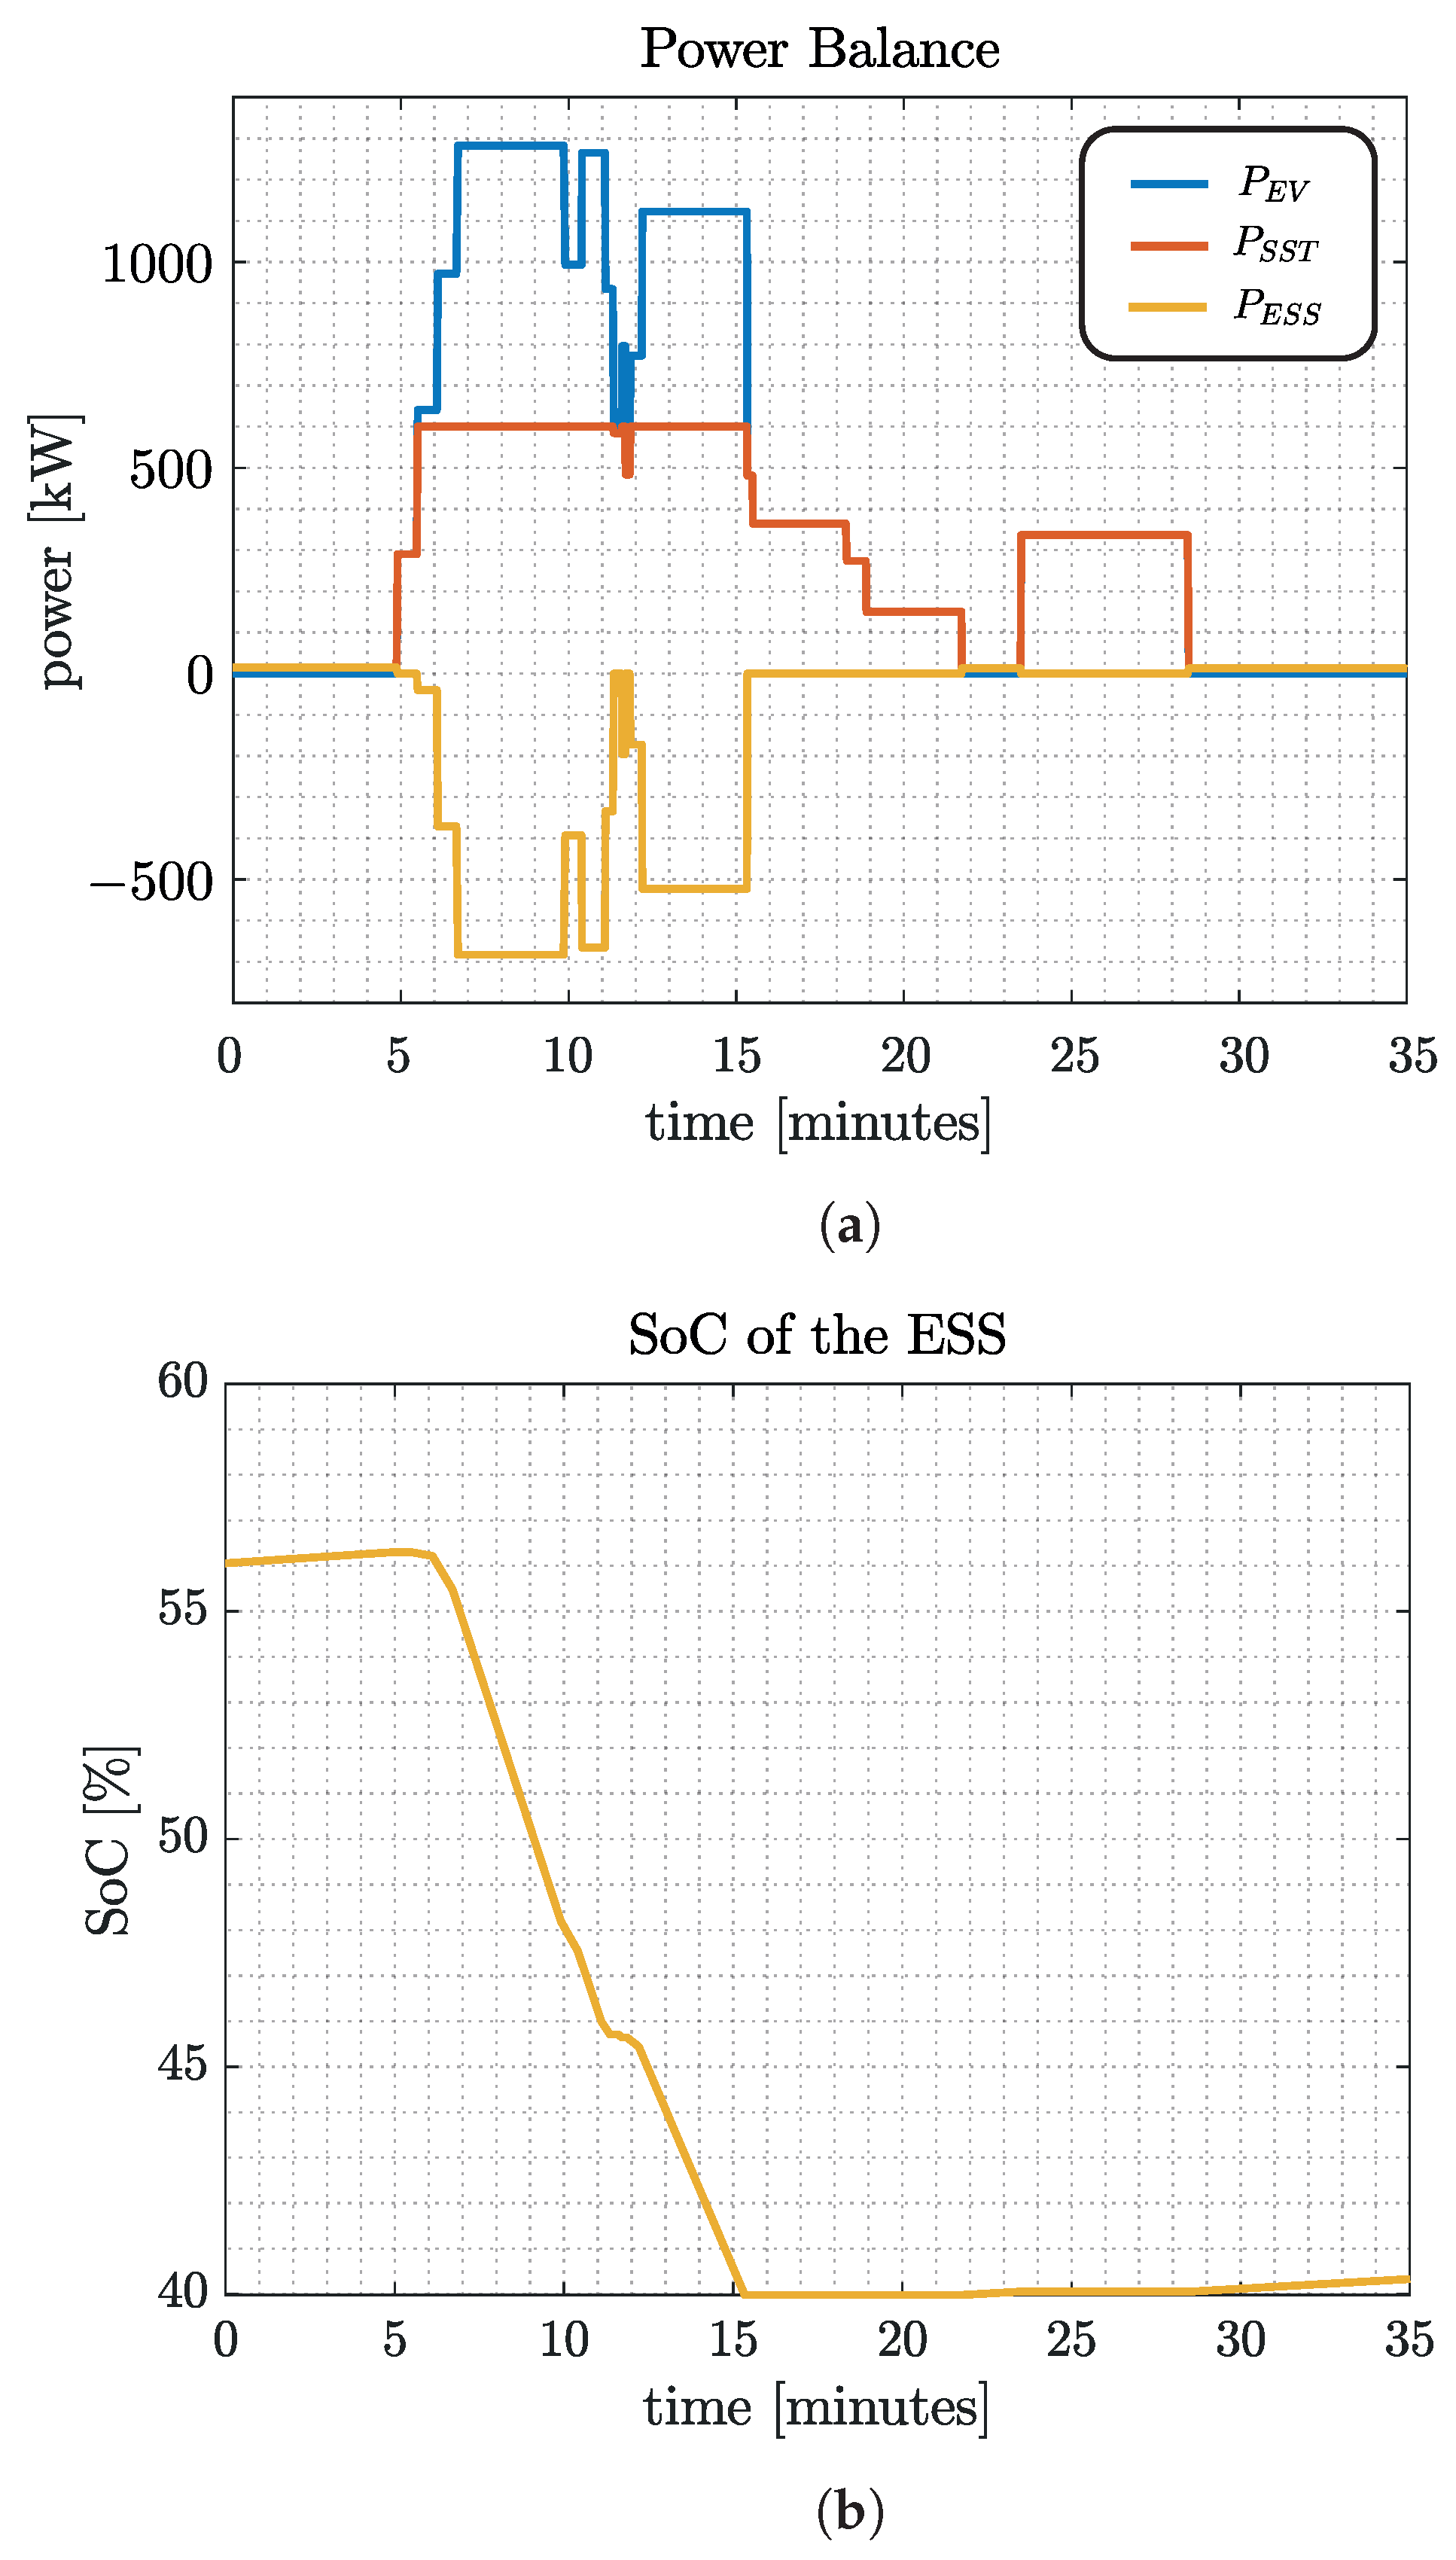
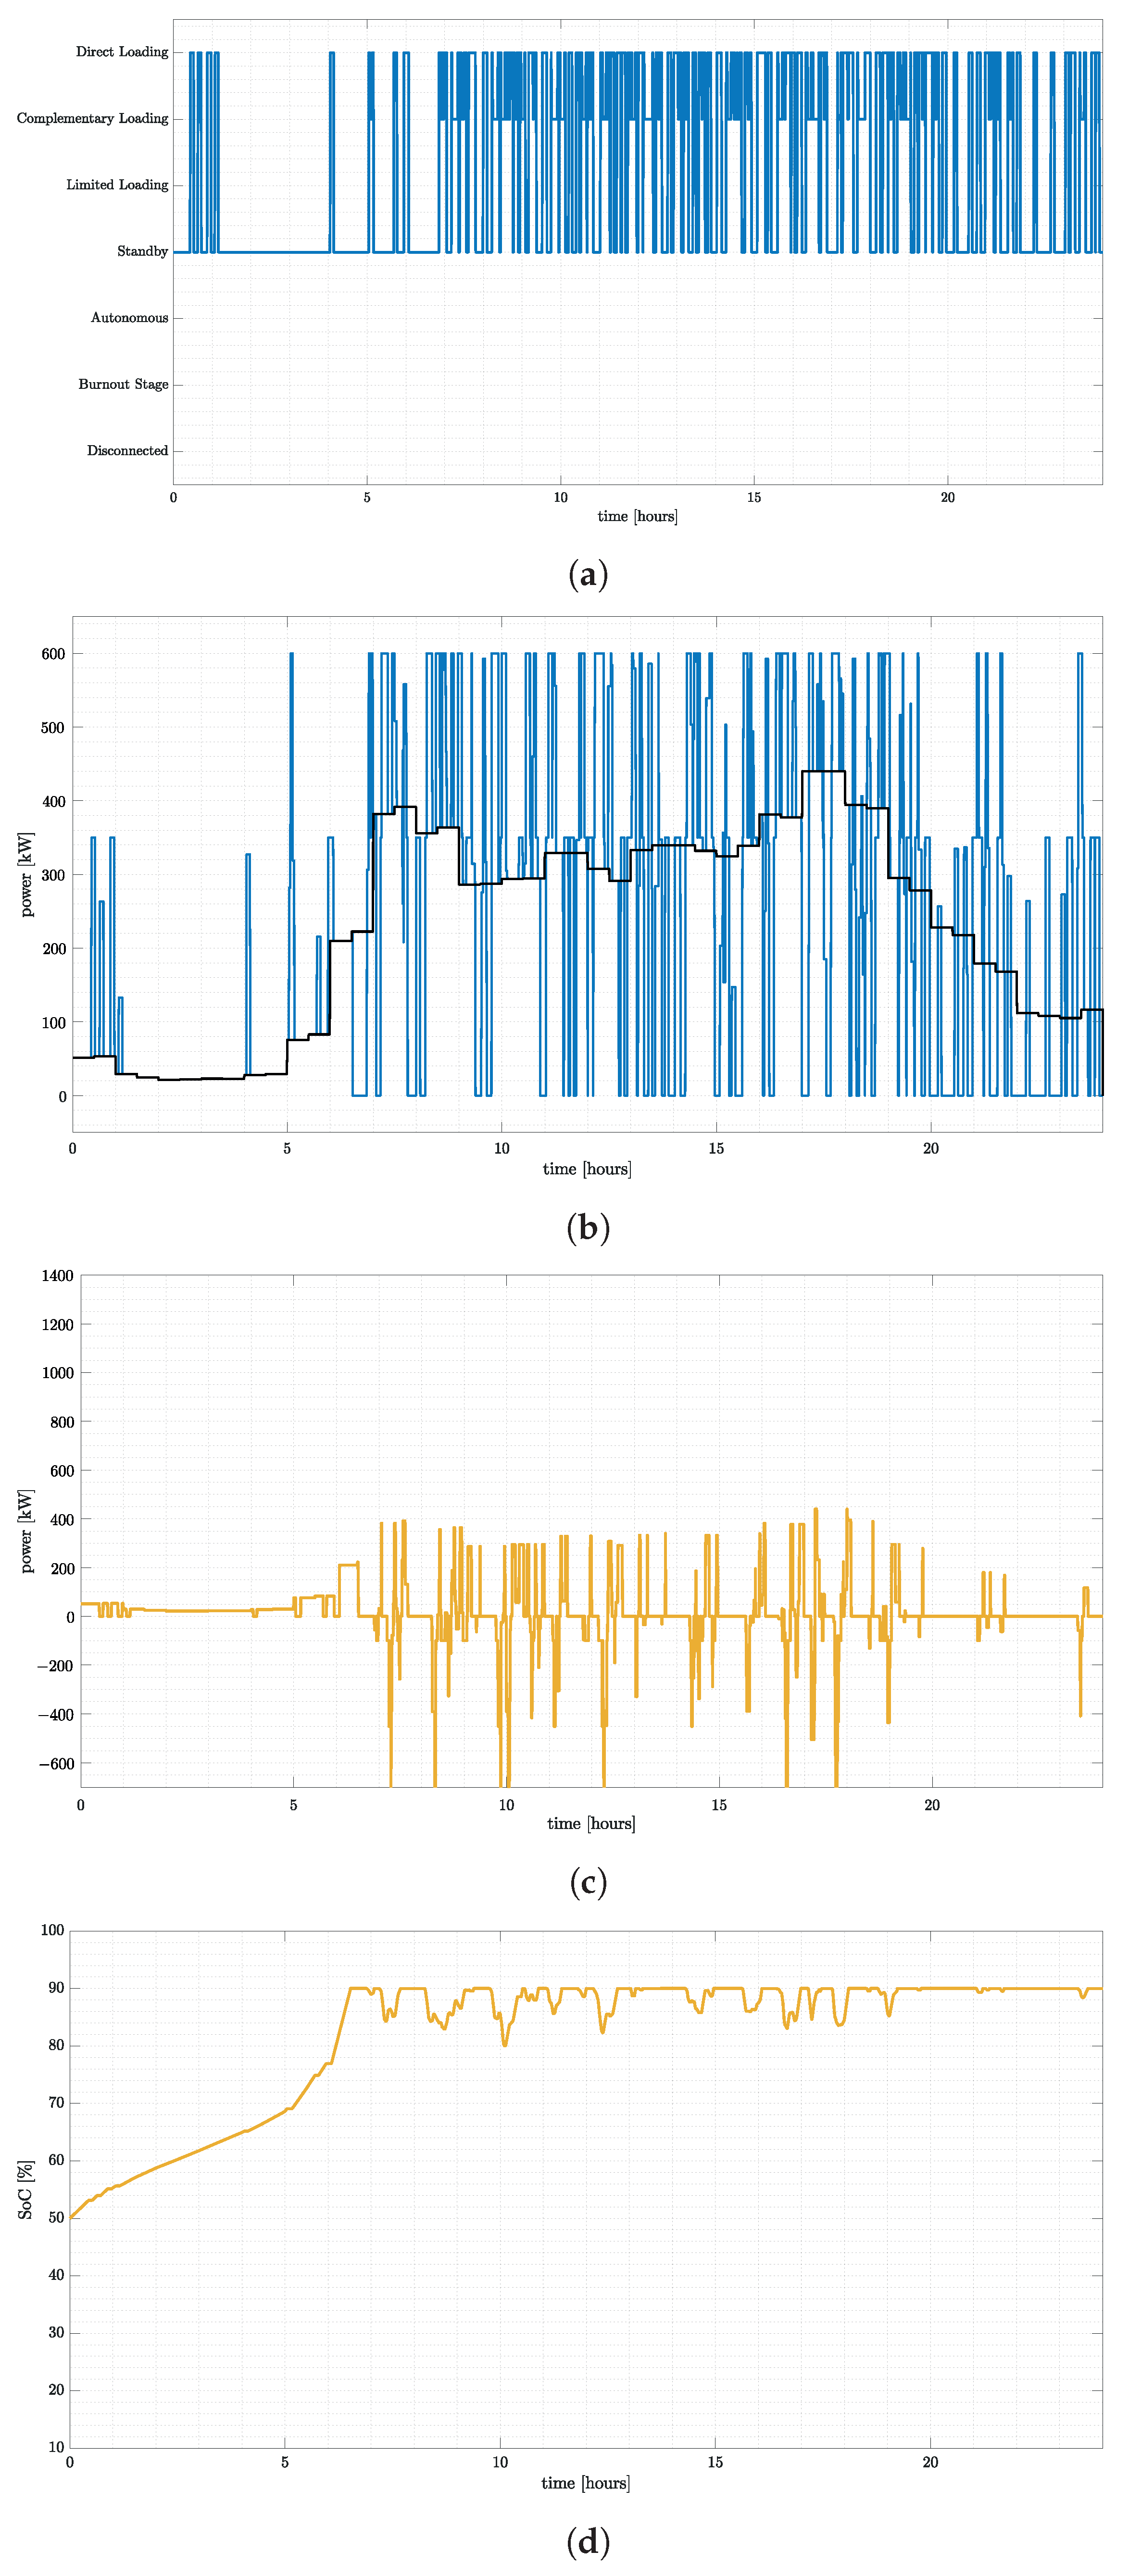
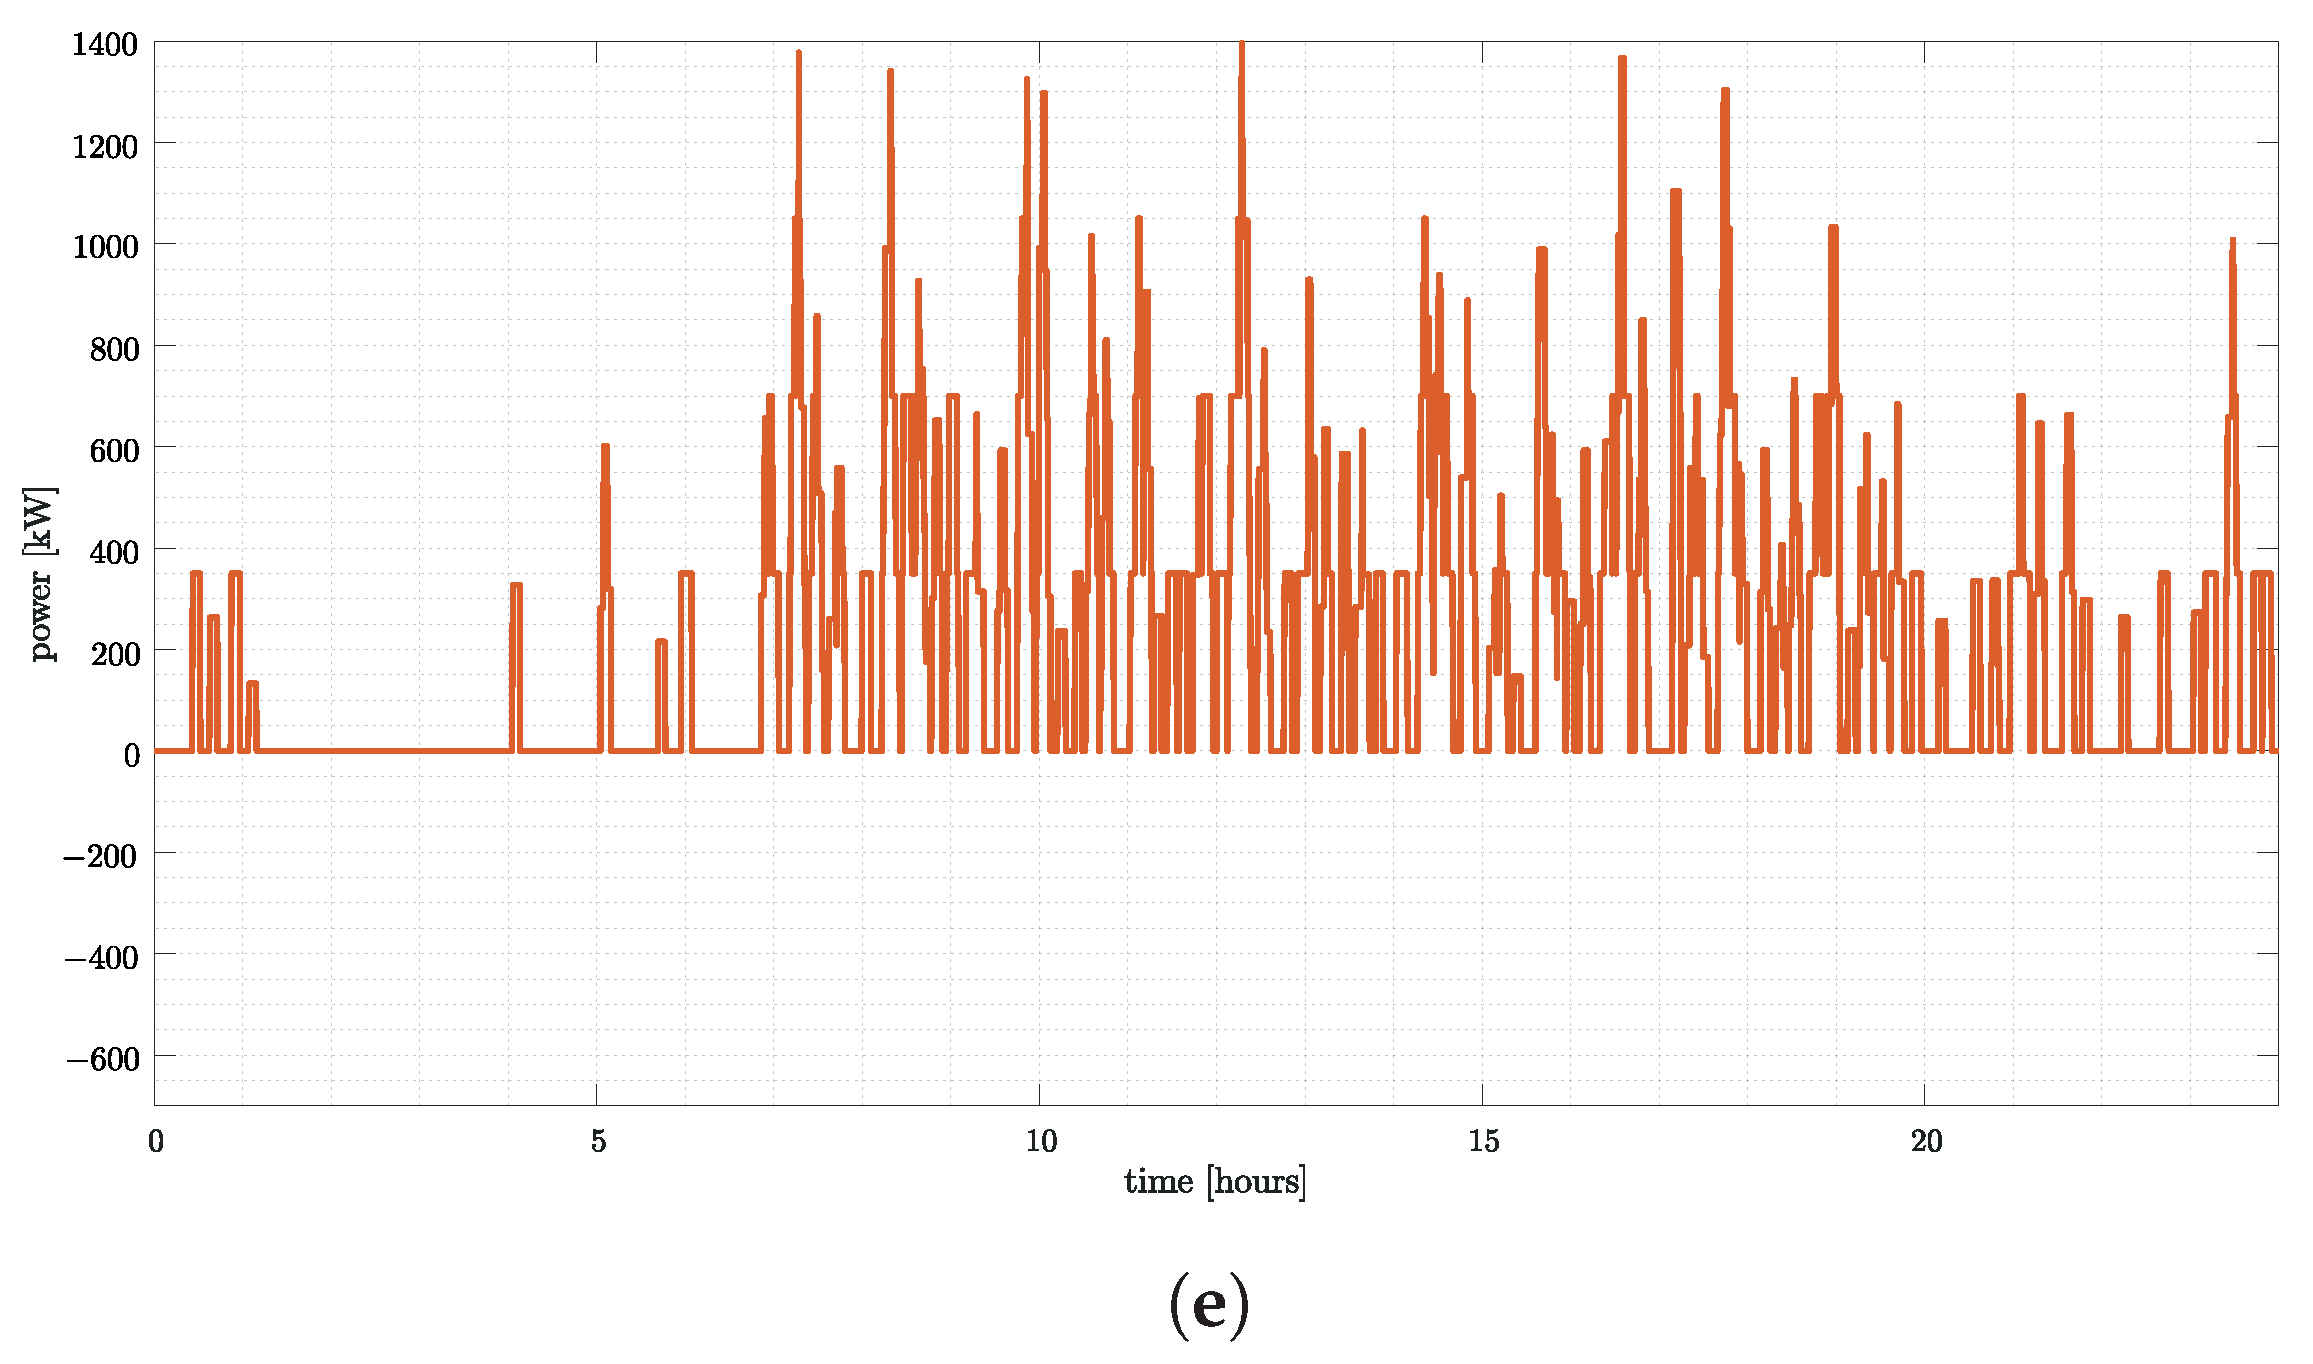
Figure 8 shows an operating day for 180 EVs under optimal operating conditions and reliable energy delivery. The energy management procedure corresponds to the load leveling case with a capacity assignment of 715 kWh for the ESS. Figure 8a depicts the transition between the operating modes, where the direct charging, complementary charging, and standby are dominant. The average consumption of the SST profile shown in Figure 8b follows the pattern established by the management policy, and is altered by the EVs’ arrival. It has to be pointed out that the UFCS never enters into limited charging mode since the SOC of the ESS (Figure 8d) is above the expected values of its operating range.
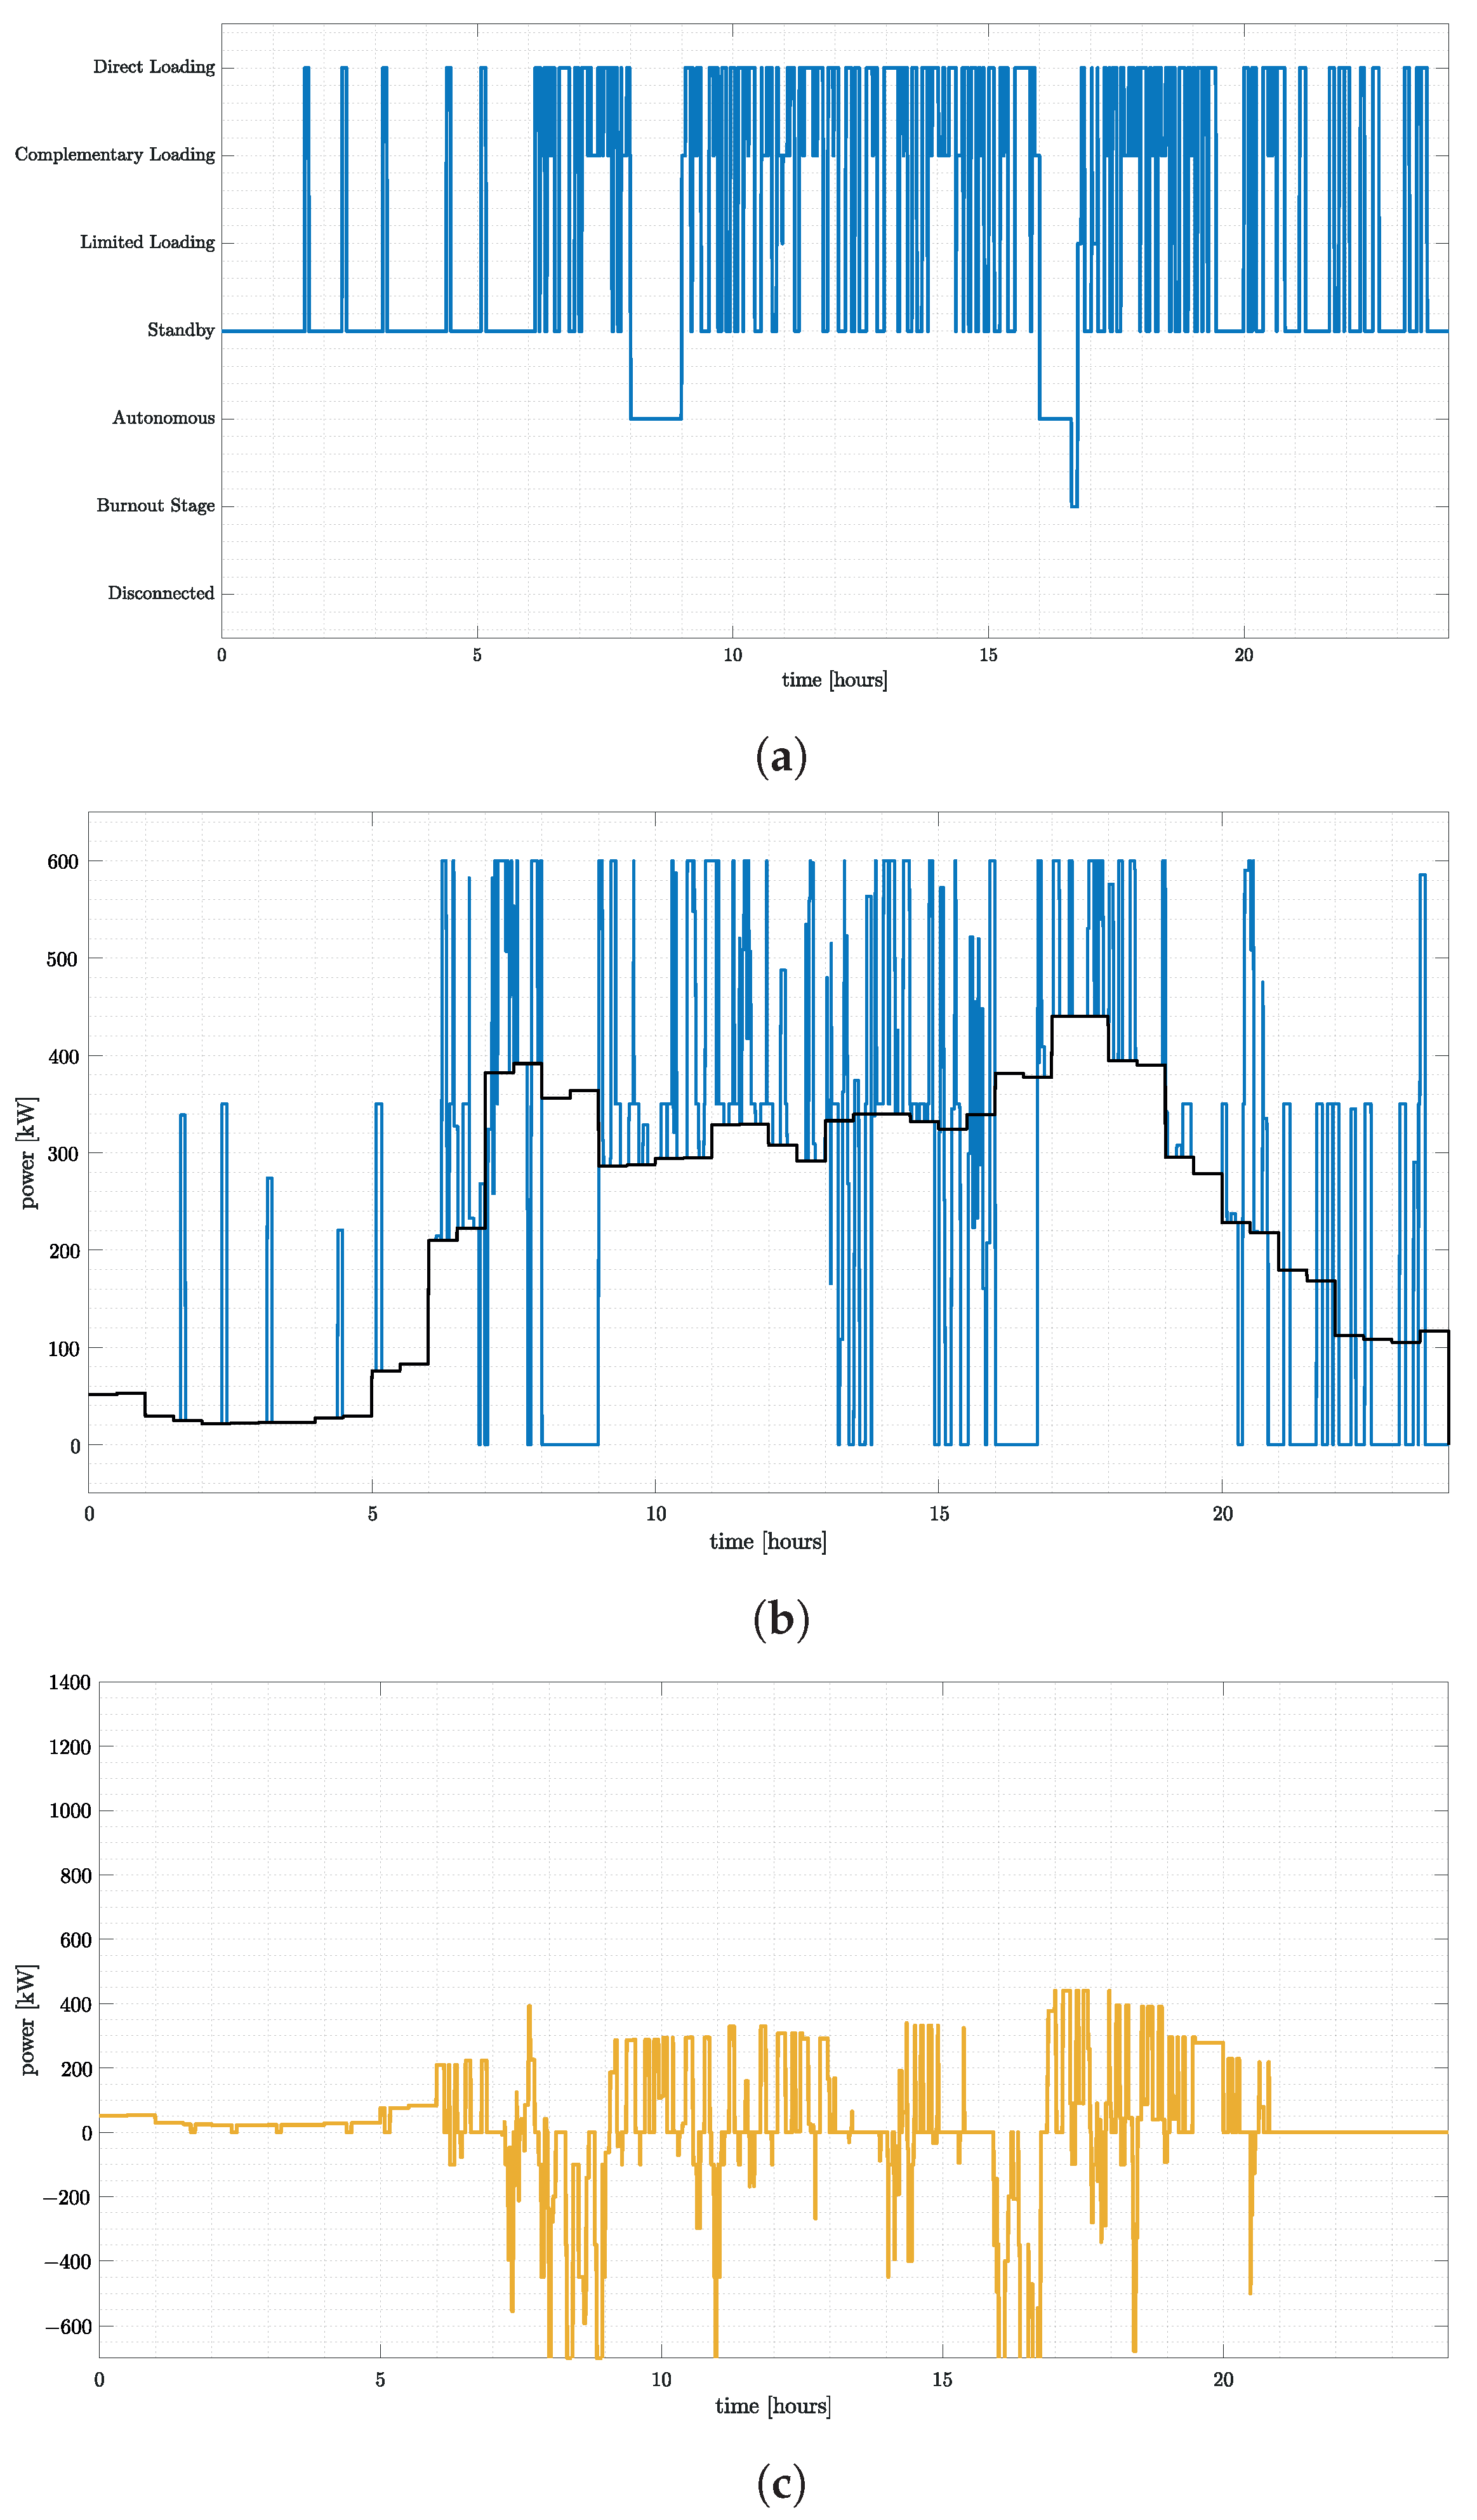
Figure 9 is a similar simulation to that of Figure 8, but it includes two blackouts, which generates two fault alarms in the system, the first one of one hour duration occurring at 8 a.m. and the second one of 45 min at 4 p.m. These faults allow exploring the performance of the islanded modes and evaluating the ESS sizing.
During the SST disconnection at 8 a.m., only the autonomous mode was working. Nonetheless, during the SST disconnection at 4 p.m., after facing the peak of demand, the UFCS autonomous mode changed to burnout mode once the minimum value of the usable range was overtaken, i.e., S O C < 40 % .
The blackout ending and the availability of the SST lead the UFCS to the limited charging mode, waiting for the restoration of the ESS capacity, which takes place relatively fast. In spite of 1 h and 45 min working in islanded mode, the station could still offer the power demand without overloading the ESS and providing 100% of service.

4. Reduced-Scale Demonstrator of UFCS and SCADA Description

We are currently working on the implementation of the UFCS electrical architecture of Figure 1 on a reduced scale of 1:75 in power units, which implies a maximum active power of 20 kW in the demonstrative prototype under construction. With this aim, the reduction in voltage scale in both buses is around 1:4, this resulting in two dc buses of 150 V and 380 V to emulate, respectively, the 600 V and 1500 V in the real station. This reduction ratio is also applied to the battery pack emulating the EVs.
The demonstrator ESS has already been assembled and consists of a battery pack of 200 V of nominal voltage and two super-capacitors. The battery pack is made up of 60 cells of lithium iron phosphate (LiFeO4) Winston TSWB-LYP40AHA (Batt pack 1), while the super-capacitor module consists of SkelMod 102 V 88 F (Supercap 1) of Skeleton and BMOD0006 E160 CO 2 (Supercap 2) of Maxwell.
The capacity of the battery pack in terms of power is 8 kW, which has been calculated taking into account the 1:75 power scale reduction for the minimum value of the capacity obtained using the load leveling approach in the dynamic method with partial range. Both super-capacitors have been selected to handle a maximum current peak of 100 A.
The ESS implementation has been accompanied by the development of a SCADA-based monitoring system in a FPGA srRIO 9627 electronic card, which has been programmed in LABVIEW to observe and handle the consumption of both power and energy. The SCADA system is the base to implement the centralized control and its corresponding subsystems described in Section 2 and more specifically the fault detection system, which is crucial in both minimization of damages and electrical safety.
Data and command sending among the different elements of the demonstrator is carried out by means of a CAN 2.0 communication bus. As mentioned in Section 2, every power converter provides its voltage and current data to SCADA by means of microcontrollers that allow the active connection and disconnection in case of fault using controlled switches in their ports. In addition, the battery pack has its own battery management system (BMS) denominated BMSmart123 of GWL, which has a CAN module. Moreover, the super-capacitor block includes a communication bus of the CAN type.
Figure 10 shows the main screen of the SCADA program, which has been developed for the 380 V dc bus of the demonstrator. The three components of the ESS mentioned above can be observed together with their corresponding converters. There are also two loads connected to the bus, which correspond to the future insertion of a scaled SST plus the batteries emulating an EV (Emu 1) or an electric motorbike (Emu 2). The box at the right of each element in the screen is an indicator of its connection state with respect to SCADA.
At the left of the screen, the monitoring system shows the operation time while it facilitates the data collection of the components connected to SCADA. The design of the latter is based on specific modules for each element in the demonstrator of the same type, i.e., all the battery packs share the same structure, although internally, each module has an independent configuration for its parameters, which eventually results in a flexible and scalable design.
Each module, in turn, has at least two tabs in the screen, namely an overview option providing the basic information of the device, as illustrated in Figure 11, and the electric variables monitoring for visualizing voltage and current and the rest of electrical information of the device. Moreover, the battery pack has an additional tab to show the information corresponding to each cell due to the action of its BMS.
Finally, we have implemented two protocols in order to observe the capture of data in real time and calibrate at the same time the measurements of the operating levels of the ESS elements. The first one was devoted to the charge of the battery pack at a constant current (CC) of 10 A, while the second protocol was dedicated to monitoring the discharging process of Supercap 1 in a resistor of 100 Ω, as illustrated in Figure 12 and Figure 13, respectively.

5. Conclusions

This paper has shown the simulation of the steady-state operation of an ultrafast charging station (UFCS) based on a hybrid microgrid with one ac bus and two dc buses. The simulation reported here is a flexible tool to predict the different situations that the UFCS would tackle in a real implementation. The UFCS management requires a centralized control based on a state machine, a fault detection system, a queue administrator, and power distribution supervisor. Seven operating modes have been proposed, which are related to either grid-tied connection or to islanded operation. The associated limitations to all of them have been described in the cases of fault in different parts of the electrical architecture of the station. The paper has also presented different proposals for the internal power distribution, taking into account an appropriate queue management policy. The simulations of internal power flow in the station, SOC of the ESS, and power delivered to EVs for one-day operation are consistent with the theoretical approach used in the design of the centralized control. Our study is a tool for companies working in the development of electric vehicles and more specifically for enterprises dealing with the design of charging stations for EVs, because they can use it in making technical and economic decisions regarding location, energy consumption, recommended operating levels, and size of ESS. The electric power companies could also benefit from the predictions of the study since they can estimate the energy demand of different UFCSs located in specific areas of the power network. A demonstrator on a reduced scale of 1:75 in power units is in progress and is expected to be completely assembled soon. The demonstrator ESS based on a pack of batteries and two super-capacitors is already working with a SCADA system that eventually will be extended to monitor the different modes imposed by centralized control. In addition, the simulation setting will be expanded and the precision of the sizing methods will be improved by including real constraints for the power imposed by the electric company, and by introducing real consumption profiles of EVs.

Author Contributions

Conceptualization, A.B.-F., D.Z.-P. and L.M.-S.; Methodology, A.B.-F., D.Z.-P. and L.M.-S.; Software, A.B.-F., D.Z.-P. and M.G.-C.; Validation, A.B.-F. and D.Z.-P.; Formal analysis, A.B.-F., D.Z.-P. and L.M.-S.; Investigation, L.M.-S.; Supervision, D.Z.-P. and L.M.-S. All authors have read and agreed to the published version of the manuscript.

Funding

This work has been sponsored by the Spanish Ministry of Science and Innovation under grant PID2019-111443RB-100.

Data Availability Statement

Data are contained within the article.

Conflicts of Interest

The authors declare no conflict of interest.

Abbreviations

The following abbreviations are used in this manuscript:
UFCSUltra Fast Charging Station
SSTSolid-State Transformer
EVElectric Vehicle
LVLow Voltage
MVMedium Voltage
ESSEnergy Storage System
SOCState of Charge
ChPCharging Point
SCADASupervisory Control And Data Acquisition
CANController Area Network
BMSBattery Management System

References

  1. Suarez, C.; Martinez, W. Fast and Ultra-Fast Charging for Battery Electric Vehicles—A Review. In Proceedings of the IEEE Energy Conversion Congress and Exposition (ECCE), Baltimore, MD, USA, 29 September–3 October 2019; Volume 9, pp. 569–575. [Google Scholar]
  2. THP CE 175 D-0. Available online: https://new.abb.com/products/6AGC067668/thp-ce-175-d-0 (accessed on 8 October 2023).
  3. 350 kW DC Fast Charger. Available online: https://www.tritiumcharging.com/product/pk-350/ (accessed on 8 October 2023).
  4. BTCPower. Available online: https://btcpower.com/products/dc-chargers-level-3-split-system/ (accessed on 14 November 2023).
  5. AURIGA DC. Available online: https://www.evup.com.au/auriga-dc-fast-charger-ocpp-350kw (accessed on 15 November 2023).
  6. Raption 400 HPC. Available online: https://circontrol.com/ev-chargers/raption-400-hpc/ (accessed on 15 November 2023).
  7. EVBox Troniq High Power. Available online: https://evbox.com/en/ev-chargers/troniq-high-power (accessed on 15 November 2023).
  8. Rafi, M.A.H.; Bauman, J. A Comprehensive Review of DC Fast-Charging Stations with Energy Storage: Architectures, Power Converters, and Analysis. IEEE Trans. Transp. Electrif. 2021, 7, 345–368. [Google Scholar] [CrossRef]
  9. Ahmad, A.; Qin, Z.; Wijekoon, T.; Bauer, P. An Overview on Medium Voltage Grid Integration of Ultra-Fast Charging Stations: Current Status and Future Trends. IEEE Open J. Ind. Electron. Soc. 2022, 3, 420–447. [Google Scholar] [CrossRef]
  10. Srdic, S.; Lukic, S. Toward Extreme Fast Charging: Challenges and Opportunities in Directly Connecting to Medium-Voltage Line. IEEE Electrif. Mag. 2019, 7, 22–31. [Google Scholar] [CrossRef]
  11. Zambrano-Prada, D.; Blanch-Fortuna, A.; Barrado, J.A.; Vázquez-Seisdedos, L.; Lopez-Santos, O.; El Aroudi, A.; Martinez-Salamero, L. Electrical architecture for ultrafast charging station. Transp. Res. Procedia 2023, 70, 170–177. [Google Scholar] [CrossRef]
  12. Valedsaravi, S.; El Aroudi, A.; Martinez-Salamero, L. Review of Solid-State Transformer Applications On Electric Vehicle DC Ultra-Fast Charging Station. Energies 2022, 15, 5602. [Google Scholar] [CrossRef]
  13. Domínguez-Navarro, J.A.; Dufo-López, R.; Yusta-Loyo, J.M.; Artal-Sevil, J.S.; Bernal-Agustín, J.L. Design of an electric vehicle fast-charging station with integration of renewable energy and storage systems. Int. J. Electr. Power Energy Syst. 2019, 105, 46–58. [Google Scholar] [CrossRef]
  14. Li, T.; Zhang, J.; Zhang, Y.; Jiang, L.; Li, B.; Yan, D.; Ma, C. An optimal design and analysis of a hybrid power charging station for electric vehicles considering uncertainties. In Proceedings of the IECON 2018—44th Annual Conference of the IEEE Industrial Electronics Society, Washington, DC, USA, 21–23 October 2018; Volume 12, pp. 5147–5152. [Google Scholar]
  15. Portada, Ministerio de Transportes, Movilidad y Agenda Urbana. Available online: https://www.mitma.gob.es/ (accessed on 8 October 2023). (In Spanish)
  16. Jing, W.; Hung Lai, C.; Wong, S.H.W.; Wong, M.L.D. Battery-supercapacitor hybrid energy storage system in standalone DC microgrids: Areview. IET Renew. Power Gener. 2017, 11, 461–469. [Google Scholar] [CrossRef]
  17. Díaz-González, F.; Chillón-Antón, C.; Llonch-Masachs, M.; Galceran-Arellano, S.; Rull-Duran, J.; Bergas-Jané, J.; Bullich-Massagué, E. A hybrid energy storage solution based on supercapacitors and batteries for the grid integration of utility scale photovoltaic plants. J. Energy Storage 2022, 51, 104446. [Google Scholar] [CrossRef]
  18. Meng, L.; Sanseverino, E.R.; Luna, A.; Dragicevic, T.; Vasquez, J.C.; Guerrero, J.M. Microgrid supervisory controllers and energy management systems: A literature review. Renew. Sustain. Energy Rev. 2016, 60, 1263–1273. [Google Scholar] [CrossRef]
Figure 1. Electrical architecture of an ultrafast charging station.
Electronics 12 04811 g001
Figure 2. Flowchart of the queue and power distribution management system.
Electronics 12 04811 g002
Figure 3. Individual power demand for 10 EVs: (a) profile of EVs and (b) waiting times. The arrows represent the assignment of an EV from the queue to one of the ChPs.
Electronics 12 04811 g003
Figure 4. UFCS demand profile: (a) power flow of the SST, ESS, and ChPs on the 1500 V bus and (b) SOC of the ESS.
Electronics 12 04811 g004
Figure 5. UFCS estimated consumption profiles for 100 daily EVs.
Electronics 12 04811 g005
Figure 6. Example of the energy flow dynamics from the ESS and towards the ESS during one-day operation for 100 EVs and 3 energy management systems.
Electronics 12 04811 g006
Figure 7. Predicted values of the ESS dynamic range using load shifting during one-day operation.
Electronics 12 04811 g007
Figure 8. Simulation of one-day operation of the UFCS for 180 EVs in normal conditions: (a) sequence of operating modes; (b) SST power; (c) ESS power; (d) SOC of ESS; (e) EV power.
Electronics 12 04811 g008aElectronics 12 04811 g008b
Figure 9. Simulation of one-day operation of the UFCS for 180 EVs with two blackouts: (a) sequence of operating modes; (b) SST power; (c) ESS power; (d) SOC of ESS; (e) EV power.
Electronics 12 04811 g009aElectronics 12 04811 g009b
Figure 10. Main screen of the SCADA program in standby.
Electronics 12 04811 g010
Figure 11. Overview option for an individual module of SCADA in standby.
Electronics 12 04811 g011
Figure 12. Battery pack of 200 V nominal voltage: (a) current and voltage in the charging protocol and (b) information of the state of the battery cells.
Electronics 12 04811 g012
Figure 13. Current and voltage in super-capacitor SkelMod 108 V 88 F during a discharging process in a 100 Ω resistor.
Electronics 12 04811 g013
Table 1. UFCS operating modes.
ModesDescriptionRepresentative Equations
Grid-tied operationDirect chargingThe power charging the EVs is only supplied by the SST. The remaining energy can be used to charge the ESS. P S S T = P E V + P E S S C h a r g i n g
Complementary chargingThe maximum power delivered by the SST is reached. The power flow to ChP is shared between the SST and the ESS. Hence, both elements supply the required power together.
P E S S = P E V P S S T m a x S O C E S S > 0.4
Limited chargingThe maximum delivered power from SST and the ESS is reached. The ChP service is limited by the value of the deliverable power.
P E V = P S S T m a x + P E S S m a x S O C E S S < 0.9
StandbyIn the absence of power demand, the ESS is charged waiting for service. P S S T = P E S S C h a r g i n g
Islanded operationAutonomousUnreliable operation of SST. The power demand is only supplied by the ESS. The maximum output power is limited to the maximum power delivery of the ESS. P E S S = P E V
BurnoutNo service for any vehicle arrival because the available energy in the ESS is running out. S O C E S S 0.4
DisconnectionAfter the UFCS enters burnout mode and the last EV has been dismissed, no service is provided until the SST is active again or the capacity for the ESS is guaranteed. P E V = 0
Table 2. Operating mode limitations in terms of fault detection.
Direct ChargingComplementary ChargingLimited ChargingStandbyAutonomousBurnoutDisconnection
SST fault××××
ESS fault××××
ChP fault××××
SST and ESS fault××××××
ESS and ChP fault××××××
SST and ChP fault××××××
(✓): available state. (×): state not available due to a fault.
Table 3. Static sizing of ESS in kWh.
Energy Policy100 EVs150 EVs200 EVs
Load leveling Case 1 1925.20 2470.70 2894.60
Load leveling Case 2 1668.30 2021.00 2308.40
Load shifting 2197.20 3005.10 3742.20
Table 4. Dynamic sizing of ESS for total range of operation in kWh.
Energy Policy100 EVs150 EVs200 EVs
Load leveling Case 1 1690.10 2073.40 3196.30
Load leveling Case 2 720.49 799.01 1006.60
Load shifting 3102.40 3851.40 6073.80
Table 5. Dynamic sizing of ESS for partial range of operation.
Energy Policy100 EVs150 EVs200 EVs
Load leveling Case 1 1257.70 1849.50 2440.10
Load leveling Case 2 515.84 623.11 715.86
Load shifting 2390.10 3570.20 4739.90
Table 6. Waiting times over 500 operating days.
100 EVs150 EVs200 EVs
Total number of EVs arriving at the station 50 , 000 75 , 000 100 , 000
Number of EVs waiting22914964489
Average waiting time 0.4 min 1.24 min 1.58 min
Maximum waiting time4 min 4.67 min 3.97 min
Number of dismissed vehicles007
Disclaimer/Publisher’s Note: The statements, opinions and data contained in all publications are solely those of the individual author(s) and contributor(s) and not of MDPI and/or the editor(s). MDPI and/or the editor(s) disclaim responsibility for any injury to people or property resulting from any ideas, methods, instructions or products referred to in the content.

