1. Introduction
Salient object detection aims to imitate the human visual system and rapidly identify the most attention-grabbing objects or areas [
1], followed by precise segmentation. The research on SOD has made extensive progress over the past decade. Significant object detection is crucial in computer vision, serving various purposes such as object recognition [
2], visual tracking [
3], person re-identification [
4], image retargeting [
5], image retrieval, etc. In the beginning, saliency object detection methods used hand-crafted features. However, this approach often fails to capture high-level semantic information, resulting in poor performance when dealing with complex scenes or images with complex textures and semantic contexts. Additionally, traditional methods could not adapt to new scenes and objects and had poor generalization abilities. As deep learning advances, traditional methods for salient object detection based on hand-designed features are being replaced by deep detection learning methods. In particular, the application of deep learning techniques such as convolutional neural networks (CNNs) [
6] has further advanced the development of salient object detection and greatly facilitated research in computer vision.
In the era of deep learning, several convolutional neural network (CNN)-based salient object detection methods [
7,
8,
9,
10,
11] have emerged, which significantly improve detection accuracy. The introduction of deep learning techniques has led to significant breakthroughs in the performance and efficiency of salient object detection, providing powerful tools and methods for solving real-world vision tasks. These methods almost adopt the typical structure of fully convolutional networks (FCNs [
7]) which is called “Encoder–Decoder”. The encoder is responsible for using a series of convolutions to extract the multi-level features. The decoder has to take advantage of the different characteristics of multi-level features to output the final segmentation result. The encoder–decoder structure has precipitated the classical U-shaped structure in continuous development [
8,
12,
13]. The U-shaped structure can extract multi-level feature information through top-down paths and utilize the feature information to construct high-quality feature maps. The classical network structure is often accompanied by many ingenious strategies. For example, MINet [
14] adopts a lower up/down sampling rate to integrate features from adjacent levels, yielding more efficient multi-scale features from the integrated features. GateNet [
15] employs multi-level gate units to balance the contribution of individual encoder blocks to the overall network, all the while suppressing unimportant feature regions. AGNet [
16] introduces an attention mechanism to provide attention-guided information to the network from global semantic and local contextual perspectives, and gradually refines the prediction results by mining object details through attention and inverse attention mechanisms. MCCNet [
17] comprehensively integrates foreground, background, and global information to deal with salient objects in complex contexts and generate good saliency maps. These methods are proposed based on an in-depth study of the features of natural images in different scenes and achieve excellent performance. However, the current methods use convolutional operations with local perceptual fields for feature extraction, which may not capture global contextual relevance for some scenarios that rely on semantic information for salient object detection. The cross-layer connection in the U-shape structure connects the encoder features directly to the decoder, which does not fully consider the relationship between the features of each layer and the information provided and does not mine the information adequately. The lack of processing of interfering information between the encoder and the decoder introduces misleading contextual information into the decoder, resulting in the underutilization of genuinely useful features in each layer.
Driven by the above observation, we propose a new framework for detecting saliency objects that differs from current convolutional neural network-based methods. Inspired by [
18], we use the Pyramid Vision Transformer (PVTv2) as an encoder. Due to its powerful modeling of global dependencies, global contextual information can be fully captured for more robust features. Among these features, the low-level features always have a relatively higher resolution but less semantic information than high-level features [
19]. Therefore, it is necessary to face different layer features using different strategies to explore them. Furthermore, we believe that, in addition to the foreground, the background [
20] and adjacent features [
21] are also important for integrating global image information, considering that the top layer of the encoder has access to a larger sensory field and a powerful representation that contains rich semantic information. Therefore, the advanced semantic fusion module (ASFM) is designed for the top layer of the encoder to comprehensively integrate foreground, background, and adjacent feature information, and to generate coarse saliency maps to provide positional guidance for the low-level features. Most of the studies have come to a consensus that low-level features usually enrich our prediction models by providing some important information about the local details of the final prediction results. Similar to [
16,
20,
22], we design the self-refinement module (SRM) at layers of the encoder other than the top layer. The attention mechanism is utilized to mine the key details of salient objectives from multiple dimensions, gradually enriching the coarse saliency map and eventually generating an accurate saliency map.
The encoder has different layers, and each contains specific information. The corresponding modules are designed based on this information, and a feature interaction strategy is introduced between adjacent modules [
21]. This helps to comprehensively explore the contextual information of adjacent features, thus expanding the coverage of inter-feature interactions. The top-down progressive path transfers high-level semantic information to the pyramid features at all levels. This compensates for the U-shaped network’s weakness, which loses strength as it passes information from top to bottom. Additionally, we introduce a dense lightweight refinement decoder (DLRB [
22]) to fuse various features using feature modulation. The fused feature maps are fed into the decoder to be convolved by three extensions with different expansion rates to capture information at different scales. This provides a comprehensive view of important objects from multiple scales, expands the perceptual range of the entire network, and comprehensively captures multi-scale features. The decoder has a 1 × 1 convolution after each dilated convolution, which is used to minimize the aliasing effect caused by the dilated convolution. This helps to merge the captured features and creates a robust feature representation in the decoding stage.
In summary, the contributions to this paper include the following:
- (1)
Replacing the encoder network with a pure transformer backbone called Pyramid Vision Transformer (PVTv2) to provide both global and local contextual branches for more reliable and robust features.
- (2)
To design the advanced semantic fusion module (ASFM) at the top layer of the encoder to gather semantic cues from previous and present branches, sharpen object details, and create coarse saliency maps for location guidance. This improves the network’s ability to obtain global information.
- (3)
The self-refinement module (SRM) is proposed to acquire detailed information from different dimensions by fusing adjacent branches through the attention mechanism. The information is combined with location guidance data from ASFM using feature modulation to obtain a more accurate saliency map.
The rest of this paper is organized as follows: In
Section 2, we briefly review some previous work related to SOD. In
Section 3, the proposed PASNet method is described in detail. In
Section 4, we perform several experiments and discuss experimental comparisons and ablation analysis to validate the proposed model. Finally, the conclusions of this paper are given in
Section 5.
2. Related Work
Early salient object detection methods relied heavily on manually crafted features for saliency calculations [
6,
23,
24,
25]. Although hand-crafted features can allow traditional salient object detection methods to perform detection in real time, the drawbacks of these methods limit their ability to perform salient object detection in complex scenes. In recent years, the convolutional neural network (CNN) [
26] has achieved great success in the field of salient object detection (SOD) and has been dominating SOD research due to its superior feature representation capabilities. The excellent performance and capabilities of CNNs have made them the tool of choice in saliency detection tasks. Currently, most CNN-based work uses pre-trained image classification models for saliency detection, such as VGG [
27] and ResNet [
28] as encoders. These methods focus on building efficient decoders by integrating multi-level features [
29,
30]. However, since the model structure of CNNs is characterized by modeling for local information aggregation, it is difficult to model long periods and cannot capture global contextual information well for some scenarios that rely on global semantic information for saliency object detection. To overcome the problem that the CNN model structure is limited to extracting local information while ignoring global information, many CNN-based studies have made a series of improvements to further enhance the performance. For example, Zhang et al. [
31] proposed integrating multi-level features at multiple resolutions and then further integrating these features at each resolution for saliency prediction. Finally, these saliency predictions are fused to obtain the final saliency map. Cheng et al. [
30] solved the salient object detection problem by extending the pooling part of the convolutional neural network. Qin et al. [
32] proposed an innovative “predict–refine architecture” with a new hybrid loss function to improve the boundary detection of salient objects. This approach not only emphasizes accurate prediction but also focuses on the boundary information of the object, thus improving the accuracy and quality of saliency detection. Differently, Zhao et al. [
33] extracted salient edge information from ground truth and used it to purposefully guide the neural network to learn edge features for one-to-one guidance. Yu et al. [
34] proposed to the use of either a large convolution kernel or a dilated convolution (atrous convolution) to increase the receptive field. The network’s receptive field can be directly expanded by a large convolution kernel. The dilated convolution increases the receptive field by introducing voids (intervals) in the convolution operation to better capture long-period information. Furthermore, in [
26], Liu and his research team investigated local and global attention mechanisms that object the pixel level for more efficient detection. Chen et al. [
20] successfully incorporated background information to improve detection performance by introducing a reverse attention mechanism. Prajit Ramachandran et al. [
35] proposed an independent self-attentive layer and a spatially aware independent self-attentive layer to replace the convolution. The spatially aware independent self-attentive layer adds some position-related information to the independent self-attentive layer. However, these strategies still have limitations in global dependency modeling. We recently found that the Vision Transformer [
36,
37,
38], with a complete sequence of remote dependencies, excels in global dependency modeling in image processing, which inspired us to delve deeper into how we can utilize the Transformer to improve SOD performance.
Originally proposed by researchers such as Vaswani [
36], the Transformer is originally designed to be used in the field of natural language processing, especially for solving machine translation tasks. This innovative modeling architecture debuted in 2017, generating a great deal of interest in the field of computer science. The transformer network employs a self-attention mechanism (self-attention) to model long-term dependencies by alternately superimposing layers of multi-head self-attention (MHSA), which aims to enhance feature representations. Unlike convolutional layers, MHSA layers have dynamic weights and global perceptual ranges, and thus are more flexible and efficacious. In recent years, with the great success of Transformers in NLP, researchers have introduced transformers into the field of computer vision with satisfactory results. Dosovitskiy et al. [
37] proposed a Vision Transformer (ViT), which is the first pure transformer model dedicated to image classification tasks. The ViT divides the incoming raw image into image blocks (patches) at regular intervals of a certain region size and then combines the divided image blocks into sequences. The sequences are fed into the encoder part of the original Transformer model, and finally the images are classified through the fully connected layer. Since then, a large number of studies on visual transformers [
33,
39,
40] have emerged, which outperformed the current leading CNN models in terms of performance. Mao et al. [
38] adopted the Swin Transformer [
39] as an encoder and also designed a simple and effective decoder based on CNNs for predicting saliency maps. After years of development, the CNN backbone in computer vision has gradually formed some general network patterns, the most classic of which is the pyramid structure. Almost all dense prediction algorithms are designed based on the feature pyramid structure. To better handle intensive prediction tasks such as semantic segmentation, several approaches [
15,
39,
41] have also introduced the pyramid structure of convolutional neural networks (CNNs) into the design of transformer backbone networks to improve the network performance and enrich the semantic information. For example, the PVT-based model [
15,
41] has been successfully applied with a hierarchical transformer structure, which contains four different stages, achieving excellent performance. It indicates that the pure transformer backbone network is comparable to the conventional convolutional neural network (CNN) in terms of generalization. When applied to detection and segmentation tasks with the same number of parameters, the pure transformer backbone network shows better performance compared to CNNs.
Although pure transformer backbone networks perform well in practical applications, the feature pyramid structure is favored for its superior feature extraction capability. This structure can fully exploit the contextual information in the network. Therefore, the feature pyramid structure is still widely used and continuously improved. With the rapid development of deep learning in the field of computer vision, salient object detection methods based on feature pyramid structures [
13,
42,
43,
44] have emerged and continue to improve their performance. These methods allow models to simultaneously consider features at different scales by effectively utilizing multi-scale information. This allows the network to obtain a fuller picture of the image content and capture salient objects of various shapes and sizes. Hou et al. [
45] achieved efficient feature representation by continuously mixing deep features into shallow layers. Liu et al. [
26] combined global and local pixel-level contextual attention networks to enable the model to simultaneously consider the entire image as well as detailed information from different regions. The network can capture global and local contextual information in the image in a more comprehensive and fine-grained way. Zhang et al. [
46] introduced a progressively improved architecture with a knowledge review aimed at enhancing the effectiveness of object detection. This architecture is realized by gradually integrating multiple levels of contextual information. With the above approach, it is easy to find that contextual information has a crucial role in saliency objective detection (SOD). This information is not only present in a single feature layer but also well-represented between adjacent feature layers. The parallel use of convolutional layers with different convolutional kernels within a single feature layer is a popular strategy for capturing both local and global content. It helps to efficiently capture salient objects of variable sizes or uncertain numbers in natural images. In this work [
21], the synergy of feature interaction strategies is introduced to harmonize the three scales of the current, preceding, and following features. In this way, the previous and the latter features provide global auxiliary information for the current feature. Meanwhile, the fusion of contextual information is further enhanced by using the convolution of different convolution kernels in parallel in different feature layers. Gongyang Li et al. [
22,
47] enable the model to comprehensively analyze image content at different abstraction levels and scales by using multiple strategies to deeply mine the information in high-level features and low-level features. It is well known that the features extracted from a feature extraction network can be categorized into low-level features and high-level features. The low-level features mainly contain the detail and texture information of the image, while the high-level features cover the semantic and location information of the image. Considering that the two contain different information, it is necessary to object the extraction of the information contained in the features, which is especially crucial.
Inspired by the above methods, PVTv2 [
41] is used as the backbone network in our proposed PASNet method to overcome the problem that CNN models are difficult to model for a long time. Network construction is performed from a global perspective, and a new adaptive multi-content complementary network framework for salient object detection is designed. To solve the problems of inaccurate localization and the loss of detailed information in salient object detection, we use global information to localize salient objects. And we utilize the attention mechanism to obtain rich detail information so that the network pays more attention to the salient regions that contain rich detail information. To cope with the problem of insufficient information extraction from the encoder, we introduce a feature interaction strategy. This strategy aims to comprehensively mine the information in the encoder and employs multiple methods to explore different levels of features.
3. Proposed Salient Region Detection Model
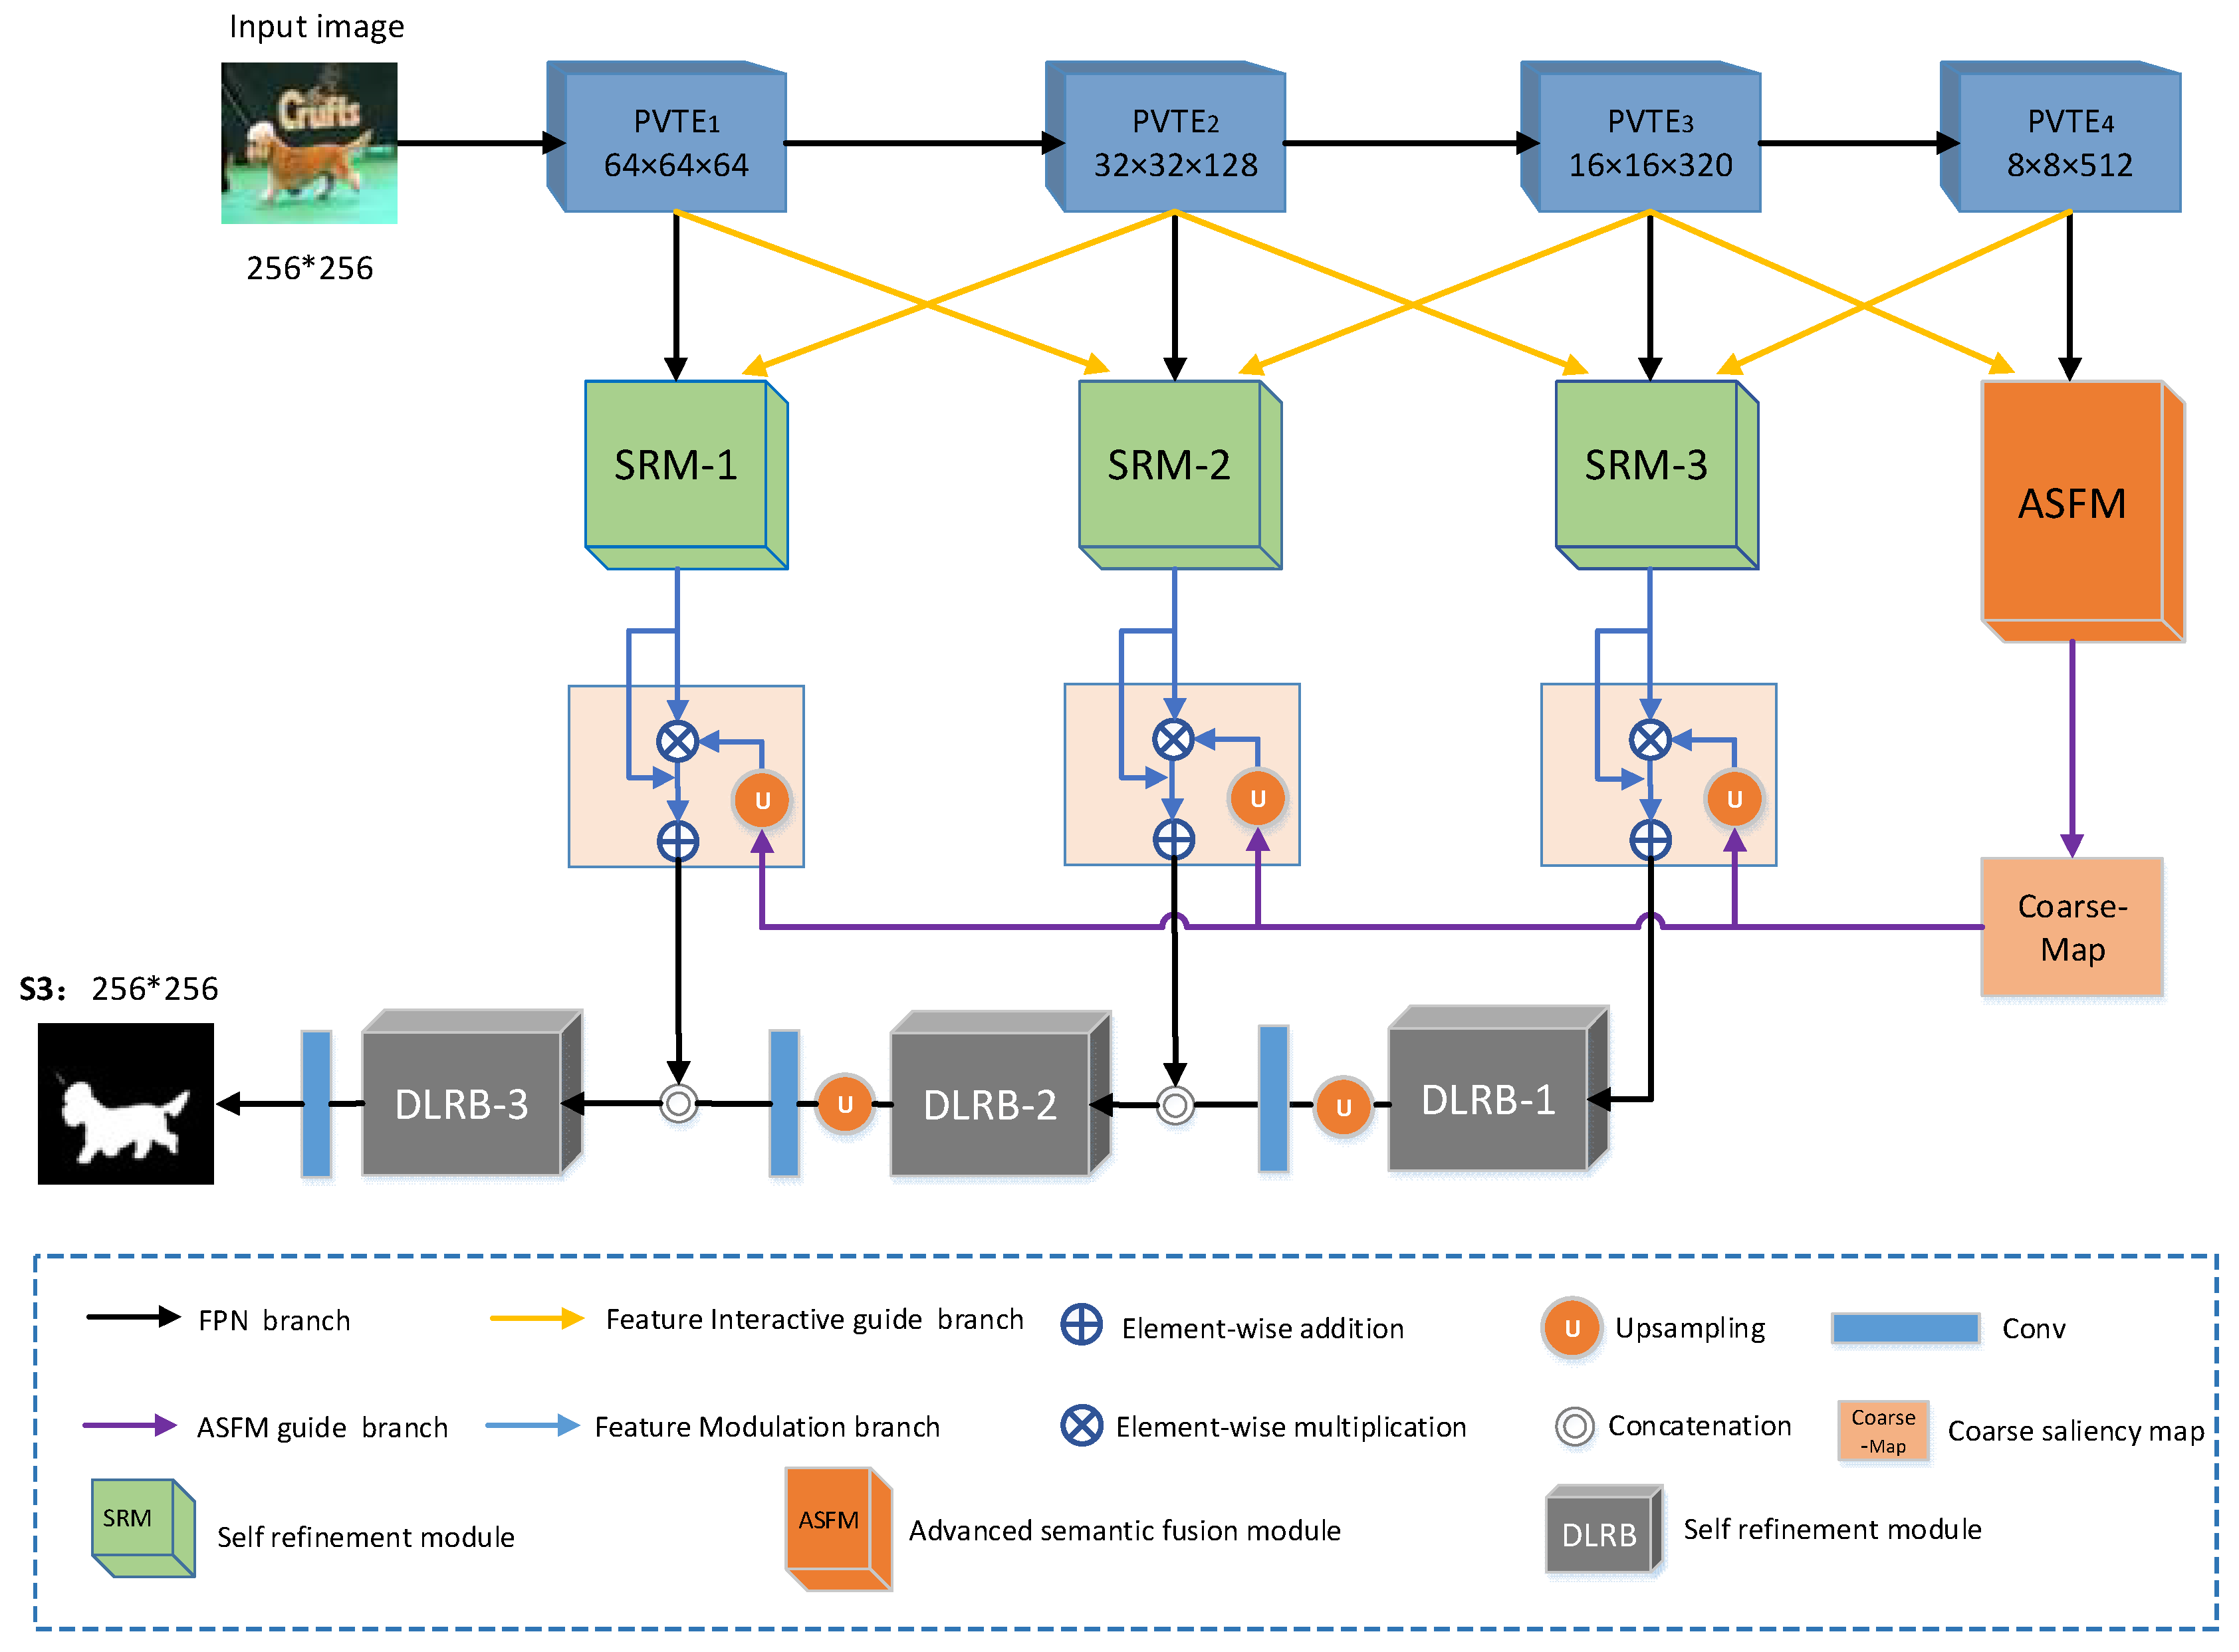
In this section, we deeply explore the design of the PASNet. The overall architecture of the PASNet is shown in
Figure 1, and we will detail its various components and key designs step by step. As seen in
Figure 1, the network proposed in this paper consists of four main components: the pyramidal visual transformer encoder block (PVTE), the advanced semantic fusion module (ASFM), the self-refinement module (SRM), and the dense lightweight refinement decoding block (DLRB). In this section, we will first provide a detailed description of the general architecture of the model and then introduce each component of the network one by one.
3.1. Network Overview
Specifically, given an input image,
, we first extracted the four pyramid features using the backbone [
41] based on the PVTv2 transformer,
,
, and
. Multi-scale long-period dependent features are extracted from input images. This method collects semantic cues and locates salient objects by progressively aggregating high-level features. Then, the pyramid features
and
, which contain more semantic information, are transferred to the advanced semantic fusion module (
). The
further expands the sensory field by fusing different levels of high-level features to collect global contextual information. This module can capture the exact location of salient objects more accurately and generate a coarse saliency map to provide location guidance for the fusion of the underlying features. Pyramid features with more detailed
,
, and
information interactions are fully exploited for texture and boundary information in the features through the self-refinement module (
). Moreover, to prevent high-level semantic information from being diluted in a top-down path, we directly aggregate
high-level features into the feature mapping of each feature layer to provide multi-scale information for decoders at all levels. Finally, the detailed features and high-level semantic features of the encoder are continuously fused via feature modulation. The DLRB decoder senses the multi-scale information and refines the incoming fused features to ensure that feature maps of different scales can be seamlessly fused and output.
3.2. Pyramid Vision Transformer Encoder
The backbone network plays a central role in the whole algorithmic process. The backbone network is mainly responsible for extracting features from the input image, which includes underlying texture, edge information, and high-level semantic information. The quality and efficiency of these feature extraction processes are critical to the performance of saliency object detection. The design and selection of the backbone network directly affect the effectiveness and accuracy of the overall saliency object detection network. Several recent studies [
48,
49] find visual transformers [
15,
41] to have stronger performance and robustness against interference than CNNs [
27,
28]. Inspired by these results, we choose to use visual transformers as our backbone network to extract robust and comprehensive feature information of salient objects in images. This backbone network helps to provide a more reliable basis and information foundation for the next salient object detection task. The visual transformer serves as a powerful deep-learning architecture with excellent feature extraction capabilities. It is able to better capture the semantic and structural information in the image, which is expected to further improve the performance and robustness of salient object detection. Unlike [
14], which uses a fixed “columnar” structure or a shifted window approach, PVT [
40] uses a pyramidal structure to compute the representation by reducing spatial attention operations, thus reducing resource consumption. It is worth mentioning that the backbone network we propose to model is interchangeable, and our network framework is equally applicable to other well-known transformer backbones.
Specifically, we use an improved version of PVT, PVTv2 [
41], which makes up for three shortcomings of PVT: (1) the use of convolution to extract locally continuous features; (2) the overlapping block embedding with zero padding to extract location information encoding; and (3) the attention layer with average pooling and linear complexity. Thanks to the above three improvements, the resulting PVTv2 achieves significantly better performance than PVTv1 and has a more powerful feature extraction capability. To adapt PVTv2 to the saliency object detection task, we remove its last classification layer and generate four multi-scale feature maps (
–
) at different stages, where (
) provides high-level semantic cues.
3.3. Advanced Semantic Fusion Module
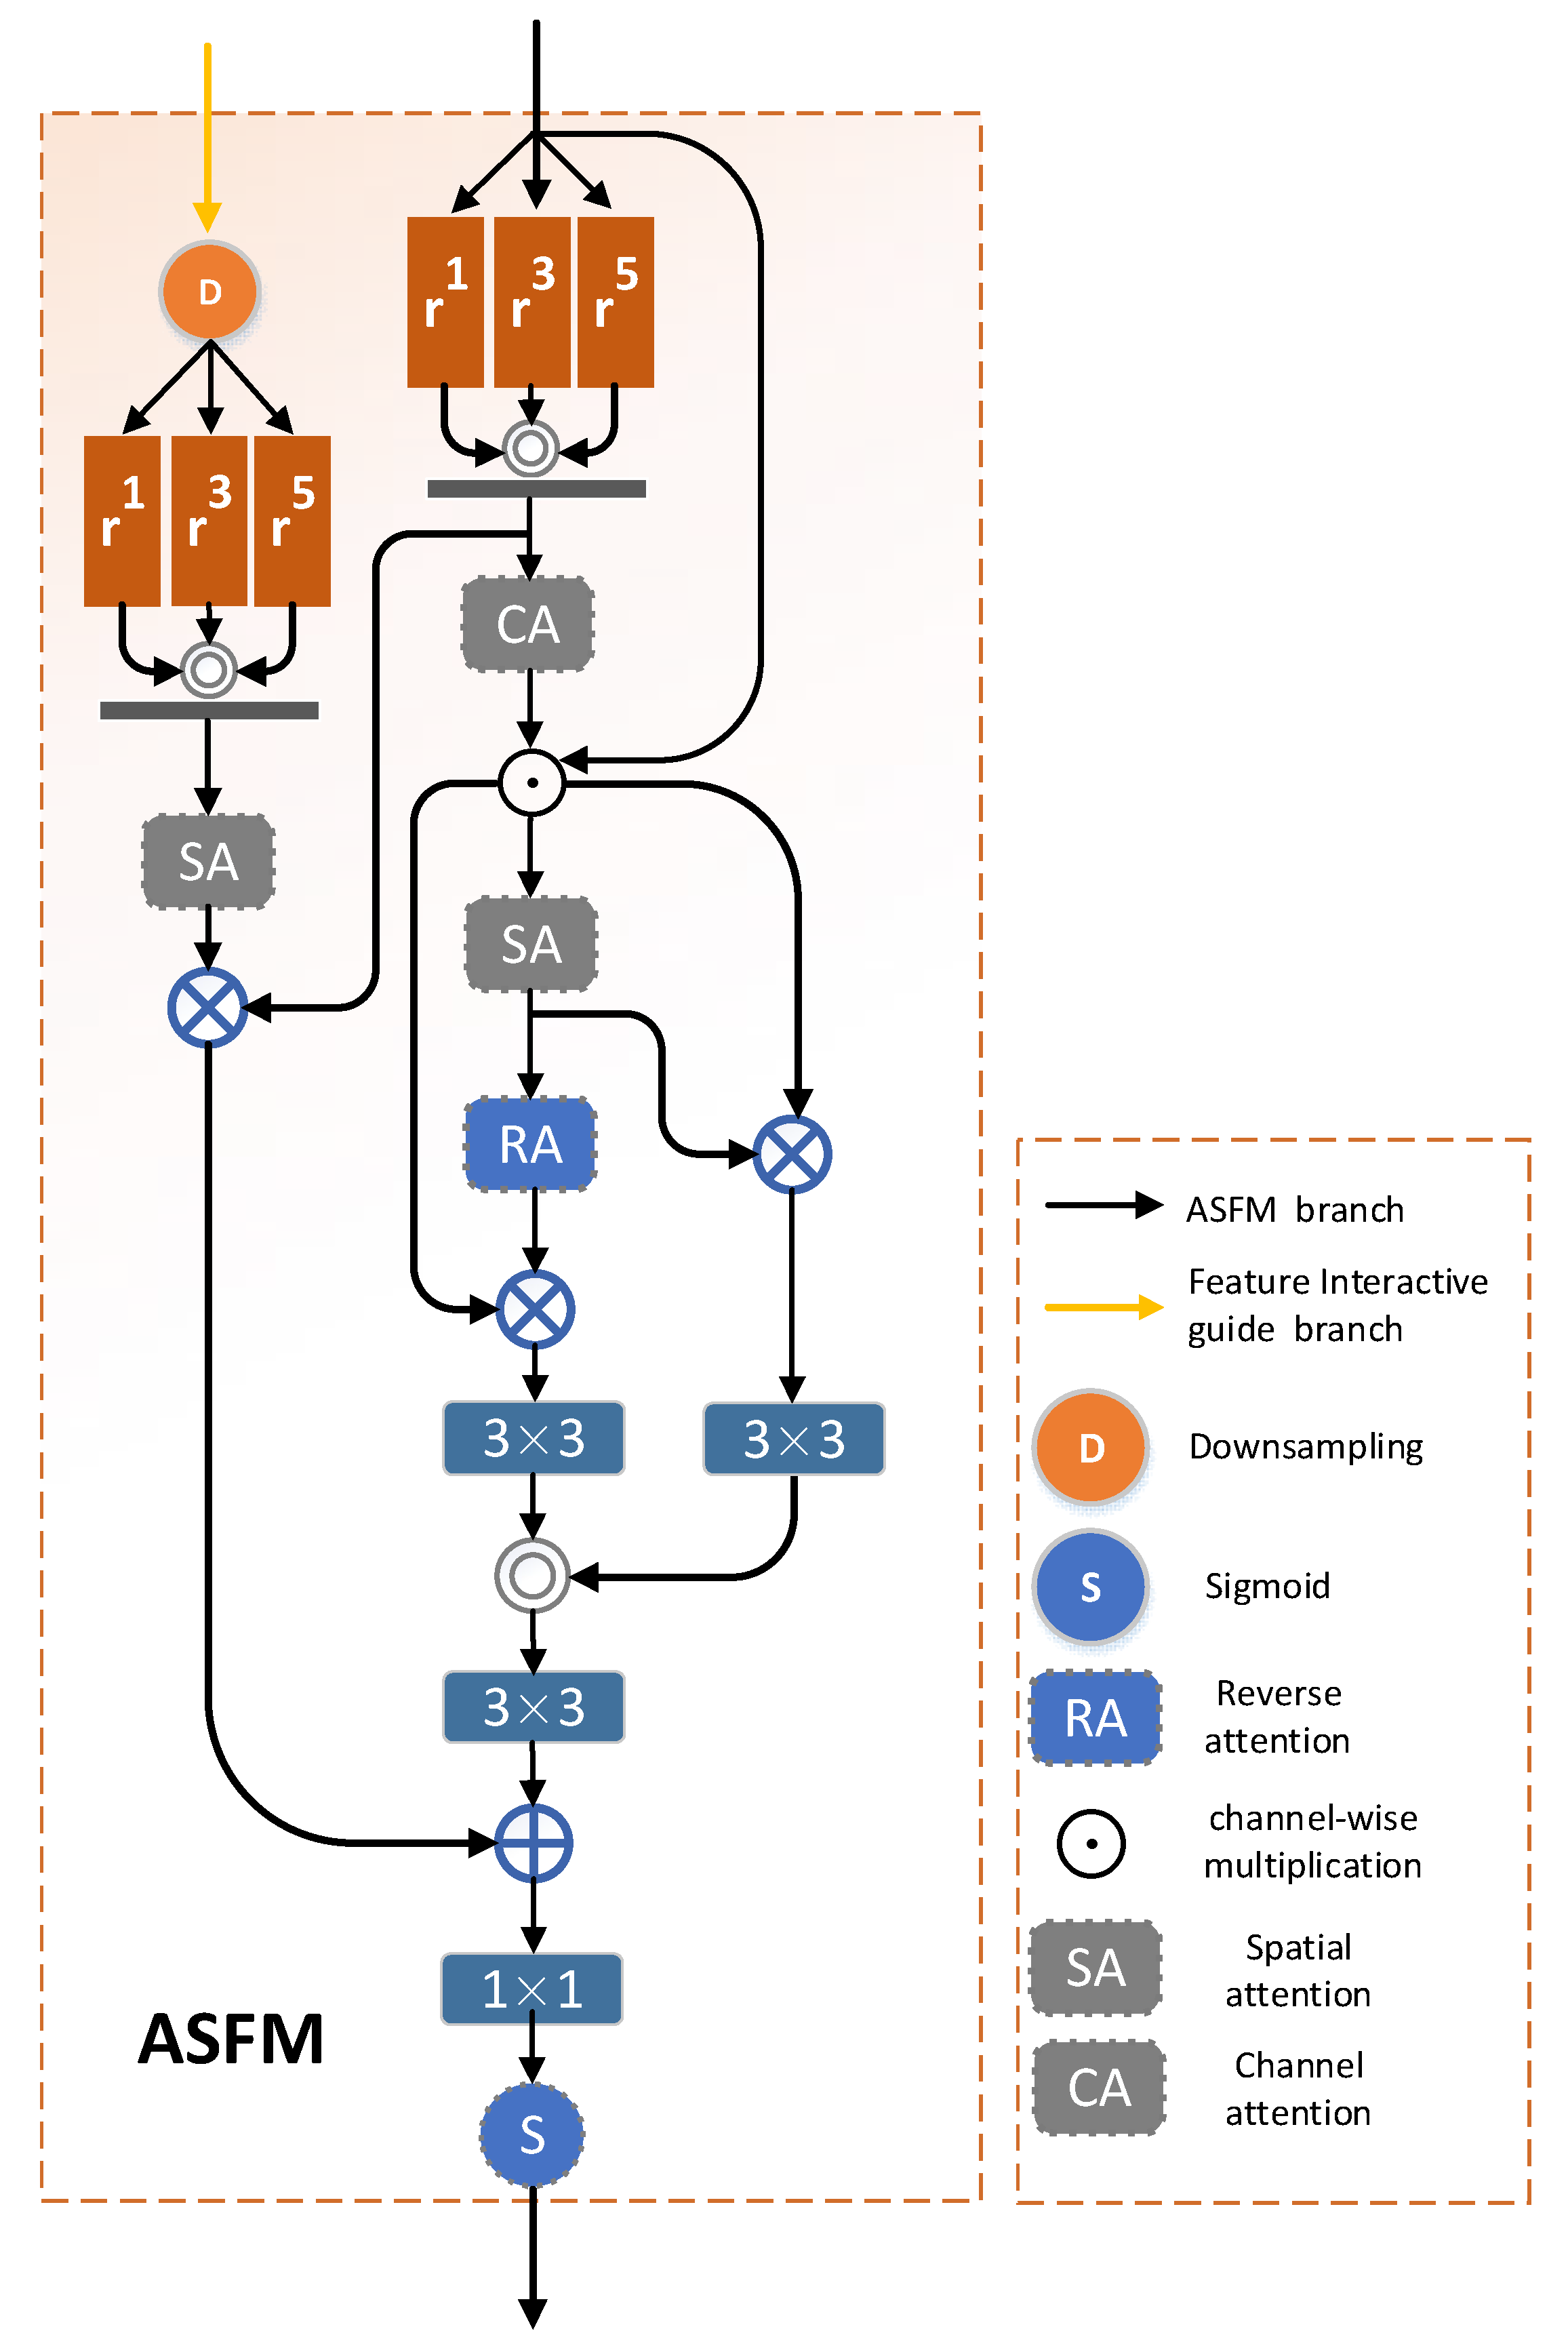
In general, high-level features usually contain richer semantic information and are not limited to a single feature level but span across adjacent levels. Therefore, we use the features extracted from the last two levels of the encoder to collect semantic information, and the advanced semantic fusion module (ASFM) is designed for this purpose. Specifically, the module fully extracts high-level semantic information from different features by fusing current and previous cross-scale features.
Figure 2 shows the internal structure of the module. The ASFM module has two branches, including the current branch and the previous branch, and the current branch (
) is noted as (
). The current branch undergoes three dilated convolutions [
50] with dilation rates of 1, 3, and 5 to obtain the output features (
) with different dilation rates. The output characteristics can expand the receptive field by expanding the convolution so that the model can better understand the global structure and the relationship between the objects in the image. Secondly, dilated convolution can help the model to capture the contextual information in the image so that the model can better understand the semantics of the objects. At the same time, dilation convolution can reduce the ambiguity generated during the convolution process so that the network can accurately locate the position of salient objects. These output features are then aggregated and fused through splicing convolution operations to obtain features with rich contextual cues (
). The aggregated fused features are used to reduce redundant information by obtaining feature (
) through the channel attention mechanism [
20], which can be formulated as follows:
where
is the dilated convolution,
is the parameters with a 3 × 3 kernel,
is the dilation rate,
is the convolution layer,
is the splicing operation between the channel axes,
is the channel attention, and
is the channel-wise multiplication.
Then, the foreground map is obtained through spatial attention [
20], notated as
, as the foreground map can provide an effective guide for locating salient regions. Therefore, we employ foreground maps to emphasize salient areas at the feature level to make them more prominent, which can be expressed as follows:
where
is the 3 × 3 convolution layer,
is the spatial attention, and
is the element-by-element multiplication.
Although the foreground image obtained through the attention mechanism can accurately localize the position and general outline of the salient object, it cannot completely extract the boundary and detail information of the salient object. This missing information can be mistaken for the background, so it is essential to extract the detail information from the background. Since the generation of the background map is closely related to the foreground map, it can be noted in reverse [
20] that the background map is
. Adopting the prominent non-significant regions of the background map at the feature level, the foreground and background maps are spliced and fused to further mine richer and more significant information, obtaining the spliced and fused feature notated as
. This process can be expressed as follows:
where
is the element-wise subtraction,
is the spatial attention,
is the element-by-element multiplication,
is a 3 × 3 convolution layer, and
is a splicing operation between channel axes.
The previous branch,
, is denoted as
. Since the features of the adjacent branches differ in scale from the current feature, the resulting output feature after the down-sampling, inflationary convolution, and spatial attention operations of the adjacent branches can be referred to as
. The output feature provides global auxiliary information for the current branch and aligns the saliency region. After effective coordination, we fuse the output features of these two branches. This integrated feature is subsequently activated via feature selection to generate a coarse salient map,
, for positional guidance. The details are as follows:
where
is the spatial attention,
is the element-by-element multiplication,
is the down-sampling operation,
is the sum of elements,
is the activation function, and
is the 1 × 1 convolutional layer.
With the advanced semantic fusion module (ASFM), each salient region can be activated comprehensively and accurately. It effectively fuses multi-level advanced semantic information and enhances the contrast between salient and non-salient regions to obtain an accurate location guidance map.
3.4. Self-Refinement Module
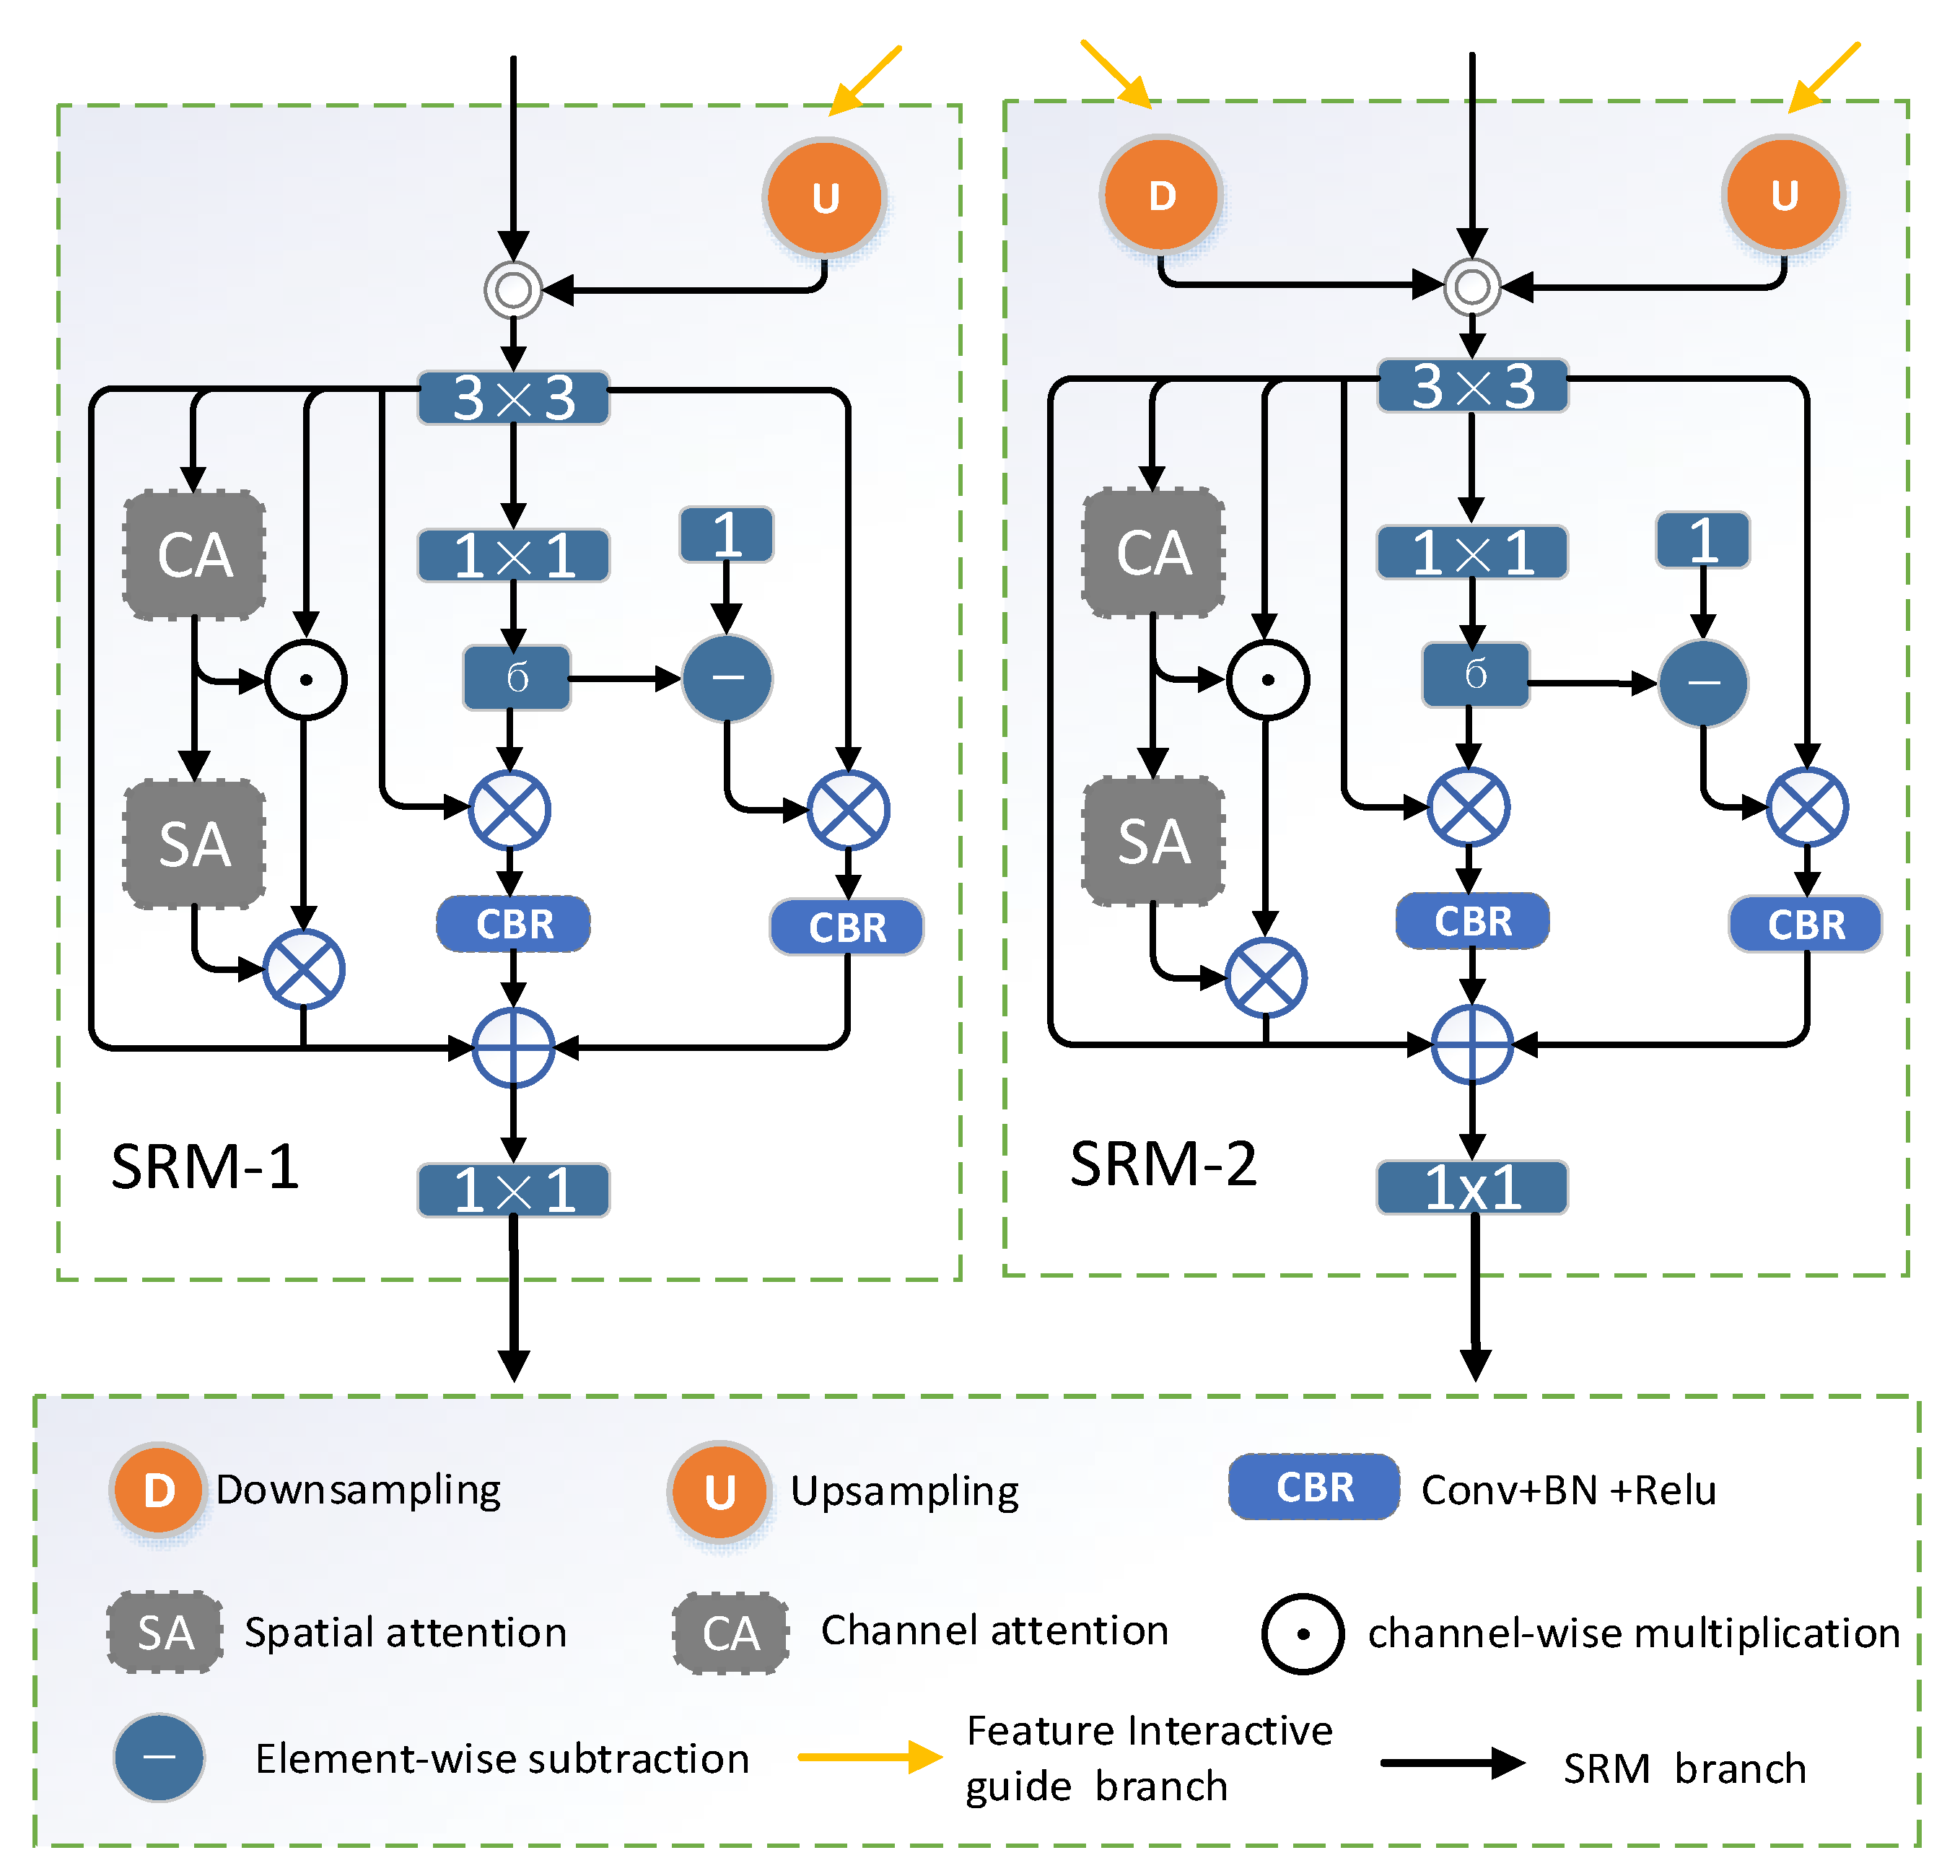
Typically, the shallow features of a network carry rich information about the local details in the image, which are crucial for the final prediction results. These shallow features include not only details such as texture, color, and edges, but also some local information that may be lost or blurred in deeper features. Therefore, utilizing shallow features can provide us with more comprehensive and precise information, which helps to improve the quality and accuracy of prediction results. To obtain robust segmentation results and fully integrate the detailed information, we employ a self-refinement module (SRM) in the network. This module is designed for encoder hierarchies other than the top encoder. Its main task is to collect rich detailed semantic cues at different scales to capture the detailed information of salient objects more comprehensively. With the introduction of the self-refinement module (SRM), we are able to effectively enhance the network’s perception of detailed information at all layers, thus improving the quality and accuracy of the segmentation results. The application of this strategy allows the network to better adapt to various complex scenes and salient object characteristics.
Figure 3 shows the internal structure of this module.
takes adjacent features as input, and makes the features at the same scale after a sampling operation. The detailed information of the two layers of features is fused through channel splicing and convolution operations to obtain the fused feature,
. The representation is as follows:
where
is the 3 × 3 convolutional layer,
is the cross-channel concatenation,
is the down-sampling operation, and
is the up-sampling operation.
The fused feature maps are convolved to obtain an attention map focusing on salient regions. The nonsignificant regions often contain some information ignored by the significant regions. To address this challenge, a reverse attention map is generated by inverting the attention map to refocus on information that the network may have missed. This approach focuses attention on regions that are usually ignored to ensure that important details in the image are not missed. In this way, the information in the image is captured more comprehensively, improving the robustness and effectiveness of feature fusion. By multiplying and fusing the two attention maps with features
at the element level, the network is guided to dig deeper into saliency information, both in salient and non-salient regions [
16]. It is well known that low-level features usually contain rich detail information such as texture, color, edges, etc. When recognizing significant object details, an efficient feature extractor is needed to fully capture and utilize these rich detail features. Therefore, we add the channel attention operation [
51] and spatial attention operation [
52] to the SRM to capture salient object details from different dimensions of the fused feature map,
, to obtain the spatial channel attention map,
. Finally, these three results are fused via a convolution operation to obtain the output,
, of the
. This process can be represented as follows:
where
is the 1 × 1 convolution layer,
/
is the space/channel attention,
is the channel-wise multiplication,
is the element-by-element multiplication, and
is the convolution, normalization, and activation operations.
Finally, the output detailed feature map,
, from
contains rich detail information, but the localization of salient objects is not accurate and requires accurate location information for guidance. At this point, the location guidance map generated by the ASFM and the detailed feature map
is harmonized by means of feature modulation to generate the final output,
, and deliver it to the decoder. Feature modulation is a coarse saliency map generated by the ASFM that is up-sampled to generate the same size as each layer’s feature map. Then, the coarse saliency map is augmented with the layers’ feature maps by multiplying them element by element to enhance the saliency information. Finally, the information lost during the information enhancement process is supplemented by employing residual concatenation. The formula is as follows:
where
is the up-sampling operation,
is the element-by-element multiplication, and
is the element-wise addition.
The self-refinement module (), which fuses adjacent branches, captures details in low-level features from different dimensions and fuses them with high-level semantic information produced by the ASFM through feature modulation, since high-level semantic information usually contains clues about important objects in the image. By fusing it with other features through feature modulation, the representation of low-level features is enhanced and made more distinguishable. Secondly, high-level semantic information helps in understanding the relationship between objects and their surroundings. Feature modulation fuses contextual information with other features, and the network can better understand the relationship between salient objects and the background, thus improving detection accuracy. In addition, high-level semantic information is usually more stable, so fusion with other levels of features can help to suppress noise in low-level features. This helps to improve the stability of salient object detection in complex scenes. Overall, fully fusing high-level semantic information with features from other layers through feature modulation can increase the network’s understanding and perception of saliency objects. This improves the performance of salient object detection, making it more accurate, stable, and robust. Through feature modulation, the PASNet is able to obtain richer and more diverse contextual information in pictures.
3.5. Dense Lightweight Refinement Block Decoder
The network goes through an advanced semantic module to generate a location guidance map, which fuses the global location guidance information with other feature maps at different levels. However, during the feature fusion process, we have to deal with some challenging situations that occur in images from different scales as well as in natural images, such as the coexistence of multiple objects and small objects. These situations can cause the salient objects in the fused image to appear to be aliased, and also increase the difficulty of information acquisition. Therefore, we are faced with the profound problem of how to effectively reduce the aliasing effect during the fusion process while capturing and utilizing the information in the images more comprehensively. This problem deserves in-depth thinking and research to improve the effect and performance of feature fusion. For this purpose, we introduce the dense lightweight refinement decoder (DLRB) [
22], which takes the fused feature maps that have been processed by feature modulation as input. Each decoder has three depth-separable convolutions (
) with dilation rates of 2, 4, and 6, three 1 × 1 convolutional layers, and one 3 × 3 convolutional layer. The dilated
expands the perceptual field to fully capture multi-scale features. The output features of the DLRB module are denoted as
, and we take
as its input as an example. The formula is as follows:
where
is the element summation,
is the 1 × 1 convolutional layer,
is a dilation-separable convolution (where
is the dilation rate), and
is the 3 × 3 convolutional layer.
In this way, the DLRB is able to perceive multi-scale information, further expanding the perceptual range of the entire network. It also helps to reduce the aliasing effect caused by model up-sampling, and captures detailed information more comprehensively. In the refinement phase, the DLRB can provide a robust and fine-grained feature representation of the network.
3.6. Loss Function
To improve the training effectiveness of the PASNet, we adopt a comprehensive loss function that combines the classical binary cross-entropy (BCE) loss and the IoU (intersection over union) loss. This comprehensive loss function not only helps the network to learn the locations of saliency objects, but also motivates the network to better understand the boundaries and shapes of the objects, thus improving the effectiveness and performance of the training. The flexibility of this loss function design makes the network more adaptable to the needs of various saliency detection tasks. In addition, to further improve the effectiveness of training, we employ deep supervision [
45,
53] in the training phase. With deep supervision, we supervised the coarse salient maps and the fine salient maps generated during network refinement. It ensures that the network receives accurate guidance and feedback at different stages, thus improving the performance and robustness of saliency object detection. We denote the total loss function,
, as follows:
where
G is the truth map and
and
are the BCE loss and IOU loss, respectively.
4. Experiments
In this section, we provide an in-depth analysis of key performance factors in the field of salient object detection. First, we conduct an extensive performance evaluation, thoroughly testing five commonly used salient object detection datasets to measure the performance of different approaches. Using five classical evaluation metrics, we comprehensively compare the performance of various models, while also considering various factors such as the characteristics of the datasets, the choice of evaluation metrics, and implementation details. We are proud that our PASNet method significantly outperforms the current leading salient object detection methods in terms of qualitative performance. Our method not only achieves excellent performance on multiple datasets but also obtains impressive results on various evaluation metrics. This demonstrates the PASNet’s superior ability to capture salient objects. In addition, we conduct a series of ablation experiments to deeply investigate the effectiveness of each module within the PASNet method. These experiments reveal the contribution of each module to the overall performance, providing key insights for further optimization of the method. Our study not only provides an efficient solution for salient object detection but also provides valuable references and inspiration for future related research.
4.1. Datasets
We train and evaluate the proposed PASNet model and fifteen recent state-of-the-art salient object detection methods in terms of five benchmark datasets.
ECSSD: The dataset [
54] contains 1000 images, including many structurally complex images such as natural landscapes, city streets, buildings, and people. The images also vary in resolution. Each image in the ECSSD dataset has a pixel-level saliency annotation to indicate the location of salient objects in the image.
HKU-IS: This dataset [
55] has 4447 complex scenes with multiple disconnected salient objects, some of which have overlapping borders and similar fore-/background appearances. These images have different contents and scenes, including people, animals, landscapes, streets, etc. In addition, the images in the dataset have different resolutions, covering the range from low to high resolution. This variation in resolution allows researchers to evaluate and compare the performance of image segmentation algorithms in different contexts.
PASCAL-S: This dataset [
56] includes 850 images which select from the segmentation dataset of PASCAL VOC 2010. It contains 20 common object categories, which is a widely used dataset for image recognition and object detection. The images in PASCAL-S are from different categories in the PASCAL VOC 2010 dataset, covering various scenes such as indoor, outdoor, natural scenery, and people. These images are mainly labeled based on the human eye motion dataset without obvious salient objects, which makes this dataset difficult to predict.
DUT-OMRON: This dataset [
57] consists of 5168 challenging images, which is a large-scale dataset for salient object detection. This image dataset includes different indoor and outdoor environments with rich content and diverse scenes. Typically, each image includes one or more foreground objects which have a complex background.
DUTS: This dataset [
58], with 10,553 training images in the DUT-TR training set and 5019 test images in the DUT-TE test set, is the largest salient object detection dataset. The goal of this dataset is to bring together images from different domains and scenes to provide a comprehensive and diverse resource for salient object detection. These images contain very complex scenes and are rich in content.
4.2. Evaluation Indicators and Implementation Details
- (1)
Evaluation metrics: For quantitative evaluation, we use five commonly used metrics—precision–recall (PR) curves, MaxF-measure (MaxF) scores, E-measure scores, S-measure scores, and mean absolute error (MAE)—to visually compare the significance maps with the ground truth. Each metric provides a different dimensional performance measure to fully assess the effectiveness of the model. The selection of these metrics reflects the diversity and comprehensiveness of the evaluation and ensures a comprehensive assessment of the model’s performance in different domains and tasks.
Precision–recall (PR) curve: Precision, also referred to as the check rate, indicates the percentage of samples correctly predicted as positive cases to all samples predicted as positive cases by the model. Recall, also referred to as the check rate, represents the percentage of samples correctly predicted as positive cases out of all samples that are actually positive cases (ground truth). We binarized the salient map using variable thresholds from 0 to 255, and for each threshold, we compute the precision and recall of the binarized map versus the true graph, and thus plotted the PR curve. The closer the position of the PR curve is to the upper right corner, the better the performance of the model. This means that the model is able to maintain high precision while also having high recall.
MaxF-measure (MaxF) score: The MaxF score is an important performance metric that balances the values of inspection accuracy and inspection completeness by taking a reconciled average of the two metrics. It combines two key performance metrics, inspection accuracy and inspection completeness, to fully evaluate the performance of the model at different thresholds. We use MaxF-measure, denoted as MaxF, for various thresholds varying in the range from 0 to 255, calculated as follows:
where precision and recall are the precision score and recall score, respectively, and
is fixed at 0.3 according to the suggestion of [
59].
E-measure: This metric is introduced to more fully assess the similarity and improve the performance between two binary images. First, E-measure removes the effects of luminance and contrast by aligning the global means of the two binary images, ensuring that the comparison is fair. Then, the similarity between the two images is measured using a local pixel-level correlation that takes into account the luminance values of each pixel and its surrounding pixels. E-measure takes values between 0 and 1, where 0 means that the two binary images are not at all similar to each other, while 1 means that they are identical to each other.
where
denotes the enhanced alignment matrix and
and
are the height and width of the saliency map.
S-measure: The structural measure is an assessment tool dedicated to measuring the structural similarity between a continuous-valued saliency map (CVSM) and the ground truth. It typically ranges from 0 to 1, where higher S-measure values indicate greater structural similarity between the saliency map and the ground truth, thus reflecting the efficacy of the test method.
represents the object-perceived structural similarity, which considers the structural similarity between an object or objects and its background. In this metric, the comparative factors of the foreground and background are summed with certain weights to reflect the structural relationship between the object and its surroundings.
involves region-aware structural similarity, which partitions the saliency map and ground-truth into multiple local regions and computes the structural similarity metrics for each region, and then weights and sums them. Thus,
can be defined as
where
is the balance parameter, which is set to 0.5, as suggested by Fan et al. [
60].
Mean absolute error (
MAE): Mean absolute error (
MAE) is an important metric used to measure the difference between the significance map (
M) and the ground truth map (
T). It takes the absolute value of the difference between each pixel point of the significance plot and the true value plot, and then adds these absolute values and averages them. The smaller the value of the
MAE, the lower the error between the significance plot and the true value, further reflecting that the better the test method and the more effective its performance. It can be defined as
where
and
are the height and width of the image, respectively.
- (2)
Implementation details: We use the DUTS-TR dataset [
58] as a training dataset during our research, which contains up to 10,553 images, providing a rich data resource for our training. To implement our proposed PASNet model and conduct related experiments, we rely on a personal computer equipped with RTX 2080 Ti GPUs and use the PyTorch2.0.1 [
61] repository as the basis for an end-to-end implementation. During the training phase, we normalize the size of the input training samples to 256 × 256 pixels to ensure that the model is well adapted to images of different resolutions. Our training process employs an asymptotic learning rate strategy, where we first set an initial learning rate, 1 × 10
−4, and then the model automatically reduces the learning rate to one-tenth of the original rate after 30 epochs, which helps to optimize the convergence of the model. Given the GPU memory limitations, we set a relatively small batch size of 6 to ensure the stability of training. We choose Adam as the optimization strategy [
62], while setting the weight decay parameter to 0.0005 to prevent model overfitting. To improve the robustness of the model, we also introduced data enhancement techniques. These tricks include random horizontal flipping, random rotation to increase the diversity of viewpoints, and random adjustments of brightness, saturation, and contrast to simulate different lighting and image conditions. These strategies make our model more robust and better able to cope with salient object detection tasks in a variety of real-world scenes.
4.3. Performance Comparison with State-of-the-Art Technology
Our proposed PASNet method is compared with 16 state-of-the-art salient object detection methods, including Amulet [
31], C2SNet [
63], PAGR [
64], AFNet [
65], BASNet [
32], CPD [
19], SCRN [
66], PoolNet [
30], EGNet [
33], MINet [
14], GateNet [
15], DNA [
67], SAMNet [
68], SCWSSOD [
69], UMNet [
70], and Polyp-PVT [
18]. Since the datasets on which the Polyp-PVT network is trained and tested are mostly medical images, for a fair comparison, we trained the Polyp-PVT network on its own training dataset and subsequently performed significance prediction. For a fair comparison, the PASCAL-S dataset in the UMNet [
70] method was retrained using the original code project published by the authors. The saliency maps for all other methods were used as provided directly by their respective authors. If the results of both types of backbones (VGG and ResNet) were present in the methods, the results of the ResNet backbone training were used.
- (1)
Quantitative Evaluation
To implement a comprehensive quantitative assessment, we show the scores of the four evaluation metrics, MaxF-measure, E-measure, S-measure, and MAE, and the inference speeds and FLOPs of several models in
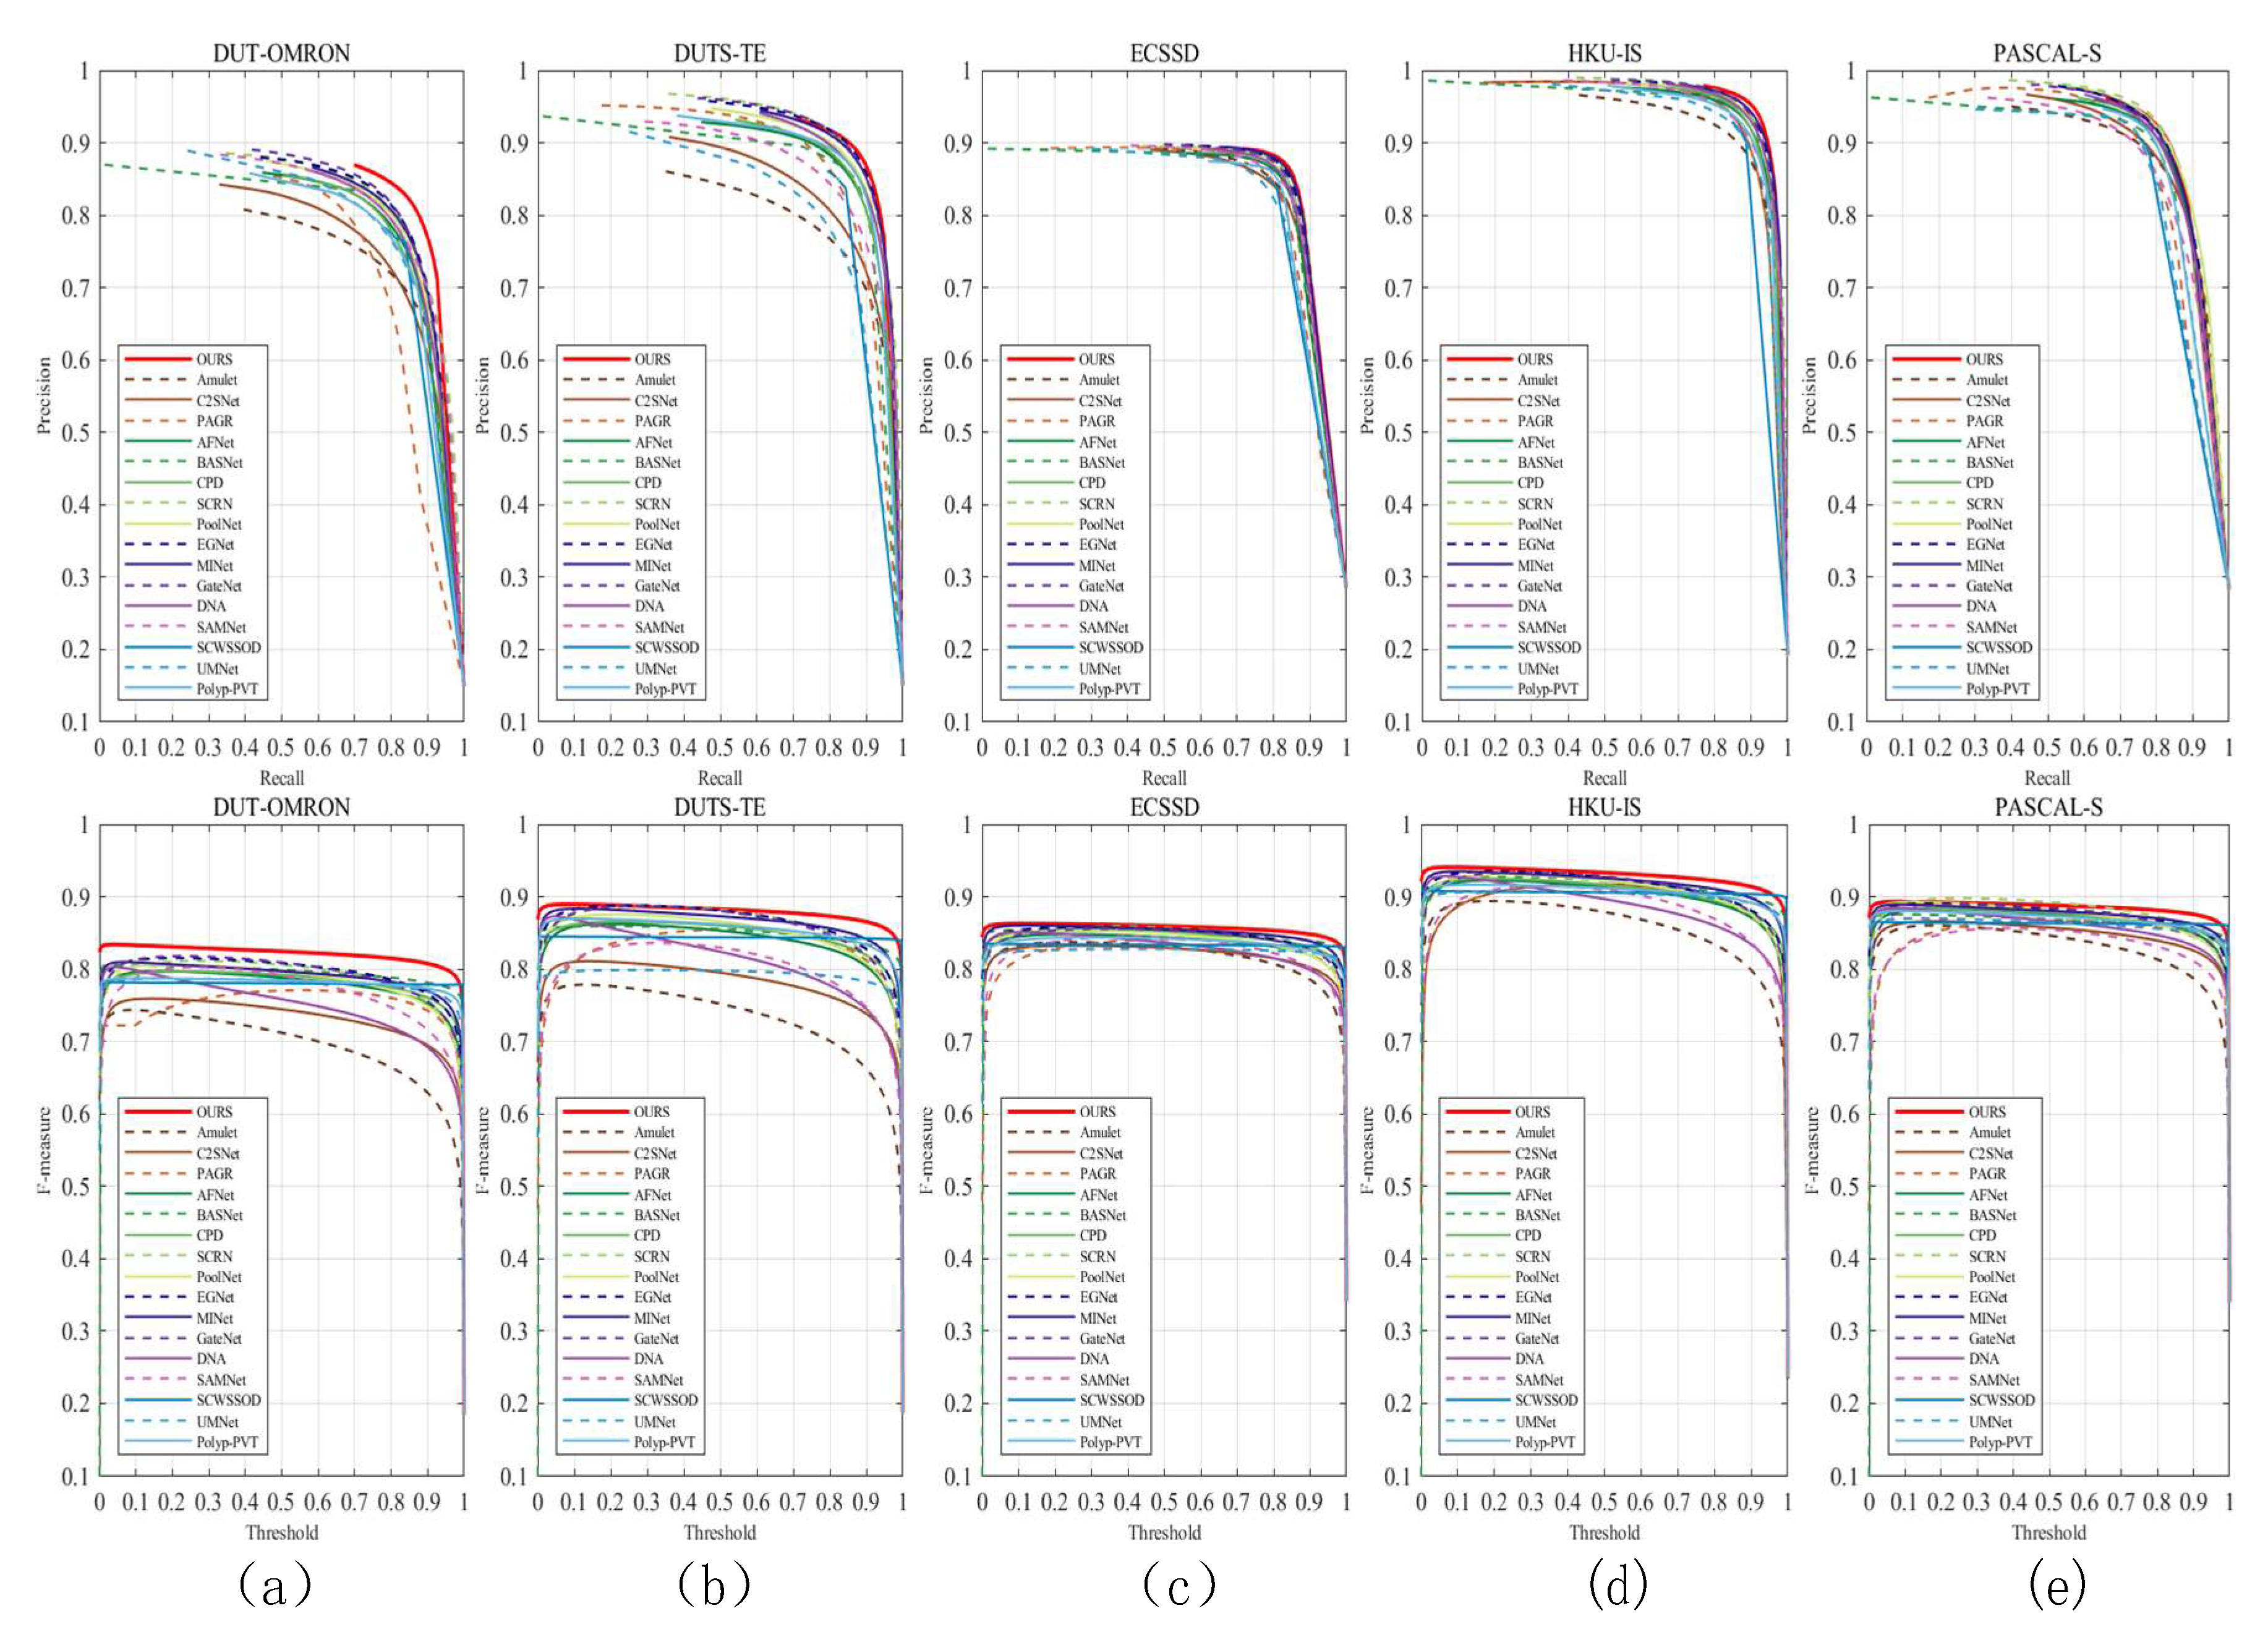
Table 1. In addition to evaluating the models from different perspectives, we show the precision–recall curves and F-measure curves in
Figure 4. These comparisons enable us to comprehensively assess the performance of the model and analyze its performance in all aspects in detail. The first row in
Figure 4 shows the PR curves for different datasets, while the second row shows the Fm curves for different datasets. The closer the position of the PR curve is to the upper right corner, the better the performance of the model. This means that the model is able to maintain high precision while also having high recall. The Fm curves being closer to the upper right corner indicates that the model is able to achieve highly accurate classification performance with high robustness under various thresholds. In
Figure 4a, we present the PR curve and Fm curve for the DUT-OMRON dataset. The DUT-OMRON dataset is a large-scale dataset containing 5168 images. The image backgrounds in this dataset are more complex and thus have higher requirements for the accuracy of the detection models. The PR curves and Fm curves (red solid lines) of our method on this dataset are significantly ahead of the second-ranked EGNet [
33] method, showing excellent accuracy. The PR and Fm curves for the DUTS-TE and ECSSD datasets are shown in
Figure 4b,c, respectively. The DUTS-TE dataset covers both indoor and outdoor scenes, different lighting conditions, and diverse object types. The ECSSD dataset includes both natural objects (e.g., people, animals, plants, etc.) and artificial objects (e.g., buildings, signs, transportation, etc.). These two datasets cover a variety of real-life scenarios. The PR curves and Fm curves (red solid lines) of our method in these two datasets are still higher than other methods. This fully demonstrates the strong generalization ability of our proposed PASNet model. In
Figure 4d, we show the PR curves and Fm curves of the HKU-IS dataset. The HKU-IS dataset contains 4447 images with multiple disconnected objects. Some of the images in this dataset have overlapping boundaries and the salient objects are similar to the background. It is challenging to perform saliency detection on the HKU-IS dataset. Through
Figure 4d, it is obvious that our method outperforms other models in terms of both PR curves and Fm curves. This fully demonstrates the excellent performance of our method in processing complex images. The PR curves and Fm curves of the PASCAL-S dataset are exhibited in
Figure 4e. The images in the PASCAL-S dataset are labeled mainly based on human eye movements, with no obvious salient objects. This makes the prediction of this dataset more difficult. Although the PR curves of our method are not optimal on this dataset, it still maintains a high performance. It is worth mentioning that the Fm curves of our method on this dataset are still ahead of other methods, which further demonstrates the competitiveness of our method. The experimental results in
Figure 4 adequately demonstrate the robustness and generalizability of our model to achieve excellent performance across different datasets and scenarios. Overall, our PASNet method performs well on multiple datasets, proving its effectiveness and superior performance in the field of salient object detection. These results provide strong support for the broad potential and feasibility of our method in practical applications.
To present a clearer picture of the comparative performance of different methods, we provide quantitative measurements of the various methods in
Table 1. These measurements provide us with a comprehensive perspective that helps us to evaluate and compare the effectiveness of various methods in the task of saliency detection. From
Table 1, we can draw conclusions that are consistent with the PR curves and the Fm curves. Unlike other methods that fuse multi-scale features or utilize post-processing, EGNet [
33] focuses on the complementarity between significant edge information and significant object information, which makes its measurements on the three datasets of DUT-OMRON, DUTS-TE, and HKU-IS. It is significantly more able than other methods to reach a higher level. Our proposed PASNet model achieves a 4.7-times-faster inference speed than the EGNet model (42.22 vs. 8.92), while the FLOPs of the PASNet model are 30 times higher than the EGNet model (9.72 vs. 291.83). In addition, our proposed method, the PASNet, obtains the best performance under all quantitative metrics on the four datasets, DUT-OMRON, ECSSD, HKU-IS, and DUTS-TE. The PASNet has a large performance gain compared to other methods. In addition, our proposed PASNet method achieves the best performance under all quantitative metrics on four datasets, DUT-OMRON, ECSSD, HKU-IS, and DUTS-TE datasets. It has a large performance gain compared with other methods. Specifically, the best performance was obtained for the challenging DUT-OMRON (0.8338 vs. 0.8181, 0.8553 vs. 0.8412, 0.8971 vs. 0.8737, and 0.0492 vs. 0.0520) and HKU-IS (0.9408 vs. 0.9352, 0.9234 vs. 0.9179, 0.9632 vs. 0.9564, and 0.0259 vs. 0.0309) datasets. The PASNet is clearly ahead of the second-ranked method in terms of the MaxF-measure, E-measure, S-measure, and MAE. This remarkable result is not only an affirmation of our method’s performance but also a clear demonstration of its strong adaptability in dealing with a wide range of complex visual scenes and tasks. In the cross-domain, multi-scenario DUTS-TE (0.8893 vs. 0.8882, 0.9257 vs. 0.9077, 0.8877 vs. 0.8865, 0.0364 vs. 0.0375) and ECSSD (0.8630 vs. 0.8591, 0.8690 vs. 0.8616, 0.8417 vs. 0.8364, and 0.1164 vs. 0.1219) datasets, our method outperforms the second-ranked method, which further demonstrates the generalization ability of the PASNet in different scenarios. To summarize, the excellence and effectiveness of this methodology are clearly observed through the experimental results, which further consolidate its potential and importance in applications.
- (2)
Qualitative Evaluation
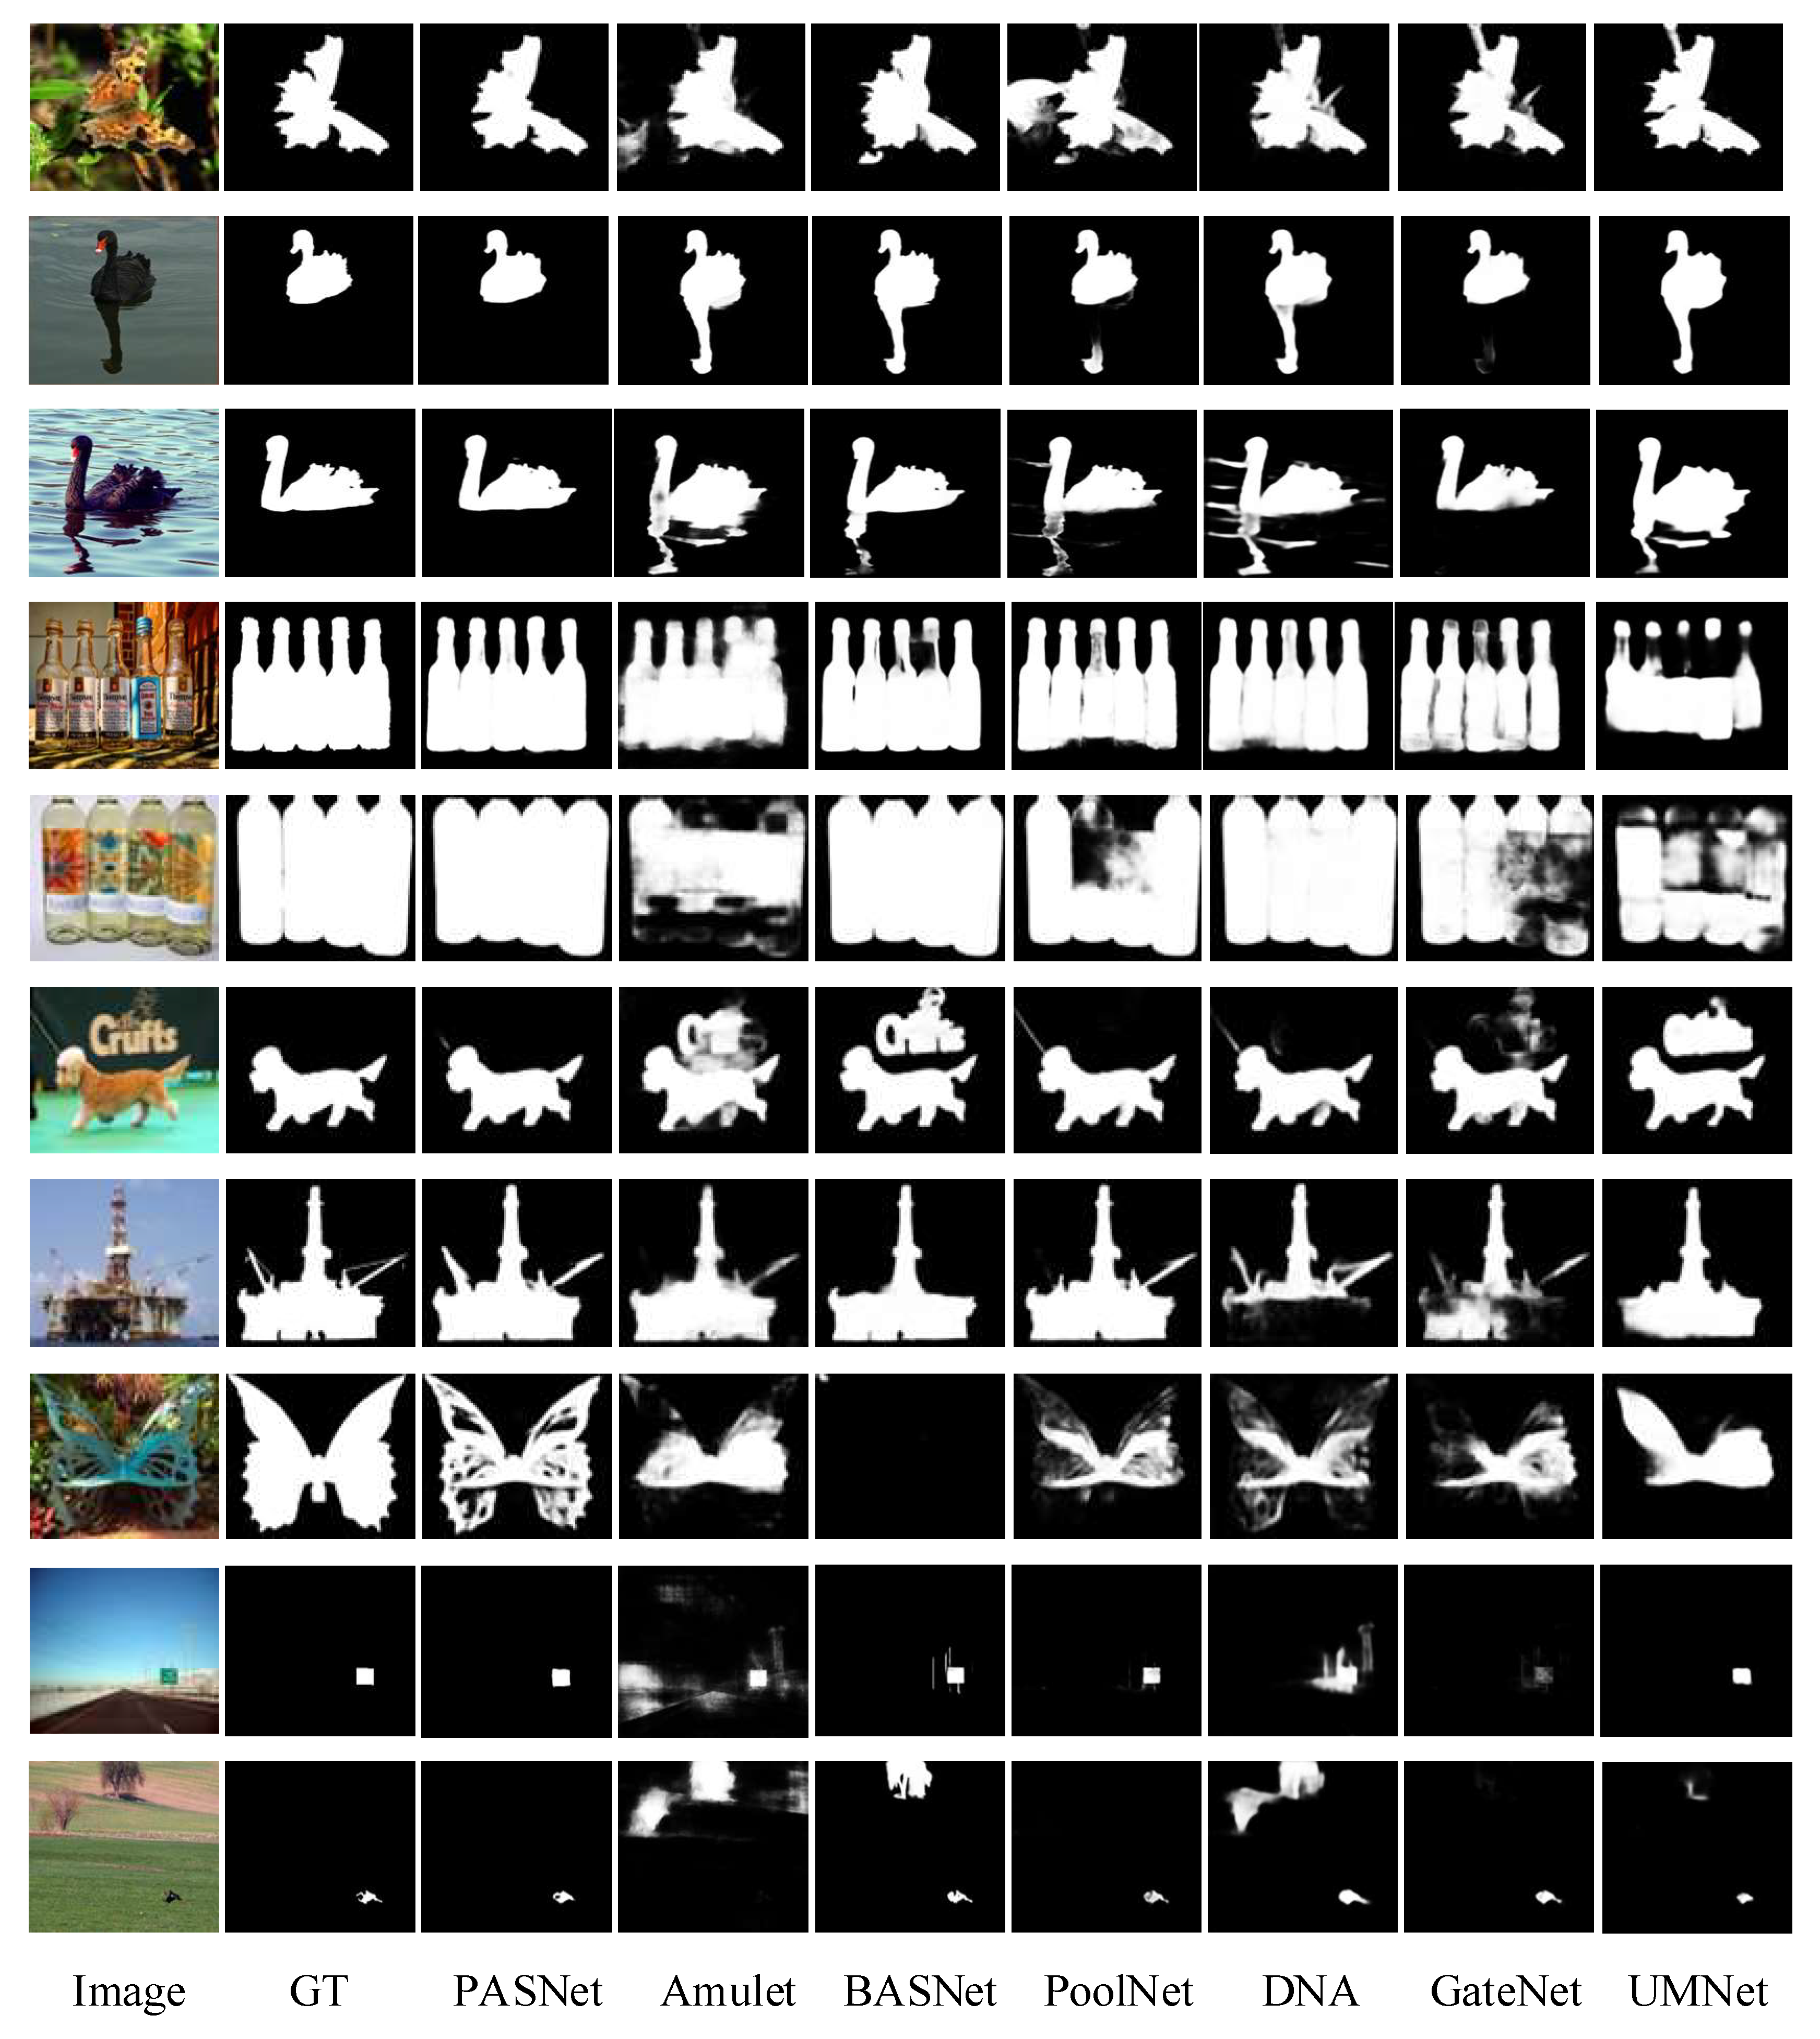
To demonstrate the merits of our proposed method in a more comprehensive and detailed manner, we conduct a series of visual comparison experiments to meticulously contrast it with six representative state-of-the-art methods in challenging natural scenarios. Such comparisons not only help to highlight the excellence of our method but also help us to gain a deeper understanding of its potential and superiority in practical applications. As shown in
Figure 5, some representative images and various detection aspects are included, including complex scenes, low-contrast scenes, multiple objects, complex backgrounds, and small objects. The method proposed in this paper is advantageous and competitive in the following aspects.
- (a)
Localization accuracy advantage. The method can accurately locate prominent objects and has a good ability to suppress background interference. In the first row of
Figure 5, the image background is more cluttered. In the sixth row of
Figure 5, the color of the salient object puppy is very similar to the color of the letter sign in the background. Some advanced SOD methods (e.g., Amulet [
31] and UMNet [
70]) are difficult to use to detect effective salient regions. The saliency detection algorithms that focus on edges, including BASNet [
32], cannot accurately detect salient objects. In contrast, our method can detect salient objects accurately and comprehensively.
- (b)
Advantages in the interference resistance. In the second and third rows of the images in
Figure 5, the complexity and clutter of the background reach extremely high water. This leads to the fact that some saliency detection methods will inevitably detect some background information along with the salient objects (e.g., Amulet [
31], BASNet [
32], PoolNet [
30], DNA [
67], GateNet [
15], UMNet [
70]). Our method can accurately detect salient objects without background interference.
- (c)
Advantages in content integrity. In the seventh row of
Figure 5, the building has many fine structural details and relatively cluttered building branches. In the eighth row of
Figure 5, the foreground is indistinguishable from the background and the foreground is extremely complex. Due to the increased difficulty of detection, these methods can roughly locate all significant objects, but cannot guarantee the structural integrity of the detected objects. For example, the results of the PoolNet [
30] and DNA [
67] methods in detecting the eighth row of
Figure 5 show that the edges of the butterfly’s wings are missing. In contrast, our method achieves better performance in terms of both structural integrity and detail integrity.
- (d)
Advantages of challenging solutions. Small objects in large scenes usually have lower resolution and smaller visual features, which increases the difficulty of saliency detection. Multi-object scenes, on the other hand, involve multiple salient objects and their mutual interference and overlap. In these cases, our algorithm is able to accurately recognize and segment small objects and effectively handle the complex relationships among multiple objects. This means that our method still performs well in the face of challenging visual environments and tasks, and has the ability to cope with both small-object scenes and multi-objective scenes. For example, in the last two rows of
Figure 5, our method accurately detects salient objects and obtains accurate segmentation results. Other methods also fail to clearly and completely detect small objects in large scenes and even incorrectly retain background regions (e.g., BASNet [
32] and DNA [
67]). Similarly, in the fourth and fifth rows of images, our method accurately detects multiple salient objects, while other methods barely detect all salient objects completely. The experimental results clearly show that our PASNet method has higher accuracy in salient object detection. Compared with other state-of-the-art methods, the PASNet is able to distinguish the detailed features of salient objects in different scenes more clearly, further improving the quality and accuracy of saliency detection. At the same time, these results demonstrate the superiority of our method in providing a more accurate solution for a variety of vision applications, thus bringing significant improvements and innovations to both research and practical applications.
4.4. Ablation Experiment
(1) Quantitative Evaluation: There are three key modules in our PASNet, including the advanced semantic fusion module (ASFM), the self-refinement module (SRM), and the dense lightweight refined block decoder (DLRB). To validate the effectiveness of the PASNet methodology, we perform a large number of ablation experiments. The main purpose of these experiments is to evaluate the necessity of each module and its contribution to the overall performance. The results of these experiments are essential to ensure the reliability and practicality of our method. We use the network consisting of the PVTv2 encoder and the non-densely connected decoder as a baseline and use the same experimental parameter settings throughout the experiments. As shown in
Table 2, we quantitatively analyze the contribution of each module to the whole network. Ablation experiments are performed on four classical datasets, with red data indicating optimality. It is worth noting that while our baseline model performs the worst in all three metrics, it still performs excellently compared to many of the methods in
Table 1. To fully integrate the multi-scale information provided by the decoder to enrich and expand the saliency mapping, we introduce the DLRB. This improvement significantly improves the network performance. Taking the HKU-IS dataset as an example, the images in this dataset contain multiple objects, and the boundaries of these objects overlap. After replacing the decoder in the baseline with the DLRB, the MaxF-measure metric improves from 0.9362 to 0.9394, and the S-measure metric increases from 0.9195 to 0.9210, while the MAE metric decreases from 0.0283 to 0.0269. To encode detailed information in feature learning, we design SRMs for the network and bring performance improvements. For example, in the cross-domain, multi-scene ECSSD dataset, the MaxF-measure improves from 0.8586 to 0.8627, the S-measure index rises from 0.8359 to 0.8404, and the MAE metric decreases from 0.1197 to 0.1190. In addition, to accurately localize the location of significant objects and solve the problem of object scale variation in different scenes, we design the ASFM. This module enables the network to obtain more comprehensive semantic information. With the addition of the ASFM to the network, we have a complete PASNet structure. Compared to the other variants, the complete PASNet structure achieves optimal values for all metrics on the four datasets. For example, on the SOD dataset relative to the baseline model, the percentage gain of the MaxF-measure metric reaches 1.33%, the percentage gain of the MAE reaches 0.82%, and the percentage gain of the S-measure metric reaches 1.79%. This shows that our proposed framework benefits from all key components. In summary, it is evident that all the indexes are significantly improved when the PVT encoder, SRM, ASFM, and DLRB are present at the same time, resulting in the best performance and the strongest generalization ability.
To verify the generality of each module in the PASNet approach and the superior performance of the PVTv2 backbone, we replace the PASNet backbone with VGG16 and ResNet50. The degree of generalization and contribution is verified by introducing different modules one by one. As shown in
Table 3, we use the network consisting of the ResNet50 [
28] backbone and the non-densely connected decoders as the baseline. The DLRB, SRM, and ASFM are added to the baseline network step by step. We perform ablation experiments on four classical datasets, where the red data indicate the optimum. As shown in
Table 4, we quantitatively analyze the contribution of each module in the whole network using the network consisting of the VGG16 [
27] backbone and the non-densely connected decoders as the baseline. The same four classical datasets are still used for the ablation experiments, as in the previous experiments, where the red data indicate the optimum. It is evident from
Table 2,
Table 3 and
Table 4 that the performance of the network model continues to improve with the continuous introduction of individual modules. In addition, the optimal values of three different backbone networks are compared in
Table 5, where the data in red indicate the optimal. The PVTv2 [
41] backbone network outperforms the other backbone networks in all metrics in the four datasets. For example, the optimal value of the PVTv2 network architecture in the MaxF-measure metric for the HKU-IS dataset is 0.9408. It is 2.69% higher than the optimal value of the ResNet50 network architecture and 3.75% higher than the optimal value of the VGG16 network architecture. The optimal value of the PVTv2 network architecture in the MAE metric for the DUTS-TE dataset is 0.0364. It is 1.6% higher than the optimal value of the ResNet50 network architecture and 2.54% higher than the optimal value of the VGG16 network architecture. The above ablation experiments demonstrate the superior performance of the PASNet architecture and the effectiveness and generalization of the modules.
(2) Qualitative Evaluation: In order to give the reader a more intuitive feeling of the contribution of different modules, a qualitative analysis of the network is shown in
Figure 6. The detection effect is poor when the network is only a baseline network with a combination of the PVTv2 encoder and non-densely connected decoders. For example, in the first row of
Figure 6, the background color is similar to the foreground of a single large object, and in the second row of images with multiple objects, the detection of the baseline is not good. The background in the third row of images in
Figure 6 is extremely similar to the salient objects, which disrupts object detection. At this point, the baseline network fails to correctly distinguish between the foreground and the background. In the fourth row of images, where the background is more complex, the baseline network only partially detects the salient objects. After we replace the non-densely connected decoder with the DLRB, we can see from the first and second rows of
Figure 6 that the network’s detection of single large objects and multiple objects is significantly improved. However, at this stage, the network is still not sufficient to mine detailed information and semantic information. With the addition of the SRM module, as seen in the fourth and fifth rows of
Figure 6, the network’s effectiveness in detecting objects with more complex backgrounds and containing more details is significantly improved. It can better suppress the background information of small objects, such as the eagle in the sixth row of
Figure 6. Nevertheless, it still struggles to correctly distinguish the foreground from the background when detecting images with strong background interference factors (such as the goose in the third row of
Figure 6). Finally, the semantic information in the high-level encoder is fully fused by further introducing the ASFM to further suppress the background (such as the goose in the third row of
Figure 6) and extract a more complete object structure (such as the butterfly in the fourth row of
Figure 6). In addition, the network is suitable for single-object (such as the wine glass in the first row of
Figure 6) and multi-object detection (such as the bottle in the second row of
Figure 6). In summary, as each module gradually joins the network, we can more intuitively feel the contribution of each module. The synergistic cooperation between modules makes the detection effect of the whole network model significantly improved.
4.5. Failure Cases and Areas of Application
- (1)
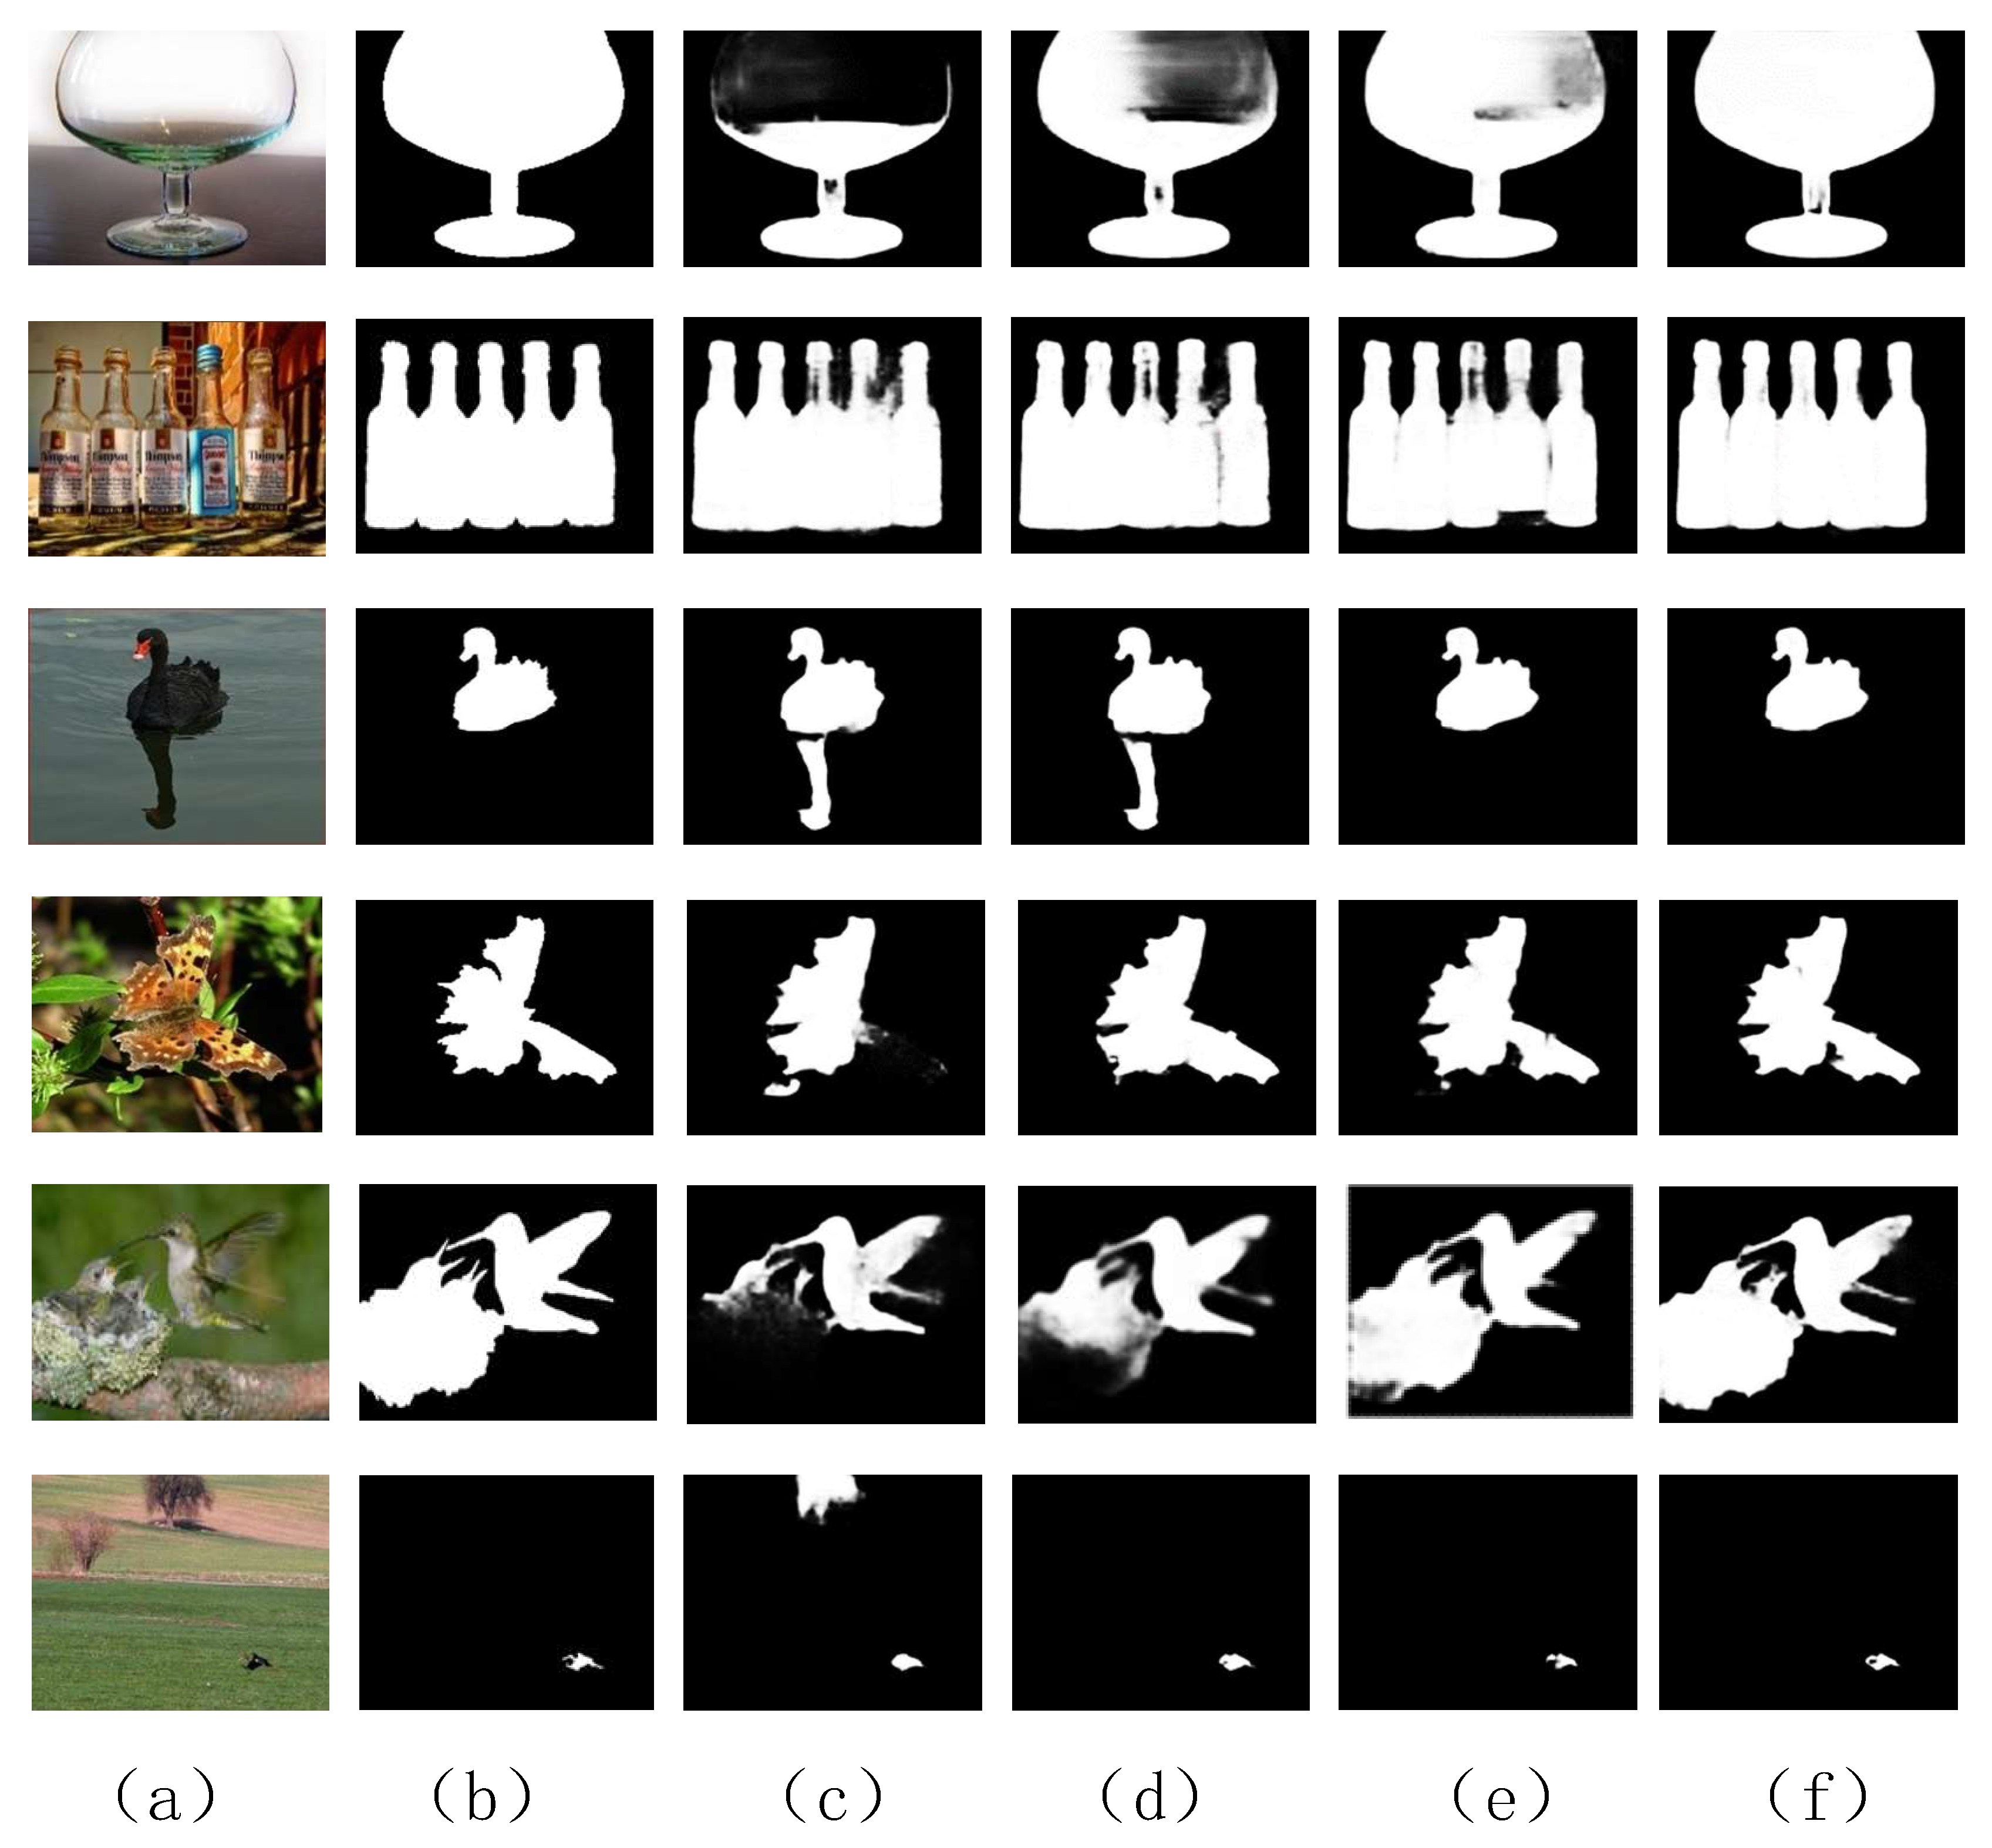
Failure Cases: We discuss some failure cases of the PASNet in
Figure 7. For some very challenging examples, our approach still does not yield perfect results.
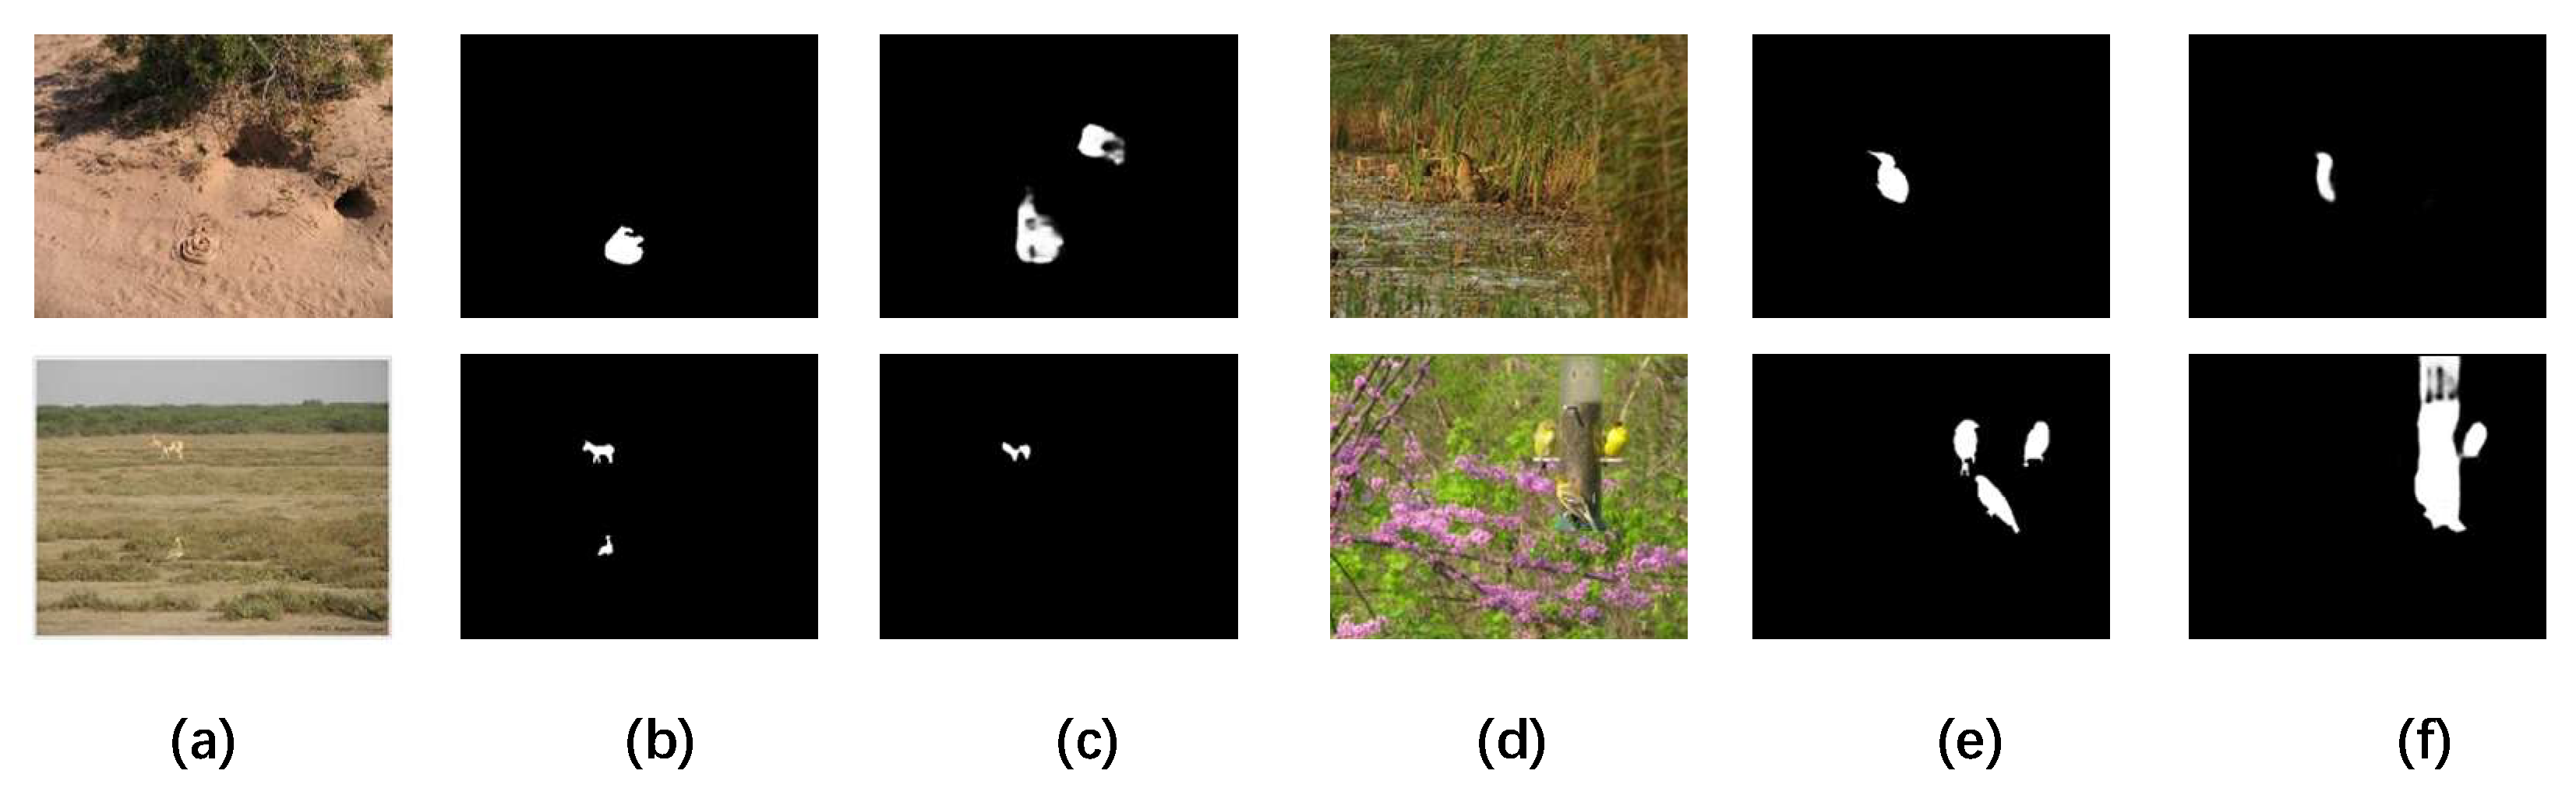
(1) It is still a challenge to effectively distinguish from the surrounding environment for salient objects that are extremely similar to the background, for example, in the first row of
Figure 7, the yellow cobra in the desert and the small bird in the reeds. The salient objects are largely distracted by the texture and color information of the background, causing the detector to fail to detect the salient objects completely and accurately. To solve this problem, we need to try to develop better learning strategies to understand the abstract semantic information in the saliency detection task. A robust learning strategy can make the network more resistant to interference.
(2) Handling multiple small objects in a large cluttered context is still a challenge for our approach. For example, the mallard below the left image cannot be detected in the second row of
Figure 7. In addition, the wildebeest above the image is not detected in its entirety. The three small birds on the tree trunk in the right image can only be detected as one of them accompanied by a lot of background information. The main reason for this is that we are limited by the GPU performance and only use a relatively small input size. As a result, most of the features of multiple small salient objects are lost during down-sampling, hindering the effectiveness of the detection. We can solve this problem by using larger images as inputs and utilizing more computational resources for training. However, it is more desirable to explore more efficient global context-aware attention operations and construct more robust global dependencies.
Figure 7.
Some examples of failures. (a) Natural image. (b) Ground truth. (c) Significance plot of PASNet detection. (d) Natural image. (e) Ground truth. (f) Significance plot of PASNet detection.
Figure 7.
Some examples of failures. (a) Natural image. (b) Ground truth. (c) Significance plot of PASNet detection. (d) Natural image. (e) Ground truth. (f) Significance plot of PASNet detection.
- (2)
Areas of Application: The improvement of the PASNet model has important applications and real-world scenario value in the field of saliency object detection, which is shown in the following aspects:
(1) Computer vision tasks: saliency object detection is a fundamental task in the field of computer vision and is of key significance for other vision tasks. For example, in tasks such as object tracking, object segmentation, automatic driving, and robot navigation, saliency object detection can be used to determine the object of attention, thus improving the accuracy and robustness of the task.
(2) Advertising and recommender systems: In advertising and content recommendation, saliency object detection can be used to identify elements that may be of interest to users, such as products, advertisements, or recommended content. This can help to improve the click-through rate of advertisements and the attractiveness of content recommendations.
(3) Medical image processing: In medical image analysis, saliency object detection helps doctors to identify and localize disease foci, abnormalities, or important structures. This is useful for medical diagnosis, treatment planning, and surgical navigation.
(4) Military and security applications: In the military field, salient object detection can be used to identify hostile objects or potential threats. In security applications, it can help surveillance systems to better detect abnormal behavior or significant objects.
(5) Intelligent transportation systems: In automated driving and intelligent traffic management, salient object detection can be used to detect important objects on the road, such as other vehicles, pedestrians, and traffic signs. This is essential for improving traffic safety and the performance of autonomous driving systems.
(6) Remote sensing image processing: In remote sensing images, saliency object detection can be used to identify important locations or objects in a specific geographic area, such as urban planning, resource management, and environmental monitoring.
In summary, the improvement of the PASNet model has a wide range of applications and practical value in saliency object detection, covering multiple domains and real-world scenarios. The improved model can increase the accuracy, efficiency, and applicability of saliency object detection. This helps in exploring its application for technology development in various fields.


