Article

Chasing a Better Decision Margin for Discriminative Histopathological Breast Cancer Image Classification

by
Pendar Alirezazadeh
1,
Fadi Dornaika
1,2,* and
Abdelmalik Moujahid
3
1
Department of Informatics, University of the Basque Country, 20008 Donostia-San Sebastian, Spain
2
Ikerbasque, Basque Foundation for Science, Plaza Euskadi, 5, 48009 Bilbao, Spain
3
High School of Engineering and Technology, Universidad Internacional de la Rioja, Avenida de la Paz 137, 26006 Logroño, Spain
*
Author to whom correspondence should be addressed.
Electronics 2023, 12(20), 4356; https://doi.org/10.3390/electronics12204356
Submission received: 6 September 2023 / Revised: 16 October 2023 / Accepted: 18 October 2023 / Published: 20 October 2023
(This article belongs to the Special Issue Medical Applications of Artificial Intelligence)

Abstract

:
When considering a large dataset of histopathologic breast images captured at various magnification levels, the process of distinguishing between benign and malignant cancer from these images can be time-intensive. The automation of histopathological breast cancer image classification holds significant promise for expediting pathology diagnoses and reducing the analysis time. Convolutional neural networks (CNNs) have recently gained traction for their ability to more accurately classify histopathological breast cancer images. CNNs excel at extracting distinctive features that emphasize semantic information. However, traditional CNNs employing the softmax loss function often struggle to achieve the necessary discriminatory power for this task. To address this challenge, a set of angular margin-based softmax loss functions have emerged, including angular softmax (A-Softmax), large margin cosine loss (CosFace), and additive angular margin (ArcFace), each sharing a common objective: maximizing inter-class variation while minimizing intra-class variation. This study delves into these three loss functions and their potential to extract distinguishing features while expanding the decision boundary between classes. Rigorous experimentation on a well-established histopathological breast cancer image dataset, BreakHis, has been conducted. As per the results, it is evident that CosFace focuses on augmenting the differences between classes, while A-Softmax and ArcFace tend to emphasize augmenting within-class variations. These observations underscore the efficacy of margin penalties on angular softmax losses in enhancing feature discrimination within the embedding space. These loss functions consistently outperform softmax-based techniques, either by widening the gaps among classes or enhancing the compactness of individual classes.

1. Introduction

Breast cancer has remained one of the most commonly diagnosed cancers in the female population [1,2]. With the progress of digital imaging technologies, medical professionals can now store and harness biopsy histopathology images in digital formats, revolutionizing their role as diagnostic aids for breast cancer.
Analyzing histopathological images for breast cancer diagnosis is a demanding task, often involving pathologists who review images at various magnification levels. This process is not only labor-intensive but also time-consuming, as noted in previous studies [3]. Furthermore, the expertise of the pathologist can influence the diagnosis. Therefore, computer-aided systems for histopathological image analysis are essential in breast cancer diagnosis. However, developing such systems presents unique challenges. Histopathological breast cancer images are known for their intricate details, high-resolution quality, and complex tissue compositions. These images exhibit fine-grained structures and variations within and between classes, making classification a complex task, especially in multi-class scenarios [4]. On the other hand, conventional machine learning-based feature extraction methods for breast cancer histopathology images have their own limitations.
Deep learning, especially convolutional neural networks (CNNs), has the ability to autonomously extract features and categorize histopathological breast cancer images, thus surpassing the constraints of conventional feature extraction techniques. CNNs offer promising prospects for the enhancement of histopathological image classification systems in breast cancer diagnosis. This advancement promises to significantly reduce the diagnostic time while delivering impressive outcomes more swiftly [5,6,7,8,9,10].
Despite their potential, CNNs necessitate a substantial volume of training data to mitigate overfitting and augment their ability to generalize. On the other hand, the widely used softmax loss function in CNNs often falls short in its capacity to effectively maximize inter-class differences and minimize intra-class variations, especially when confronted with restricted data resources [11]. Hence, the pursuit of improved discrimination between diverse classes within the confines of limited data remains a prominent research area in the field of histopathological breast cancer image analysis.
In recent times, there has been a surge in interest surrounding angular margin-based softmax loss functions, including A-Softmax [12], CosFace/AM-Softmax [13,14], and ArcFace [15]. These loss functions are designed to establish a margin between distinct classes, fostering the extraction of exceptionally distinguishing embedding features. The A-Softmax loss function undertakes the normalization of weights using the L 2 norm, which situates the normalized vector on a hypersphere. As a result, it facilitates the acquisition of discriminative features on a hyperspherical manifold while introducing an angular margin. Nevertheless, optimizing A-Softmax can prove challenging due to its multiplicative integration of the angular margin. To address these optimization complexities, both CosFace and ArcFace have been introduced. CosFace introduces a cosine margin to the target logit, thereby striving to augment inter-class diversity. In contrast, ArcFace imposes an additive angular margin penalty on the target logit, consequently heightening intra-class compactness.
This study delves into the evaluation of angular margin-based softmax loss functions for their potential to boost the performance of deep learning models in the realm of binary and multi-class classification concerning histopathological breast cancer images. Notably, this represents a novel approach within the existing body of literature for classifying histopathological breast cancer images. We consider three foundational loss functions (A-Softmax (SphereFace), CosFace (AM-Softmax), and ArcFace) due to their inherent capability to amplify between-class variability and enhance within-class cohesion. Our exhaustive experiments, conducted on the histopathology image-based dataset of breast cancer (BreakHis), reveal that angular margin-based softmax loss functions outperform existing state-of-the-art methodologies. These enhancements are particularly pronounced when compared to the conventional softmax loss function.
The structure of the remainder of this paper is as follows: Section 2 discusses previous works, Section 3 introduces the materials and methods, Section 4 outlines the experimental setup, Section 5 presents the results and discussion, and Section 6 concludes the paper.

2. Related Work

In recent years, deep learning-based methods have gained popularity in the domain of histological breast cancer image classification. However, as previously highlighted, the availability of annotated histopathological breast cancer images remains a challenge. This limitation hinders the effective training of convolutional neural networks (CNNs) for classification tasks. In an effort to tackle this challenge, Wang and colleagues introduced the FE-BkCapsNet network in their research [16]. This network is specifically designed to be trainable, even with a limited amount of training data, and is inspired by the Capsule Network (CapsNet) architecture. The FE-BkCapsNet places particular emphasis on both semantic and spatial information through the utilization of deep feature fusion techniques, which combine CNNs and CapsNet to enhance the classification performance. In high-dimensional feature spaces, such as those created by combining various extracted features, the issue of irrelevant and redundant features often arises. The presence of such features can significantly increase computational complexity and potentially lead to reduced classification accuracy due to feature redundancy.
In recent studies, the utilization of deep learning methods has garnered substantial attention in the field of histopathological breast cancer image categorization. Nevertheless, the scarcity of annotated histopathological images poses a notable hurdle, limiting the performance of convolutional neural networks (CNNs) in classification assignments. To confront this issue, Zhang and their team introduced an inventive approach that capitalizes on existing cancer-related knowledge [17]. They introduced a CNN model designed to focus on image-reconstructed B-channel characteristics. Given that color attributes linked to the nucleus region in the stained images of breast cancer are primarily located in the channel of B, they opted for reconstructed three-dimensional B-channel features over the complete histopathology image in their approach. It is worth mentioning that their method primarily emphasizes distinctions between different classes and does not explicitly tackle variations within the same class. In a similar context, Zou and colleagues presented the DsHoNet network [18] for the classification of pathological breast cancer images. For the purpose of improving the distinctiveness of feature representation, they embraced a dual-stream architecture that combines supplementary features. DsHoNet merged the initial features (data) with generated features by the Ghost attention module, thereby incorporating complementary sets of features. Nonetheless, this dual-stream method introduced a higher level of model complexity, raising the potential for overfitting during training. In the quest for enhanced classification performance, Majumdar and their team introduced an ensemble method [19], which consolidates decision scores from the different network architectures. Their approach assigned ranks to individual classifiers using the Gamma method to aggregate decision outputs. Nevertheless, the computational demands and parameterization of these models may render them less practical for some applications. In response to the challenge of a dataset with limited data (images), Toğaçar and collaborators presented BreastNet [20], which leverages the attention mechanism. They employed the refinement of features based on attention, incorporating two techniques, namely channel and spatial techniques (module), to enhance the output map of the feature of residual blocks. This improvement bolstered the performance while maintaining computational overhead at a manageable level. BreastNet exhibited commendable performance through a lightweight model; however, it relied on the softmax loss function, which may not fully optimize variance among different classes and variance within the same class in embedding feature vectors. In our investigation, we introduced a distinctive element centered on the loss function, setting our approach apart from previous methodologies. Given its modest computational demands and satisfactory performance relative to other CNNs, we opted for BreastNet as the foundation of our research. Our objective is to improve the separation between different classes and the diversity within the same class by investigating angular margin-based softmax loss functions in deep embedding breast cancer image analysis. This aims to address both the compactness within classes and the variation between classes.

3. Materials and Methods
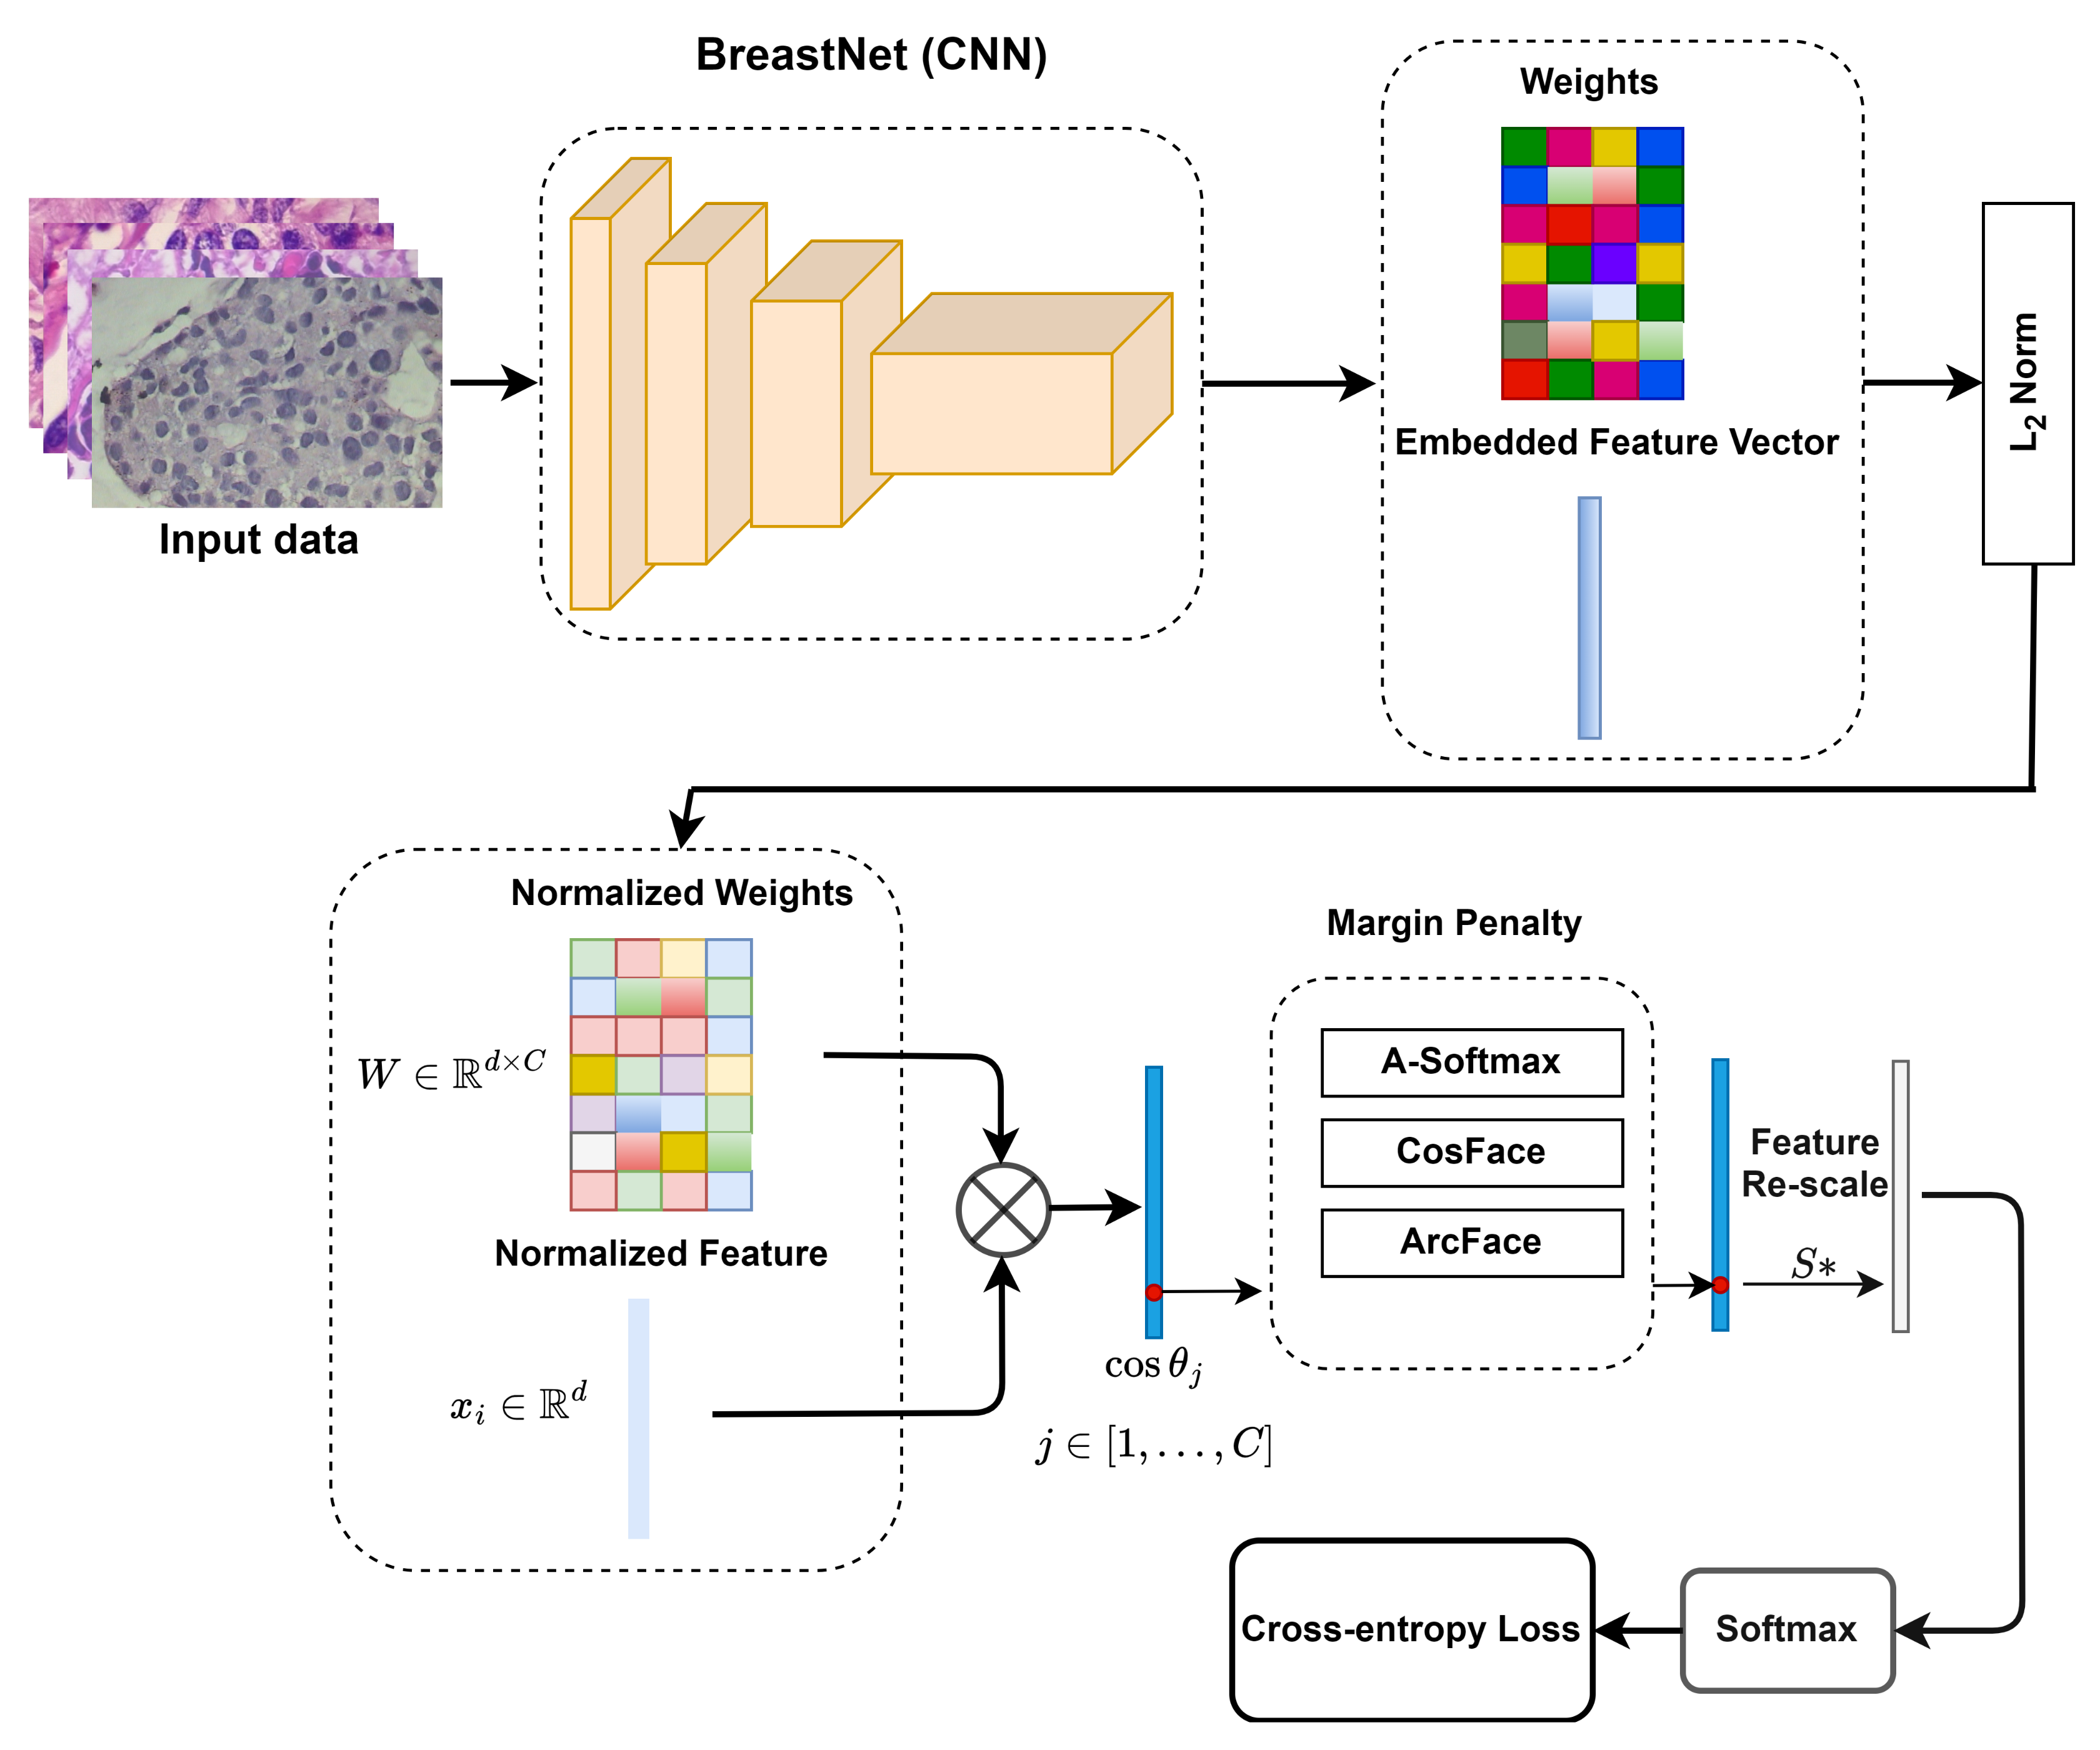
3.1. Notations

To establish consistency in our mathematical notation throughout this paper, we adopted a standardized format, which is summarized in Table 1. In this notation:
  • Matrices are represented using uppercase letters, whereas vectors are indicated by lowercase letters.
  • x i corresponds to the features extracted from the i-th sample.
  • The j-th column within the weight matrix W is indicated as w j R d × C , where d represents the sample dimension, and C denotes the total number of classes.
  • m serves as an additional angular margin, effectively employed to minimize fluctuations within class boundaries.
  • θ y i denotes the angle formed between the weight vector w y i and the feature vector x i , whereas θ j represents the angle between the feature vector x i and the weight vector w j , with the stipulation that j y i .
  • s is a scaling factor applied to all logits, effectively altering their magnitude.

3.2. BreakHis Dataset

The BreaKHis dataset stands as a challenging compilation of microscopic biopsy images, portraying a spectrum of both benign and malignant breast tumors. This dataset, as extensively described in previous publications [10,21,22], offers images stained with hematoxylin and eosin (H&E). These images have a dimension of 700 × 460 pixels and are presented in an RGB format, with each channel utilizing 8 bits. The dataset consists of 7909 images meticulously collected from 82 referred people (patients) and covers four magnification levels: low-magnification (40×), middle-magnification (100× and 200×), and high-magnification (400×). It is thoughtfully organized into 2480 benign images, which are evenly distributed across four classes: adenosis (444 images), fibroadenoma (1014 images), phyllodes tumor (453 images), and tubular adenoma (569 images). Additionally, the dataset encompasses 5429 malignant images, artfully organized into classes like ductal carcinoma (3451 images), lobular carcinoma (626 images), mucinous carcinoma (792 images), and papillary carcinoma (560 images).

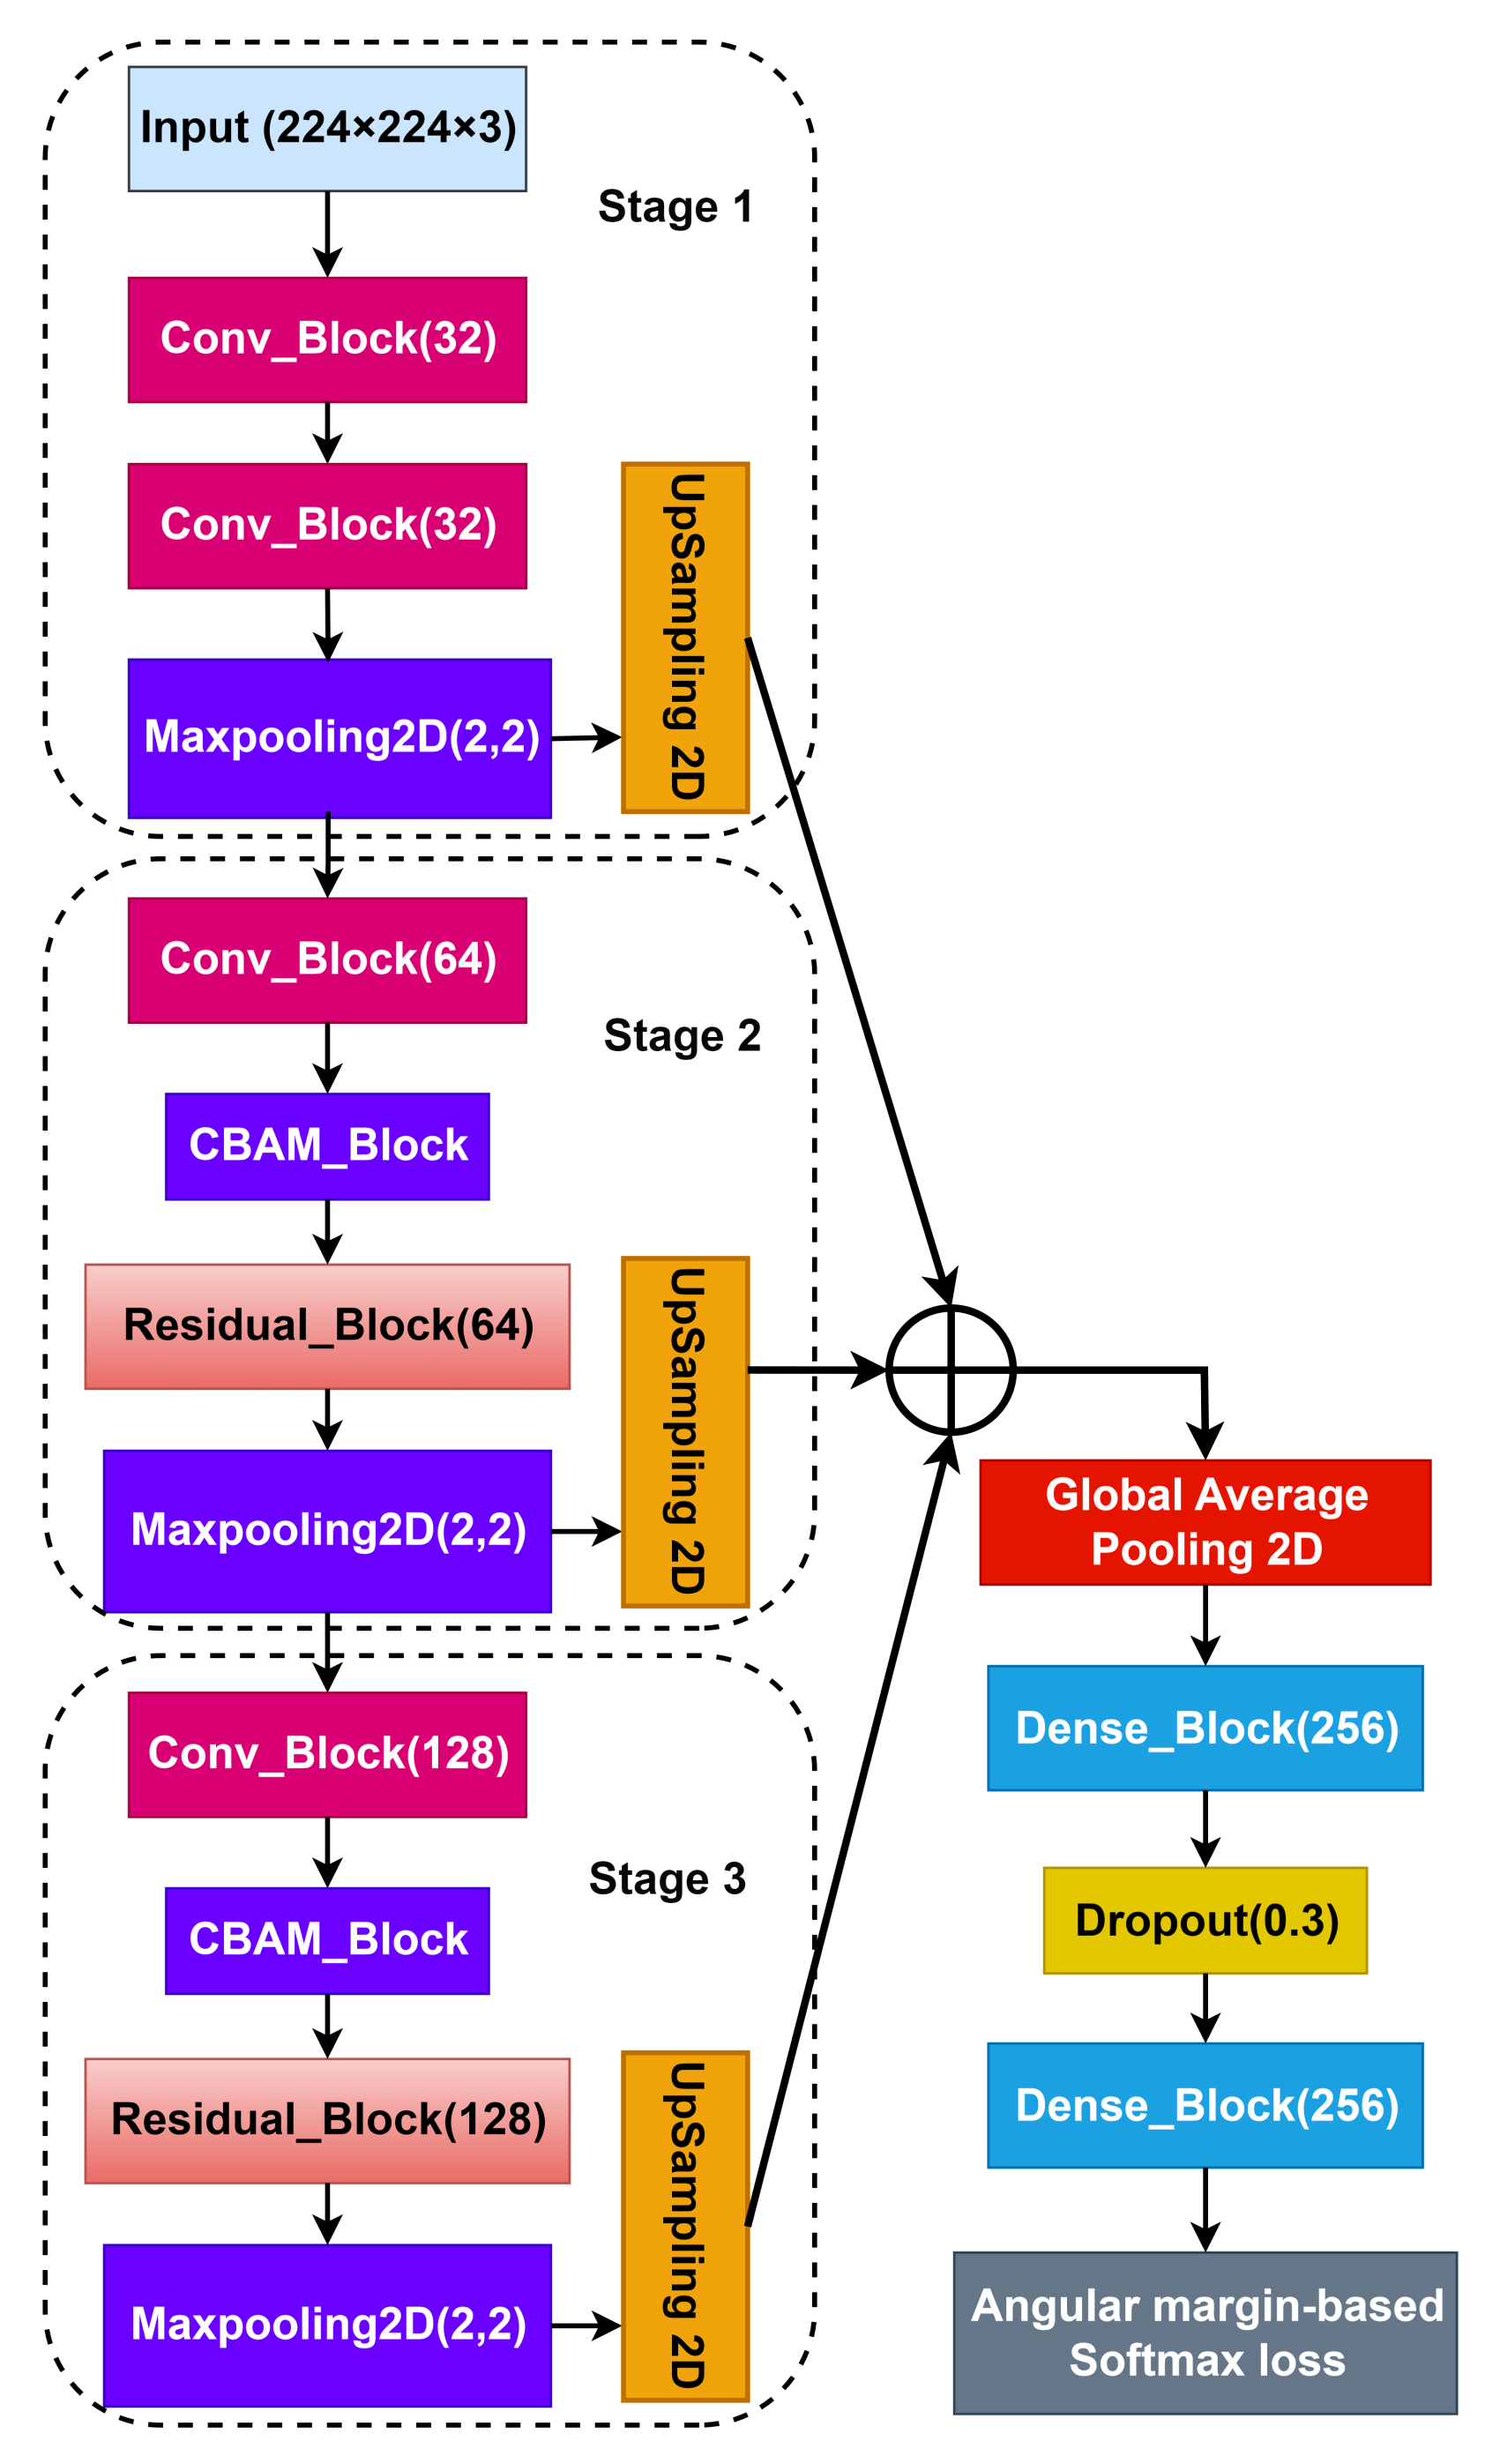
3.3. Pipeline of the Proposed System

The entire pipeline of the proposed breast cancer image classification system is shown in Figure 1. First, we used BreastNet as the CNN backbone and extracted embedded feature vectors from the last layer along with their corresponding weights. Then, we applied l 2 normalization to obtain the cosine similarity between the normalized features and weights using the dot product definition. Next, we calculated the angle between the normalized features and the ground truth center, which served as the target logit, and integrated the margin penalties of various angle-dependent metric learning methods (i.e., A-Softmax (SphereFace), AM-Softmax (CosFace), and ArcFace). The logits were then scaled using the feature scale s. Finally, the logits were processed with the softmax function, which contributed to the loss of cross entropy. Attempting to identify angular relationships between classes supports deep metric learning and reduces the need for extensive training data. This efficiency is particularly beneficial in scenarios such as breast cancer classification, where data limitations present challenges.

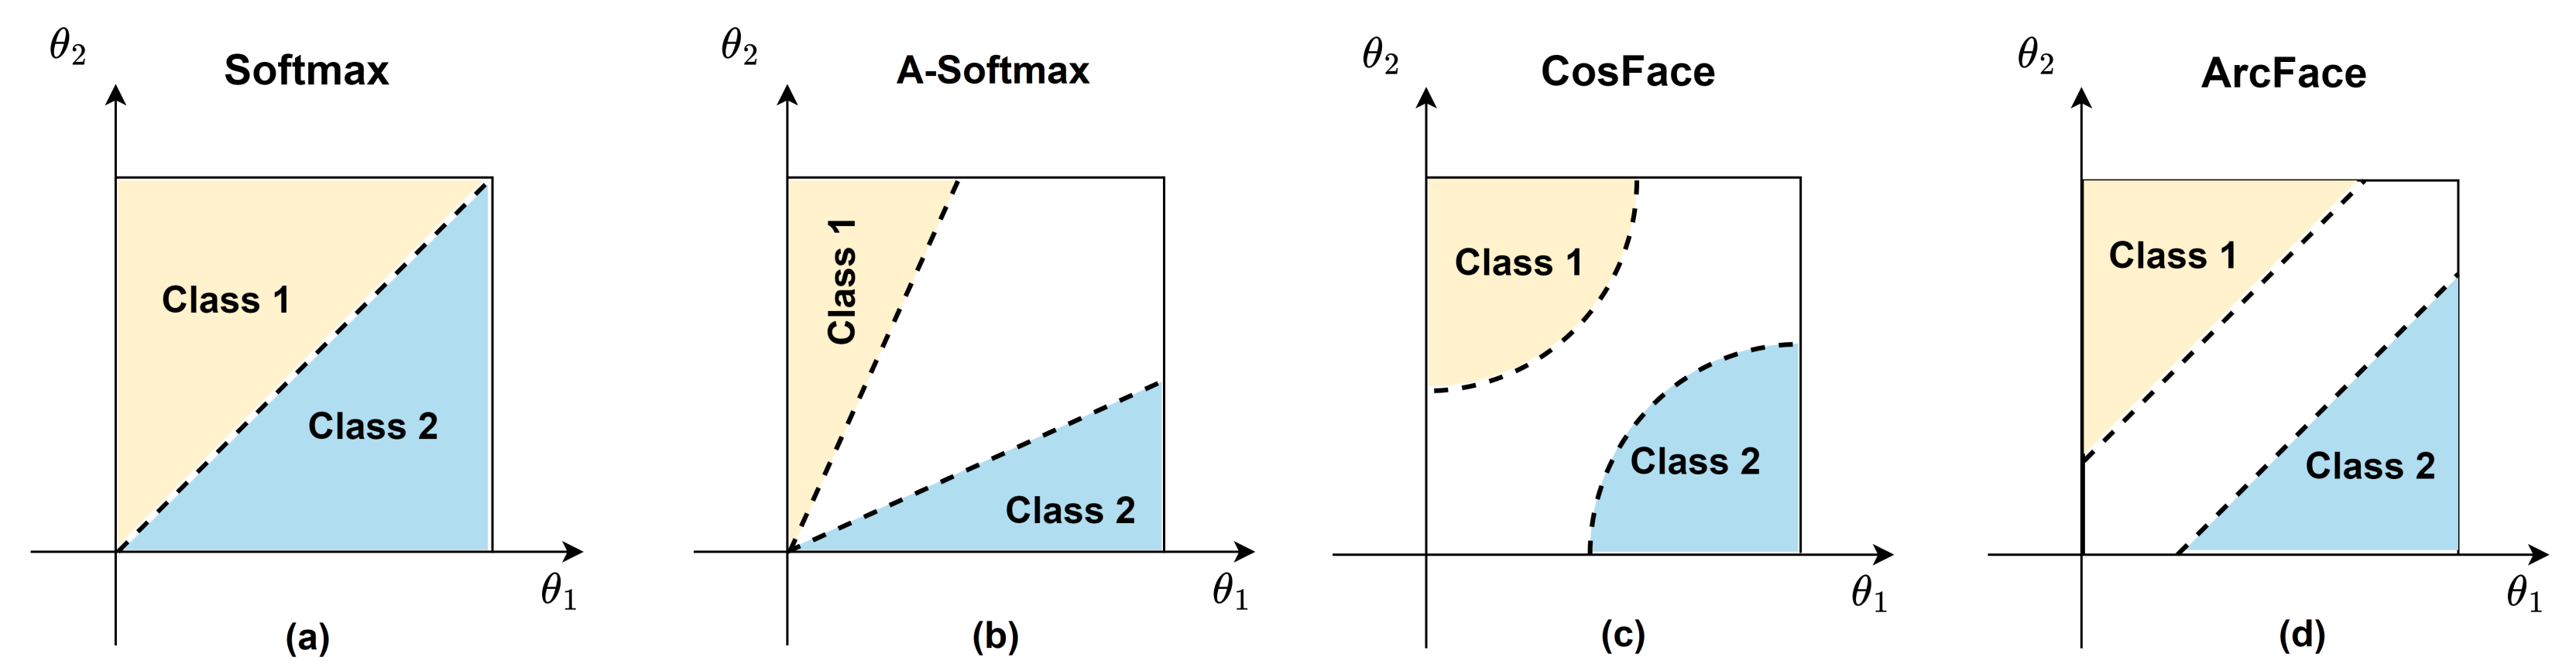
3.4. Margin Penalties on Angular Softmax Losses

The standard softmax loss consists of employing both a softmax activation function and cross-entropy loss. This softmax activation function operates at the output layer to generate class probabilities, ensuring their summation equals one. The mathematical expression for the cross-entropy loss is represented as:
L CE = 1 N i = 1 N j = 1 C t ij log p ij ,
where t ij = t i 1 , t i 2 , , t i C is derived from the ground-truth class y i , where it equals 1 if x i is a member of class j. Meanwhile, p ij is the class probability of the feature vector x i being associated with class j. The computation of probability p ij using the softmax function is outlined as follows:
p ij = exp w j T x i + b j j = 1 C exp w j T x i + b j ,
where x i R d represents the embedding features associated with the i-th class. w j corresponds to the j-th column of the W R d × C (weight matrix), while b j R C represents the bias term. By examining Equations (1) and (2), we can derive the softmax loss as follows:
L S = 1 N i = 1 N log exp w y i T x i + b y i j = 1 C exp w j T x i + b j
While the softmax loss is the prevalent choice for deep feature embedding, it is worth noting that Equation (3) illustrates its limitation. The softmax loss primarily emphasizes maximizing the distance between classes and does not explicitly address the reduction in within-class variance. Hence, there is significant potential for enhancing the performance of embedded feature extraction.
To tackle this challenge, margin penalties have been introduced to the angular softmax loss as a potential solution. Operating within the angular space, these loss functions impose constraints aimed at increasing inter-class distances while concurrently reducing intra-class variations. Equation (3) illustrates the transformation from the angle space to the cosine space, accomplished by establishing the inner product between the feature vectors x i and their associated weights w j as:
w j T x i = w j x i cos θ j , i ,
where θ j , i 0 θ j , i π represents the angle between w j and x i . Consequently, the softmax loss can be reformulated as:
L Softmax = 1 N i = 1 N log exp w y i x i cos θ y i , n + b y i j = 1 C exp w j x i cos θ j , i + b j
The A-Softmax loss, initially proposed by Liu et al. [12], incorporates certain modifications. These include nullifying the bias terms ( b j = 0 ), normalizing the weights in the forward propagation stage ( w j = 1 ), and introducing a margin parameter m to control the angle. These alterations are aimed at promoting learned features with reduced intra-class variability, as illustrated below:
L A Softmax = 1 N i = 1 N log exp x i ψ θ y i exp x i ψ θ y i + j = 1 , j y i C exp x i cos θ j ,
where ψ θ y i = ( 1 ) k cos m θ y i 2 k , θ y i k π m , ( k + 1 ) π m and k [ 0 , m 1 ] . This depends on an integer margin hyperparameter m 1 , which confines it to positive integers, rather than real numbers. This limitation results in a less flexible margin.
CosFace loss, also known as AM-Softmax [13,14], took a different approach by normalizing x i = 1 . They substituted ψ θ y i with cos θ y i m to introduce the additive margin softmax loss, defined as:
L CosFace = 1 N i = 1 N log exp s · cos θ y i m exp s · cos θ y i m + j = 1 , j y i C exp s · cos θ j ) ,
where m is a cosine margin and s is a scaling factor for preventing excessively small gradients during the training.
To maintain the angular space and improve angular discrimination, ArcFace [15] implemented a modification by replacing the cosine space with an angular space. This resulted in the introduction of the additive angular margin softmax loss, which is defined as follows:
L ArcFace = 1 N i = 1 N log exp s · cos ( θ y i + m ) exp s · cos ( θ y i + m ) + j = 1 , j y i C exp s · cos θ j )
In Figure 2, we present a comparison of the decision boundaries resulting from various loss functions in a binary classification scenario. The decision boundary produced by the softmax loss is influenced by both the magnitude of weight vectors and the cosine angles, resulting in overlapping decision regions within the cosine space. A-Softmax improves upon the softmax loss by introducing an additional margin. However, it is important to note that the margin in A-Softmax varies with different θ values; it decreases as θ decreases and becomes nonexistent at θ = 0 . This implies that the margin is smaller for classes that are visually similar. In contrast, CosFace introduces a nonlinear angular margin, which may not provide adequate support for achieving intra-class compactness.
ArcFace adopts a distinctive approach, differentiating itself from A-Softmax and CosFace, by directly manipulating and optimizing the angular space. This uniqueness stems from the precise relationship between the angle space and arc within the hypersphere. A-Softmax (SphereFace) and CosFace utilize nonlinear margins, whereas ArcFace maintains a linear and constant margin throughout the entire process. This feature inherently enhances the compactness of the intra-class during the process of training. On the contrary, CosFace (AM-Softmax) introduces the margin in the cosine space, primarily impacting between-class distances and consequently ensuring discrimination between classes while achieving compactness within distinct classes. In a different effort but with the same target, ArcFace places greater emphasis on enhancing the compactness of intra-class.

3.5. Convolutional Neural Networks

We opted for the BreastNet architecture as the foundational framework for our approach [20]. BreastNet is characterized by its lightweight design, boasting around 600,000 parameters, and it harnesses the convolutional block attention module (CBAM) [23,24]. CBAM plays a pivotal role in enhancing the model’s ability to identify critical local regions, thereby extracting more discriminative features and elevating its representation capacity. BreastNet incorporates several key components, including the CBAM layer, convolutional layer, dense layer, residual layer, and hypercolumn technique. The CBAM layer is a standout feature, housing both channel and spatial attention modules. This dynamic combination allows the model to pinpoint significant areas within histopathological images, ensuring focused attention where needed. Importantly, CBAM achieves these improvements with minimal overhead, bolstering model performance without introducing a significant increase in weights and computational time. The residual layer is employed to enhance gradient smoothness, alleviate issues of overfitting and underfitting, and foster improved generalization. Additionally, the hypercolumn technique is instrumental in analyzing BreakHis images at various scales. It aids in comprehending diseases, stabilizing classification outcomes, and overall enhancing the model’s classification performance. Figure 3 illustrates the holistic architecture of BreastNet. The model’s structure is divided into multiple stages for feature extraction. In the first stage, global features are extracted from the input data. Following this, the two subsequent stages, namely stages two and three, further refine the representation by extracting additional local and global features. To augment the capacity of embedding features in these stages, we introduced the CBAM layer within the convolutional blocks. These CBAM blocks play a crucial role in identifying vital regions within histopathological images that require the model’s focused attention. This process is facilitated by the channel and spatial attention techniques embedded within the CBAM. Inside the architecture, the model incorporates a dense, global average pooling layer, and dropout layers to function as a classification phase. For the output activation function, we adopt the usual softmax and angular softmax losses (i.e., A-Softmax (SphereFace), CosFace (AM-Softmax), and ArcFace), which are utilized to calculate class probabilities for the cross-entropy loss.

4. Experimental Setup

We carried out our experiments through Python 3.6 and utilized Tensorflow-gpu (version 1.15.0). The training process was conducted on an Nvidia GeForce 2080Ti GPU (RTX model) with 11 GB of memory. To ensure robustness, we adopted a k-fold cross-validation (k = 5) approach. Our reported results are displayed as the mean of five outcomes, along with their corresponding standard deviations. We resized the input images to dimensions of 224 × 224 pixels. The training of the convolutional neural networks (CNNs) involved setting the number of training epochs to 100, with the early stopping activated after 100 epochs. We employed a mini-batch size of 16 and harnessed the ADAM optimization method. Furthermore, to accelerate the training process, we employed stochastic gradient descent with a warm restart (SGDR) [25]. SGDR employs a cosine annealing strategy to regulate learning rates with cyclic restarts. This periodic increase in the learning rate encourages the model to explore more stable local minima during training. We configured the minimum learning rate to 1 × 10 6 and the maximum learning rate to 1 × 10 3 , respectively. To further enhance the robustness of our model, we implemented data augmentation techniques using the albumentations library [26]. Specifically, we applied augmentation techniques such as flipping, shifting, adjusting brightness, and rotation, each with corresponding hyperparameters set to 0.5, 0.2, 0.3, and 20, respectively. It is important to note that data augmentation was conducted on a one-to-one basis without any duplication. In terms of loss functions, we considered a range of options, including softmax, A-Softmax, CosFace, and ArcFace. To fine-tune these methods, we established specific hyperparameters: A-Softmax’s multiplicative angular margin was set to 1.35, CosFace’s additive cosine margin to 0.35, and ArcFace’s additive angular margin to 0.50. Additionally, we set the scaling factor s to 64 and maintained a fixed weight decay of 5 × 10 4 , aligning with the configuration described in [15]. To assess the performance of our system, we relied on standard statistical metrics, including precision (Pr), recall (Re), F1-score, and overall classification accuracy (Acc), all of which were derived from confusion matrices (Equations (9)–(12)). This comprehensive evaluation was conducted using the test dataset.
Pr = ( TP ) ( TP + FP )
Re = ( TP ) ( TP + FN )
F 1 - Score = ( 2 × TP ) ( 2 × TP + FP + FN )
Acc = ( TP + TN ) ( TP + FN ) + ( FP + TN )
where TP corresponds to true positives, TN signifies true negatives, FP stands for false positives, and FN represents false negatives.

5. Results and Discussion

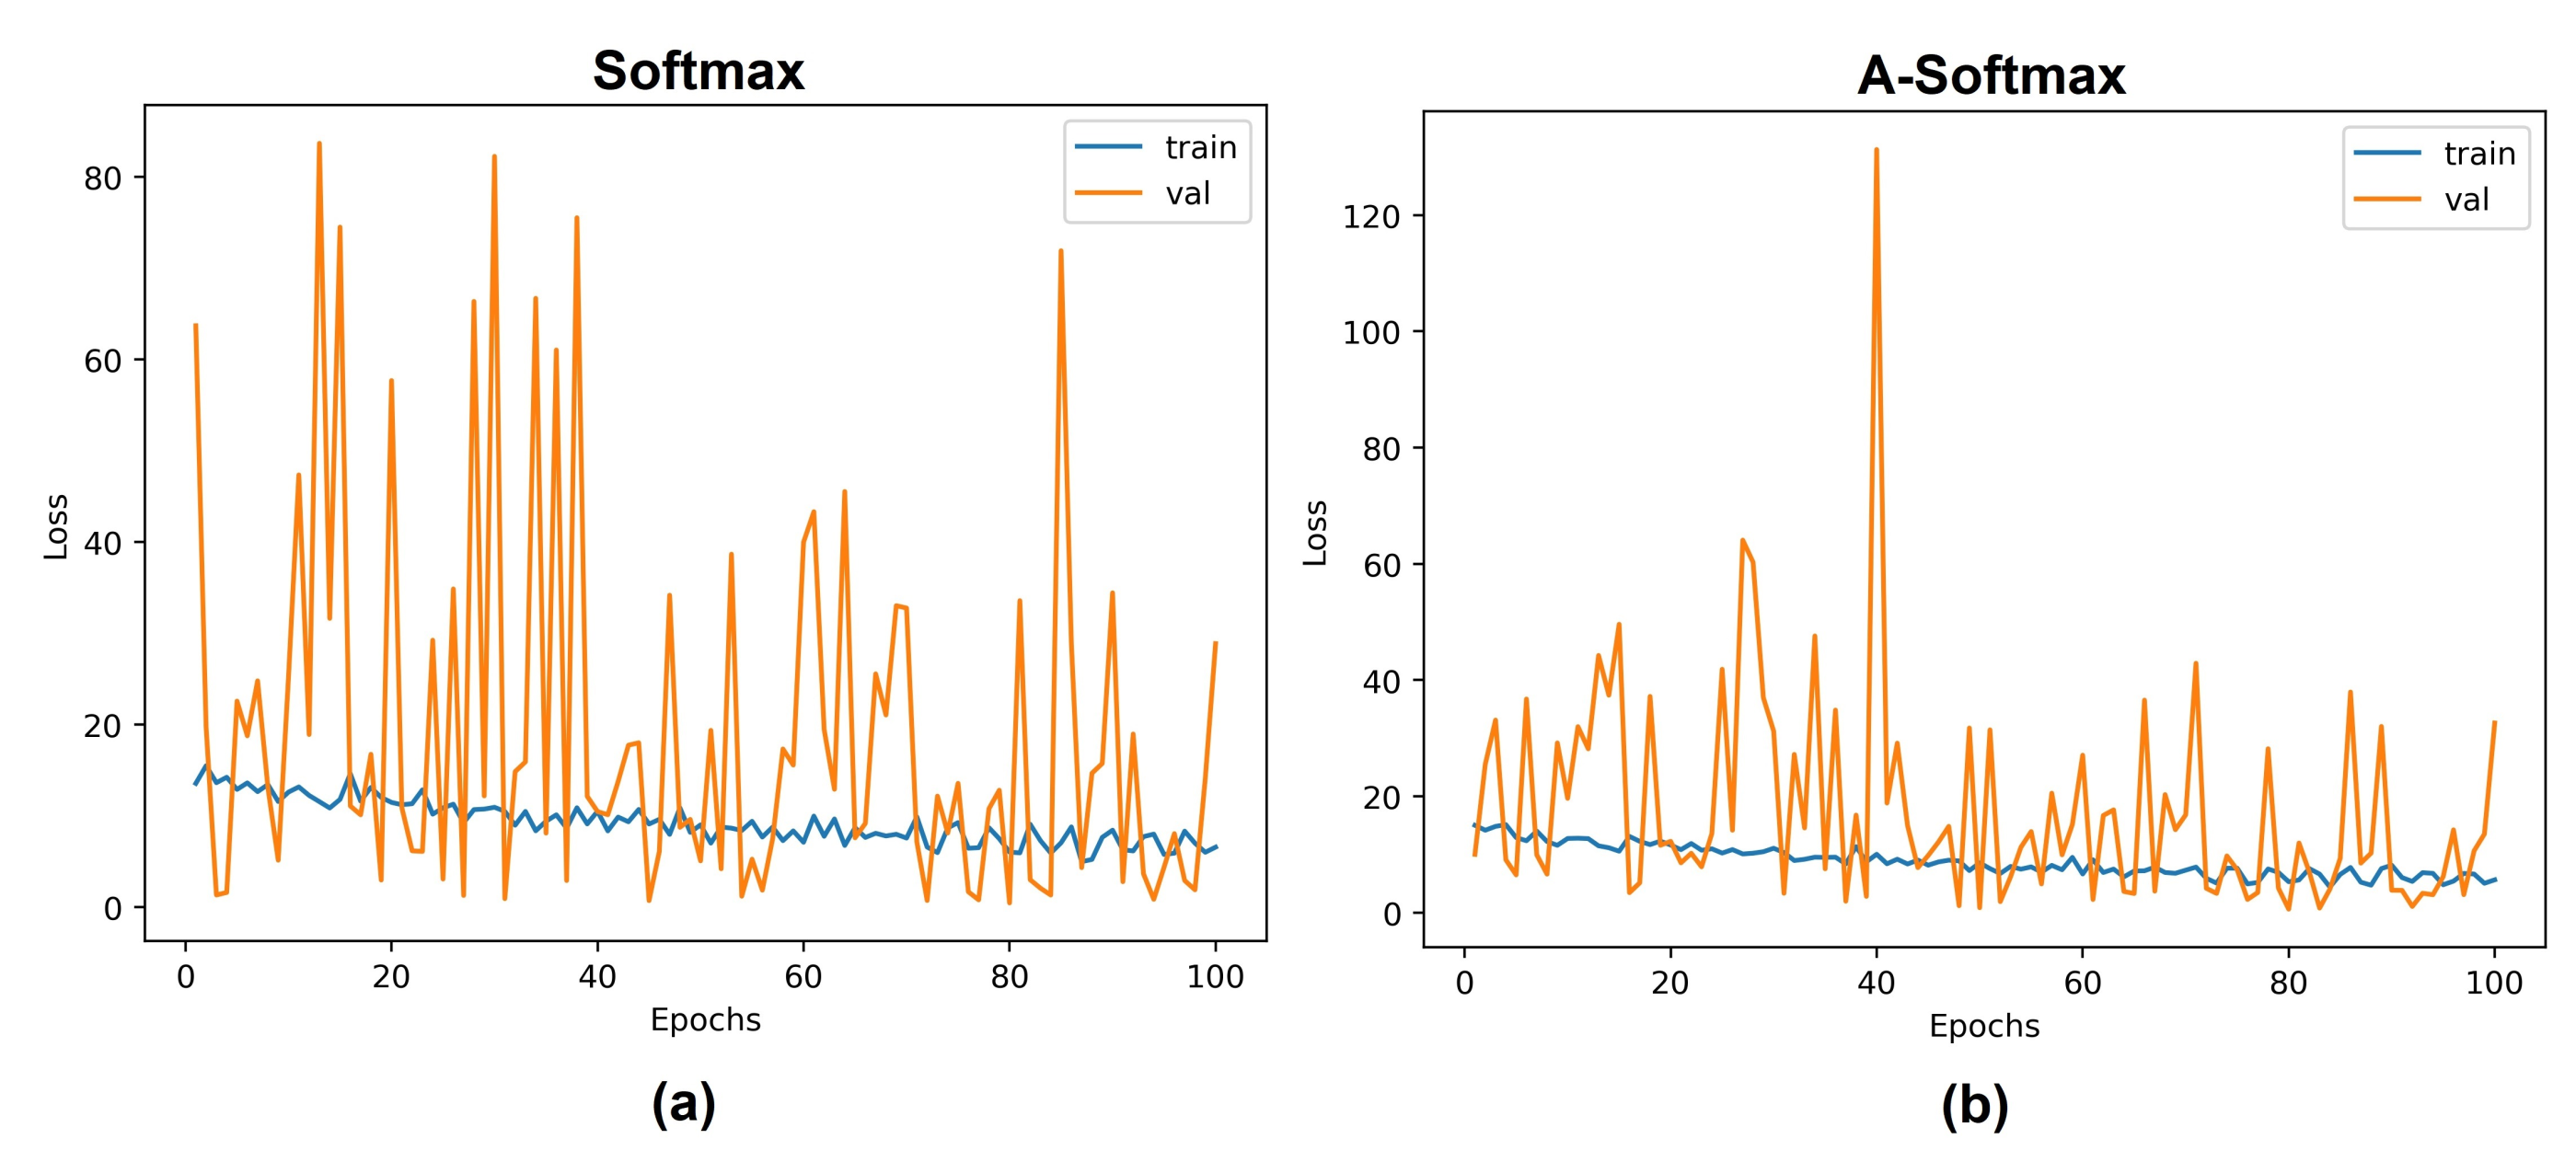
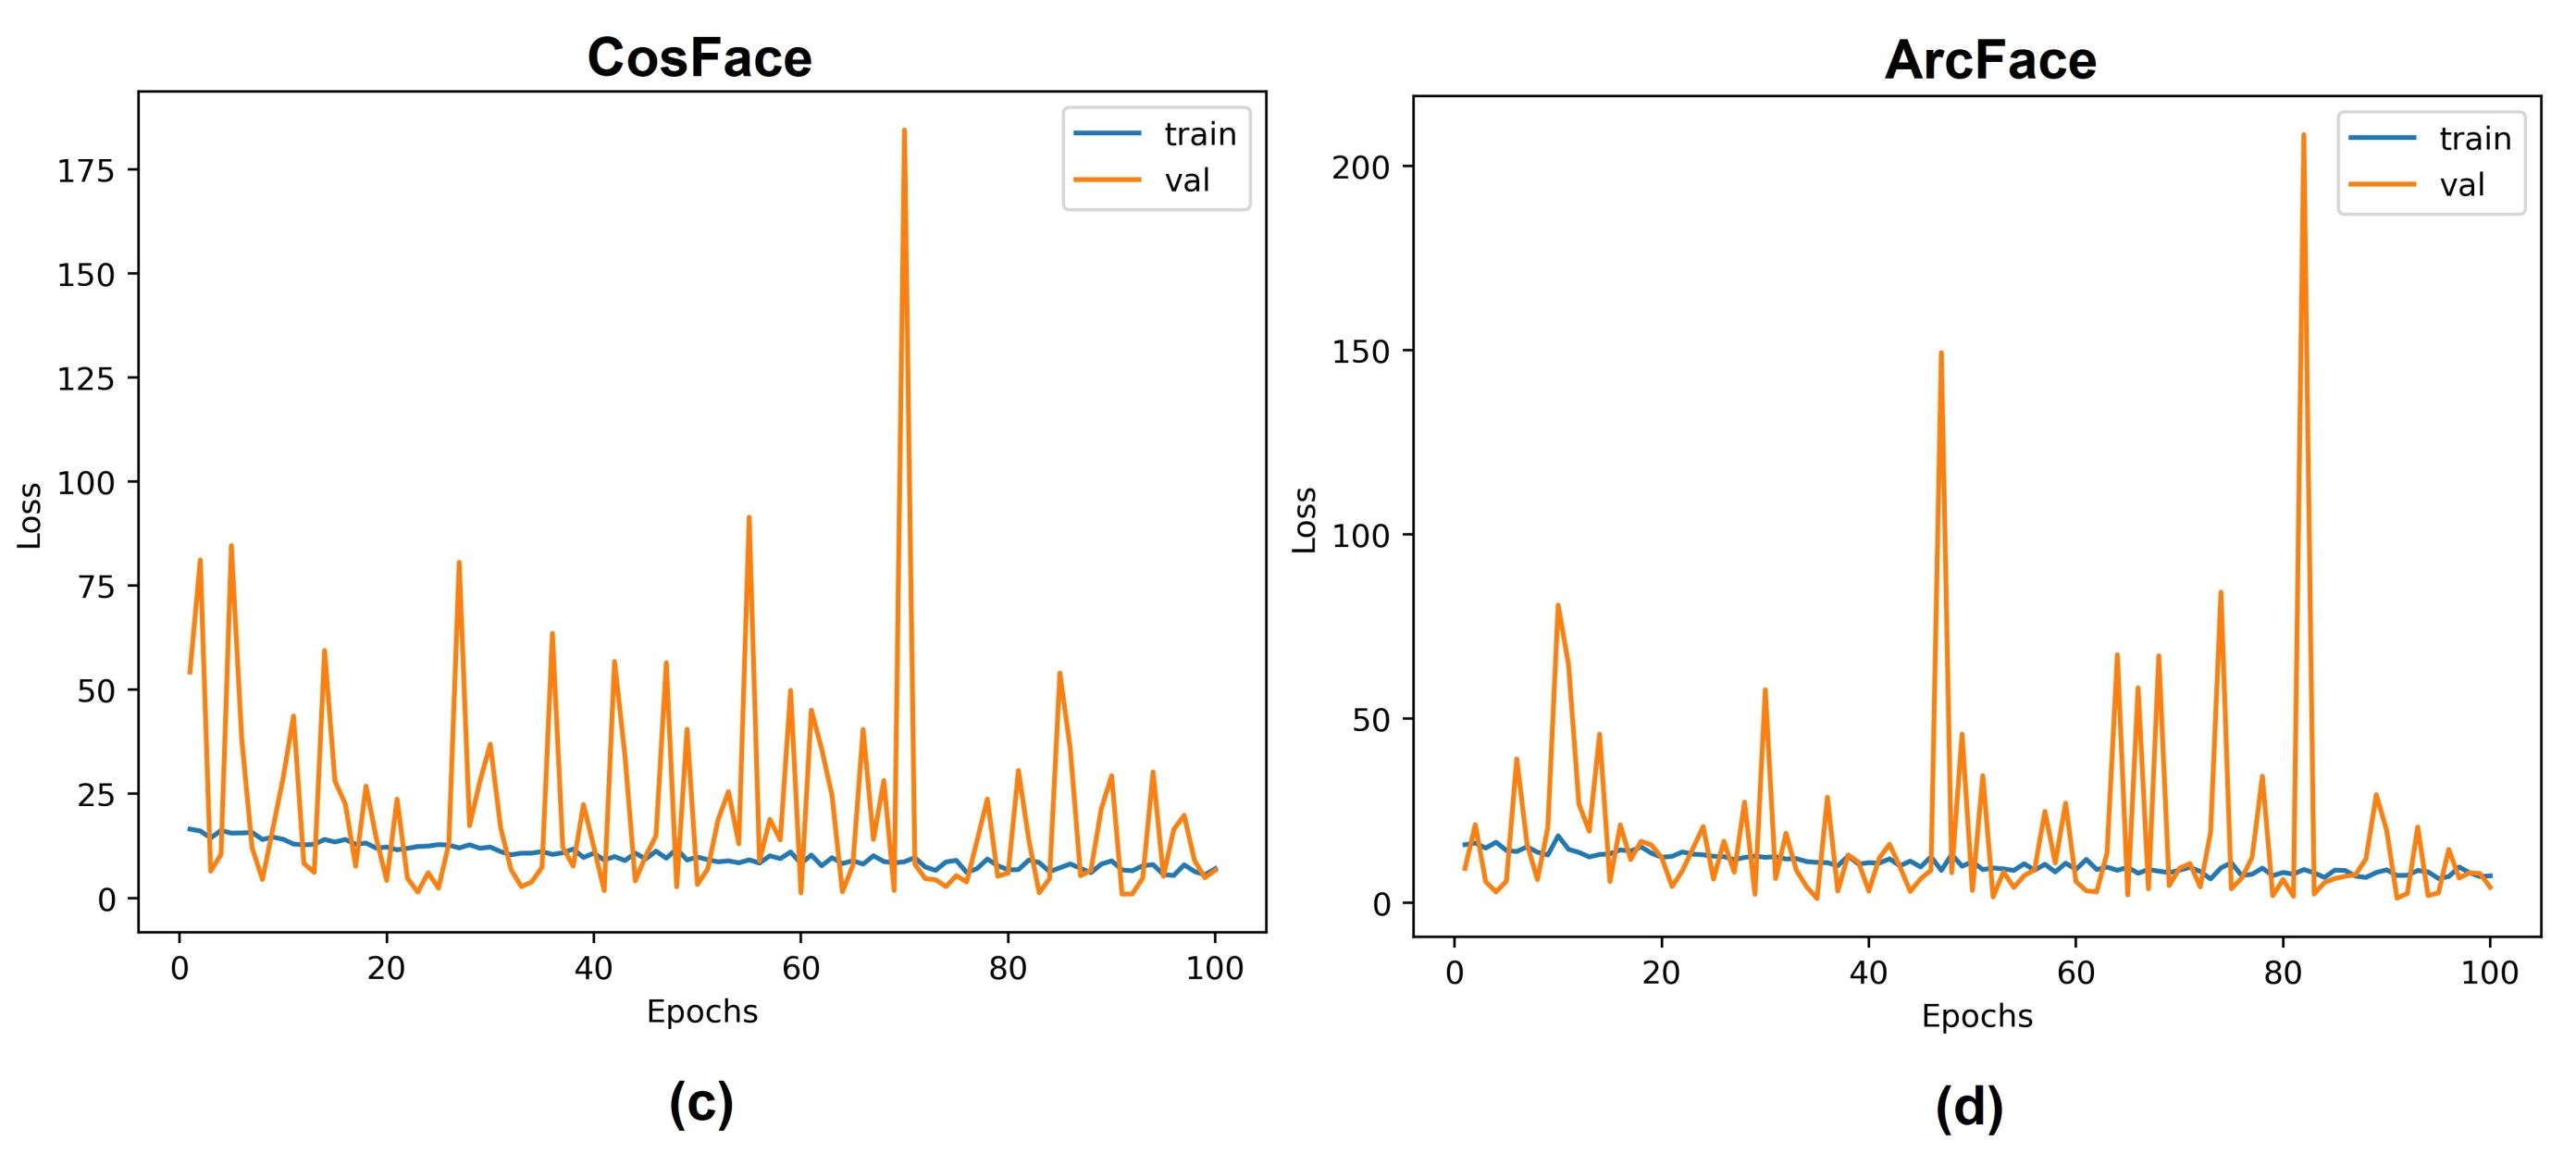
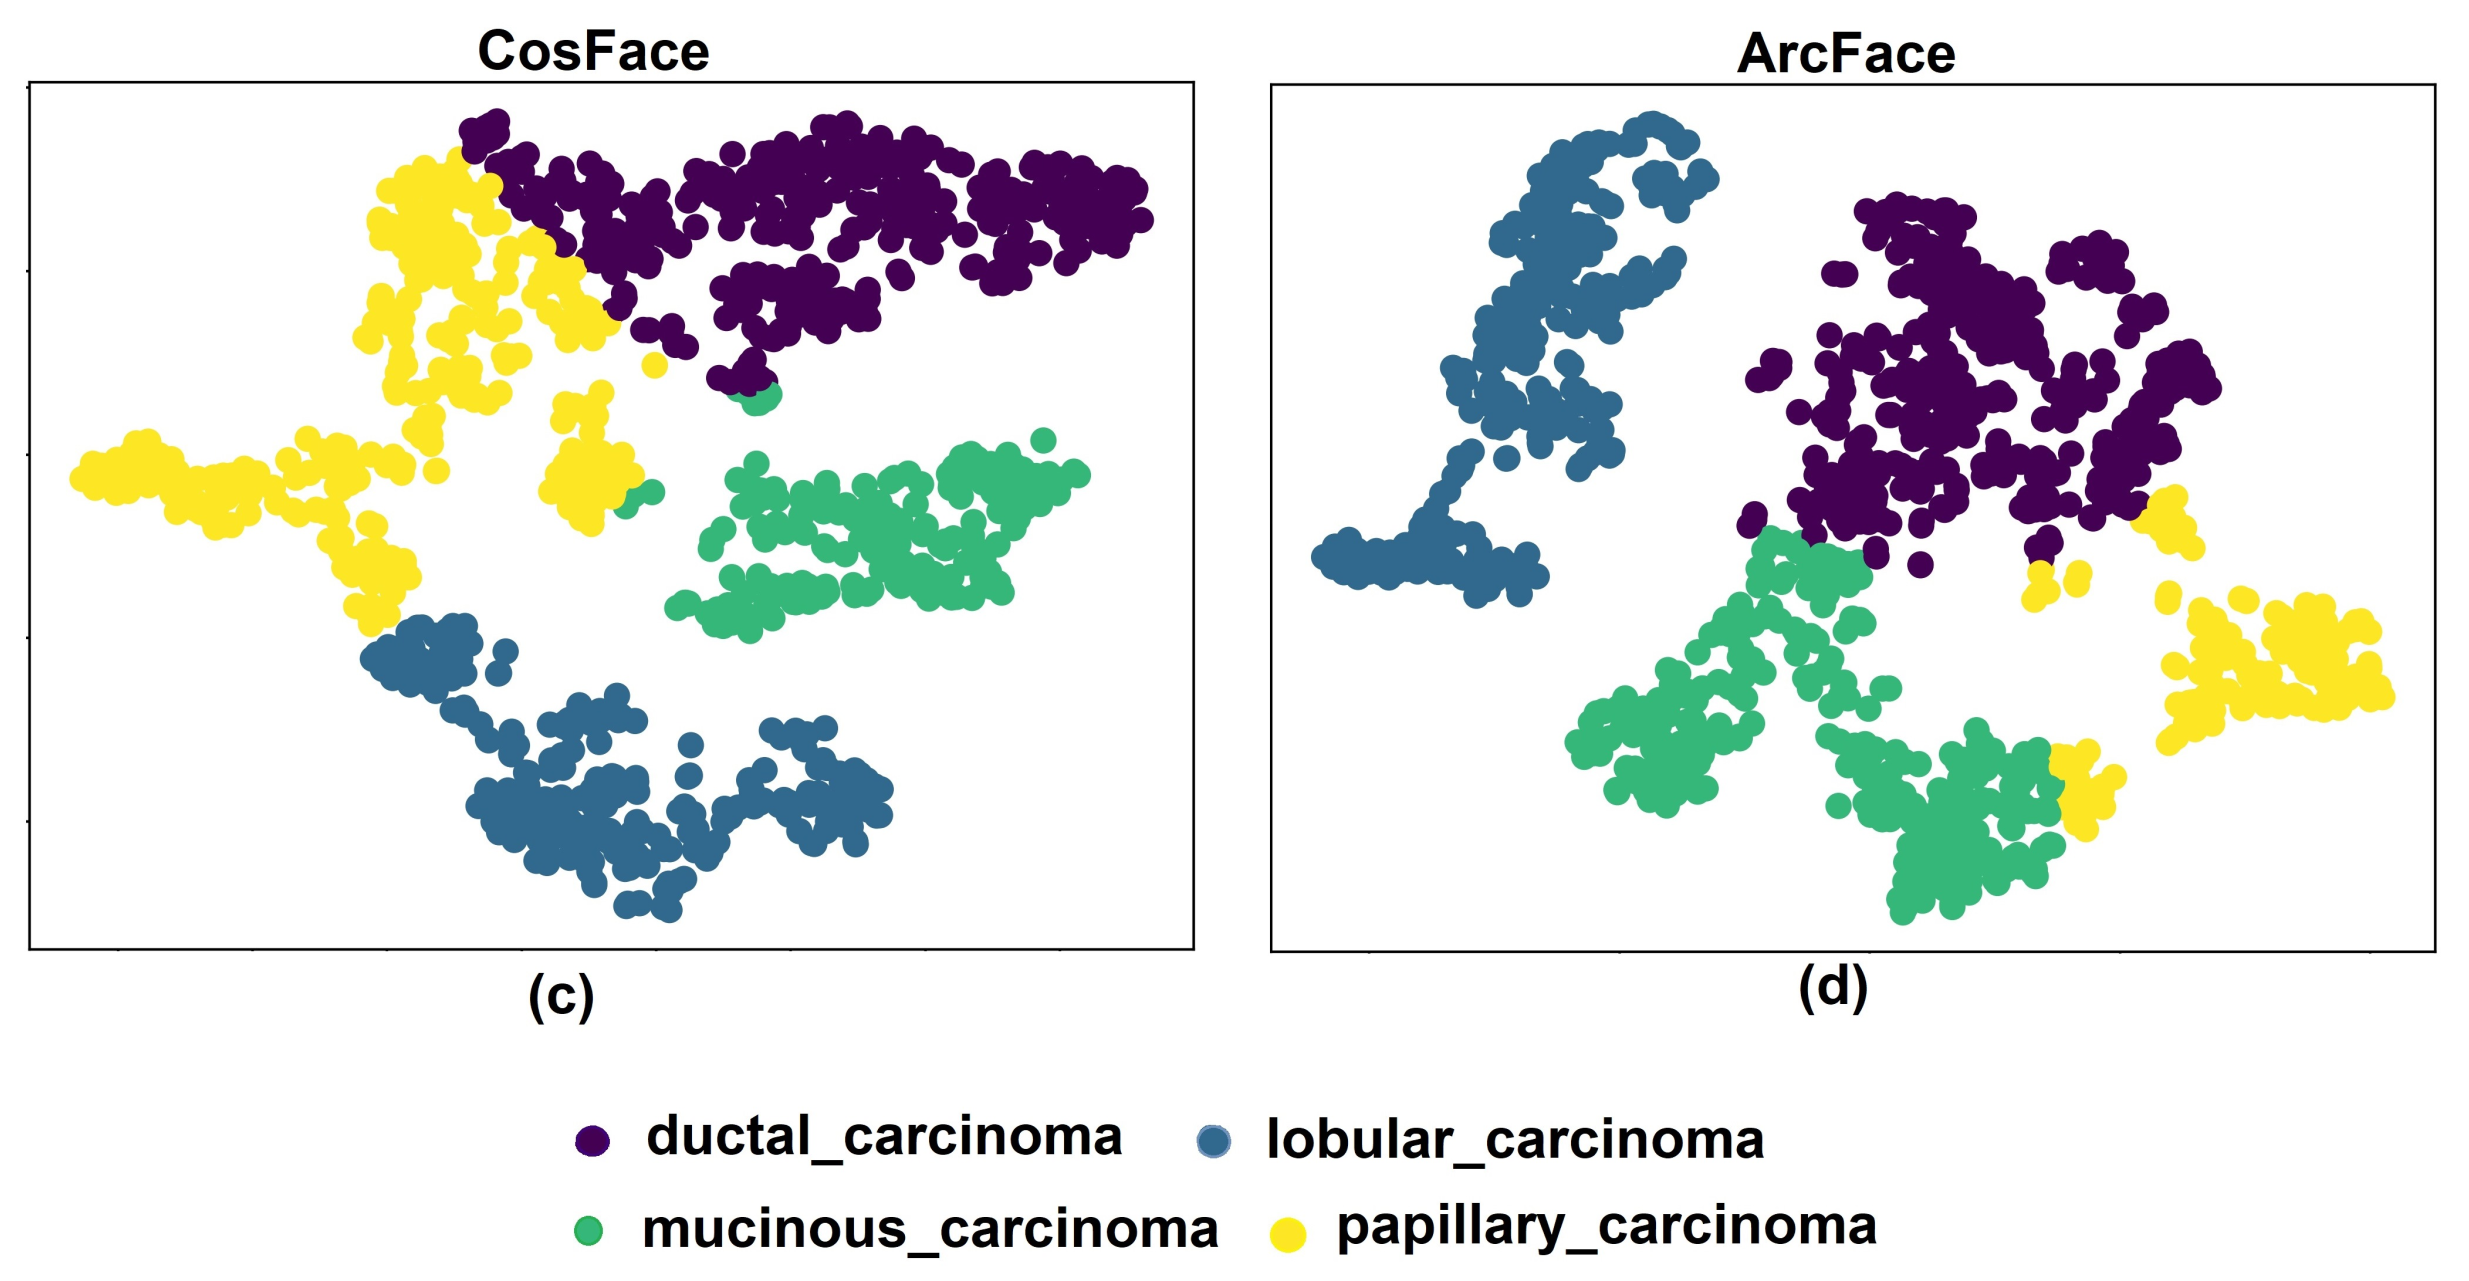
5.1. Experiments with Different Losses

We carried out the performance evaluation of different loss functions, namely softmax, A-Softmax (SphereFace), CosFace (AM-Softmax), and ArcFace, using the BreastNet feature learning across various data groups of the dataset (i.e., low-magnification (40×), middle-magnification (100× and 200×), and high-magnification (400×)). The results, presented in Table 2, offer intriguing insights. A-Softmax demonstrates enhanced discriminative feature embedding and improved performance compared to softmax in middle resolutions (i.e., 100× and 200×). However, it exhibits unstable training and leads to decreased system performance in the low-resolution group (40×) and high-resolution group (400×). The integer angular margin employed by angular softmax results in a steep target logit curve, which can impede convergence. In scenarios where discriminating inter-class distances is vital, such as the 40× and 400× groups, A-Softmax’s emphasis on compacting intra-class variance becomes less effective in increasing inter-class diversity. On the contrary, CosFace and ArcFace demonstrate their effectiveness in enhancing training stability and elevating the discriminative capabilities of the model. Both of these loss functions lead to a notable improvement in all metrics across all data, as compared to softmax. An interesting observation is that CosFace surpasses ArcFace in terms of inter-class discrimination. CosFace directly incorporates the cosine margin into the target logit, placing a strong emphasis on expanding inter-class distances. This leads to superior performance, particularly in the low-resolution group (40×) and high-resolution group (400×), where between-class distance plays a crucial role. In contrast, ArcFace adopts an alternative strategy, optimizing the geodesic space through a uniform margin, resulting in enhanced performance in middle resolutions (i.e., 100× and 200×). In summary, CosFace (AM-Softmax) prioritizes increasing between-class distances, while ArcFace concentrates on boosting the compactness of the intra-class through target class logit penalization. Consequently, ArcFace stands out in achieving the exceptional compactness of the intra-class for the middle resolution data (i.e., 100× and 200×), while CosFace excels in enhancing the diversity of the inter-class, particularly in the case of the low-resolution group (40×) and high-resolution groups (400×), as a courtesy of its cosine margin approach. Figure 4 illustrates the training and validation losses for angular margin-based softmax losses and softmax when employed with the BreastNet network. These findings emphasize the superior training performance of softmax losses based on an angular margin, which consistently results in lower training losses compared to the softmax loss during the training phase for classifying breast cancer histopathological images using the BreakHis dataset. As detailed in Table 3, these improvements come without significant changes in parameters or computation time, making these kinds of losses an efficient choice with minimal extra training overhead.
In addition to the primary binary classification task of distinguishing between benign and malignant classes, we also engaged in sub-class classification using the approach detailed in [20]. The benign category encompasses four sub-classes: (1) adenosis; (2) fibroadenoma; (3) phyllodes tumor; and (4) tubular adenoma, while the malignant category comprises four sub-classes: (1) ductal carcinoma; (2) lobular carcinoma; (3) mucinous carcinoma; and (4) papillary carcinoma. The outcomes of sub-class classification for both the benign and malignant categories are displayed in Table 4. Remarkably, the BreastNet model, trained using softmax losses based on an angular margin, consistently surpasses the performance of the softmax loss across sub-classes within both benign and malignant categories. This outcome underscores the prowess of softmax losses based on an angular margin in achieving highly discriminative feature embeddings for multi-class classification tasks. To delve deeper into the advantages of softmax losses based on an angular margin, we conducted a comparison of the two-dimensional embeddings produced by these loss functions across the entire BreakHis dataset. This visualization, showcased in Figure 5, was created by applying the t-distributed stochastic neighbor embedding (t-SNE) algorithm to reduce a 256-dimensional embedding to a 2-dimensional embedding. Notably, there is a distinct difference in the boundary between the two classes: benign and malignant as we transition from softmax loss to CosFace loss. This shift indicates an enhanced separation between these classes. However, CosFace, which primarily emphasizes inter-class diversity, faces challenges in effectively reducing intra-class variations. On the other hand, ArcFace excels in promoting the compactness of the intra-class but does not prioritize the diversity of the inter-class to the same degree. It aims to strike a balance by simultaneously enhancing the intra-class compactness and the inter-class diversity to some extent. We also conducted a comparison of t-SNE feature embeddings among different loss functions in sub-class classification scenarios within both the benign and malignant classes. Figure 6 showcases t-SNE feature embeddings resulting from various loss functions for four benign classes, including adenosis, fibroadenoma, phyllodes tumor, and tubular adenoma. Furthermore, Figure 7 presents the t-SNE feature embeddings derived from the various loss functions for four malignant classes, namely ductal carcinoma, lobular carcinoma, mucinous carcinoma, and papillary carcinoma. As evident in both figures, the utilization of angular margin-based softmax losses enhances both intra-class compactness and inter-class diversity when compared to the softmax function. From our earlier discussion in Section 3.2. It is important to highlight that the larger quantity of malignant images (5429 images) in comparison to benign images (2480 images) plays a significant role in the enhanced performance of BreastNet+angular margin-based softmax losses for discriminative feature learning in the malignant class, as it provides more robust training opportunities.

5.2. Comparison with State-of-the-Art Methods

To showcase the prowess of softmax losses based on an angular margin in expediting the convergence of the model and elevating classification performance, we performed a comparative analysis. Specifically, we evaluated the performance of BreastNet combined with CosFace loss and BreastNet combined with ArcFace loss with the latest methodologies based on deep learning that achieved benchmark accuracies for binary breast tumor classification using the BreakHis dataset. The outcomes and methodologies of these cutting-edge approaches are succinctly outlined in Table 5. Looking at the data presented in Table 5, it is apparent that earlier approaches attempted to enhance feature representation through the utilization of substantial deep learning architectures like the VGG16 model, Xception model, and Inception-ResNet-v2 model. Zhu et al. [27] introduced an innovative approach involving the fusion of multiple CNNs. Their method included global and local branches, creating a hybrid deep learning architecture aimed at enhancing feature representation. To further enhance performance, they integrated the squeeze-excitation-pruning (SEP) block into the deep learning model, effectively identifying crucial channels. This approach yielded an average accuracy of 83.78%. Building on this foundation, Li et al. [28] proposed the Interleaved DenseNet (IDSNet) method, harnessing the DenseNet block and the channel attention module SENet (Squeeze-and-Excitation). IDSNet surpassed Zhu et al.’s [27] approach, achieving a superior average accuracy of 86.40%. In another endeavor, Budak et al. [29] developed a model that achieved an impressive average classification rate of 92.47%. This model utilized a convolutional network in conjunction with a bidirectional long short-term memory (Bi-LSTM) architecture. Additionally, researchers in [30,31] pursued improvements in feature representation by employing a large-scale deep learning model (i.e., VGG16) and achieved an average accuracy of 95.30% and 94.73%, respectively. Sharma et al. [32] and Abbasniya et al. [33] demonstrated remarkable results with average classification rates of 95.59% and 96.45%, respectively. Nevertheless, it is important to note that these methods relied on transfer learning with ImageNet weights, which might not be the most suitable approach for breast cancer image classification. Additionally, their reported results did not account for the average of 5-fold cross-validation outcomes, potentially introducing variability due to different data splits. To combat the challenge posed by limited data, Chattopadhyay et al. [34] introduced the MTRRE-Net74 deep learning model, incorporating a two-fold residual recurrent operation and a multi-scaling operation to emphasize spatial information. While their approach achieved the best accuracy for the 400× data by focusing on local and spatial information, it exhibited comparatively lower classification rates for other data. In contrast, BreastNet+CosFace and BreastNet+ArcFace outperform these methods on the BreakHis dataset, despite being trained from scratch. CosFace achieves the highest accuracy for the 40× data, boasting an impressive average classification accuracy of 96.99%, while ArcFace attains the highest accuracies for the 100× and 200× data, maintaining an average classification rate of 96.97%. Our feature representation leverages the BreastNet architecture with 600 K parameters, effectively extracting both spatial and channel information. The inclusion of CosFace and ArcFace loss functions is a crucial factor in improving the convergence of the deep learning model and boosting classification results.

5.3. Discussion

A loss function’s primary task in deep supervised learning is to close the gap between expected and actual results, hence driving the learning process. This study looks into angular margin-based softmax losses, specifically A-Softmax (SphereFace), CosFace (AM-Softmax), and ArcFace, and their relevance in breast cancer analysis using histopathology images. These loss functions, which have historically been connected with facial recognition tasks, are being studied to determine their potential efficacy in the context of image-based breast cancer classification, especially when dealing with a challenging dataset. The focus of our investigation is the BreaKHis dataset, which presents unique problems for training convolutional neural networks (CNNs) due to its limited size. The scarcity of sufficient training data worsens the issue of overfitting in CNNs, leading to the model’s learned distribution deviating from the actual distribution. In our pursuit of effectively training deep learning models for breast cancer image analysis, even when data are scarce, we lay a strong emphasis on three critical components that, when combined, offer considerable improvements: (1) Leveraging the lightweight architecture of BreastNet safeguards against overfitting, endowing the model with robust generalization capabilities—especially when dealing with limited data. (2) The incorporation of an attention mechanism steers the abilities of the nimble network towards pertinent features, streamlining the utilization of available data. (3) Softmax losses based on an angular margin are critical in amplifying the model’s discriminatory prowess, thereby improving its overall performance within the limitations of a small dataset. The utilization of these discriminative loss functions has showcased exceptional performance, encompassing heightened accuracy, F 1 -score, precision, and recall, across binary and multi-classification tasks for pathological breast cancer images when juxtaposed with alternative models. Additionally, our investigation into loss convergence during the training phase has unveiled that angular margin-based softmax losses foster more efficient convergence in contrast to the conventional softmax loss.
While these loss functions have displayed encouraging outcomes, their performance is contingent on the selection of suitable margin values. Inaccurate margin choices can result in amplified intra-class variability and classification errors. Additionally, the BreakHis dataset employed in the development of the deep learning model exhibits an imbalance, comprising malignant images (5429) and benign images (2480). This dataset’s class imbalance can impact the model’s tumor classification performance, as it tends to favor the larger class. In the course of model training, angular margin-based losses employ consistent margins for both classes (benign and malignant), irrespective of the class sizes. Therefore, a prospective avenue for future research could involve dynamically adjusting inter-class and intra-class margins based on the class sample sizes to mitigate bias towards the majority class.

6. Conclusions

This study explored the role of softmax losses based on an angular margin in enhancing the convergence of deep convolutional neural networks (CNNs) for histopathological image classification using the BreakHis dataset. Leveraging BreastNet, a lightweight deep learning architecture, as our backbone, we used A-Softmax, CosFace, and ArcFace as discriminative loss functions, offering a new approach to achieving high accuracy in breast cancer diagnosis based on whole-slide image analysis without the need for nuclei segmentation. Our experimental results consistently demonstrated that the BreastNet model, guided by angular margin-based softmax losses, consistently outperformed the softmax loss across all magnification factors. Notably, CosFace and ArcFace played pivotal roles in stabilizing and enhancing the discriminative power of our deep learning model. CosFace excelled in prioritizing the inter-class distance expansion, achieving the highest inter-class diversity for the 40× and 400× data with classification accuracies of 97.44% and 96.37%, respectively. ArcFace, on the other hand, directly penalized the target logit, resulting in the best intra-class compactness for the middle-resolution data (i.e., 100× and 200×), with classification accuracies of 97.36% and 98.01%, respectively. CosFace’s nonlinear angular margin influenced inter-class distances, while ArcFace’s constant linear angular margin improved the compactness of the intra-class during the discriminative deep-embedded learning. Both nonlinear and linear angular margins proved effective in establishing a resilient decision boundary that strikes a balance between intra-class and inter-class distances. This finding suggests potential directions for future research in this field.

Author Contributions

Conceptualization, P.A. and F.D.; methodology, P.A., F.D. and A.M.; software, P.A.; validation, P.A., F.D. and A.M.; writing—original draft preparation, P.A.; writing—review and editing, P.A., F.D. and A.M.; supervision, F.D. and A.M.; funding acquisition, P.A., F.D. and A.M. All authors have read and agreed to the published version of the manuscript.

Funding

This work is partially supported by the project GUI19/027 and by the grant PID2021-126701OB-I00 funded by MCIN/AEI/10.13039/501100011033 and by “ERDF A way of making Europe”.

Conflicts of Interest

The authors declare that the research was conducted in the absence of any commercial or financial relationships that could be construed as a potential conflict of interest.

References

  1. Veta, M.; Pluim, J.; Van Diest, P.; Viergever, M. Breast cancer histopathology image analysis: A review. IEEE Trans. Biomed. Eng. 2014, 61, 1400–1411. [Google Scholar] [CrossRef] [PubMed]
  2. Al-Hajj, M.; Wicha, M.; Benito-Hernandez, A.; Morrison, S.; Clarke, M. Prospective identification of tumorigenic breast cancer cells. Proc. Natl. Acad. Sci. USA 2003, 100, 3983–3988. [Google Scholar] [CrossRef] [PubMed]
  3. Sheikh, T.; Lee, Y.; Cho, M. Histopathological classification of breast cancer images using a multi-scale input and multi-feature network. Cancers 2020, 12, 2031. [Google Scholar] [CrossRef] [PubMed]
  4. Xie, J.; Liu, R.; Luttrell, J., IV; Zhang, C. Deep learning based analysis of histopathological images of breast cancer. Front. Genet. 2019, 10, 80. [Google Scholar] [CrossRef] [PubMed]
  5. Xu, Y.; Jia, Z.; Wang, L.; Ai, Y.; Zhang, F.; Lai, M.; Chang, E. Large scale tissue histopathology image classification, segmentation, and visualization via deep convolutional activation features. BMC Bioinform. 2017, 18, 281. [Google Scholar] [CrossRef]
  6. Gandomkar, Z.; Brennan, P.; Mello-Thoms, C. MuDeRN: Multi-category classification of breast histopathological image using deep residual networks. Artif. Intell. Med. 2018, 88, 14–24. [Google Scholar] [CrossRef]
  7. Huang, Y.; Zheng, H.; Liu, C.; Ding, X.; Rohde, G. Epithelium-stroma classification via convolutional neural networks and unsupervised domain adaptation in histopathological images. IEEE J. Biomed. Health Inform. 2017, 21, 1625–1632. [Google Scholar] [CrossRef]
  8. Idlahcen, F.; Himmi, M.; Mahmoudi, A. Cnn-based approach for cervical cancer classification in whole-slide histopathology images. arXiv 2020, arXiv:2005.13924. [Google Scholar]
  9. Yu, X.; Zheng, H.; Liu, C.; Huang, Y.; Ding, X. Classify epithelium-stroma in histopathological images based on deep transferable network. J. Microsc. 2018, 271, 164–173. [Google Scholar] [CrossRef]
  10. Spanhol, F.; Oliveira, L.; Petitjean, C.; Heutte, L. Breast cancer histopathological image classification using convolutional neural networks. In Proceedings of the International Joint Conference On Neural Networks (IJCNN), Vancouver, BC, Canada, 24–29 July 2016; pp. 2560–2567. [Google Scholar]
  11. Büker, A.; Hanilçi, C. Angular Margin Softmax Loss and Its Variants for Double Compressed AMR Audio Detection. In Proceedings of the 2021 ACM Workshop On Information Hiding Furthermore, Multimedia Security, Virtual, 22–25 June 2021; pp. 45–50. [Google Scholar]
  12. Liu, W.; Wen, Y.; Yu, Z.; Li, M.; Raj, B.; Song, L. Sphereface: Deep hypersphere embedding for face recognition. In Proceedings of the IEEE Conference On Computer Vision Furthermore, Pattern Recognition, Honolulu, HI, USA, 21–26 July 2017; pp. 212–220. [Google Scholar]
  13. Wang, H.; Wang, Y.; Zhou, Z.; Ji, X.; Gong, D.; Zhou, J.; Li, Z.; Liu, W. Cosface: Large margin cosine loss for deep face recognition. In Proceedings of the IEEE Conference On Computer Vision Furthermore, Pattern Recognition, Salt Lake City, UT, USA, 18–22 June 2018; pp. 5265–5274. [Google Scholar]
  14. Wang, F.; Cheng, J.; Liu, W.; Liu, H. Additive margin softmax for face verification. IEEE Signal Process. Lett. 2018, 25, 926–930. [Google Scholar] [CrossRef]
  15. Deng, J.; Guo, J.; Xue, N.; Zafeiriou, S. Arcface: Additive angular margin loss for deep face recognition. In Proceedings of the IEEE/CVF Conference On Computer Vision Furthermore, Pattern Recognition, Long Beach, CA, USA, 16–20 June 2019; pp. 4690–4699. [Google Scholar]
  16. Wang, P.; Wang, J.; Li, Y.; Li, P.; Li, L.; Jiang, M. Automatic classification of breast cancer histopathological images based on deep feature fusion and enhanced routing. Biomed. Signal Process. Control 2021, 65, 102341. [Google Scholar] [CrossRef]
  17. Zhang, C.; Bai, Y.; Yang, C.; Cheng, R.; Tan, X.; Zhang, W.; Zhang, G. Histopathological image recognition of breast cancer based on three-channel reconstructed color slice feature fusion. Biochem. Biophys. Res. Commun. 2022, 619, 159–165. [Google Scholar] [CrossRef]
  18. Zou, Y.; Chen, S.; Che, C.; Zhang, J.; Zhang, Q. Breast cancer histopathology image classification based on dual-stream high-order network. Biomed. Signal Process. Control 2022, 78, 104007. [Google Scholar] [CrossRef]
  19. Majumdar, S.; Pramanik, P.; Sarkar, R. Gamma function based ensemble of CNN models for breast cancer detection in histopathology images. Expert Syst. Appl. 2023, 213, 119022. [Google Scholar] [CrossRef]
  20. Toğaçar, M.; Özkurt, K.; Ergen, B.; Cömert, Z. BreastNet: A novel convolutional neural network model through histopathological images for the diagnosis of breast cancer. Phys. A Stat. Mech. Appl. 2020, 545, 123592. [Google Scholar] [CrossRef]
  21. Spanhol, F.; Oliveira, L.; Petitjean, C.; Heutte, L. A dataset for breast cancer histopathological image classification. IEEE Trans. Biomed. Eng. 2015, 63, 1455–1462. [Google Scholar] [CrossRef]
  22. Spanhol, F.; Oliveira, L.; Cavalin, P.; Petitjean, C.; Heutte, L. Deep features for breast cancer histopathological image classification. In Proceedings of the IEEE International Conference On Systems, Man, Furthermore, Cybernetics (SMC), Banff, AB, Canada, 5–8 October 2017; pp. 1868–1873. [Google Scholar]
  23. Alirezazadeh, P.; Schirrmann, M.; Stolzenburg, F. Improving Deep Learning-based Plant Disease Classification with Attention Mechanism. Gesunde Pflanz. 2023, 75, 49–59. [Google Scholar] [CrossRef]
  24. Alirezazadeh, P.; Rahimi-Ajdadi, F.; Abbaspour-Gilandeh, Y.; Landwehr, N.; Tavakoli, H. Improved digital image-based assessment of soil aggregate size by applying convolutional neural networks. Comput. Electron. Agric. 2021, 191, 106499. [Google Scholar] [CrossRef]
  25. Loshchilov, I.; Hutter, F. Sgdr: Stochastic gradient descent with warm restarts. arXiv 2016, arXiv:1608.03983. [Google Scholar]
  26. Buslaev, A.; Iglovikov, V.; Khvedchenya, E.; Parinov, A.; Druzhinin, M.; Kalinin, A. Albumentations: Fast and flexible image augmentations. Information 2020, 11, 125. [Google Scholar] [CrossRef]
  27. Zhu, C.; Song, F.; Wang, Y.; Dong, H.; Guo, Y.; Liu, J. Breast cancer histopathology image classification through assembling multiple compact CNNs. BMC Med. Inform. Decis. Mak. 2019, 19, 198. [Google Scholar] [CrossRef] [PubMed]
  28. Li, X.; Shen, X.; Zhou, Y.; Wang, X.; Li, T. Classification of breast cancer histopathological images using interleaved DenseNet with SENet (IDSNet). PLoS ONE 2020, 15, e0232127. [Google Scholar] [CrossRef] [PubMed]
  29. Budak, Ü.; Cömert, Z.; Rashid, Z.; Şengür, A.; Çıbuk, M. Computer-aided diagnosis system combining FCN and Bi-LSTM model for efficient breast cancer detection from histopathological images. Appl. Soft Comput. 2019, 85, 105765. [Google Scholar] [CrossRef]
  30. Kumar, A.; Singh, S.; Saxena, S.; Lakshmanan, K.; Sangaiah, A.; Chauhan, H.; Shrivastava, S.; Singh, R. Deep feature learning for histopathological image classification of canine mammary tumors and human breast cancer. Inf. Sci. 2020, 508, 405–421. [Google Scholar] [CrossRef]
  31. Saini, M.; Susan, S. Deep transfer with minority data augmentation for imbalanced breast cancer dataset. Appl. Soft Comput. 2020, 97, 106759. [Google Scholar] [CrossRef]
  32. Sharma, S.; Kumar, S. The Xception model: A potential feature extractor in breast cancer histology images classification. ICT Express 2022, 8, 101–108. [Google Scholar] [CrossRef]
  33. Abbasniya, M.; Sheikholeslamzadeh, S.; Nasiri, H.; Emami, S. Classification of breast tumors based on histopathology images using deep features and ensemble of gradient boosting methods. Comput. Electr. Eng. 2022, 103, 108382. [Google Scholar] [CrossRef]
  34. Chattopadhyay, S.; Dey, A.; Singh, P.; Oliva, D.; Cuevas, E.; Sarkar, R. MTRRE-Net: A deep learning model for detection of breast cancer from histopathological images. Comput. Biol. Med. 2022, 150, 106155. [Google Scholar] [CrossRef]
Figure 1. The complete structure of training the system (deep learning-based breast cancer classification) through the implementation of various margin penalties. (* signifies the operation of multiplication).
Electronics 12 04356 g001
Figure 2. Visualizing decision boundaries: This figure presents a graphical representation of decision boundaries for diverse loss functions in a binary classification context. The figure comprises four subplots, each corresponding to a distinct loss function: (a) Softmax; (b) A-Softmax; (c) CosFace; and (d) ArcFace. The decision boundary is symbolized by a dashed line, while the white regions signify the decision margin.
Electronics 12 04356 g002
Figure 3. The BreastNet architecture serves as the foundation of our experimental approach. BreastNet employs a combination of convolutional and residual blocks for feature extraction. To enhance its performance, CBAM module blocks are incorporated to enable the model to emphasize crucial regions in histopathological images. Additionally, the hypercolumn technique is employed to analyze BreakHis images at various scales, aiding in the comprehension of the disease.
Electronics 12 04356 g003
Figure 4. Training and validation losses comparison among softmax and different softmax losses based on an angular margin with BreastNet feature learning in a binary classification context. Subplot (a) illustrates the training and validation losses associated with Softmax, while subplots (bd) showcase the training and validation losses for the angular margin-based softmax losses, namely A-Softmax, CosFace, and ArcFace, respectively. The results highlight the efficacy of softmax losses based on an angular margin in achieving lower training losses compared to the softmax loss during the training of breast cancer histopathological image classification on the BreakHis dataset.
Electronics 12 04356 g004aElectronics 12 04356 g004b
Figure 5. Analyzing t-SNE embeddings: This figure showcases a comparative view of t-SNE embeddings obtained from different loss functions in a binary classification scenario. Subplot (a) displays the t-SNE embedding derived from Softmax, while subplots (bd) represent the embeddings resulting from the angular margin-based softmax losses, specifically A-Softmax, CosFace, and ArcFace, respectively. These embeddings are based on the complete BreakHis dataset. The blue line indicates the collision boundary between classes.
Electronics 12 04356 g005
Figure 6. Comparative t-SNE embeddings: This figure provides a comparative analysis of t-SNE embeddings obtained from various loss functions in a sub-class classification scenario within the benign class, consisting of four classes: (1) adenosis; (2) fibroadenoma; (3) phyllodes tumor; and (4) tubular adenoma. Subplot (a) illustrates the t-SNE embedding generated by Softmax, while subplots (bd) depict the embeddings resulting from angular margin-based softmax losses, namely A-Softmax, CosFace, and ArcFace, respectively. These embeddings are derived from the benign data subset of the BreakHis dataset.
Electronics 12 04356 g006aElectronics 12 04356 g006b
Figure 7. Comparative t-SNE embeddings: This figure provides a comparative analysis of t-SNE embeddings obtained from various loss functions in a sub-class classification scenario within the malignant class, consisting of four classes: (1) ductal carcinoma; (2) lobular carcinoma; (3) mucinous carcinoma; and (4) papillary carcinoma. Subplot (a) illustrates the t-SNE embedding generated by Softmax, while subplots (bd) depict the embeddings resulting from angular margin-based softmax losses, namely A-Softmax, CosFace, and ArcFace, respectively. These embeddings are derived from the malignant data subset of the BreakHis dataset.
Electronics 12 04356 g007aElectronics 12 04356 g007b
Table 1. Explanation of the key symbols utilized throughout this article.
Key SymbolDefinition
NQuantity of images within each batch
CTotal class count
w j R d × C The weight matrix W R d × C , with each column corresponding to a specific class (j-th class).
w y i The ground truth weight vector associated with class y i
x i The feature representation of the i-th sample.
θ y i The angle between the feature vector x i and the corresponding weight vector w y i .
θ j The angle formed between the feature vector x i and the weight vector w j for non-target classes (where j y i ).
mCosine and angular margin penalties for CosFace and ArcFace, respectively.
sThe scaling factor applied to all logit values.
Table 2. Comparison results of various angular margin-based softmax losses for various data groups (i.e., 40×, 100×, 200×, and 400×). The best outcomes are highlighted in bold.
Employed BreakHis DataMethodPr (%)Re (%) F 1 -Score (%)Acc (%)
40×Softmax96.56 ± 3.8595.30 ± 3.9495.88 ± 3.8896.49 ± 3.31
A-Softmax97.05 ± 1.2494.59 ± 3.6895.58 ± 2.8696.34 ± 2.22
CosFace97.47 ± 0.5096.59 ± 0.9797.01 ± 0.7397.44 ± 0.62
ArcFace97.54 ± 1.2296.31 ± 1.2596.88 ± 1.2297.34 ± 1.03
100×Softmax94.75 ± 5.0894.98 ± 3.7094.77 ± 4.5495.35 ± 4.18
A-Softmax95.87 ± 1.9595.61 ± 1.8895.74 ± 1.9096.31 ± 1.65
CosFace96.72 ± 1.6895.73 ± 2.5496.18 ± 2.1796.73 ± 1.81
ArcFace97.52 ± 0.5496.42 ± 0.9296.93 ± 0.5997.36 ± 0.50
200×Softmax96.37 ± 1.4396.92 ± 1.2496.62 ± 1.2797.07 ± 1.10
A-Softmax97.32 ± 1.3496.04 ± 3.5496.54 ± 2.6797.12 ± 2.21
CosFace97.01 ± 1.3597.08 ± 2.0496.99 ± 1.5897.42 ± 1.32
ArcFace98.13 ± 1.2097.26 ± 2.1697.65 ± 1.6998.01 ± 1.42
400×Softmax93.82 ± 3.5994.88 ± 3.1694.30 ± 3.4194.94 ± 3.05
A-Softmax94.03 ± 4.1893.12 ± 6.5493.39 ± 5.7094.45 ± 4.52
CosFace95.64 ± 1.4796.16 ± 0.8995.88 ± 1.2096.37 ± 1.09
ArcFace94.47 ± 1.3794.50 ± 2.0294.45 ± 1.6595.16 ± 1.40
Table 3. Comparative analysis of various methods with regard to the number of parameters and computational time in the five-fold strategy.
MethodNumber of ParametersTraining Time (s/epoch)Classification Time (ms/image)
Softmax605,56657.3 ± 2.6413.3 ± 1.24
A-Softmax605,58258.8 ± 1.6914.7 ± 1.44
CosFace605,58057.5 ± 1.7615.7 ± 1.68
ArcFace605,58258.3 ± 2.3215.1 ± 1.95
Table 4. Assessing diverse softmax losses based on an angular margin for subclass classification involving both benign and malignant data, considering four distinct classes. The superior outcomes are highlighted in bold.
MethodEmployed BreakHis DataPr (%)Re (%) F 1 -Score (%)Acc (%)
Benign subsetSoftmaxAll magnifications92.82 ± 1.1891.02 ± 0.8691.70 ± 0.7592.46 ± 0.61
A-SoftmaxAll magnifications92.78 ± 1.8792.26 ± 1.8392.44 ± 1.8592.90 ± 1.68
CosFaceAll magnifications93.01 ± 1.5692.99 ± 0.7292.93 ± 1.1193.55 ± 1.02
ArcFaceAll magnifications93.36 ± 1.1992.93 ± 1.8293.09 ± 1.4993.55 ± 1.33
Malignant subsetSoftmaxAll magnifications86.93 ± 1.7486.09 ± 3.0886.39 ± 2.2890.04 ± 1.51
A-SoftmaxAll magnifications87.83 ± 2.6884.41 ± 5.9285.89 ± 4.5390.06 ± 2.76
CosFaceAll magnifications89.41 ± 2.8286.72 ± 6.3087.73 ± 4.7291.29 ± 3.05
ArcFaceAll magnifications89.96 ± 2.3986.28 ± 4.3687.86 ± 3.6091.42 ± 2.37
Table 5. Comparison between the CosFace and ArcFace methods and state-of-the-art deep learning-based approaches on the BreakHis dataset. The superior results are highlighted in bold.
MethodAcc (%)Average
40×100×200×400×
Hybrid CNN improved by SEP block [27]85.6083.9084.4081.2083.78
DenseNet improved by SENet module [28]89.1085.0087.0084.5086.40
FCN combined with BiLSTM network [29]95.6993.6096.3094.2992.47
VGG16 feature extractor with SVM and RF classification [30]94.1195.1097.0094.9695.30
Data augmentation by DCGAN for VGG16 training [31]96.4094.0095.5093.0094.73
Xception feature extractor with SVM classification [32]96.2596.2595.7494.1195.59
Inception-ResNet-v2 combined with CatBoost, XGBoost, and LightGBM [33]96.8295.8497.0196.1596.45
Multi-scale dual residual recurrent network [34]97.1295.2096.8097.8196.73
BreastNet architecture supervised by CosFace97.4496.7397.4296.3796.99
BreastNet architecture supervised by ArcFace97.3497.3698.0195.1696.97
Disclaimer/Publisher’s Note: The statements, opinions and data contained in all publications are solely those of the individual author(s) and contributor(s) and not of MDPI and/or the editor(s). MDPI and/or the editor(s) disclaim responsibility for any injury to people or property resulting from any ideas, methods, instructions or products referred to in the content.

