1. Introduction
Reconfigurable intelligent surfaces (RISs), consisting of elementary units called meta-atoms, can control wireless propagation, enhance link capacity, increase physical layer security, and extend network coverage by manipulating the phase and amplitude of reflected or refracted electromagnetic waves [
1]. The emergence of RISs has changed the inherent paradigm of wireless communication system design, from passively adapting to the wireless environment to actively reshaping the electromagnetic environment [
2]. RIS-assisted communications provide network planning engineers with new system design freedom, becoming one of the potential key technologies for sixth generation (6G) wireless mobile networks. At present, both academia and industry are striving to explore and evaluate the performance of RIS-assisted wireless communication networks by means of path loss models [
3] and experimental measurements [
4] of RIS-assisted links.
The RISs with controllable beams [
5], low energy consumption [
6], and flexible deployment [
7] are regarded as a perfect patch for the blocking-sensitive millimeter wave networks. RIS-assisted millimeter wave networks are expected to provide mobile users with extremely high-speed, wide-area coverage, and high-quality communication services. In fact, RISs are suitable for various indoor and outdoor environments [
8,
9,
10]. Ref. [
8] established for the first time a universal indoor and outdoor channel model for RIS-assisted millimeter wave systems in the propagation environment with multiple random diffraction and scatterers. The model considers many physical characteristics and device characteristics, such as line-of-sight (LOS) probability, time delays, shadowing effects, actual gain of the RIS elements, and array response. The RIS channel simulator software package of [
8] can be effectively applied to system-level simulations to evaluate the capacity, spectral efficiency, coverage performance and transmission rate of RIS-assisted systems by providing channel coefficients and electromagnetic environment parameters separately. It is well known that human activities have a significant impact on indoor signal coverage. The authors of [
9] comprehensively considered the occlusion effect of the human body and the probability distribution of the human position, and proposed an indoor RIS deployment strategy based on the human movement model. Furthermore, the proposed algorithm that minimizes the outage probability based on room geometry can calculate the corresponding RIS locations for single RIS deployments and multiple RISs collaborative deployments. The simulation results presented show that properly deployed RISs can significantly reduce the indoor millimeter wave communication outage probability. Given that both RISs and ultra-dense micro base stations (BSs) are used to enhance indoor millimeter wave wireless coverage quality, the authors of [
10] explored which deployment option is more cost-effective. Through the joint analysis of coverage performance and deployment costs in a common indoor environment, the authors concluded that both pure active deployment and active-passive hybrid deployment can achieve the same network coverage. However, in order to meet coverage requirements with the lowest network cost, deploying an appropriate number of BSs is indispensable for RIS-assisted communication networks.
This paper mainly focuses on outdoor scenarios such as urban areas. Some outstanding researchers have studied the performance analysis of RIS-assisted outdoor millimeter wave networks, and this paper is an extension of their research results.
For blocking scenarios, i.e., assuming all direct links between BSs and users are non-line-of-sight (NLOS), Ref. [
11] fully demonstrated the impacts of the RIS density on the area spectral efficiency improvement based on the conventional path loss model. The research results confirm that compared with traditional active networks, RIS-assisted networks effectively improve area spectral efficiency and achieve higher energy efficiency. In addition, the economic and maintenance costs of network deployment need to be considered in actual engineering applications, which results in the total density of network equipments being constrained. At this time, a compromise is required between the densities of RISs and BSs. However, the authors of [
12] did not consider NLOS direct links, used random shape theory to model obstacles such as buildings, and derived the probability of the existence of LOS direct links. Then, the deployment strategies of RISs in different scenarios were studied. Research results show that for scenarios with dense obstacles, such as urban areas, deploying more small-scale RISs is a better choice to improve coverage, while large-scale RISs are more suitable for scenarios with sparse obstacles, such as rural areas. This paper considers a more realistic case where both LOS and NLOS coexist, adopting the LOS ball model in [
13], and utilizes the path loss model for RIS-assisted transmission measured in [
4].
Based on the analysis of signal-to-interference ratio (SIR), Ref. [
14] verified the effectiveness of deploying RISs to improve the SIR coverage of millimeter wave networks from both theoretical analysis and simulation experiments. However, given that millimeter wave networks are non-interference limited [
15], the impact of noise on system performance cannot be ignored. In addition, ref. [
14] only considers Rayleigh fading in order to simplify the analysis. Refs. [
11,
12] directly ignore the impact of small-scale fading. In order to improve the universality of the research, this paper adopts a more generalized Nakagami-
m fading.
Ref. [
16] focused on RIS-assisted non-orthogonal multiple access networks, modeled linear RISs as the user-centered Poisson cluster processes, and derived analytical expressions for coverage and ergodic rate. Simulation results reveal that as the linear RIS length increases, there is an upper limit to system performance. Ref. [
17] extended the carrier frequency in [
16] to the millimeter wave band, modeled network elements as independent homogeneous Poisson point processes (HPPPs), and adopted an association criterion based on the maximum average received power. Furthermore, a statistical analysis of the distribution of signal-to-interference-plus-noise ratio (SINR) is performed. Simulation results show that for linear RISs, there is an optimal length to maximize the network coverage probability. This paper extends the one-dimensional linear model of RISs in [
16,
17] to the actual two-dimensional plane model and optimizes the cell association rules.
It can be seen from the above that the research results of this paper are more universal because the path loss model, fading model and RIS model used are more consistent with the actual propagation environment. This paper provides a set of theoretical analysis results for coverage analysis of the RIS-assisted millimeter wave networks based on the stochastic geometric theory. The main contributions are summarized as follows:
Cell association strategies directly affect user service quality. Different from the traditional one-step association strategies such as maximum average received power and nearest neighbor, we propose a two-step cell association criterion, where the first step is based on the minimum distance and the second step is based on the maximum average received power, which is equivalent to the minimum path loss.
With the help of void probability, Slivnyak-Mecke theorem and probability generating functional in stochastic geometric theory, the tractable analytical expressions of user association probability and coverage probability for the general scenario are derived. Additionally, the asymptotic expression and closed-form upper bound of coverage probability are given for the ultra-dense and high-blocking scenarios, respectively.
In fact, our paper provides a general numerical method for evaluating the coverage performance of RIS-assisted millimeter wave networks. Specifically, by substituting system parameters such as network element density and channel parameters into the formulas, we can directly obtain the value of the coverage probability without performing the system-level simulations such as Monte Carlo.
The remainder of this paper is organized as follows. The RIS-assisted millimeter wave system model is described in
Section 2. In
Section 3, the two-step cell association criterion is proposed. The analytical expressions of the coverage probability are provided in
Section 4. Numerical and simulation results are presented in
Section 5. Finally,
Section 6 concludes this paper.
2. System Model
Consider a RIS-assisted millimeter wave network in which the distributions of BSs, RISs, and users are modeled as three independent HPPPs
,
, and
with densities
,
, and
, respectively. The BS with no user connection is in idle mode, and otherwise in active mode [
18]. The active BS distribution is also a HPPP
, whose density is expressed as:
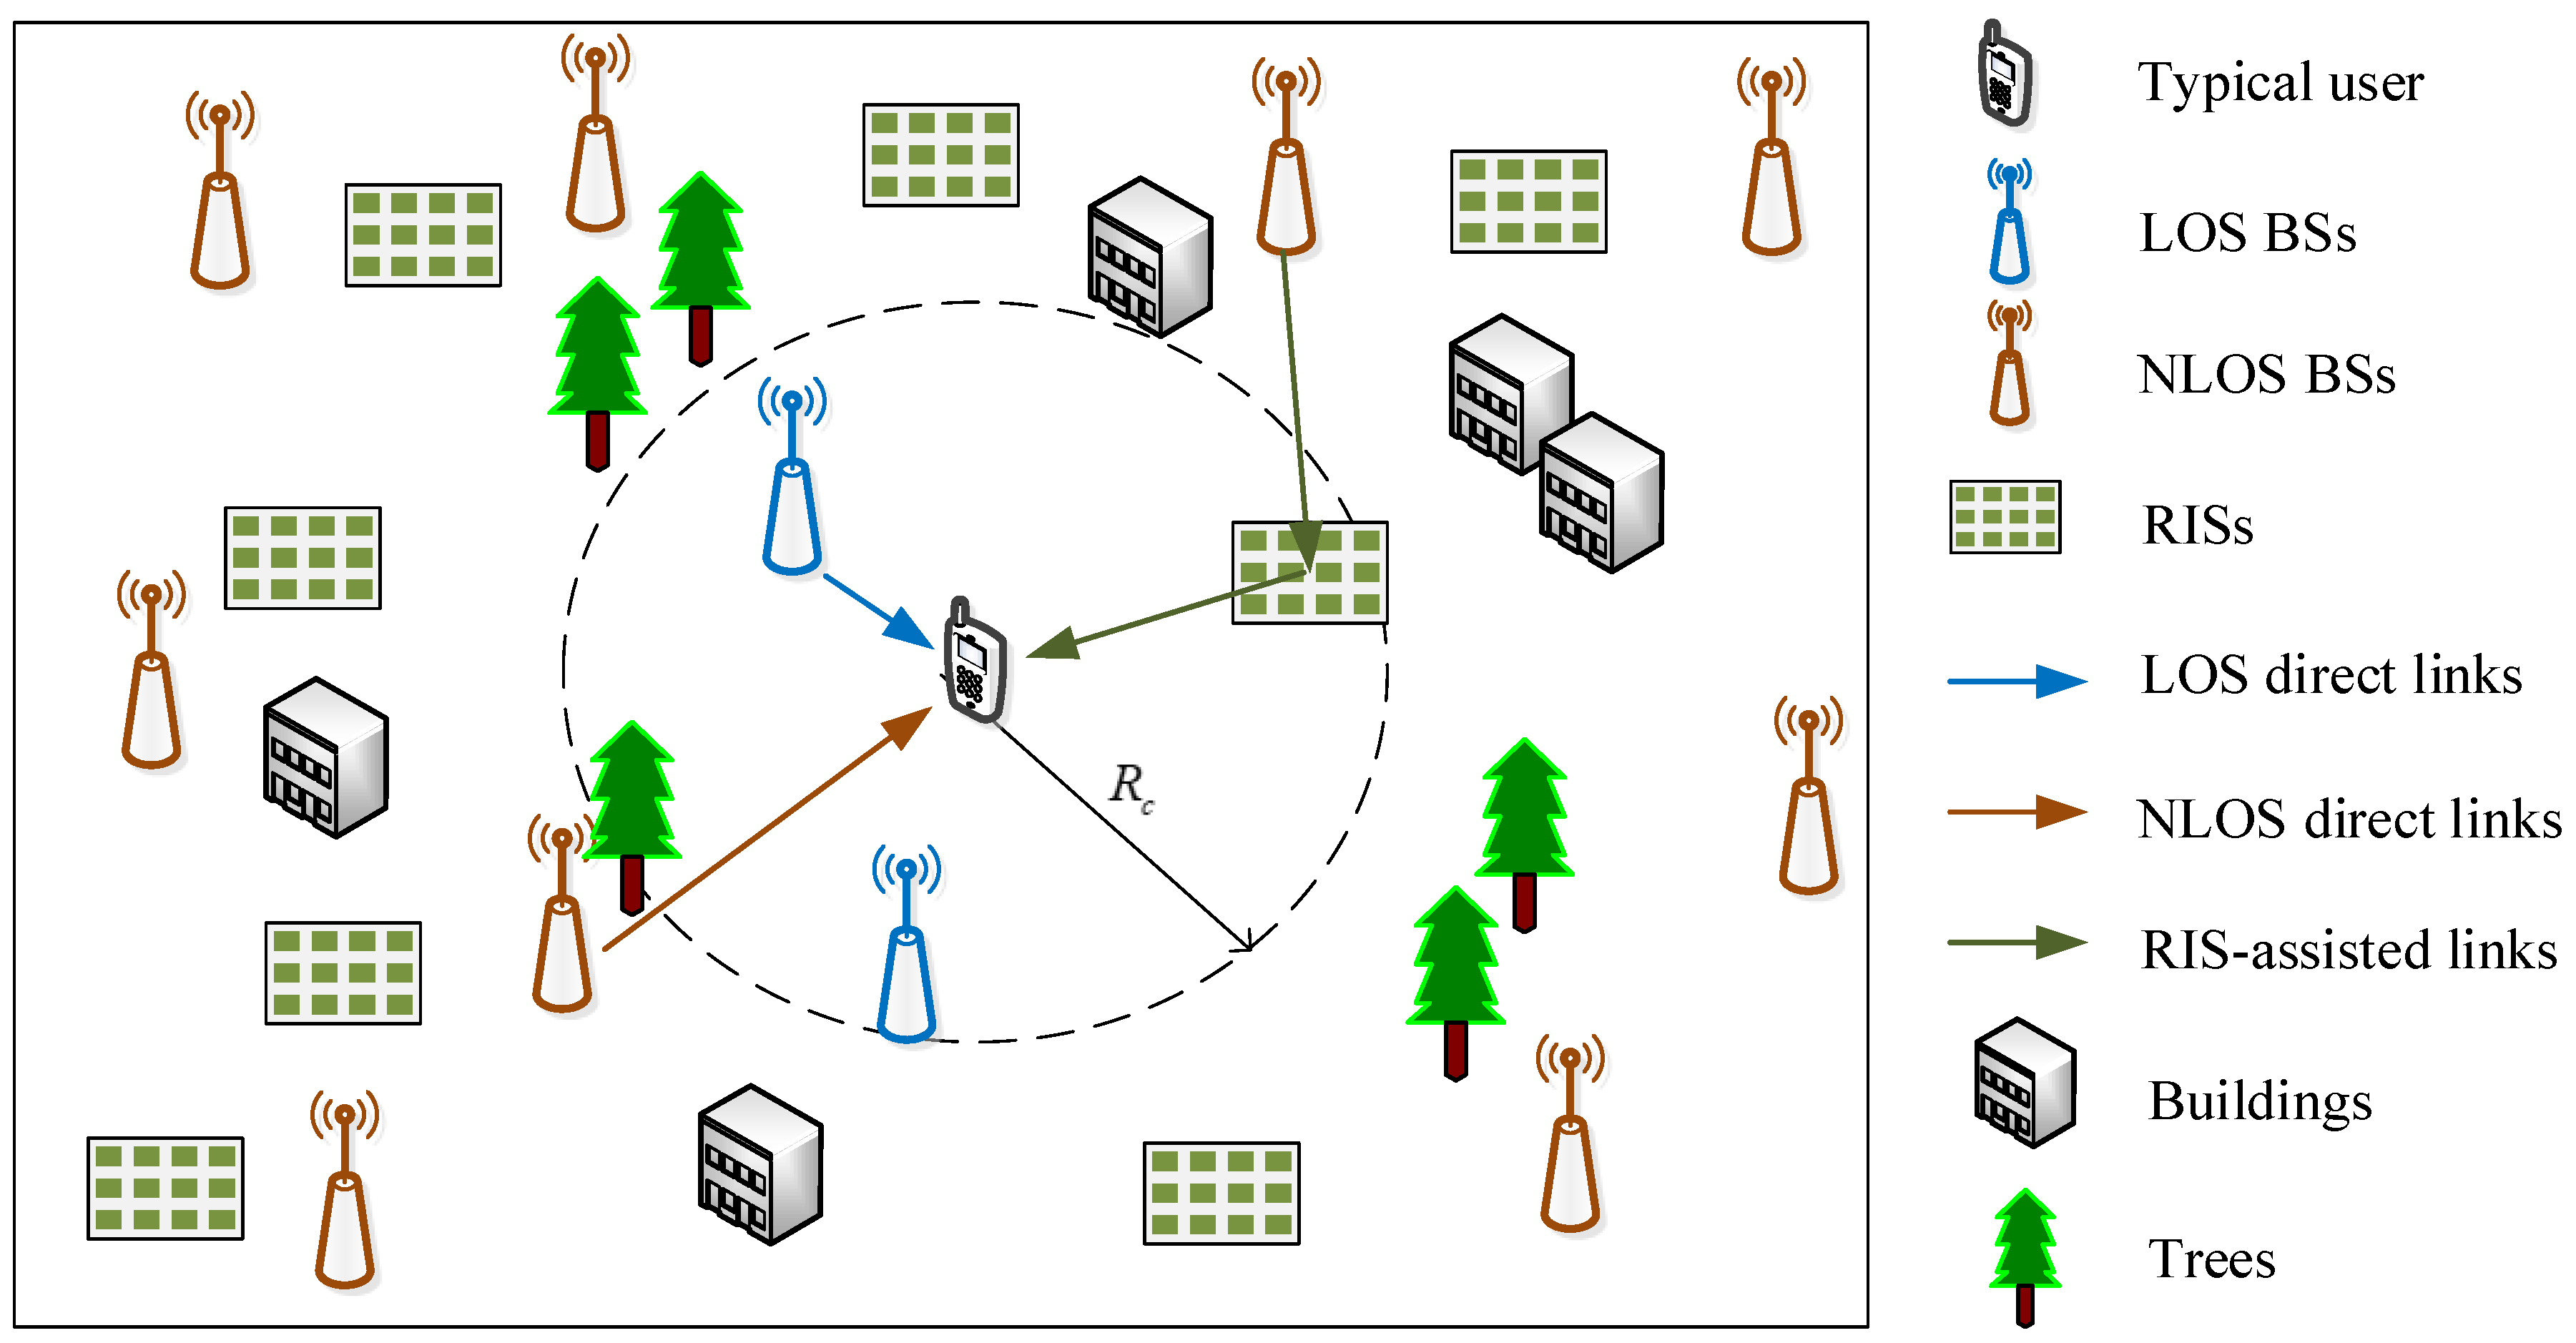
Assume a typical user under consideration is located at the origin. The typical user can receive signals directly from the BS or the RIS reflection; the former is called a direct link and the latter is called an RIS-assisted link. The communication links for the RIS-assisted millimeter wave network are shown in
Figure 1. The LOS ball model suitable for dense network scenarios is adopted to distinguish whether the direct link is LOS or NLOS, then the path loss of the direct link can be expressed as:
where
is the intercept factor,
is the wavelength,
is the indicator function,
x is the distance between the typical user and the BS,
and
are the LOS and NLOS path loss exponents, respectively, and
is the radius of LOS ball. Assume the typical user and the BS are both in the far field of the RIS, then the path loss of the RIS-assisted link is in the form of “distance products”, denoted as:
where
is the path loss intercept factor of RIS-assisted links [
4],
S is the RIS area,
y is the distance between the RIS and the BS,
z is the distance between the typical user and the RIS, and
is the path loss exponent of RIS-assisted links. It is generally assumed that
, where
[
19]. Since the signal propagation of LOS direct links and RIS-assisted links contains direct components, it is more universal to assume that they experience Nakagami-
m fading. NLOS direct links are assumed to experience Rayleigh fading.
The transmit power of BSs is
. Antenna arrays at BSs perform directional beamforming. For tractability of analysis, the power pattern of antenna arrays is modeled as a simple sector model [
13], in which the power gain of the main lobe with beamwidth
is a constant
M and the power gain of the side lobe with beamwidth
is a constant
m. All users are equipped with omnidirectional single antenna. The serving BS adjusts the radiation direction to make the serving link obtains the maximum array gain
M. The array gain of the
j-th interfering link can be denoted as a discrete random variable
, whose value is
M with probability
and
m with probability
.
3. Cell Association
Cell association criterion often directly affect network performance indicators such as user fairness, coverage, and transmission rate. In traditional active wireless networks, commonly used association strategies include nearest neighbor, maximum average received power, and maximum instantaneous SINR. Based on the above one-step association methods, we design a two-step cell association criterion for the RIS-assisted millimeter wave network, which is an active/passive hybrid wireless network. Specifically:
First step: If the typical user can observe at least one LOS BS, connect to the nearest one.
Second step: If there is no LOS BS observed, the typical user accesses the link with the smallest path loss, i.e., the typical user connects to the nearest NLOS BS or RIS, which reflects signals from the nearest BS.
Obviously, the derivation of user association probability is based on the statistical analysis of the nearest distance. The probability density functions (PDFs) of the distances from the typical user to its nearest NLOS BS and LOS BS are denoted as follows:
The equivalent distance from the typical user to the nearest BS of the RIS-assisted link is defined as
, where
is the distance from the assist RIS to its nearest BS and
is the distance from the typical user to its nearest RIS. The PDFs of
and
are
and
, respectively. The PDF of
is given by:
where
is the modified Bessel function of the third kind [
20].
Next, the user association probability based on the two-step cell association criterion is given by Lemma 1.
Lemma 1. The probability of the typical user associated with a LOS BS in the direct link is as follows:The probability of the typical user associated with a NLOS BS in the direct link is:where with function . The probability of the typical user connects to a RIS in the RIS-assisted link is . Proof. According to the void probability of HPPPs, (
7) can be obtained. The proof of (
8) is similar to Lemma 2 in [
13], which is omitted here. □
For the case of no LOS direct links, i.e.,
, (
8) can be written in the following closed form when
:
where
.
Furthermore, the distribution of the distance from the typical user to its serving BS is given by Lemma 2.
Lemma 2. Conditioning on that the typical user associated with a LOS BS in the direct link, the PDF of the distance to the serving BS is:Given that the typical user connects to a NLOS BS, the PDF of the distance to the serving BS is:The PDF of the equivalent distance from the typical user to the serving BS in the RIS-assisted link is: Proof. It can be proved by a method similar to Lemma 1. It is omitted here for brevity. □
5. Simulation Results
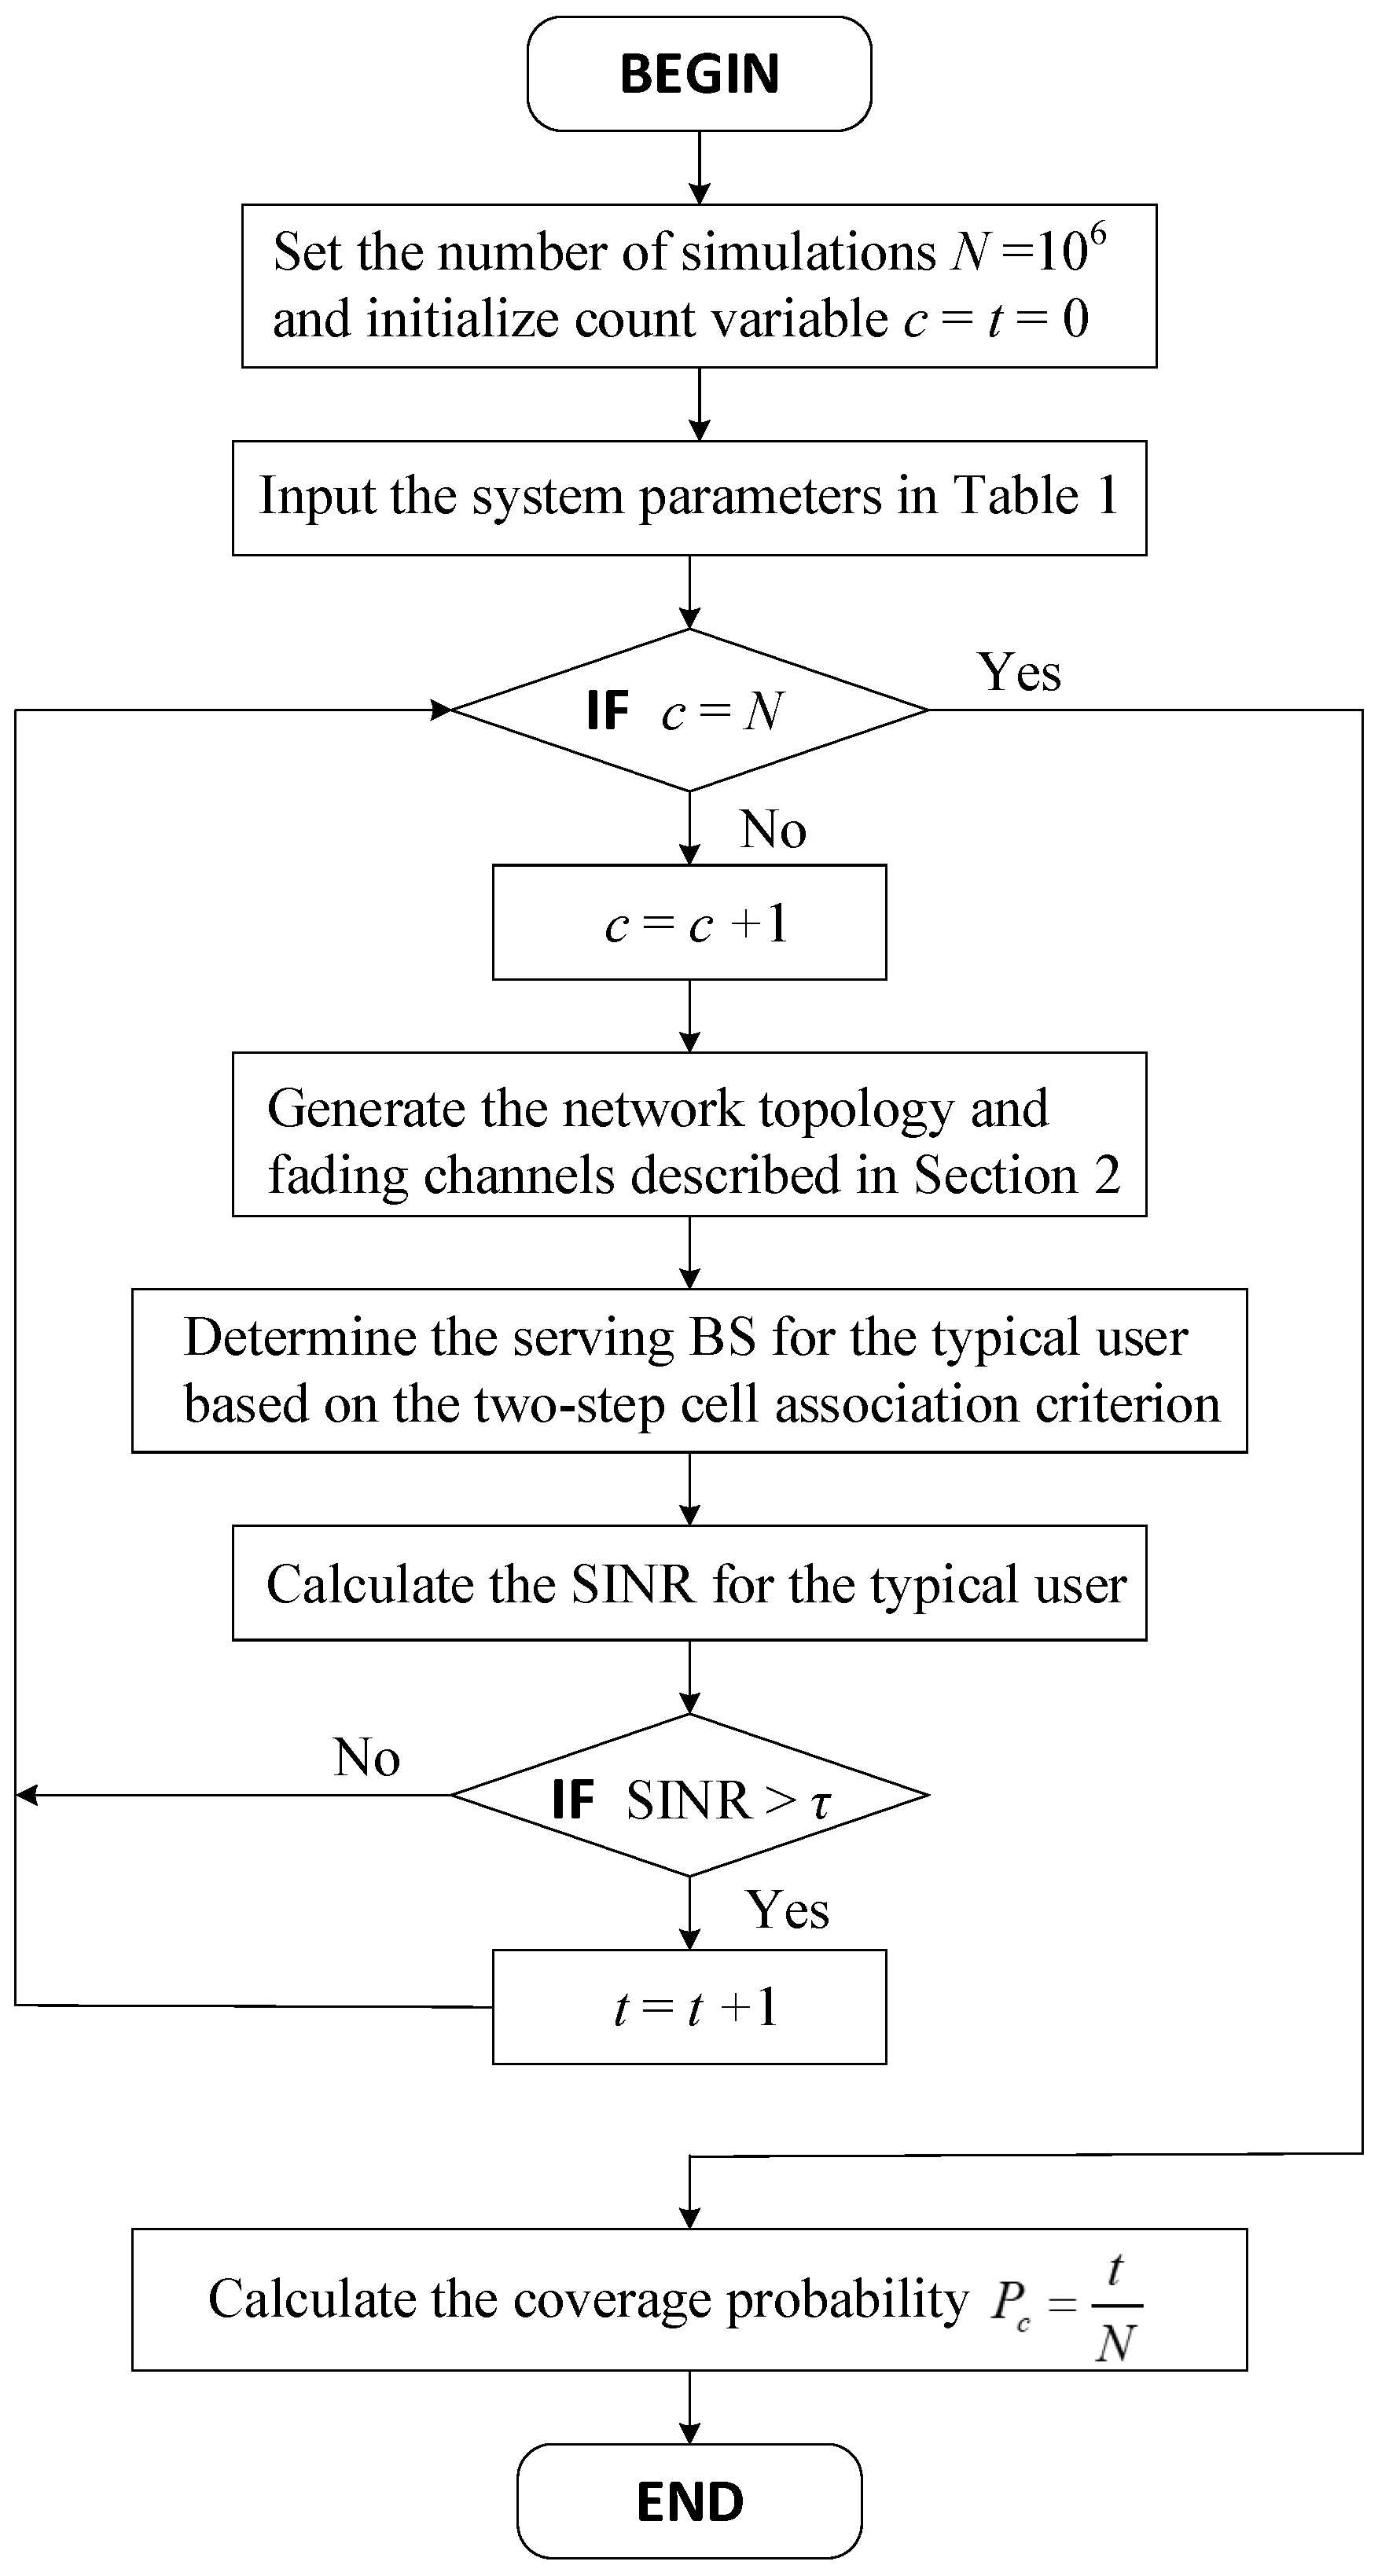
In this section, the proposed two-step cell association criterion, the analytical expression of coverage probability in general scenarios given by Theorem 1, and the closed-form expression of coverage probability in high-blocking scenarios given by Corollary 2 are verified by the Monte Carlo method where the main system parameters [
13] shown in
Table 1 are adopted if not mentioned otherwise and the RIS area
S in square meters is set as
. The number of simulations for each sampling point is
. For each simulation, the network topology is generated within a disk with a radius of 5 km according to the stochastic geometric model described in
Section 2, and the typical user is located in the center of the two dimensional region.
Figure 2 visually presents the process of the Monte Carlo method. In addition, the effects of different system parameters on network coverage performance are shown in
Figure 3,
Figure 4,
Figure 5,
Figure 6 and
Figure 7, where the theoretical values obtained by the formulas are labeled “Formula”, and the simulation results obtained by the Monte Carlo method are labeled “Simulation”.
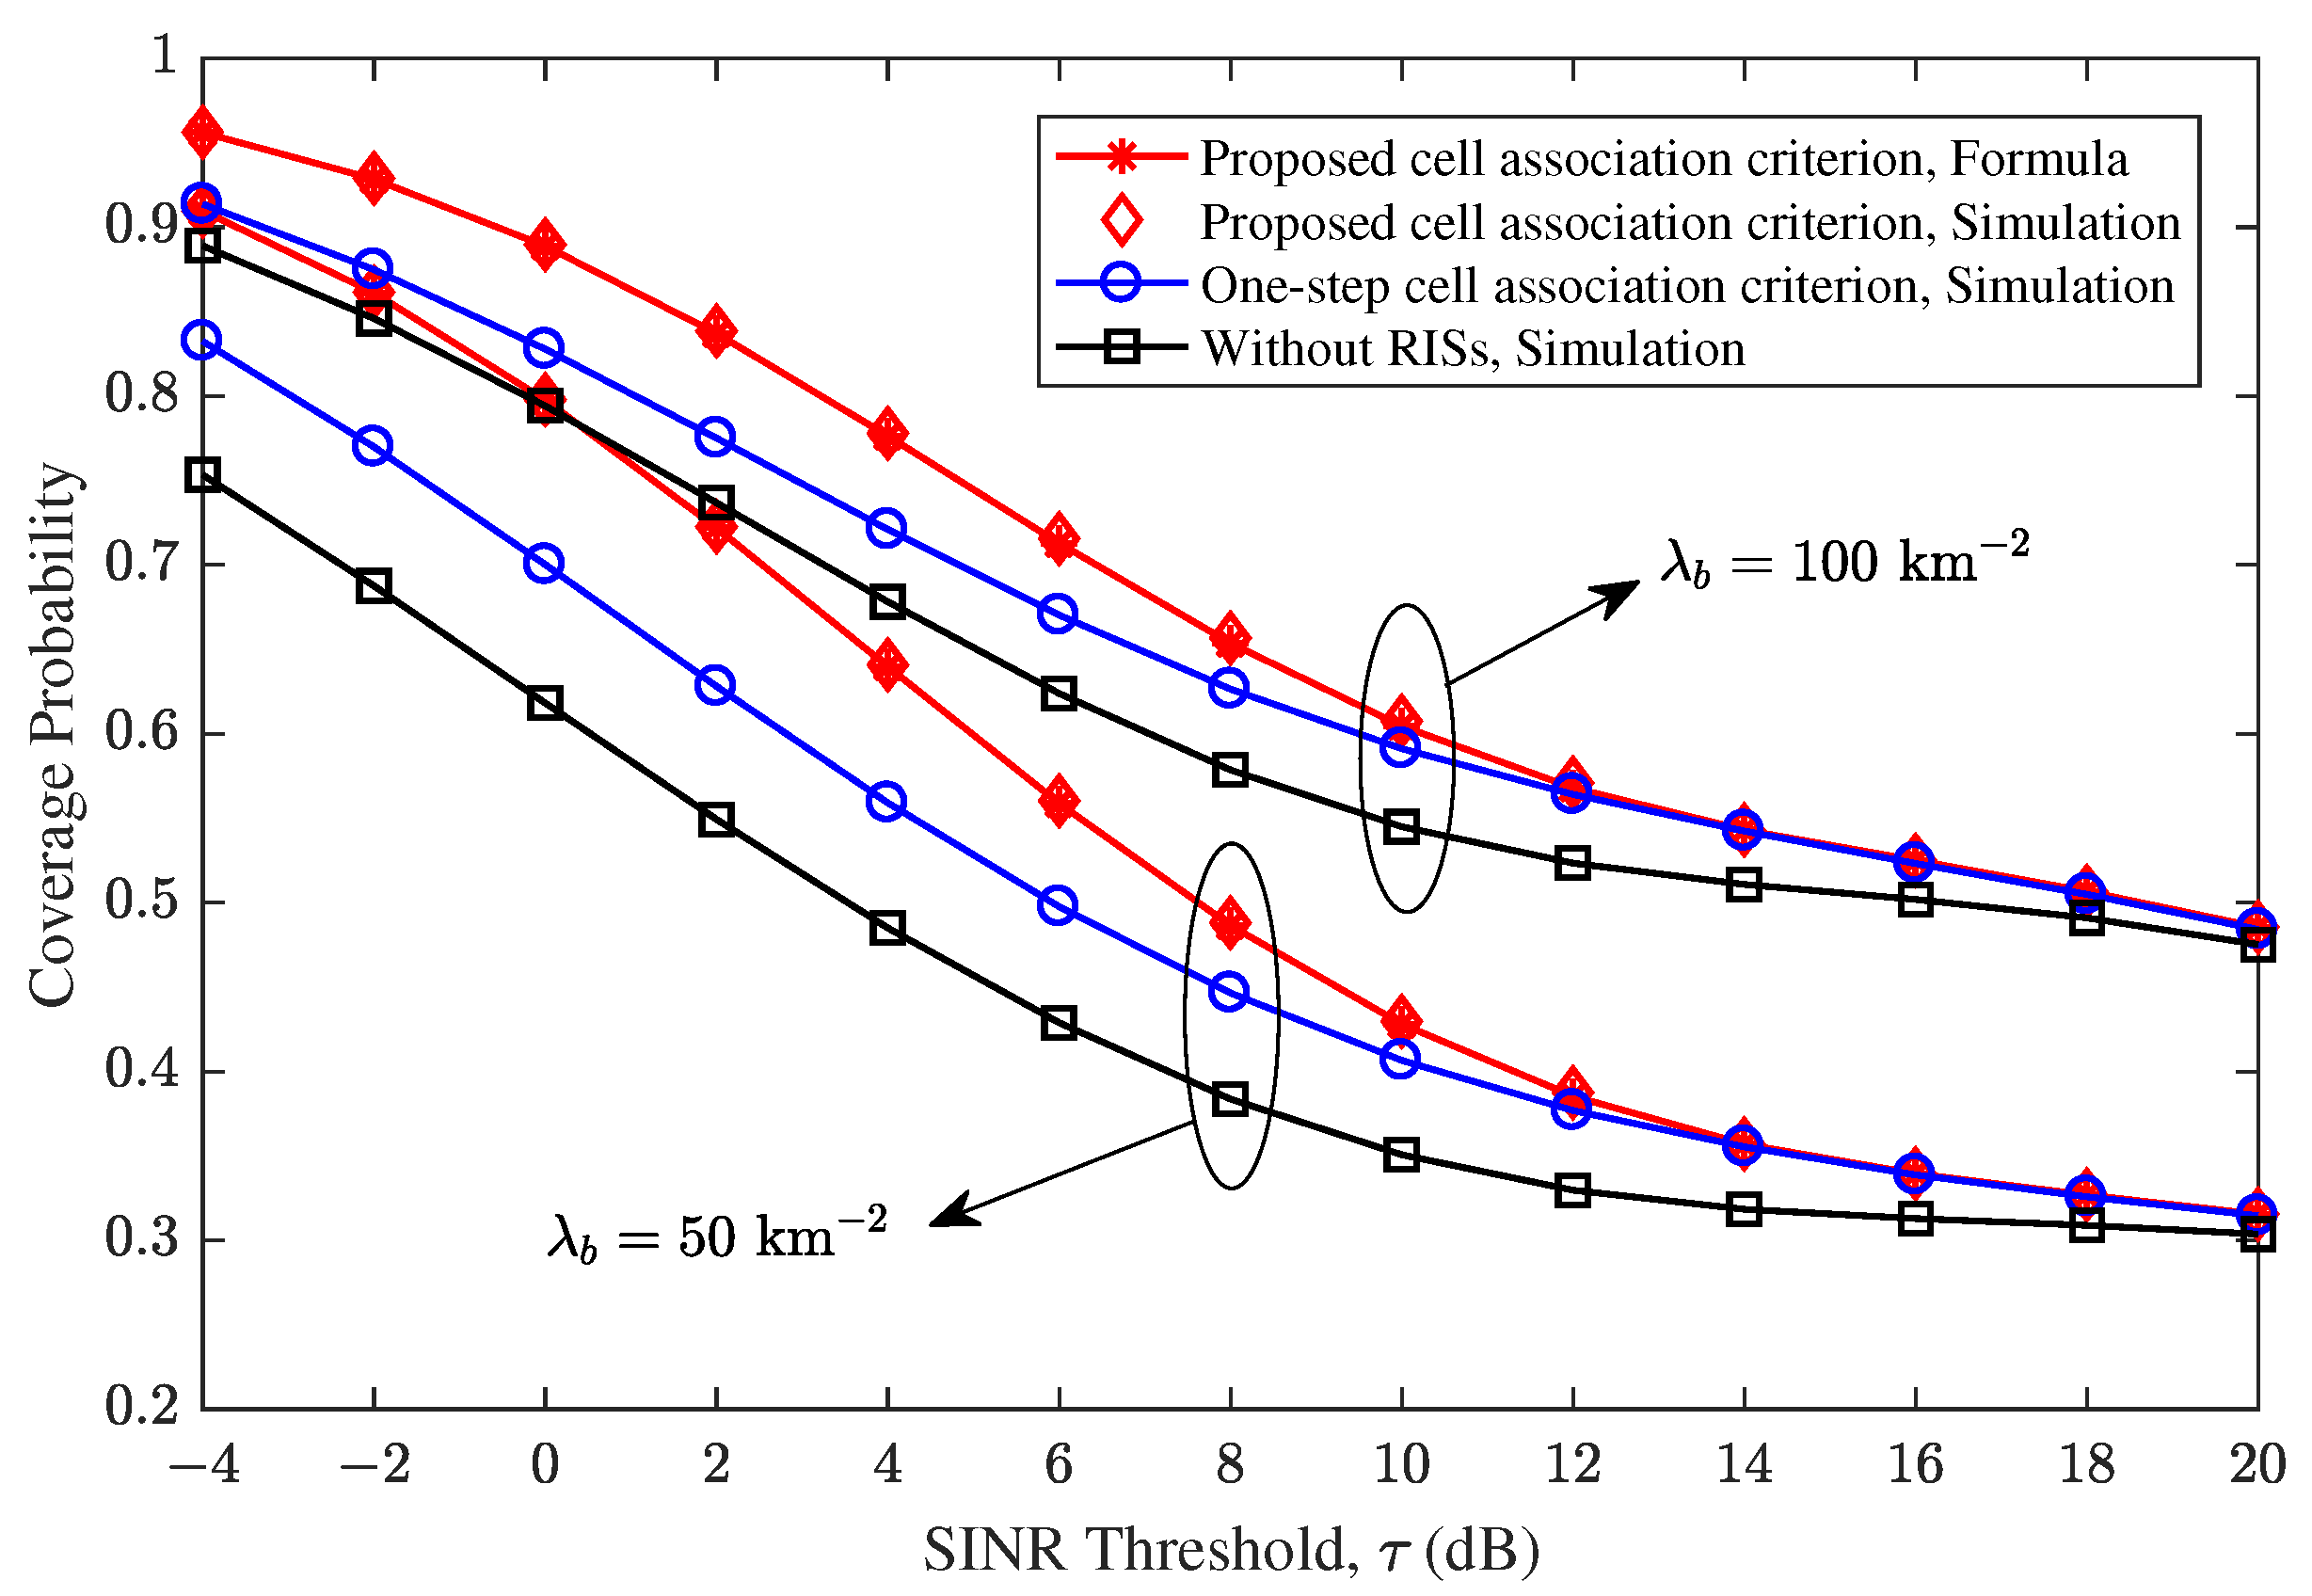
Figure 3 shows the coverage performance comparison of different cell association criteria and different network architectures. As it shows, when the SINR threshold is less than 12 dB, the two-step cell association criterion proposed in this paper achieves better coverage performance than the one-step cell association criterion in [
17]; when the SINR threshold is greater than 12 dB, the performance of the two is almost the same. In addition, it can be observed that deploying RISs in millimeter wave networks can effectively improve the coverage probability because the RIS-assisted links have better channel conditions than NLOS links. Moreover, the theory results are almost the same as the Monte Carlo simulation results, verifying the accuracy of the analytical expressions in Theorem 1. Furthermore, it can also be observed that the coverage performance of the network decreases as the SINR threshold increases, which is obvious because the coverage probability is essentially the complementary cumulative distribution function of the SINR threshold.
Figure 4 shows the effects of the RIS area on the coverage performance. Note that according to the assumption of “far field” in
Section 2, the RIS area needs to satisfy
[
4]. We can find the network coverage probability increases with the increase of RIS area due to the contribution of NLOS direct link and RIS-assisted link coverage performance improvement. However, there is no change in the coverage probability of LOS direct links for increasing the RIS area, since
is independent of
S according to (
17). Although using larger-area RISs can effectively improve network coverage, communication operators need to make a compromise between network performance and equipment cost during actual deployment. Ref. [
2] conducts an in-depth study on the total deployment cost of active and passive hybrid networks under the premise of meeting performance requirements. Additionally,
Figure 4 also reveals that the direct LOS links have extremely high coverage performance, which implies that stable transmission can be provided to users. This is because the LOS service BS is usually close to the user, resulting in relatively small signal loss.
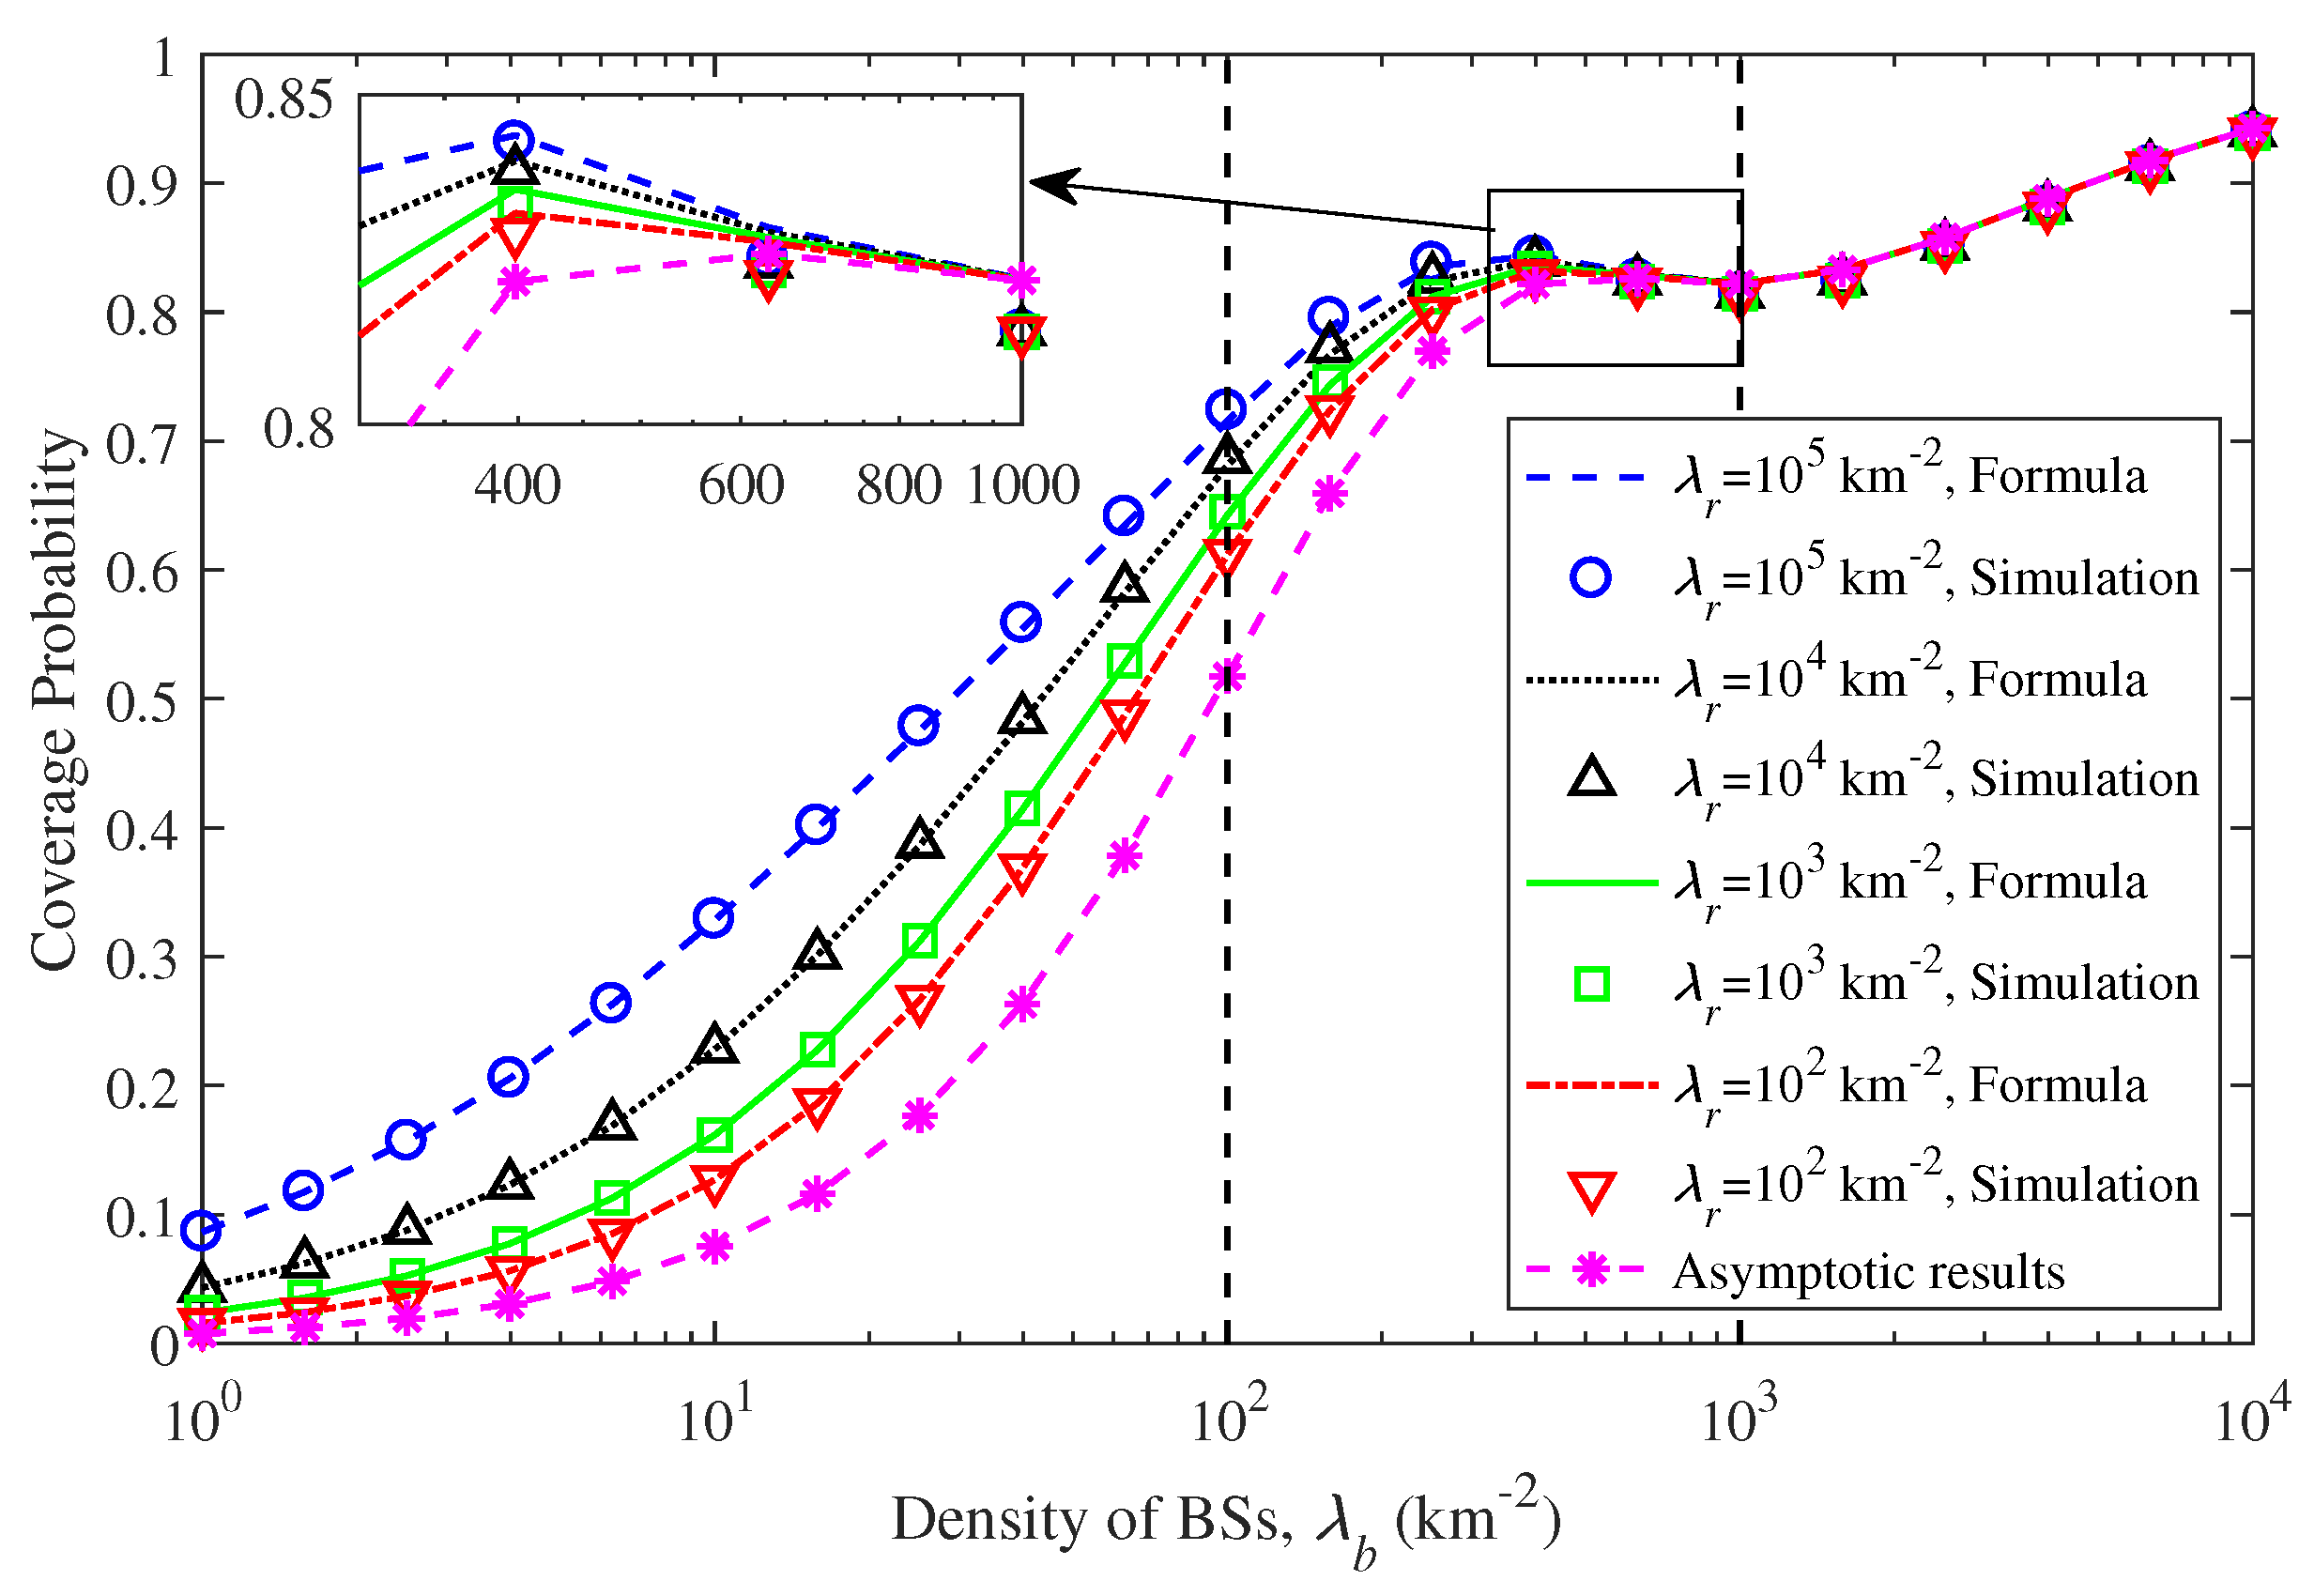
A more complicated trend for the coverage performance is revealed in
Figure 5. When the millimeter wave network is sparse, e.g.,
, the coverage probability quickly increases with
, because the more BSs are deployed, the greater the probability of users accessing the LOS direct link. As for the dense scenario, e.g.,
, the coverage probability suffers rather slow growth and even decline in a certain BS density interval due to stronger interference experienced by users connected to the LOS direct link. When the network is ultra-dense, e.g.,
, the coverage probability is independent of the RIS density, and increases gradually with the increase of the BS density. In this scenario, the users are almost only associated with the LOS BSs, so the denser the BSs, the closer the users are to the serving BSs. Furthermore, the asymptotic results in Corollary 1 are the same as the theoretical results in Theorem 1, verifying the validity of the asymptotic expression for ultra-dense scenarios.
Figure 6 and
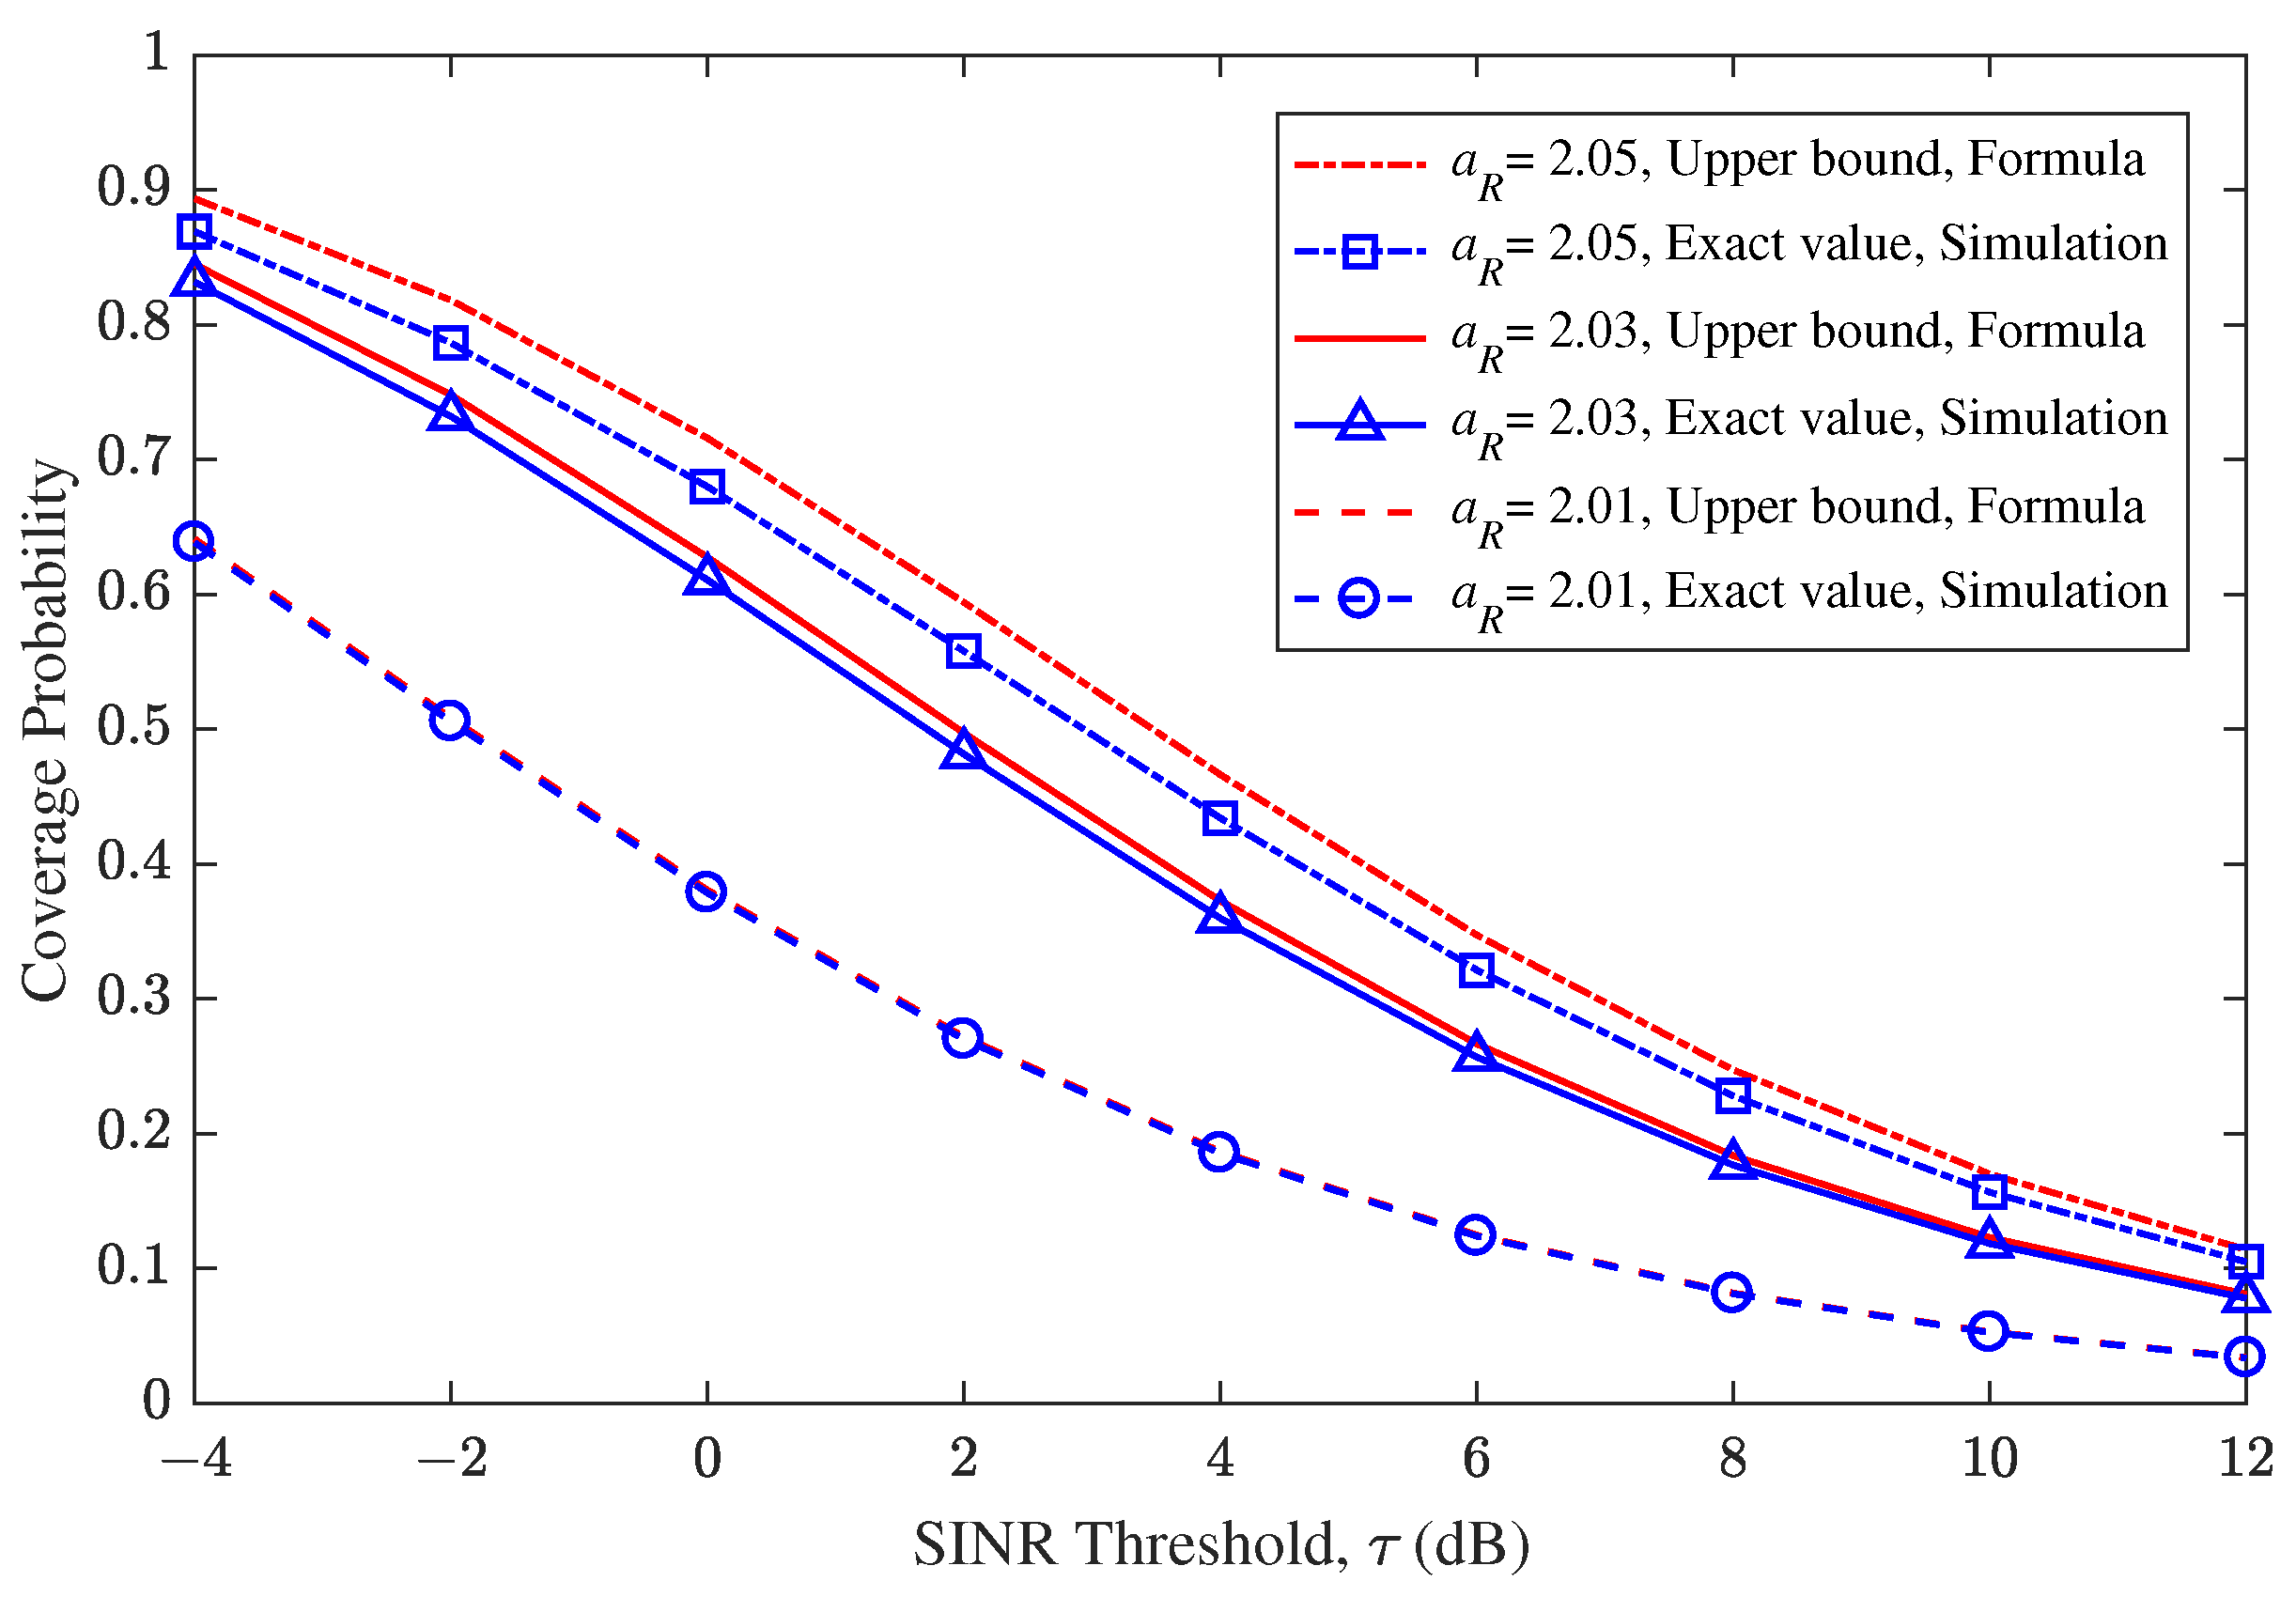
Figure 7 focus on high-blocking cases. As shown in
Figure 6, the gap between the upper bound and the exact result gradually decreases as
tends to 2, which verifies the validity and applicability of the closed-form expression in Corollary 2. It can be seen from
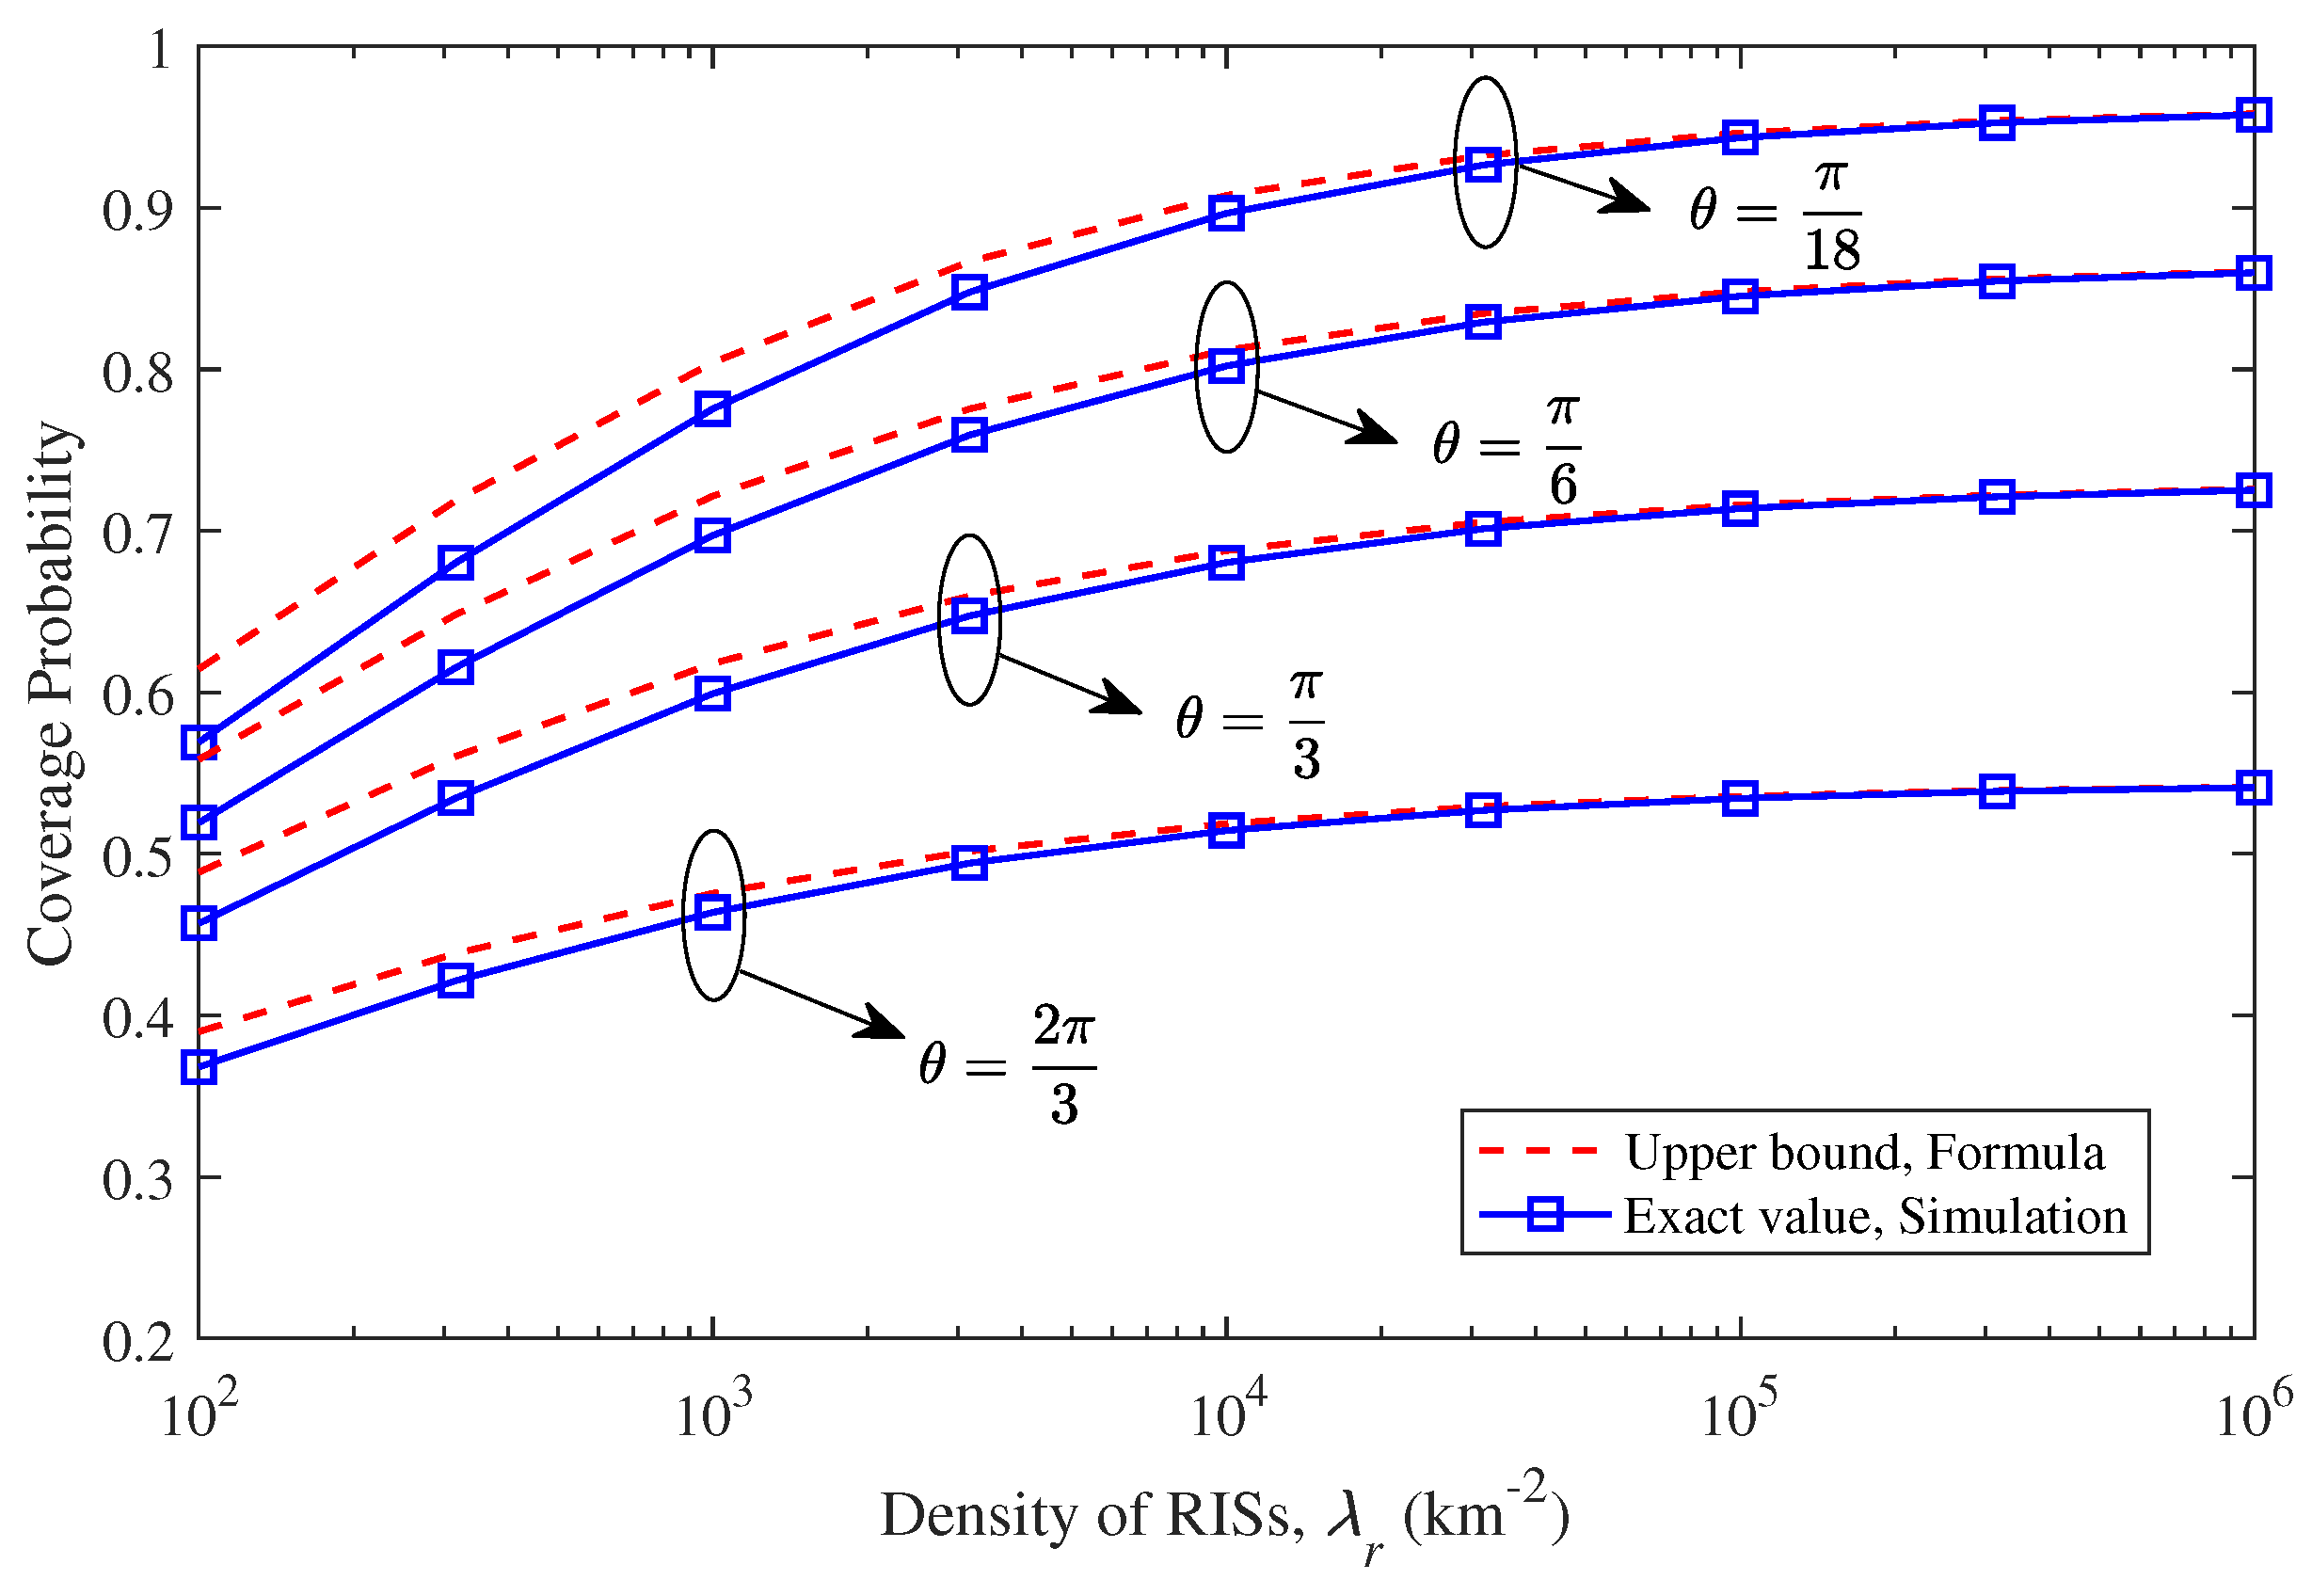
Figure 7 that narrowing the beamwidth of antennas effectively improve the coverage performance, because the narrower main lobe can reduce the interference from other BSs. Although the dense deployment of RISs also contributes to increasing the coverage probability, the efficiency of performance improvement is not high, and there is a coverage performance ceiling. Furthermore, as the RIS density increases, the gap between the upper bound and the exact value gradually decreases.


