1. Introduction
According to Eurostat, in 2020 in the EU, more than 20% of all fatal work accidents happened in the construction sector [
1]. One-third of them were attributed to falls, slips, and stumbles [
2]. Moreover, nearly 70,000 accidents caused by slipping, stumbling, and falling were reported in the year 2020 alone, each causing an absence from work of four days or more [
2].
The affected individuals may face a challenging recovery period and potential job loss or reduced earning capacity. What is more, the consequences extend beyond the individual, impacting the worker’s family and leading to emotional distress and financial instability. Fall accidents not only present a risk to the physical health of workers, but also carry profound legal and financial implications for companies, including elevated insurance premiums and workers’ compensation claims [
3]. Therefore, preventing and minimizing the consequences of work-related accidents on construction sites remains a topic of utmost importance. In terms of reacting to fall accidents, detecting them in real time allows faster identification of the injured worker and helps in performing the rescue operations more effectively [
4].
The structure of this paper is as follows: The rest of this section covers the use case, the technological context, and the task definition. A review of the related literature is presented in
Section 2. Then, the procedure and the technical means for collecting the custom dataset for the use case are detailed in
Section 3.
Section 4 summarizes the collected data and the applied pre-processing steps. An analysis of the data is given in
Section 5.
Section 6 presents the method used in this research, focusing on the deep learning algorithm utilized and the tuning of the input data and model architecture. A detailed evaluation of the model’s performance is presented in
Section 7. A discussion on the significance of the results achieved is provided in
Section 8.
Section 9 presents the concluding remarks and outlines future work directions.
1.1. Use Case Description
Due to the hazardous work environment on construction sites [
5], risk prevention measures in the construction industry, as defined by the EU, include technical, organizational, and behavioral, with overall compliance of the work environment with the established safety standards [
6]. This necessitates, among other things, the deployment of collective safety measures, such as guardrails, safety nets, and safety scaffolding. Nevertheless, if the risk of falling from a height cannot be eliminated or sufficiently reduced with these collective measures, it becomes the employer’s duty to equip the workers with personal protective equipment (PPE) [
7]. However, even if a fall occurs while wearing PPE, delays in rescue can exacerbate injuries, especially for workers performing tasks in remote locations.
According to the insights provided by Mostostal Warszawa, an industry partner in the ASSIST-IoT project [
8], the time of reaction to accidents can be prolonged by multiple factors, further highlighting the necessity for automation of incident reporting. Here, for instance, due to communication challenges, it is often necessary to engage multiple people before reaching the occupational health and safety (OSH) manager. Independently, language barriers among construction workers and the dynamic work environment of a construction site can lead to an inability to precisely define the location of an accident. As a consequence, this can lead to difficulties in locating the injured person. Moreover, the large number of frequently changing subcontractors at a construction site can make it harder to identify the workers involved in an accident. Moreover, even the most extensive of the common health and safety practices do not provide real-time information about accidents on construction sites. At the same time, due to injuries, loss of consciousness, or being arrested by protective equipment, workers who experienced a fall-related accident may not be able to call for help on their own.
Therefore, the goal of this work is to facilitate the fast, automated identification of fall accidents, to ensure immediate help is given to a potentially injured worker. To achieve the desired capabilities of the fall detection system, both the Internet of Things (IoT) and artificial intelligence (AI) should be employed. An IoT system paired with an adequate AI solution provide many opportunities for automatization, optimization, and remote monitoring of processes and environmental conditions in large areas, such as construction sites [
9]. In this context, studies have shown the willingness of construction workers to adopt wearable IoT technologies that aim at improving their safety and well-being, while expecting proper regulation concerning data privacy [
10].
However, introducing new technologies, such as IoT, AI, and edge-cloud computing to the construction industry imposes a number of challenges [
11]. One of them is the high requirements for computing power [
12]. In the considered scenario, IoT devices must exhibit extraordinary durability, while also being weatherproof and adaptable to different light conditions, both indoors and outdoors. It is also necessary to provide an accurate worker location in 3D. Meanwhile, real-time mapping and positioning were named among the current challenges for full-scale construction site implementation [
13]. Another requirement is related to the usability of the wearable devices (e.g. size, weight) [
14]. They must not hinder the workers’ movement or impede their ability to execute tasks effectively. Among other concerns are data privacy and security, together with implementation costs [
12,
13,
14], network connectivity issues on construction sites [
12], and a lack of standards and reference architectures [
12].
1.2. Technological Context
The presented use case deals with the challenging environment of a construction site, with harsh environmental conditions and other specific requirements. However, advances in mobile communications (5G, 6G), tactile Internet, distributed artificial intelligence, and miniaturization of computing have started to address these connectivity, privacy, accuracy, and usability issues. Moreover, they are elevating the IoT to a new dimension—the, so-called, Next Generation Internet of Things (NGIoT [
15]). Leveraging the NGIoT in a construction site could facilitate accurate positioning, efficient AI/ML application, better resiliency of deployment, communications infrastructure independence, controlled processing of data from workers’ wearable devices, advanced role-based access control, and dynamic reports with on-the-field information updated in real time [
16].
Here, applications that embrace the concept of tactile Internet are especially interesting [
17], as they promise “tactile-like” remote operation experiences in real infrastructures. This would be based on point-to-point communication with extremely low latency and high reliability, facilitating an immediate reaction to potentially hazardous events, with minimized reporting/alerting times.
However, applying the IoT, edge computing, advanced communications, and tactile Internet together is not trivial. A blueprint reference architecture is required to facilitate the adoption of NGIoT solutions across various industries, including construction sites. Such an architecture is proposed by the H2020-funded project ASSIST-IoT. The ASSIST-IoT reference architecture [
16] is based on a two-axis structure of software and hardware components and is rooted in the concept of an “enabler”, which can be of software or hardware nature. One such enabler is an IoT gateway with embedded functionalities (gateway edge node—GWEN). In terms of software, enablers constitute services that allow the vision of ASSIST-IoT to be put in place. In practice, they are containerized software, orchestrated in Kubernetes, and designed to deliver a specific NGIoT functionality.
The ASSIST-IoT architecture represents a modular, customizable, scalable, and flexible solution [
16], allowing implementing a system that addresses the requirements of the considered use case.
Figure 1 illustrates the application of specific enablers taken from the ASSIST-IoT project, in a real-time AI-driven fall detection use case.
The deployment starts with IoT devices in the form of location tags, worn by the workers. These tags measure the workers’ location and acceleration, and forward these data to the location tracking enabler, via ultra wideband (UWB) [
18]. The location tracking enabler is deployed on the ASSIST-IoT edge hardware (GWEN), which also hosts other enablers and custom components. The edge data broker enabler has a key role, acting as a broker for streaming communication. The information gathered from sensors is annotated semantically by the semantic annotator. This enables the workplace safety controller to “understand” the situation on the construction site in real time and to make appropriate decisions. It interprets the location and acceleration information, processes it, and triggers the necessary alerts and notifications. The federated learning (FL) [
19] local operations enabler is responsible for training/inferencing federated AI models that detect falls. Communication with the FL local operations is performed via low-latency gRPC (remote procedure calls) streams. If a fall is detected, the controller sends appropriate notifications back to the broker and logs the incident. The OSH manager can use the tactile dashboard to receive notifications and view the incident log. Access to the dashboard and the information is secured by ASSIST-IoT’s identity manager and authorization enablers. The presented deployment can be flexibly scaled to multiple edge nodes, to cover the entire construction site. The software components can be easily deployed on edge hardware (GWEN, local server) or in the cloud.
In summary, the system supports collecting real-time data from a number of wearable devices and processing it in the edge-cloud continuum, including inference of an AI fall detection model, logging identified fall accidents, and promptly notifying the OSH manager of the accident and its location, through a tactile dashboard.
1.3. Task Definition
Keeping in mind what has been presented thus far, it can be now stated that the specific objective of this contribution is to report on an attempt to create a reliable AI-driven fall detection solution. Such a solution must be able to accurately detect the relevant fall scenarios, be comfortable for workers to wear, and integrate easily with the rest of the instantiated IoT ecosystem.
From the perspective of worker health and safety, a fall detection system has to identify two main groups of falls. First, falls on the same level (from a standing position), which are usually due to a loss of grip between the shoe and the floor surface, tripping over obstacles, or uncontrolled movements. Second, falls from a height, usually from a roof or scaffold, where a fall arrest device can stop the worker’s fall, at least partially [
20].
However, routine work at the construction site may also generate acceleration levels close to the values observed during falls; for example, slipping or tripping incidents do not have to result in a fall. Misclassifying such activities as falls would result in a large number of false alerts. This could lead to disregarding the generated alerts and, as a result, missing an accident that actually requires quick first aid. To mitigate this issue, a comprehensive dataset of both falls and daily activities needs to be collected, aiming to cover real-life scenarios and accidents, contributing to the overall accuracy of the fall detection model.
To address the comfort concerns of the users and to reduce the possibility of sensor disturbance, the tag should be mounted close to the body’s center of gravity. Furthermore, the tag also includes an emergency button that helps the injured worker manually send a request for help. Thus, the tag needs to be easily reachable and, therefore, be placed in front of the person.
Another restriction comes from the available communication bandwidth of the wearable devices, limiting the amount of information that can be sent each second. To ensure a long battery life, communication must be relatively infrequent, while scalability concerns mean that the bandwidth has to be time-shared with other devices. Bearing in mind these restrictions, only about 10 B/s of acceleration data can be transmitted from each device, yielding a target frequency of 2 Hz (see
Section 4 for details). The model built also has to be reasonably lightweight, so that it can be run on edge devices effortlessly.
2. Related Works
The problem of fall detection has received close attention from the research community, with the number of articles on this subject steadily increasing over the last 15 years and surpassing 4000 articles in Google Scholar published by 2022 [
21]. During the years of studies, numerous approaches were proposed, datasets collected, and use cases examined. Therefore, the problem of fall detection can be viewed from multiple perspectives, depending on the target application, the hardware used, and the mathematical methods applied. Based on the taxonomies of fall detection systems [
21,
22], the solution proposed in this article belongs to the IoT-based single-sensor solution type, where only acceleration data are gathered using wearable sensors and further processed on an edge device. In the literature, accelerometers are the most popular type of sensor used to collect data for fall detection systems (27% of studies analyzed by Warrington et al. [
23] featured accelerometers as the only sensor, with 21% using accelerometers along with another sensor). Due to the use of micro-electromechanical system (MEMS) technology, accelerometers are compact and inexpensive. Therefore, together with other MEMS sensors they are widely present in consumer electronic devices and are used for tasks such as step counting and gesture recognition [
24]. Moreover, accelerometers’ presence in the vast majority of everyday-use devices reduces the need for introducing custom devices.
However, despite being featured in many research works, accelerometer-based systems still present a lot of variability in terms of the sensor placement and the frequency with which acceleration data are sampled (sample rate). It was found [
25] that, among open datasets, the range in sample rate was from 18 to 238 Hz. During a further evaluation, it was recommended to keep the sampling rate in the range between 20 Hz to 40–50 Hz, for better performance of the fall detection algorithm. As for the placement of the wearable devices, among wrist, head, ankle, waist, chest, and thigh, the waist was chosen as the recommended place for mounting the wearable device, due to its closeness to the body’s center of gravity [
25]. However, in this contribution, both sampling rate and sensor placement were dictated by the use case and hardware limitations. This produced a challenging scenario by reducing the sampling rate below the recommended values and moving the placement of the accelerometer to between the waist and high hips.
Based on the existing literature, from a model perspective, fall detection can be performed using (i) a threshold—by examining the collected dataset and determining the optimal threshold for a certain feature [
26], (ii) traditional machine learning methods (e.g., support vector machines [
27], decision-tree-based algorithms, Gaussian mixture models, logistic regression [
28]), or (iii) deep learning algorithms (e.g., convolutional neural networks, recurrent neural networks, long short-term memory (LSTM)). Thresholding and machine learning methods heavily rely on crafted features extracted from the data, while deep learning models can provide good performance while operating only on raw acceleration data and skipping the feature handcrafting step [
29].
Interestingly, thresholding methods were still being used in recent research [
30,
31,
32], even with the presence of available deep learning architectures. The reason for choosing thresholding methods is that a deep learning approach relies on the capacity of the resulting models, which can lead to an increase in the computational cost [
29], and this becomes a problem in cases where limited resources are available for the target wearable device. This results in a need to perform an additional task of model size and energy consumption optimization. Even so, solutions have been proposed using LSTM and gated recurrent unit [
33,
34] architectures for lightweight and fast fall predictions on embedded systems. Energy consumption tests have also been performed with low-performance embedded systems (STM32 32-bit microcontrollers) [
33] and the SensorTile sensorized development kit [
34], which serves as a platform for wearable smart sensors.
Fall detection in the construction environment was also explored in the research, utilizing machine learning algorithms and sensor data. A solution featuring an activity recognition (including falls) model based on an LSTM was proposed, to improve the safety of construction workers in IoT scenarios [
35]. In the presented case, acceleration data were collected from a multisensorial intelligent bracelet, equipped with a BMI160 inertial sensor featuring a 16-bit digital triaxial accelerometer and a gyroscope with a 50 Hz frequency. The data were collected on a collector node (Raspberry Pi 3B) and sent to a more powerful remote machine, where the data analysis was performed. Another research work focused on a slightly different task of detecting the near-miss falls of ironworkers on construction sites, therefore, not having actual falls within the scope of the study [
36]. The proposed solution used data from wearable inertial measurement units (accelerometer and gyroscope) and addressed the problem using a semi-supervised one-class support vector machine algorithm. Due to the lesser risk of the tested activities, this study was able to collect data from both laboratory and outdoor environments and use it for training and evaluation. By conducting two different experiments (in a laboratory and in an outdoor setting), the authors showed that a similar near-miss fall detection accuracy was achieved, regardless of the experimental environment, emphasizing the applicability of their solution to the construction site environment.
While being a popular research problem, to the best of our knowledge, most fall detection studies have been conducted for the fall detection of elderly people, motivated by the problem of the aging population [
37]. However, this scenario results in complications during the data collection stage, as elderly people are more prone to injuries, limiting the type of activities that can be safely performed, registered, and represented in the dataset. Moreover, while efforts have been made to combine elderly participants with younger people to collect more data, it was observed that sensor-based data (namely, body acceleration) were different in these age groups when the intensity of the movements increased, resulting in system performance variation [
38]. Although there are multiple open datasets collected from human participants, including elderly people, they cannot be directly applied to another use case, such as fall detection on construction sites. This highlights the need for more datasets that are representative of the construction site environment. Furthermore, to the best of our knowledge, there is no publicly available industry-oriented dataset that includes falls from a height.
3. Data Collection
The data collection was performed in a laboratory, using the same sensors as those intended to be used in the real-world use case. Each participant was equipped with two smartwatches, on the right and the left wrists, to collect more relevant data and unique activity patterns for further research (for example, using or not using handrails while going up/down the stairs, reaching for an object with left/right or both hands, using one/two or no hands to dampen a fall). Using data from both smartwatches may potentially improve the generalization capability of a model trained on such data in the case when the end-user has a specific preference for smartwatch placement (as a person wears only one smartwatch, but can choose between the left or right wrist). Moreover, this gives more data to potentially build solutions using only smartwatches, if needed. The same sensor setup was used for both the human participants and the anthropomorphic dummy (in falls from a height).
The full collected dataset, along with detailed laboratory notes, was published under a free license on Zenodo [
39].
3.1. Hardware and Software Setup
An overview of the data collection system is presented in
Figure 2.
The data collection was performed using several sensor devices—two PineTime smartwatches [
40] (1) and two tags, one for measuring the acceleration (2), and one for the location (3). The data were collected using a Raspberry Pi computer (5), worn by the test subject, and a laptop (6).
PineTime smartwatches (1) are low-cost devices equipped with a Nordic Semiconductor nRF52832 system-on-chip and 64 kB of RAM. The smartwatches were tasked with measuring the acceleration of the user’s wrists, using the onboard accelerometer. The acceleration measurements were sent over Bluetooth Low Energy (BLE) to a laptop (6), with a frequency of 10 Hz. The acceleration range was set to ±2 g and the measurement resolution was 12 bits. The smartwatch’s real-time operating system (InfiniTime 1.11) was modified appropriately to support these actions.
The tags were based on a Qorvo DWM1001C Ultra WideBand module [
41], with a three-axis acceleration sensor. In one of the tags (2), the acceleration sensor was used, it had 12-bit resolution and the range was set to ±8 g. The other tag (3) was continuously measuring its distance from the four UWB anchors (4) placed in the laboratory. The range measurements could then be used to establish the 3D location of the tag in the laboratory, using true-range multilateration [
42]. The sampling rates of the data collected from the tag’s accelerometer and location tracker were 128 Hz and 15 Hz, respectively.
The four UWB anchors (4) were placed in each of the laboratory environments, as far apart as possible, to cover the entire area. The height at which the anchors were placed was varied, to allow for 3D localization. The locations of the anchors were measured with a laser rangefinder and a measuring tape. The anchor coordinates can be found in the dataset. It should be noted that, as the output of the system is the absolute location of the worker, the anchor placement influence was limited to measurement errors.
A Raspberry Pi 3B+ computer [
43] (5), running the 64-bit Raspbian 11 operating system (Linux kernel 6.1), was attached to the subject’s belt and powered with a powerbank. A custom program written in Python 3.10 was installed on the device to collect the data from the tags (2, 3), which were connected to the Raspberry Pi via USB cables, to maintain a high data bandwidth. The use of Raspberry Pi allowed forgoing long USB cables from the subject to the laptop, making use of a wireless connection instead. The collected information was relayed over a Wi-Fi connection to an MQTT [
44] broker on the laptop. To maintain clock synchronization between the Raspberry Pi and the laptop, the two devices were synchronized using the NTP protocol [
45]. In this way, the timestamped data from both devices could later be aligned with a ~1 ms accuracy.
The laptop was tasked with aggregating all laboratory data and saving them to disk. To this end, a custom application in Python 3.10 was prepared. It gathered the data from all sources, saved them, and reported the current status of the system to the operator, via a graphical user interface.
3.2. Research Procedure
During data collection procedure, the tags were placed between the participants’ waists and high hips using a belt, a pouch with a MOLLE (modular lightweight load-carrying equipment) system, and an adapter connecting the pouch with the belt. In order to achieve a relatively stable position for the tags during movement and to eliminate movement inside the pocket, the width and depth of the pouch corresponded to the dimensions of the tags.
The study was divided into three stages, the purpose of which was to collect training data on (1) stopping a fall from a height, (2) falls on the same level, and (3) activities of daily living (ADL), respectively.
3.2.1. Fall from a Height
For the fall from a height experiments, a dedicated experimental stand was used (
Figure 3). The main structural element of the stand was a 3 m long square-section rigid beam, installed in the weight-bearing walls of the laboratory. The beam was made of welded steel elements, while its rigidity and the natural frequency at the point of loading conformed to the standard EN364:1992 [
46], which specifies requirements for measurement apparatus used in the testing of personal equipment protecting against falls from a height. The beam was equipped with an attachment point for the equipment under test. The stand was equipped with a crane that could move the dummy both vertically and horizontally to a desirable position. Prior to fall initiation, the dummy was held by an electromagnetic latch, to which the hook of the crane was attached to. The latch was later released by means of an electrical signal from the controller, causing the dummy to fall.
The base component of the stand was a Hybrid III 95th Percentile Pedestrian anthropomorphic dummy from the company Humanetics [
47,
48]. Its design (and especially the construction of its pelvis) made it possible to place it in both upright and sitting positions, and thus it was suitable for fall arrest testing of full body harnesses [
49,
50,
51]. The dummy, weighing 101 kg, was developed based on anthropometric data for the 95th percentile of the American population. The tests were carried out while restricting its fall using personal protective equipment.
The equipment included a full body harness, meeting the requirements of the EN 361:2002 [
52] standard, equipped with chest and dorsal attachment elements, and a retractable-type fall arrester, meeting the requirements of the EN 360:2002 [
53] standard. The retractable-type fall arrester was attached to the rigid beam of the test stand and its lanyard to the attachment point of the full-body harness. The tag was attached to the waist belt of the harness, and smartwatches were placed on both wrists.
The initial dummy positions presented in
Table 1 were used in the tests. Although the event of the fall itself was short in duration, the length of the measurements recorded was prolonged to include both the pre-fall and the post-fall phases. Videos with examples of each fall type are available in the published dataset.
3.2.2. Falls on the Same Level and ADL
A series of experiments with the participation of human subjects were conducted to collect data related to falls on the same level and ADL in controlled environmental conditions. The research was conducted in the Research and Demonstration Laboratory SMART PPE TESTLAB on the premises of the Central Institute for Labour Protection—National Research Institute. The study involved 10 healthy volunteers whose average age, height, and weight were 32.80 ± 10.86 years, (167.20 ± 8.98) cm, and (61.40 ± 7.55) kg, respectively. The data gathering for ADL that required stairs was performed with a set of participants who differed slightly from the lab tests (2 participants varied), making the average age, height, and weight for the data collected on the stairs 36.7 ± 10.82 years, (165.4 ± 6.62) cm, and (66 ± 19.67) kg, respectively. The participants’ gender ratio was biased towards female participants (4:1), and due to the limited number of participants the age distribution did not cover the full age range of construction workers. Before the tests, all participants were comprehensively informed about the methodology and purpose of the research. All participants signed a written informed consent to participate in the study.
In this study, seven types of surface falls that can occur on a construction site were selected for training data collection. The types of falls selected are presented in
Table 2. The fall tests were conducted using mattresses, to ensure the safety of the test participants. Each trial of a fall lasted approximately 25 s, including 5 to 10 s of normal activity before the fall and 10 to 15 s of activity after the fall. Two types of fall trials were distinguished: no movement after a fall, and a case in which the person makes some movements, trying to get up from the mattress. The number of repetitions was increased for the lateral type of fall, as this type of fall needed to be imitated on both the left and right sides of the body. Videos with examples of each fall type are available in the published dataset.
The selected types of ADL are presented in
Table 3. Here, ADL represent activities that a worker can perform on a construction site daily and that do not require additional equipment to simulate them. In total, 19 types of ADL were selected, with the preference given to mobility tasks and activities that may generate false positives due to the high acceleration of the movement. The participants were instructed to perform these activities in a “natural way”. During the trial the following phases of activity were also recorded: a pre-event phase, event start, the event itself, and post-event phase. Walking upstairs and downstairs (ADL 5 and ADL 6) was performed outside the laboratory, on a staircase.
The methodology of the study, types of fall, and the ADL selection were prepared based on the SisFall dataset [
54], which contains data for 15 surface fall types and 19 ADL types collected with the participation of 38 people, including young adults and elderly people. The types of falls and ADL performed in SisFall were considered due to the methodological similarity of the use of an accelerometer and a gyroscope located on the waist to collect training data. However, since the original SisFall dataset was designed with a focus on fall detection in elderly people, instead of construction workers, some modifications were applied. First, it was ensured that the age of the participants who performed falls was more varied. Second, more taxing activities, such as jumping and crawling, were added to the list of ADL, to better represent the set of expected movements performed by a construction worker, while superfluous trials were removed from the ADL and falls. The reasons for those removals involved either a strong similarity to other existing trials, e.g., slowly sitting on a half-height chair and quickly sitting on a half-height chair in ADL; the low harmfulness of such an event for a construction worker, e.g., falling forward from a chair when trying to get up in simulated falls; or the need to maintain the safety of the test subject throughout the trials (fall while walking, with use of hands on a table to dampen fall, caused by fainting involves an additional, possibly dangerous object being used in the trial).
Moreover, trials with two types of immobility were carried out, to distinguish situations in which the person is immobile but not related to a fall (
Table 4).
4. Data Preprocessing
4.1. Collected Data
Data collected throughout the trials consisted of acceleration measurements from the tags and the two smartwatches, as well as the location data collected from the second tag. Overall, a total of 300 min of recorded activities (both ADL and falls) were collected. The recordings include 372 unique falls gathered from 10 human participants, 22 falls from a height simulated with the use of a mannequin, and additional non fall-related activities. Those activities consisted of participants preparing to perform the defined fall or being in a post-fall position (either immobile or trying to get up). Since these type of data were irrelevant to the falls themselves, they were marked as non-fall and treated as unspecified ADL.
Each fall could be divided into three phases: pre-impact phase, free-fall, and post-fall. To detect the time frame of the fall, each reference recording was manually annotated with timestamps, indicating the moment within a second of the free-fall, i.e., when the body is in the air before it hits the safety surface. After assigning each fall a respective timestamp, the pre-impact and post-fall times were annotated in the dataset at the fall timestamp, with both pre- and post-fall phases being set to 1.5 s, as was previously suggested in the literature [
25].
4.2. Target Sampling Rate
As mentioned in
Section 1.3, in the considered realistic scenario, there were limitations on the sampling rate (frequency) of the acceleration data, due to the use of low-power IoT communication to transmit them to the edge device. Therefore, the original acceleration sequences had to be subsampled to the target frequency. The subsampling was performed per target frequency interval (in the case of 2 Hz frequency—every 500 ms) by selecting measurements with the highest intensity in the given interval. One acceleration measurement at time
t can be represented as a vector as follows:
where
x,
y,
z stand for the respective axes. The sample
for a time interval from
to
is selected as the measurement with the highest vector magnitude in that interval:
This sampling algorithm is simple to implement and thus can be easily integrated, even into very resource-constrained IoT devices, such as the tags considered in this work.
An example of the impact of subsampling on a sequence of acceleration measurements is shown in
Figure 4.
It can be seen that although the main “spike” of the fall was still visible after the subsampling, some details were lost, such as the fluctuations during and after the fall. Nevertheless, the distinction between the fall and non-fall phases remains clear.
After the data from all three accelerometers were subsampled, they had to be aligned with respect to each other. The alignment was performed using timestamps recorded during the experiments (and synchronized using NTP—see
Section 3). This preprocessing step ensured that the measurements from different sensors corresponded to the same point in time. An example of the subsampled mannequin fall acceleration measurements reported by the tag and the smartwatches is shown in
Figure 5.
All three sensors clearly show the change in acceleration as the fall occurs. It can also be seen that, depending on the device, the orientation of the axes can differ. This stems from the variation in the physical placement of the devices on the body.
4.3. True Location Estimation
During data collection, only the distances from the location tag to the four stationary anchors were measured. To obtain the absolute location of the tag in the Cartesian coordinate system, true-range multilateration was performed. A modified version of the algorithm shipped with Qorvo DWM1001C modules (included in the DecaRangeRTLS application) was used. This algorithm is a combination of 2D trilateration (when 3 anchors are visible) and 3D quadrilateration (when at least 4 anchors are visible), using the geometric method described by Sang et al. [
42]. The modification consisted of porting the code to Python and implementing two additional location modes (
2D_AVG and
APPROX). The same algorithm was also used in the pilot trials of the ASSIST-IoT project on the construction site. The following location modes were used in the dataset:
3D—all four anchors were visible and used to determine the location of the tag (best-case scenario).
2D—only three anchors were visible, so the location was determined only on the plane intersecting the three anchors;
2D_AVG—although all four anchors were visible, the 3D location could not be determined, due to a high measurement error. Therefore, all four possible combinations (subsets) of three anchors were used to determine the location of the tag in 2D mode and then averaged;
APPROX—only one or two anchors were visible, or the location could not be determined due to a high measurement error. Thus, the closest anchor was used as the approximate location of the tag. In this mode, the accuracy of the measurement was specified as the radius of the sphere in which the tag was expected to be. The radius was equal to the measured distance between the tag and the anchor;
NONE—no anchors were visible and the location could not be determined.
It should be noted that the localization algorithm was not the primary focus of this contribution; therefore, only a very rudimentary approach was used. As the published dataset also includes the raw ranges to the anchors, the research community is welcome to try different multilateration algorithms, research into which is very active [
42,
55].
Both the raw collected data and the subsampled data from all mentioned sensors were published in Zenodo [
39].
5. Data Analysis
The research procedure (described in
Section 3.2) covered ADL that could be representative of the activities performed on construction sites on an everyday basis. However, some activities had variants, namely, slow and fast versions, in order to better cover the variability of such actions.
Figure 6 presents an example of such a difference in acceleration intensity, for slow and fast jogging.
Each acceleration sequence represents a recording of three jogging repetitions, with a duration of around 60 s each, and breaks in between. It can be seen that, for the slow jogging activity, the acceleration values across all three axes remained in the range [−7, 4.5], while for fast jogging the amplitude of the values was higher, around [−8, 6.5], reaching the lowest possible value for the accelerometer’s X axis (−8 g).
Similarly, the falls also exhibited high variability, despite being generally characterized by high acceleration values [
25]. Namely, not all were characterized by a high intensity. For instance, in
Figure 7, a comparison between a high-intensity ADL and a low-intensity fall is illustrated. Each acceleration sequence consists of a series of attempts for the same activity (5 times collapsing onto a chair and 5 falls backward, while trying to sit down).
As shown in the figure, falling backward while trying to sit down did not involve any intensive movement, and its acceleration does not show any significant peaks. On the contrary, an ADL such as collapsing onto a chair after a failed attempt to get up shows well-defined peaks in the acceleration measurements.
In the cases of low-intensity and high-intensity falls, the acceleration dynamic is also different. In
Figure 8 a high-intensity fall is represented by a forward fall to the knees and then to the ground, while a low-intensity fall is represented by a vertical fall caused by fainting.
It is easy to see that, although both activities belong to the target fall category, their acceleration patterns and values are different, illustrating the complexity of the fall detection task.
6. Method
The fall detection task is a binary classification problem—the classifier, given a sequence of subsampled acceleration values, must decide whether it corresponds to a fall (positive label) or not (negative label). The following section presents the details of the proposed method for this task, starting with a description of the input data and model architecture, input data and model parameter tuning, and details of the training procedure.
6.1. Input Data
Although the dataset contains acceleration data from the three accelerometers and the location data, for the sake of reducing the model’s size and the inference time, the model was only trained using acceleration data from the tag, leaving experiments with multimodal data as a subject for possible future versions of the solution. Therefore, the input features for the model consisted of values for three acceleration axes and the overall acceleration vector magnitude.
After subsampling, the dataset consisted of 72,107 examples (input–output pairs) in total. The fall samples were underrepresented in the dataset and the average negative-to-positive class ratio was around 16 to 1. Therefore, in order to mitigate the class imbalance, a simple jittering oversampling technique was used and the number of positive samples was increased by 150%. To perform jittering, random noise was generated from the normal distribution within the 0 mean, and 10% of the standard deviation of the axis on the training data as a distribution scale and added to a random positive slice of input data.
6.2. Model Architecture
The proposed method uses a neural network composed of several recurrent layers and a dense output layer. The exact number of layers in the network and their size was the subject to tuning (see
Section 6.3). As the input data are in the form of a sequence, the natural choice for this task was recurrent neural networks. More specifically, long short-term memory (LSTM) [
56] layers were used as the main component of the network (as described in detail below). The LSTM architecture is able to capture complex relationships in time series data and focus on the underlying trends and patterns [
57]. Moreover, the mechanism of gates utilized by LSTM units protects the model from irrelevant information [
58], making it possible to filter out noise or fluctuations that can occur in sensor data, which was used in this work.
The overall architecture of the model was as follows:
Input shape, a 3D tensor matching the batch size, length of the input sequence, and number of units in the first LSTM layer;
n LSTM layers, each with units, where i is the layer number, using tanh activation and hard sigmoid recurrent activation functions, dropout 0.2, L2 regularization 0.002;
Dense output layer with one unit using sigmoid activation.
6.3. Neural Architecture Tuning
Several parameters relevant to the method were tuned to find their optimal values and obtain the best possible performance. These parameters pertained to both the model itself and the input data representation. Regarding the input data, the first question to consider was the length of the input data window. As defined in
Section 4, each fall consisted of pre-fall and post-fall phases and in total was around 3 s long. Therefore, due to the 2 Hz sampling frequency, each fall was reduced to 6 vectors of acceleration values. This means that windows of size smaller than 6 were not able to capture the full fall sequence, while windows bigger than 6 also included the non-fall context, showing the need for tuning.
Another parameter to consider was the sampling strategy of these windows. In other words, the way a sequence of measurements is transformed into a set of input data windows. Here, the non-overlapping strategy of cutting the input sequence by the step that was equal to the size of the window reduced the variability and the number of positive (i.e., fall) samples. Therefore, overlap of the data windows can introduce more variability in the training samples by allowing the shift size over the sequence to be smaller than the size of the window. Experiments to determine the optimal overlap size were performed. An example of the data slicing strategy adopted in this work is illustrated in
Figure 9.
In this example the same fall is present in two data windows and, due to the shift size of 1.5 seconds, the two windows overlap in the data they contain. Moreover, it can be seen that these two windows cover different parts of the fall—the first window represents the fall till its highest magnitude point, while the second window covers the same fall both before and after the peak magnitude. It is also worth noting that both these windows are marked as a target fall (positive) for the model, as they both have a fall in their vector sequences.
Apart from the input data parameters, the model architecture was also tuned. The number of LSTM layers and the number of units inside the layers were standard parameters that need tuning. However, as the final model is expected to work on a resource-constrained edge device, the size of the model is crucial, limiting the depth of the network and the width of the LSTM layers.
Overall, the following parameters were tuned (values in brackets indicate the values that were tried):
Acceleration window size (ws) in seconds: (1.5, 2.5, 3.5, 4.5);
Shift size in seconds: (0.5, ws/2, ws);
Number of LSTM layers (n): (1, 2);
Number of units in LSTM layer (k): (2, 3, 4, 5, 6).
The tuning was performed as follows: Each unique parameter set was examined using a grid search approach with 5 repetitions per parameter set. For each repetition, a different random seed was used for initializing the network weights and determining the data split among the train/validation/test partitions. To evaluate the performance of a particular set of parameters, the averaged performance metrics were taken for the validation dataset across 5 repetitions.
6.4. Model Training
The train/validation/test data were partitioned in 70/15/15 percent proportions, respectively. Different activities performed by a single participant might appear in different partitions, but each activity was always assigned to a partition as a whole.
During training, the Adam optimizer was used [
59] with a learning rate of 0.005. The scheduled learning rate decay was set to 5 epochs. To prevent overfitting, the number of epochs for early stopping was set to 15, and L2 regularization was applied. Moreover, dropout was applied to the LSTM layers as another overfitting prevention measure and to force the model to be more general and less susceptible to noise in the data. Binary cross-entropy was used as the loss function, defined as
where
y stands for the binary indicator for correct/incorrect prediction, and
p stands for the predicted probability returned by the model. The network configuration was additionally customized to adapt to class imbalance, by providing class weights to the loss function during model fitting.
Data preprocessing and model training were implemented in Python version 3.10, using the numpy and pandas libraries. The TensorFlow 2 framework [
60] (v.2.10) and Keras API [
61] were used for model training. All calculations were performed on a machine with an Nvidia RTX 3080 graphics processing unit.
7. Experimental Results and Analysis
The following section is divided into four parts: First, the performance metrics used for the evaluation are discussed, along with their use case context. Next, the results of tuning the architecture of the neural network are presented. Then, the best model performance is examined in detail. Finally, the results of model sensitivity tuning are described.
7.1. Performance Metrics
The fall detection task is a binary classification problem; therefore, classification metrics are appropriate for the performance evaluation. However, the data imbalance and the sequential nature of the data required more specific performance indicators. Thus, as the goal of the use case is to accurately detect falls with few false positives, the performance metrics need to reflect the ability of the model to address these requirements.
First, accuracy is a popular metric computed as follows:
where TP, TN, FP, and FN stand for true positive, true negative, false positive, and false negative, respectively. This metric does not take into account class imbalance. Therefore, to mitigate class imbalance in the performance metric calculation, the accuracy metric was changed to balanced accuracy, computed as the arithmetic mean of sensitivity and specificity, with sensitivity (or recall) calculated as
Sensitivity illustrates the proportion of the positive cases correctly identified among all ground truth cases; i.e., how well all the relevant falls were detected. Specificity, on the other hand, is defined as
Combining sensitivity and specificity in the balanced accuracy metric allowed a balanced evaluation of the performance of the classes, by increasing the importance of an underrepresented positive class.
One more performance dimension that is worth taking into account is the precision of the model, formulated as
which shows the proportion of relevant predictions among all predictions made by the model. In the case of fall detection, precision enables efficient tracking of the false discovery rate.
Thus, in order to inspect the performance of the model with respect to the positive class, the second metric that was chosen for evaluation was the F1-score, calculated as
Both the F1-score and balanced accuracy were monitored during the parameter tuning phase. Nevertheless, the definition of a true positive requires additional description.
As was shown in
Figure 9, one fall may be present in multiple windows, artificially increasing the number of predictions for the positive class. What is more, in case multiple windows address the same fall, the predictions of the model might be different. Thus, to consistently track true positives in model evaluation, a fall was considered detected if
any input data window containing a part of that fall was correctly classified.
7.2. Neural Architecture Tuning Results
Following the motivation and methodology for input data tuning stated in
Section 6.3, the results of window size and shift tuning are presented in
Figure 10. To be able to produce a meaningful visualization of the intrinsically multi-dimensional results, only the results for a model consisting of one LSTM layer with 6 units are shown here. The remaining model architectures displayed very similar patterns. The presented metrics were taken as the average over the five experiments performed on the validation datasets.
From the plots, it can be observed that the overall balanced accuracy stayed in a narrow range of (0.974; 0.987). The F1-score experienced more fluctuations in the range of (0.707; 0.856). Overall, the balanced accuracy plot indicates that a smaller shift of 0.5 s resulted in a slightly better balanced accuracy, while the F1-score plot shows that bigger windows of 4.5 s resulted in a better F1-score. The best window size and shift were 4.5 and 0.5 s, respectively.
Layer size tuning results are presented in
Figure 11 (window size of 4.5 s and shift of 0.5 s).
It can be noted that the second LSTM layer did not improve the validation metrics significantly. However, both metrics reported better results with more units in the first LSTM layer. As one of the requirements for the model was its compactness, more layers were not tested and a two-layered LSTM with four units in the first layer and two units in the second was taken as the optimal architecture. Thus, the final model architecture had 203 parameters and on average yielded a balanced accuracy of 0.986 and had an F1-score of 0.864 on the validation dataset.
However, there was a discrepancy between the balanced accuracy and the F1-score. As both formulas include sensitivity, this discrepancy came from the difference between the specificity (ability to find relevant negative samples) and the precision. Therefore, the balanced accuracy close to one indicates that the model identified most of the ground truths for both classes, meaning that the absolute majority of the falls were classified correctly. On the contrary, a lower F1-score highlights that the precision of the model was lower than its sensitivity. In other words, there was a number of false positives small enough to not affect the specificity but high enough to affect the precision of the model. With respect to the use case, this behavior was undesirable and could result in fall notification overflow for the OSH manager.
7.3. Sensitivity Tuning Results
The sensitivity of the model could further be tuned to better address the requirements of the use case, i.e., to reduce the number of false positives. This could be done by modifying the decision threshold of the trained classifier. To do so, the trained classifier with the optimal architecture was taken and the distribution of the predicted values on the validation dataset (shown in
Figure 12) was examined.
The depicted distribution highlights the possibility of threshold tuning, as there are two visible regions of model predictions—from 0 to 0.5 for the negative predictions, and from 0.9 to 1 for the positive predictions. Therefore, the area “in between” could be used to improve the precision of the model at the cost of a lower recall.
To better estimate the optimal threshold, the receiver operating characteristic (ROC) curve and the precision–recall (PR) curve could be used. To do so, the threshold of the classifier was examined for the range of values with a step of 0.01, starting from a default 0.5 threshold value up to 0.99. For each threshold value, the predicted binary values on the validation dataset were reassessed and metrics for sensitivity, specificity, and precision were recalculated according to the updated fall classification predictions.
Figure 13 illustrates how the sensitivity, specificity, and precision changed as the threshold value changed for the validation dataset. With a default threshold of 0.5, the precision and sensitivity of the model on the validation dataset were 0.76 and 1.
It can be observed that the model showed good performance compared to a random classifier. The main highlight comes from the PR curve, as its top-right corner suggests that the precision could be improved at a reasonable cost of sensitivity. Thus, for the validation dataset with a threshold of 0.8, the precision could be increased up to 0.95, with the sensitivity and specificity decreasing to 0.97 and 0.99.
7.4. Best Model Performance
After determining the best model architecture, input data representation, and the optimal threshold, the proposed performance metrics were evaluated for the test dataset. For the test dataset, the precision was determined to be 0.91, while preserving a high sensitivity and specificity (0.93, and 0.99, respectively), resulting in a F1-score of 0.92. The true positive cases from the test set that were missed in this case came from activities such as falling back while trying to sit down and were characterized by a low acceleration intensity. The tuned model had a high precision on both validation and test datasets, indicating that the amount of false positives was small, which corresponded to the requirements of the use case. In addition, it did not compromise the detection of the most severe cases of falls, such as falls from height, keeping the effectiveness for fall detection relevant for OSH monitoring.
To better understand which activities contributed to the false positive count, the test dataset was further analyzed. The most common activities that were incorrectly attributed as falls were jumping, collapsing onto a chair, and the starting moments of activities such as jogging or walking down the stairs. Moreover, activities such as lying down abruptly on a mattress or getting down on all four while preparing to crawl, which were not defined as ADL, also triggered false positives.
As an example, the prediction of the model for the bending with knees activity is illustrated in
Figure 14. Here, the initial bending was detected as a fall, while the four remaining ones were classified correctly. While examining the reference footage, it was found that, during this attempt, the participant bent their torso quickly and the tag’s position was physically affected by the body movement. The latter bends were performed more slowly and did not trigger the model.
8. Discussion
Despite having a limitation of a sampling frequency below the recommended range (only 2 Hz), the performance evaluation showed good results, which with proper tuning could reach more than 0.9 for all relevant performance metrics. However, the presence of false positives from activities that do not resemble falls from a human perspective (such as jumps or starting to jog) indicates room for further improvement. The activities triggering false positives have some similarities—jumps, collapsing onto a chair, and abrupt walking/jogging are characterized by a rapid change from an “almost idle activity” to high body acceleration, which can also be observed during the start of a fall.
The existence of a trade-off between sensitivity and precision shows that the collected dataset presents a challenging task, by introducing variability in the data. It requires a more sophisticated approach to distinguishing high-acceleration daily activities from falls, while encompassing the entire diversity of individual activity patterns provided by participants from different demographic groups.
The acceleration data from the smartwatches and the location data were not used in the solution presented in this work—highlighting further opportunities for additional research. In particular, using location sensors to detect falls is an unexplored subject, which can now be examined in detail thanks to the new dataset.
It is also worth noting that the presented solution operated on data collected in laboratory conditions and, therefore, not fully representing the actual conditions of a construction site. Thus, on-site trials are required, to further assess the performance of the model in an environment affected by weather conditions, obstacles, and active machinery.
9. Conclusions
In this work, a novel multimodal dataset for fall detection was presented, along with a lightweight model for real-time fall detection in a construction site environment.
The novel dataset, containing location data and acceleration data reported by three wearable devices in a laboratory setting, was published under a free license, to inspire further research in the field of fall detection and provide valuable data for industrial use cases. It covers both falls on the same level performed by humans and falls from height simulated with the help of an anthropomorphic dummy and personal protective equipment, to fully represent the most dangerous fall scenarios. This dataset should be especially valuable due to the variety of sensors used and the inclusion of falls from a height.
A lightweight LSTM model of just 203 parameters was built, making it suitable for use in a resource-restrained IoT/Edge environment. The solution requires only a small amount of input data to function (at 2 Hz), making it applicable for devices with a constrained network bandwidth. The model’s architecture and input data representation were tuned to identify the optimal parameters that yielded the best performance. The model was further evaluated and analyzed with respect to the construction site use case requirements. The resulting model’s test performance with the optimal threshold reached 0.96 for balanced accuracy and 0.92 for F1-score, indicating a precise solution, despite the challenging nature of the task. It should be stressed, however, that the results were obtained on a dataset collected in laboratory conditions, and thus they may not be fully representative of the model’s performance on a real construction site.
Directions for future work include further improving the performance of the model by addressing the identified false positive and false negative cases. Another promising direction for research is utilizing the full potential of the multimodal dataset, introducing acceleration data from smartwatches and location data into the solution.
Author Contributions
Conceptualization, A.D. (Anastasiya Danilenka), P.S. and P.D.; Data curation, A.D. (Anastasiya Danilenka), P.S., K.R. and M.K.; Formal analysis, A.D. (Anastasiya Danilenka); Funding acquisition, A.D. (Anna Dąbrowska), P.D., I.L., M.G. and M.P.; Investigation, A.D. (Anastasiya Danilenka), P.S., K.R. and M.K.; Methodology, A.D. (Anastasiya Danilenka), P.S., K.B. (Karolina Bogacka), A.D. (Anna Dąbrowska), M.K., K.B. (Krzysztof Baszczyński), M.O. and W.O.; Project administration, A.D. (Anna Dąbrowska), P.D., I.L., M.G. and M.P.; Resources, A.D. (Anna Dąbrowska), K.B. (Krzysztof Baszczyński), P.D. and M.P.; Software, A.D. (Anastasiya Danilenka), P.S. and K.R.; Supervision, P.S., A.D. (Anna Dąbrowska), M.G. and M.P.; Validation, A.D. (Anastasiya Danilenka) and P.S.; Visualization, A.D. (Anastasiya Danilenka), P.S. and K.R.; Writing—original draft, A.D. (Anastasiya Danilenka), P.S., K.R., K.B. (Karolina Bogacka), A.D. (Anna Dąbrowska), M.K., K.B. (Krzysztof Baszczyński), M.O., W.O. and I.L.; Writing—review and editing, P.S., K.B. (Karolina Bogacka), M.G. and M.P. All authors have read and agreed to the published version of the manuscript.
Funding
This work was funded in part by the European Commission, under the Horizon 2020 project ASSIST-IoT, grant number 957258. The work of Anastasiya Danilenka, Karolina Bogacka, and Maria Ganzha was co-funded by the Centre for Priority Research Area Artificial Intelligence and Robotics of Warsaw University of Technology within the Excellence Initiative: Research University (IDUB) programme.
Institutional Review Board Statement
Ethical review and approval were waived for this study, due to the fact that the experiments carried out were not classified as medical research and they did not involve more than a minimal risk to the subjects.
Informed Consent Statement
Informed consent was obtained from all subjects involved in the study.
Data Availability Statement
Conflicts of Interest
The authors declare no conflict of interest. The funders had no role in the design of the study; in the collection, analyses, or interpretation of data; in the writing of the manuscript; or in the decision to publish the results.
Abbreviations
The following abbreviations are used in this manuscript:
| ADL | Activity of Daily Living |
| AI | Artificial Intelligence |
| BLE | Bluetooth Low Energy |
| FL | Federated Learning |
| FN | False Negative |
| FP | False Positive |
| GWEN | Gateway Edge Node |
| IoT | Internet of Things |
| LSTM | Long Short-Term Memory |
| MEMS | Microelectromechanical systems |
| ML | Machine Learning |
| MOLLE | Modular Lightweight Load-carrying Equipment |
| NGIoT | Next Generation Internet of Things |
| OSH | Occupational Health and Safety |
| PPE | Personal Protective Equipment |
| PR | Precision-Recall |
| ROC | Receiver Operating Characteristic |
| TN | True Negative |
| TP | True Positive |
| UWB | Ultra WideBand |
References
- European Commission; Eurostat. Accidents at Work Statistics. 2023. Available online: https://ec.europa.eu/eurostat/statistics-explained/index.php?title=Accidents_at_work_statistics (accessed on 1 July 2023).
- European Commission; Eurostat. Accidents at Work by Sex, Age, Severity, NACE Rev. 2 Activity and Deviation. 2023. Available online: https://ec.europa.eu/eurostat/databrowser/product/view/HSW_PH3_06 (accessed on 1 July 2023).
- Paul, L.J.; Geetha, W.; Miller, T.R.; Craig, K. Costs of occupational injury and illness across industries. Scand. J. Work. Environ. Health 2004, 30, 199–205. [Google Scholar] [CrossRef]
- Battaglini, M.; Andriescu, M.; Spyridopoulos, K.; Olausson, N. Smart Digital Monitoring Systems for Occupational Safety and Health: Workplace Resources for Design, Implementation and Use; Technical Report; European Agency for Safety and Health at Work (EU-OSHA): Bilbao, Spain, 2022. [Google Scholar]
- Eeckelaert, L.; Graveling, R.; Kuhl, K. Construction Safety Risks and Prevention. 2014. Available online: https://oshwiki.osha.europa.eu/en/themes/construction-safety-risks-and-prevention (accessed on 7 September 2023).
- Oude Hengel, K.; Drupsteen, L.; Graveling, R. Health in the Construction Industry. 2014. Available online: https://oshwiki.osha.europa.eu/en/themes/health-construction-industry (accessed on 7 September 2023).
- The Council of the European Communities. Council Directive of 12 June 1989 on the Introduction of Measures to Encourage Improvements in the Safety and Health of Workers at Work (89/391/EEC). 1989. Available online: https://eur-lex.europa.eu/eli/dir/1989/391 (accessed on 24 July 2023).
- ASSIST-IoT – EU H2020 Project. Available online: https://assist-iot.eu/ (accessed on 11 September 2023).
- Abioye, S.O.; Oyedele, L.O.; Akanbi, L.; Ajayi, A.; Delgado, J.M.D.; Bilal, M.; Akinade, O.O.; Ahmed, A. Artificial Intelligence in the construction industry: A review of present status, opportunities and future challenges. J. Build. Eng. 2021, 44, 103299. [Google Scholar] [CrossRef]
- Häikiö, J.; Kallio, J.; Mäkelä, S.M.; Keränen, J. IoT-based safety monitoring from the perspective of construction site workers. Int. J. Occup. Environ. Saf. 2020, 4, 1–14. [Google Scholar] [CrossRef]
- Sowiński, P.; Rachwał, K.; Danilenka, A.; Bogacka, K.; Kobus, M.; Dąbrowska, A.; Paszkiewicz, A.; Bolanowski, M.; Ganzha, M.; Paprzycki, M. Frugal Heart Rate Correction Method for Scalable Health and Safety Monitoring in Construction Sites. Sensors 2023, 23, 6464. [Google Scholar] [CrossRef] [PubMed]
- Oesterreich, T.D.; Teuteberg, F. Understanding the implications of digitisation and automation in the context of Industry 4.0: A triangulation approach and elements of a research agenda for the construction industry. Comput. Ind. 2016, 83, 121–139. [Google Scholar] [CrossRef]
- Rao, A.S.; Radanovic, M.; Liu, Y.; Hu, S.; Fang, Y.; Khoshelham, K.; Palaniswami, M.; Ngo, T. Real-time monitoring of construction sites: Sensors, methods, and applications. Autom. Constr. 2022, 136, 104099. [Google Scholar] [CrossRef]
- Abuwarda, Z.; Mostafa, K.; Oetomo, A.; Hegazy, T.; Morita, P. Wearable devices: Cross benefits from healthcare to construction. Autom. Constr. 2022, 142, 104501. [Google Scholar] [CrossRef]
- European Commission. The Next Generation Internet of Things. 2023. Available online: https://digital-strategy.ec.europa.eu/en/policies/next-generation-internet-things (accessed on 12 September 2023).
- Szmeja, P.; Fornés-Leal, A.; Lacalle, I.; Palau, C.E.; Ganzha, M.; Pawłowski, W.; Paprzycki, M.; Schabbink, J. ASSIST-IoT: A Modular Implementation of a Reference Architecture for the Next Generation Internet of Things. Electronics 2023, 12, 854. [Google Scholar] [CrossRef]
- Lacalle, I.; López, C.; Vaño, R.; Palau, C.E.; Esteve, M.; Ganzha, M.; Paprzycki, M.; Szmeja, P. Tactile Internet in Internet of Things Ecosystems. In Proceedings of the Innovations in Electrical and Electronic Engineering, New Delhi, India, 8–9 January 2022; Mekhilef, S., Shaw, R.N., Siano, P., Eds.; Springer: Singapore, 2022; pp. 794–807. [Google Scholar]
- Rahayu, Y.; Rahman, T.A.; Ngah, R.; Hall, P.S. Ultra wideband technology and its applications. In Proceedings of the 2008 5th IFIP International Conference on Wireless and Optical Communications Networks (WOCN’08), Surabaya, Indonesia, 5–7 May 2008; pp. 1–5. [Google Scholar]
- McMahan, B.; Moore, E.; Ramage, D.; Hampson, S.; Arcas, B.A.y. Communication-Efficient Learning of Deep Networks from Decentralized Data. In Proceedings of the 20th International Conference on Artificial Intelligence and Statistics, Fort Lauderdale, FL, USA, 20–22 April 2017; Singh, A., Zhu, J., Eds.; Proceedings of Machine Learning Research. PMLR: London, UK, 2017; Volume 54, pp. 1273–1282. [Google Scholar]
- Mewes, D. Slips, Trips and Falls. 2012. Available online: https://oshwiki.osha.europa.eu/en/themes/slips-trips-and-falls (accessed on 24 July 2023).
- Newaz, N.T.; Hanada, E. The Methods of Fall Detection: A Literature Review. Sensors 2023, 23, 5212. [Google Scholar] [CrossRef]
- Nooruddin, S.; Islam, M.M.; Sharna, F.A.; Al-Hetari, H.Y.; Kabir, M.N. Sensor-based fall detection systems: A review. J. Ambient. Intell. Humaniz. Comput. 2021, 13, 2735–2751. [Google Scholar] [CrossRef]
- Warrington, D.J.; Shortis, E.J.; Whittaker, P.J. Are wearable devices effective for preventing and detecting falls: An umbrella review (a review of systematic reviews). BMC Public Health 2021, 21, 2091. [Google Scholar] [CrossRef] [PubMed]
- Lammel, G. The future of MEMS sensors in our connected world. In Proceedings of the 2015 28th IEEE International Conference on Micro Electro Mechanical Systems (MEMS), Estoril, Portugal, 18–22 January 2015; pp. 61–64. [Google Scholar] [CrossRef]
- Antonio Santoyo-Ramón, J.; Casilari, E.; Manuel Cano-García, J. A study of the influence of the sensor sampling frequency on the performance of wearable fall detectors. Measurement 2022, 193, 110945. [Google Scholar] [CrossRef]
- Bianchi, V.; Grossi, F.; De Munari, I.; Ciampolini, P. MuSA: A multisensor wearable device for AAL. In Proceedings of the 2011 Federated Conference on Computer Science and Information Systems (FedCSIS), Szczecin, Poland, 18–21 September 2011; pp. 375–380. [Google Scholar]
- Usaha, W.; Liang, H. Fall Detection using Lifting Wavelet Transform and Support Vector Machine. In Annals of Computer Science and Information Systems, Proceedings of the 2017 Federated Conference on Computer Science and Information Systems, Prague, Czech Republic, 3–6 September 2017; Ganzha, M., Maciaszek, L., Paprzycki, M., Eds.; IEEE: Piscataway, NJ, USA, 2017; Volume 11, pp. 877–883. [Google Scholar] [CrossRef]
- Ziyad, S.R.; Altulyan, M.; AlHarbi, M. Accident Attention System for Somnambulism Patients: IoMT based Smart Health care System. Scalable Comput. Pract. Exp. 2023, 24, 151–160. [Google Scholar] [CrossRef]
- Liu, J.; Li, X.; Huang, S.; Chao, R.; Cao, Z.; Wang, S.; Wang, A.; Liu, L. A review of wearable sensors based fall-related recognition systems. Eng. Appl. Artif. Intell. 2023, 121, 105993. [Google Scholar] [CrossRef]
- Ferreira de Sousa, F.A.S.; Escriba, C.; Avina Bravo, E.G.; Brossa, V.; Fourniols, J.Y.; Rossi, C. Wearable Pre-Impact Fall Detection System Based on 3D Accelerometer and Subject’s Height. IEEE Sens. J. 2022, 22, 1738–1745. [Google Scholar] [CrossRef]
- Lin, C.L.; Chiu, W.C.; Chu, T.C.; Ho, Y.H.; Chen, F.H.; Hsu, C.C.; Hsieh, P.H.; Chen, C.H.; Lin, C.C.K.; Sung, P.S.; et al. Innovative Head-Mounted System Based on Inertial Sensors and Magnetometer for Detecting Falling Movements. Sensors 2020, 20, 5774. [Google Scholar] [CrossRef] [PubMed]
- Lin, C.L.; Chiu, W.C.; Chen, F.H.; Ho, Y.H.; Chu, T.C.; Hsieh, P.H. Fall Monitoring for the Elderly Using Wearable Inertial Measurement Sensors on Eyeglasses. IEEE Sens. Lett. 2020, 4, 6000804. [Google Scholar] [CrossRef]
- Luna-Perejón, F.; Domínguez-Morales, M.J.; Civit-Balcells, A. Wearable Fall Detector Using Recurrent Neural Networks. Sensors 2019, 19, 4885. [Google Scholar] [CrossRef]
- Musci, M.; De Martini, D.; Blago, N.; Facchinetti, T.; Piastra, M. Online Fall Detection Using Recurrent Neural Networks on Smart Wearable Devices. IEEE Trans. Emerg. Top. Comput. 2021, 9, 1276–1289. [Google Scholar] [CrossRef]
- Márquez-Sánchez, S.; Campero-Jurado, I.; Robles-Camarillo, D.; Rodríguez, S.; Corchado-Rodríguez, J.M. BeSafe B2.0 Smart Multisensory Platform for Safety in Workplaces. Sensors 2021, 21, 3372. [Google Scholar] [CrossRef]
- Yang, K.; Ahn, C.R.; Vuran, M.C.; Aria, S.S. Semi-supervised near-miss fall detection for ironworkers with a wearable inertial measurement unit. Autom. Constr. 2016, 68, 194–202. [Google Scholar] [CrossRef]
- Sander, M.; Oxlund, B.; Jespersen, A.; Krasnik, A.; Mortensen, E.L.; Westendorp, R.G.J.; Rasmussen, L.J. The challenges of human population ageing. Age Ageing 2014, 44, 185–187. [Google Scholar] [CrossRef] [PubMed]
- Yu, Z.; Liu, J.; Yang, M.; Cheng, Y.; Hu, J.; Li, X. An Elderly Fall Detection Method Based on Federated Learning and Extreme Learning Machine (Fed-ELM). IEEE Access 2022, 10, 130816–130824. [Google Scholar] [CrossRef]
- Danilenka, A.; Sowiński, P.; Kobus, M.; Dąbrowska, A.; Rachwał, K.; Bogacka, K.; Baszczyński, K. ASSIST-IoT Multimodal Fall Detection Dataset; Zenodo: Geneve, Switzerland, 2023. [Google Scholar] [CrossRef]
- PineTime. Available online: https://www.pine64.org/pinetime/ (accessed on 11 September 2023).
- Qorvo DWM1001C Module. Available online: https://www.qorvo.com/products/p/DWM1001C (accessed on 11 September 2023).
- Sang, C.L.; Adams, M.; Hesse, M.; Hörmann, T.; Korthals, T.; Rückert, U. A comparative study of UWB-based true-range positioning algorithms using experimental data. In Proceedings of the 2019 16th Workshop on Positioning, Navigation and Communications (WPNC), Bremen, Germany, 23–24 October 2019; pp. 1–6. [Google Scholar]
- Raspberry Pi 3 Model B+. Available online: https://www.raspberrypi.com/products/raspberry-pi-3-model-b-plus/ (accessed on 11 September 2023).
- MQTT: The Standard for IoT Messaging. Available online: https://mqtt.org/ (accessed on 11 September 2023).
- Martin, J.; Burbank, J.; Kasch, W.; Mills, P.D.L. Network Time Protocol Version 4: Protocol and Algorithms Specification; RFC 5905; Internet Engineering Task Force: Fremont, CA, USA, 2010. [Google Scholar] [CrossRef]
- Standard No. EN 364:1992; Personal Protective Equipment against Falls from a Height—Test Methods. European Committee for Standardization (CEN): Brussels, Belgium, 1992.
- Humanetics. Crash Test Dummies. Available online: http://www.humaneticsatd.com/crash-test-dummies (accessed on 4 November 2022).
- Humanetics. Hybrid III 50M Pedestrian. Available online: http://www.humaneticsatd.com/crash-test-dummies/pedestrian/hybrid-iii-50m (accessed on 4 November 2022).
- Baszczyński, K. The application of a Hybrid III anthropomorphic dummy in testing personal fall arrest equipment. Meas. Autom. Monit. 2016, 62, 429–433. [Google Scholar]
- Baszczyński, K. Anthropomorphic Manikins. Testing PPE to protect against falls from height. Health Saf. Int. 2018, 74, 77–80. [Google Scholar]
- Baszczyński, K. Effect of safety harness design on the pressures exerted on the user’s body in the state of its suspension. Int. J. Occup. Saf. Ergon. 2022, 28, 1894–1903. [Google Scholar] [CrossRef] [PubMed]
- Standard No. EN 361:2002; Personal Protective Equipment against Falls from a Height–Safety Harnesses. European Committee for Standardization (CEN): Brussels, Belgium, 2002.
- Standard No. EN 360:2002; Personal Protective Equipment against Falls from a Height. Retractable Type Fall Arresters. European Committee for Standardization (CEN): Brussels, Belgium, 2002.
- Sucerquia, A.; López, J.D.; Vargas-Bonilla, J.F. SisFall: A Fall and Movement Dataset. Sensors 2017, 17, 198. [Google Scholar] [CrossRef] [PubMed]
- Malivert, F.; Labbani-Igbida, O.; Boeglen, H. Comparison and Improvement of 3D-Multilateration for Solving Simultaneous Localization of Drones and UWB Anchors. Appl. Sci. 2023, 13, 1002. [Google Scholar] [CrossRef]
- Hochreiter, S.; Schmidhuber, J. Long Short-Term Memory. Neural Comput. 1997, 9, 1735–1780. [Google Scholar] [CrossRef]
- Malhotra, P.; Vig, L.; Shroff, G.M.; Agarwal, P. Long Short Term Memory Networks for Anomaly Detection in Time Series. In Proceedings of the The European Symposium on Artificial Neural Networks, Bruges, Belgium, 22–24 April 2015. [Google Scholar]
- Gers, F.A.; Schmidhuber, J.; Cummins, F. Learning to Forget: Continual Prediction with LSTM. Neural Comput. 2000, 12, 2451–2471. [Google Scholar] [CrossRef]
- Kingma, D.P.; Ba, J. Adam: A Method for Stochastic Optimization. 2017. Available online: http://xxx.lanl.gov/abs/1412.6980 (accessed on 2 September 2023).
- Abadi, M.; Agarwal, A.; Barham, P.; Brevdo, E.; Chen, Z.; Citro, C.; Corrado, G.S.; Davis, A.; Dean, J.; Devin, M.; et al. TensorFlow: Large-Scale Machine Learning on Heterogeneous Systems, 2015. arXiv 2016, arXiv:1603.04467. [Google Scholar]
- Chollet, F. Keras. 2015. Available online: https://keras.io (accessed on 2 September 2023).
Figure 1.
Fall detection system architecture diagram.
Figure 1.
Fall detection system architecture diagram.
Figure 2.
Communication diagram of the data collection setup.
Figure 2.
Communication diagram of the data collection setup.
Figure 3.
Fall from a height experimental stand. The two smartwatches are on the wrists of the dummy, and the tags are located on the belt. The bag in the front contains the Raspberry Pi and the batteries.
Figure 3.
Fall from a height experimental stand. The two smartwatches are on the wrists of the dummy, and the tags are located on the belt. The bag in the front contains the Raspberry Pi and the batteries.
Figure 4.
Raw and subsampled acceleration example (mannequin fall number 9).
Figure 4.
Raw and subsampled acceleration example (mannequin fall number 9).
Figure 5.
Example of acceleration recorded by the three wearable devices (mannequin fall number 13).
Figure 5.
Example of acceleration recorded by the three wearable devices (mannequin fall number 13).
Figure 6.
Example of acceleration recorded for slow and fast jogging activities (participant number 1).
Figure 6.
Example of acceleration recorded for slow and fast jogging activities (participant number 1).
Figure 7.
Sample acceleration recorded for an intensive ADL (collapsing onto a chair) and a low-intensity fall backward (participant number 10).
Figure 7.
Sample acceleration recorded for an intensive ADL (collapsing onto a chair) and a low-intensity fall backward (participant number 10).
Figure 8.
Example of acceleration recorded for a fall to the knees and then to the ground and for a vertical fall caused by fainting (participant number 1).
Figure 8.
Example of acceleration recorded for a fall to the knees and then to the ground and for a vertical fall caused by fainting (participant number 1).
Figure 9.
Data slicing example with a window size of 2.5 s and 1.5 s shift in the vertical fall caused by fainting (participant 1).
Figure 9.
Data slicing example with a window size of 2.5 s and 1.5 s shift in the vertical fall caused by fainting (participant 1).
Figure 10.
Window size (ws) and shift tuning.
Figure 10.
Window size (ws) and shift tuning.
Figure 11.
Layer size tuning.
Figure 11.
Layer size tuning.
Figure 12.
Distribution of model predictions on the validation dataset.
Figure 12.
Distribution of model predictions on the validation dataset.
Figure 13.
ROC curve and PR curve on the validation dataset. Dashed lines represent random classifier estimation.
Figure 13.
ROC curve and PR curve on the validation dataset. Dashed lines represent random classifier estimation.
Figure 14.
False positive example. The vertical bars indicate the fall probability returned by the model.
Figure 14.
False positive example. The vertical bars indicate the fall probability returned by the model.
Table 1.
Types of mannequin falls performed in this study.
Table 1.
Types of mannequin falls performed in this study.
| No. | Activity | Repetitions | Duration |
|---|
| 1 | Fall forward from height (vertical starting position, front attachment point of the harness) | 7 | 20 s |
| 2 | Fall forward from height (vertical starting position, back attachment point of the harness) | 6 | 20 s |
| 3 | Fall forward from height (starting point mannequin forward tilt, back attachment point of the harness) | 4 | 20 s |
| 4 | Fall backward from height (starting position mannequin backward tilt, front attachment point of the harness) | 5 | 20 s |
Table 2.
Types of surface fall performed in this study.
Table 2.
Types of surface fall performed in this study.
| No. | Activity | Repetitions
(per Participant)
No Movement/with
Movement after the Fall | Duration |
|---|
| 1 | Fall forward while walking | 3/2 | 25 s |
| 2 | Fall backward while standing | 3/2 | 25 s |
| 3 | Lateral fall while walking | 2/1 left side + 2/1 right side | 25 s |
| 4 | Fall forward while jogging | 3/2 | 25 s |
| 5 | Vertical fall caused by fainting | 5 | 25 s |
| 6 | Fall backward when trying to sit down | 3/2 | 25 s |
| 7 | Forward fall to the knees then to the ground | 3/2 | 25 s |
Table 3.
Types of ADL performed in this study.
Table 3.
Types of ADL performed in this study.
| No. | Activity | Repetitions (per Participant) | Duration |
|---|
| 1 | Walking slowly | 3 | 60 s |
| 2 | Walking quickly | 3 | 60 s |
| 3 | Jogging slowly | 3 | 60 s |
| 4 | Jogging quickly | 3 | 60 s |
| 5 | Walking upstairs and downstairs slowly | 5 | 35 s |
| 6 | Walking upstairs and downstairs quickly | 5 | 25 s |
| 7 | Sit in a half-height chair, wait a moment, and up slowly | 5 | 20 s |
| 8 | Slowly sit in a low height chair, wait a moment, and up slowly | 5 | 25 s |
| 9 | Quickly sit in a low height chair, wait a moment, and up quickly | 5 | 15 s |
| 10 | Sitting a moment, trying to get up, and collapse into a chair | 5 | 10 s |
| 11 | Sitting a moment, lying slowly, wait a moment, and sit again | 5 | 20 s |
| 12 | Sitting a moment, lying quickly, wait a moment, and sit again | 5 | 15 s |
| 13 | Standing, slowly bending at knees, and getting up | 5 | 10 s |
| 14 | Standing, slowly bending without bending knees, and getting up | 5 | 10 s |
| 15 | Stumble while walking | 5 | 10 s |
| 16 | Gently jump without falling (trying to reach a high object) | 5 | 5 s |
| 17 | Crawling | 5 | 15 s |
| 18 | Jumping, standing on the same place (multiple times during one trial) | 5 | 15 s |
| 19 | Raise two hands into the air (3 times during one trial) | 5 | 10 s |
Table 4.
Types of immobility performed in this study.
Table 4.
Types of immobility performed in this study.
| No. | Activity | Repetitions (per Participant) | Duration |
|---|
| I1 | Lying on one’s back | 3 | 30 s |
| I2 | Lying on one’s stomach | 3 | 30 s |
| Disclaimer/Publisher’s Note: The statements, opinions and data contained in all publications are solely those of the individual author(s) and contributor(s) and not of MDPI and/or the editor(s). MDPI and/or the editor(s) disclaim responsibility for any injury to people or property resulting from any ideas, methods, instructions or products referred to in the content. |
© 2023 by the authors. Licensee MDPI, Basel, Switzerland. This article is an open access article distributed under the terms and conditions of the Creative Commons Attribution (CC BY) license (https://creativecommons.org/licenses/by/4.0/).


 ,
, 


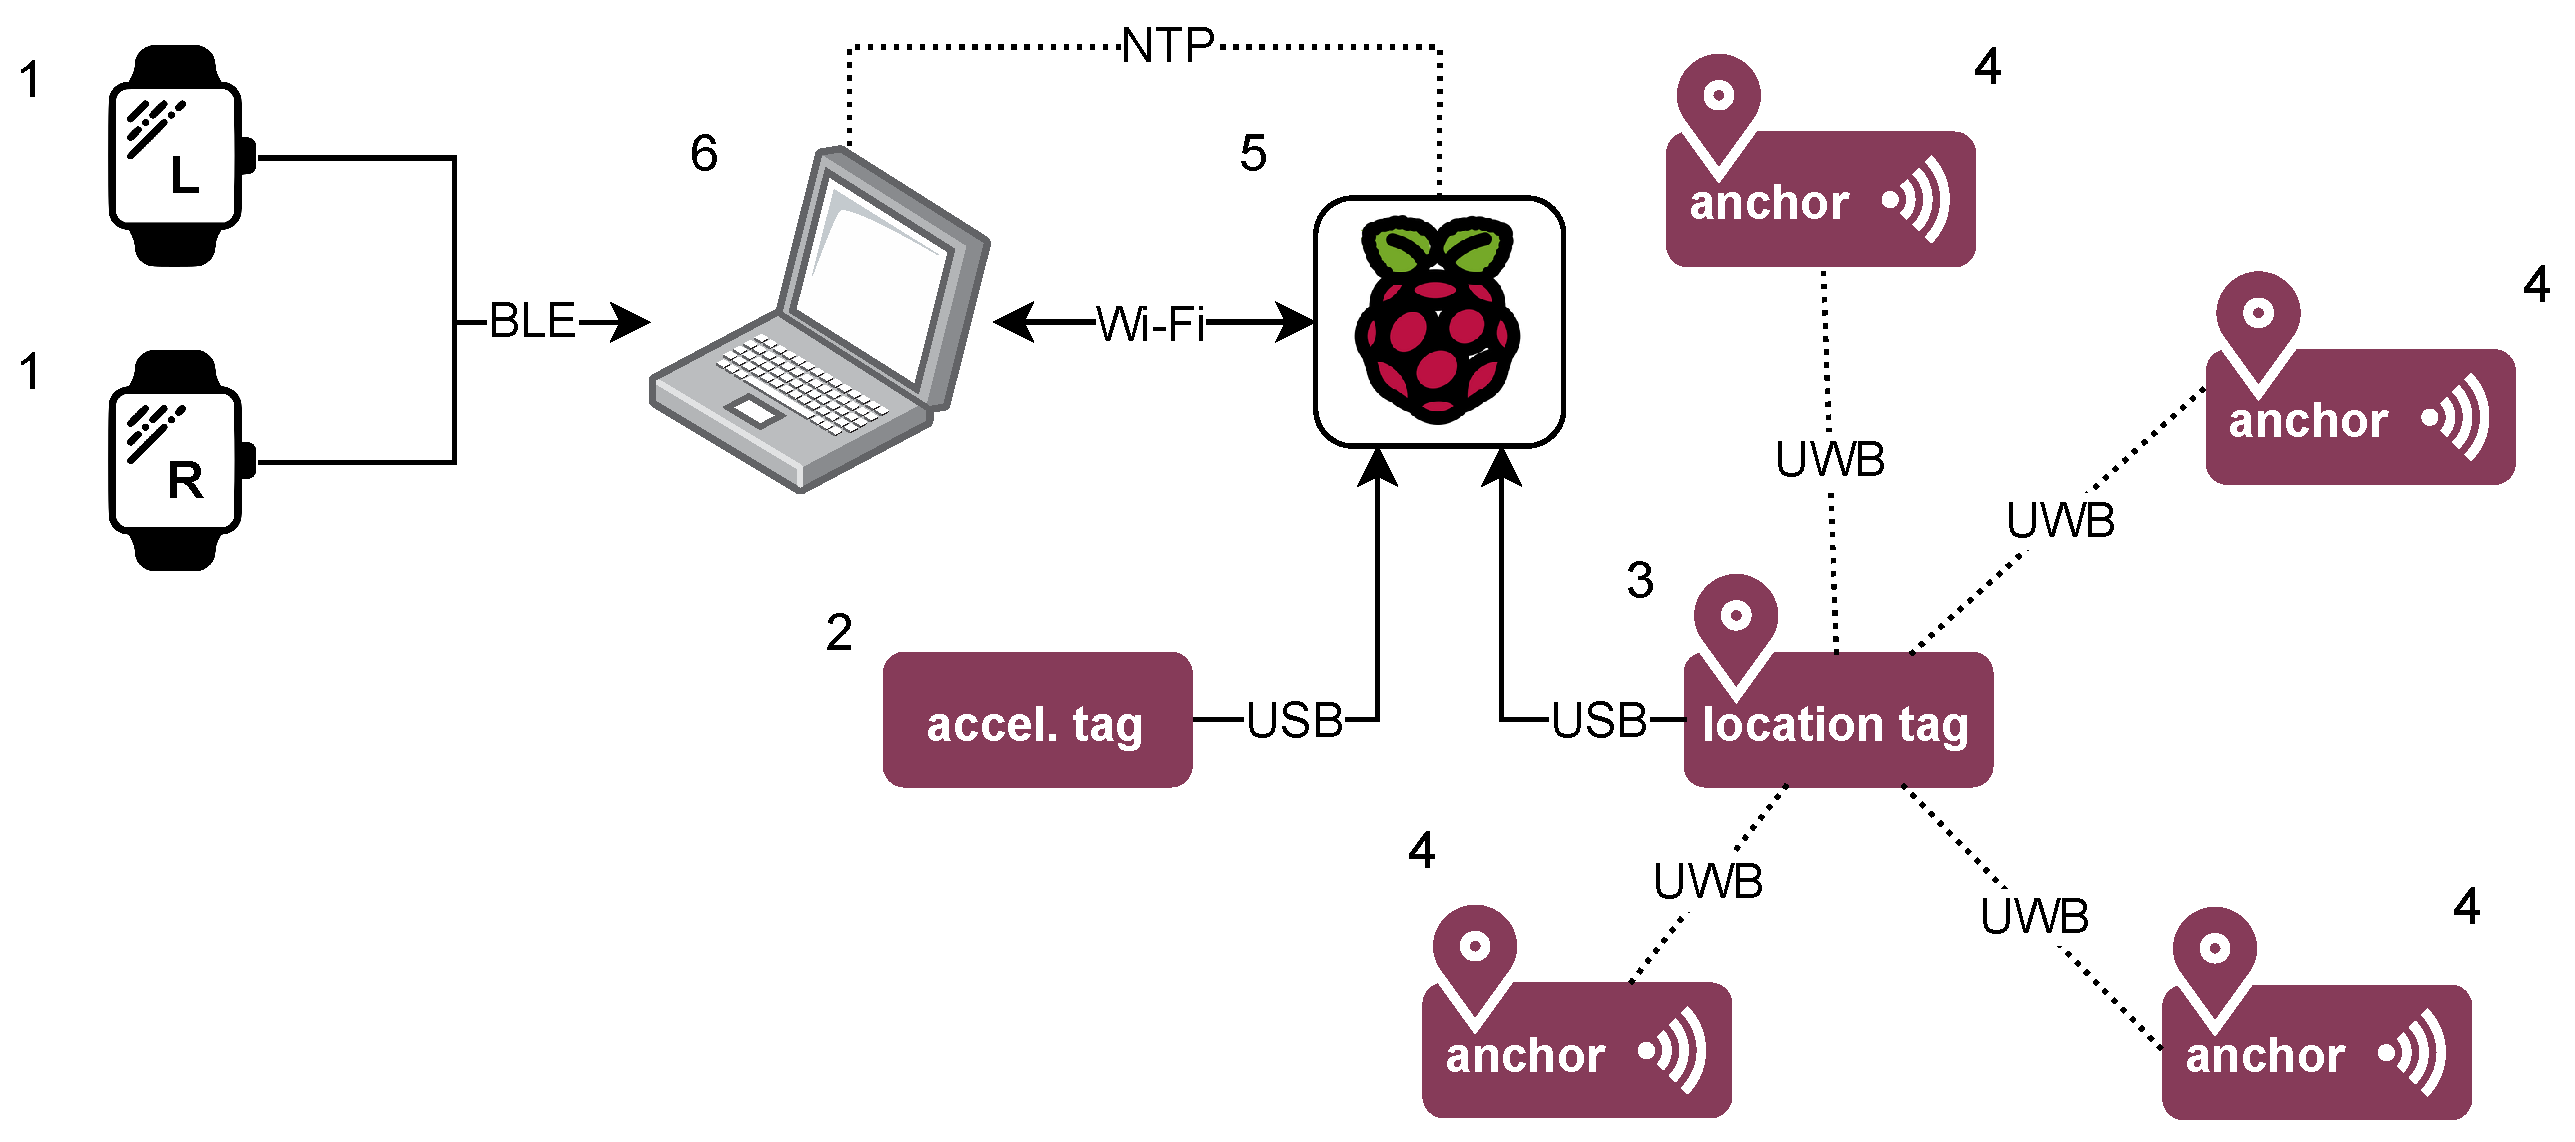


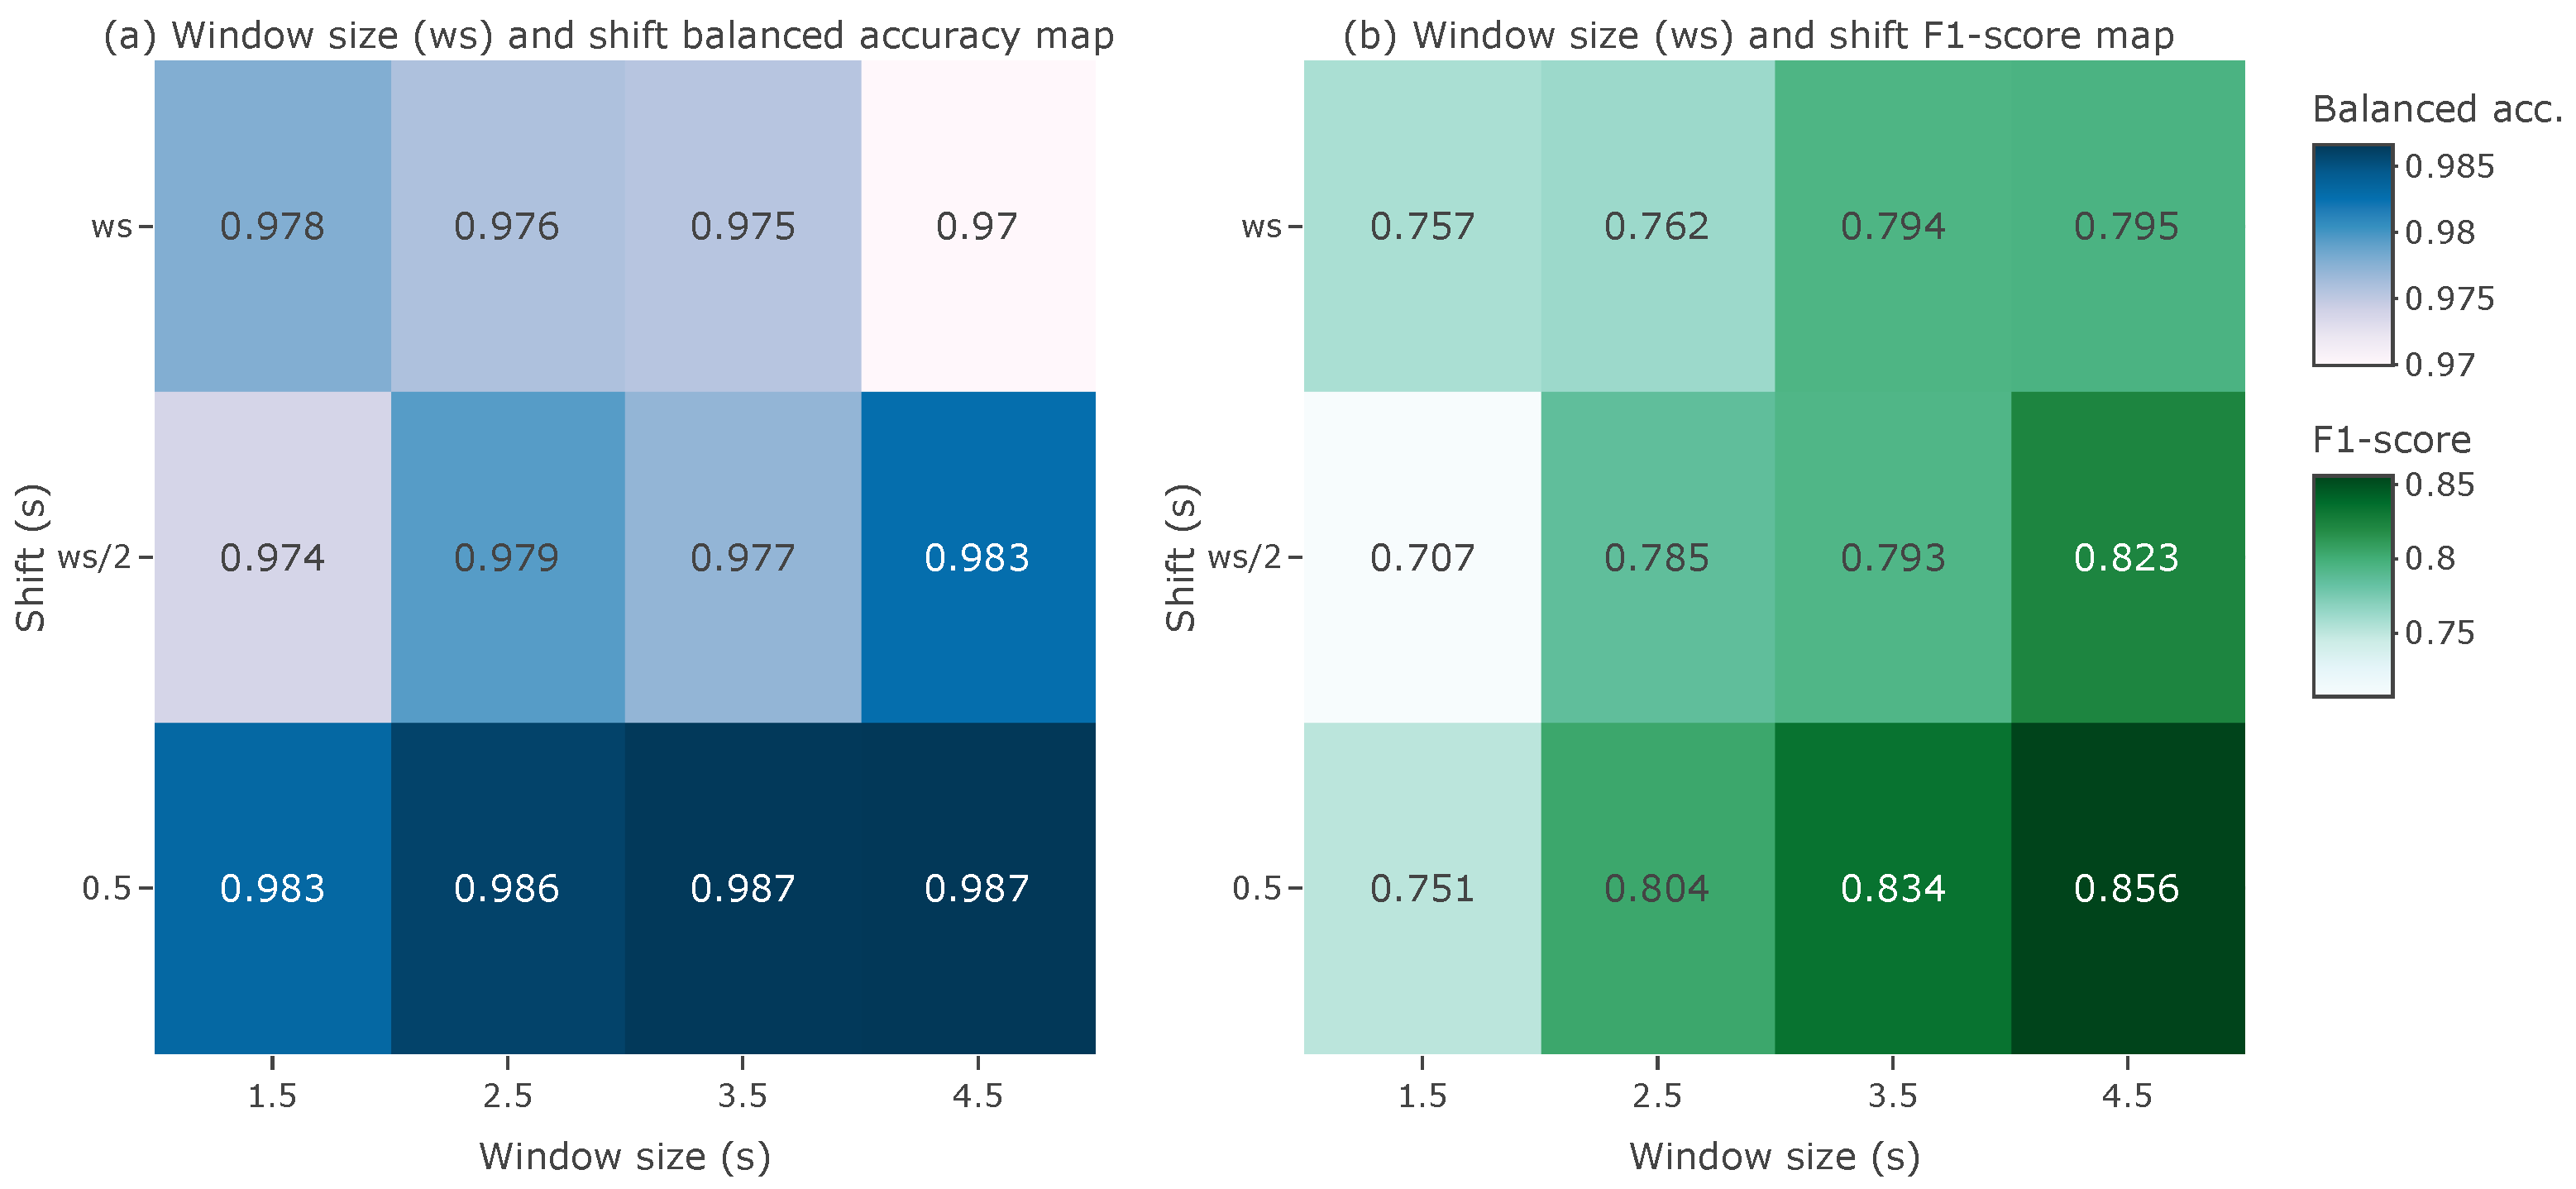

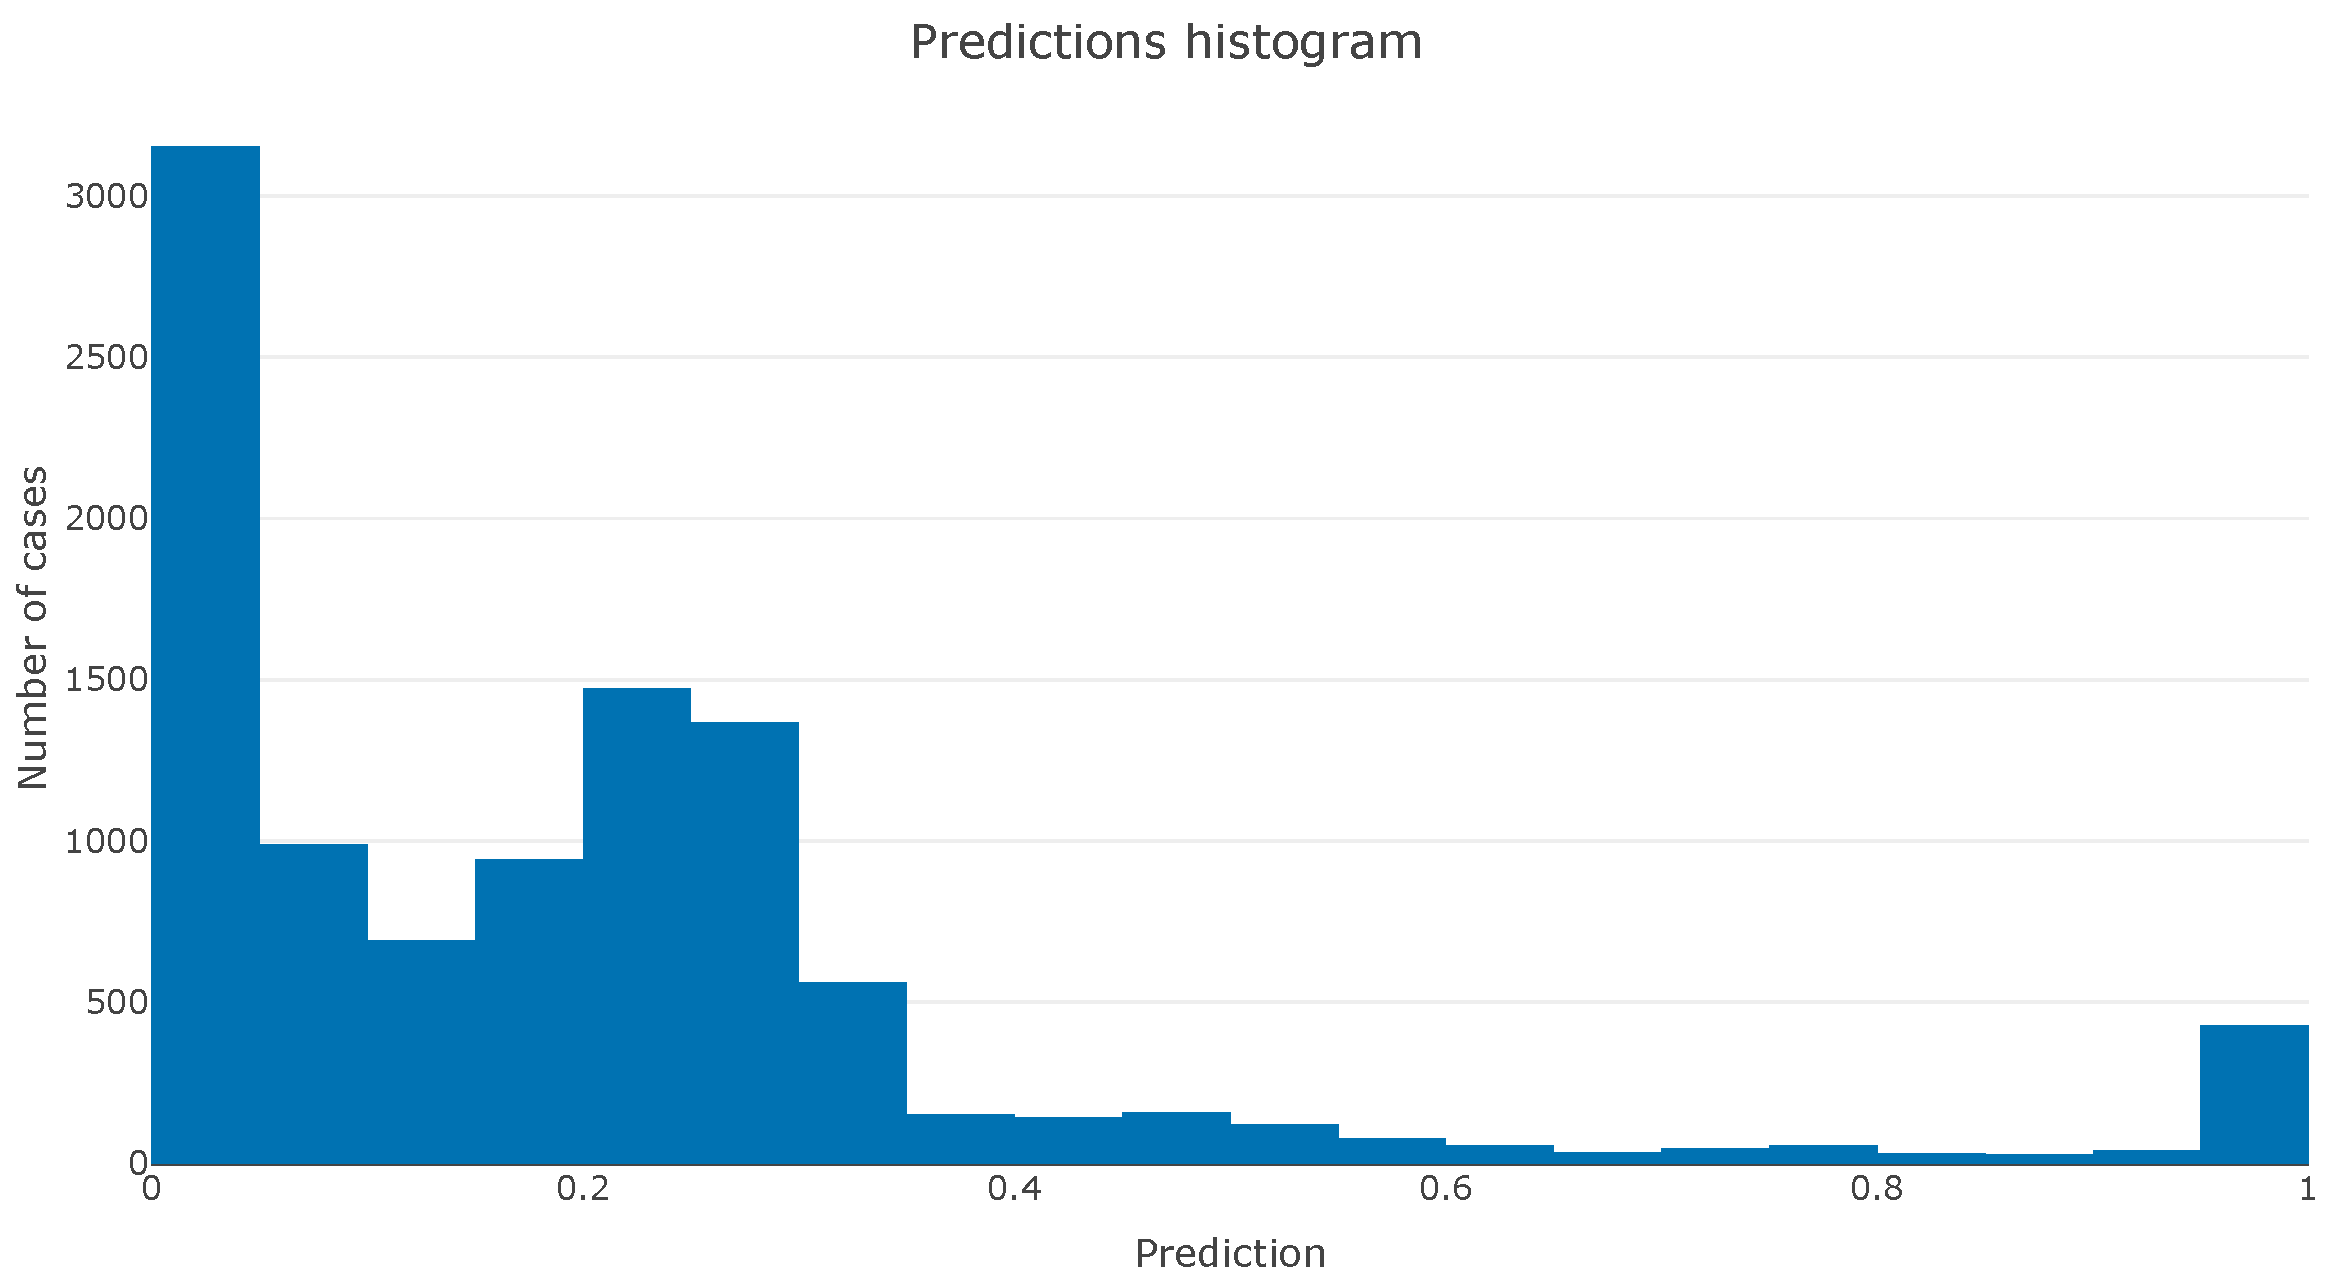
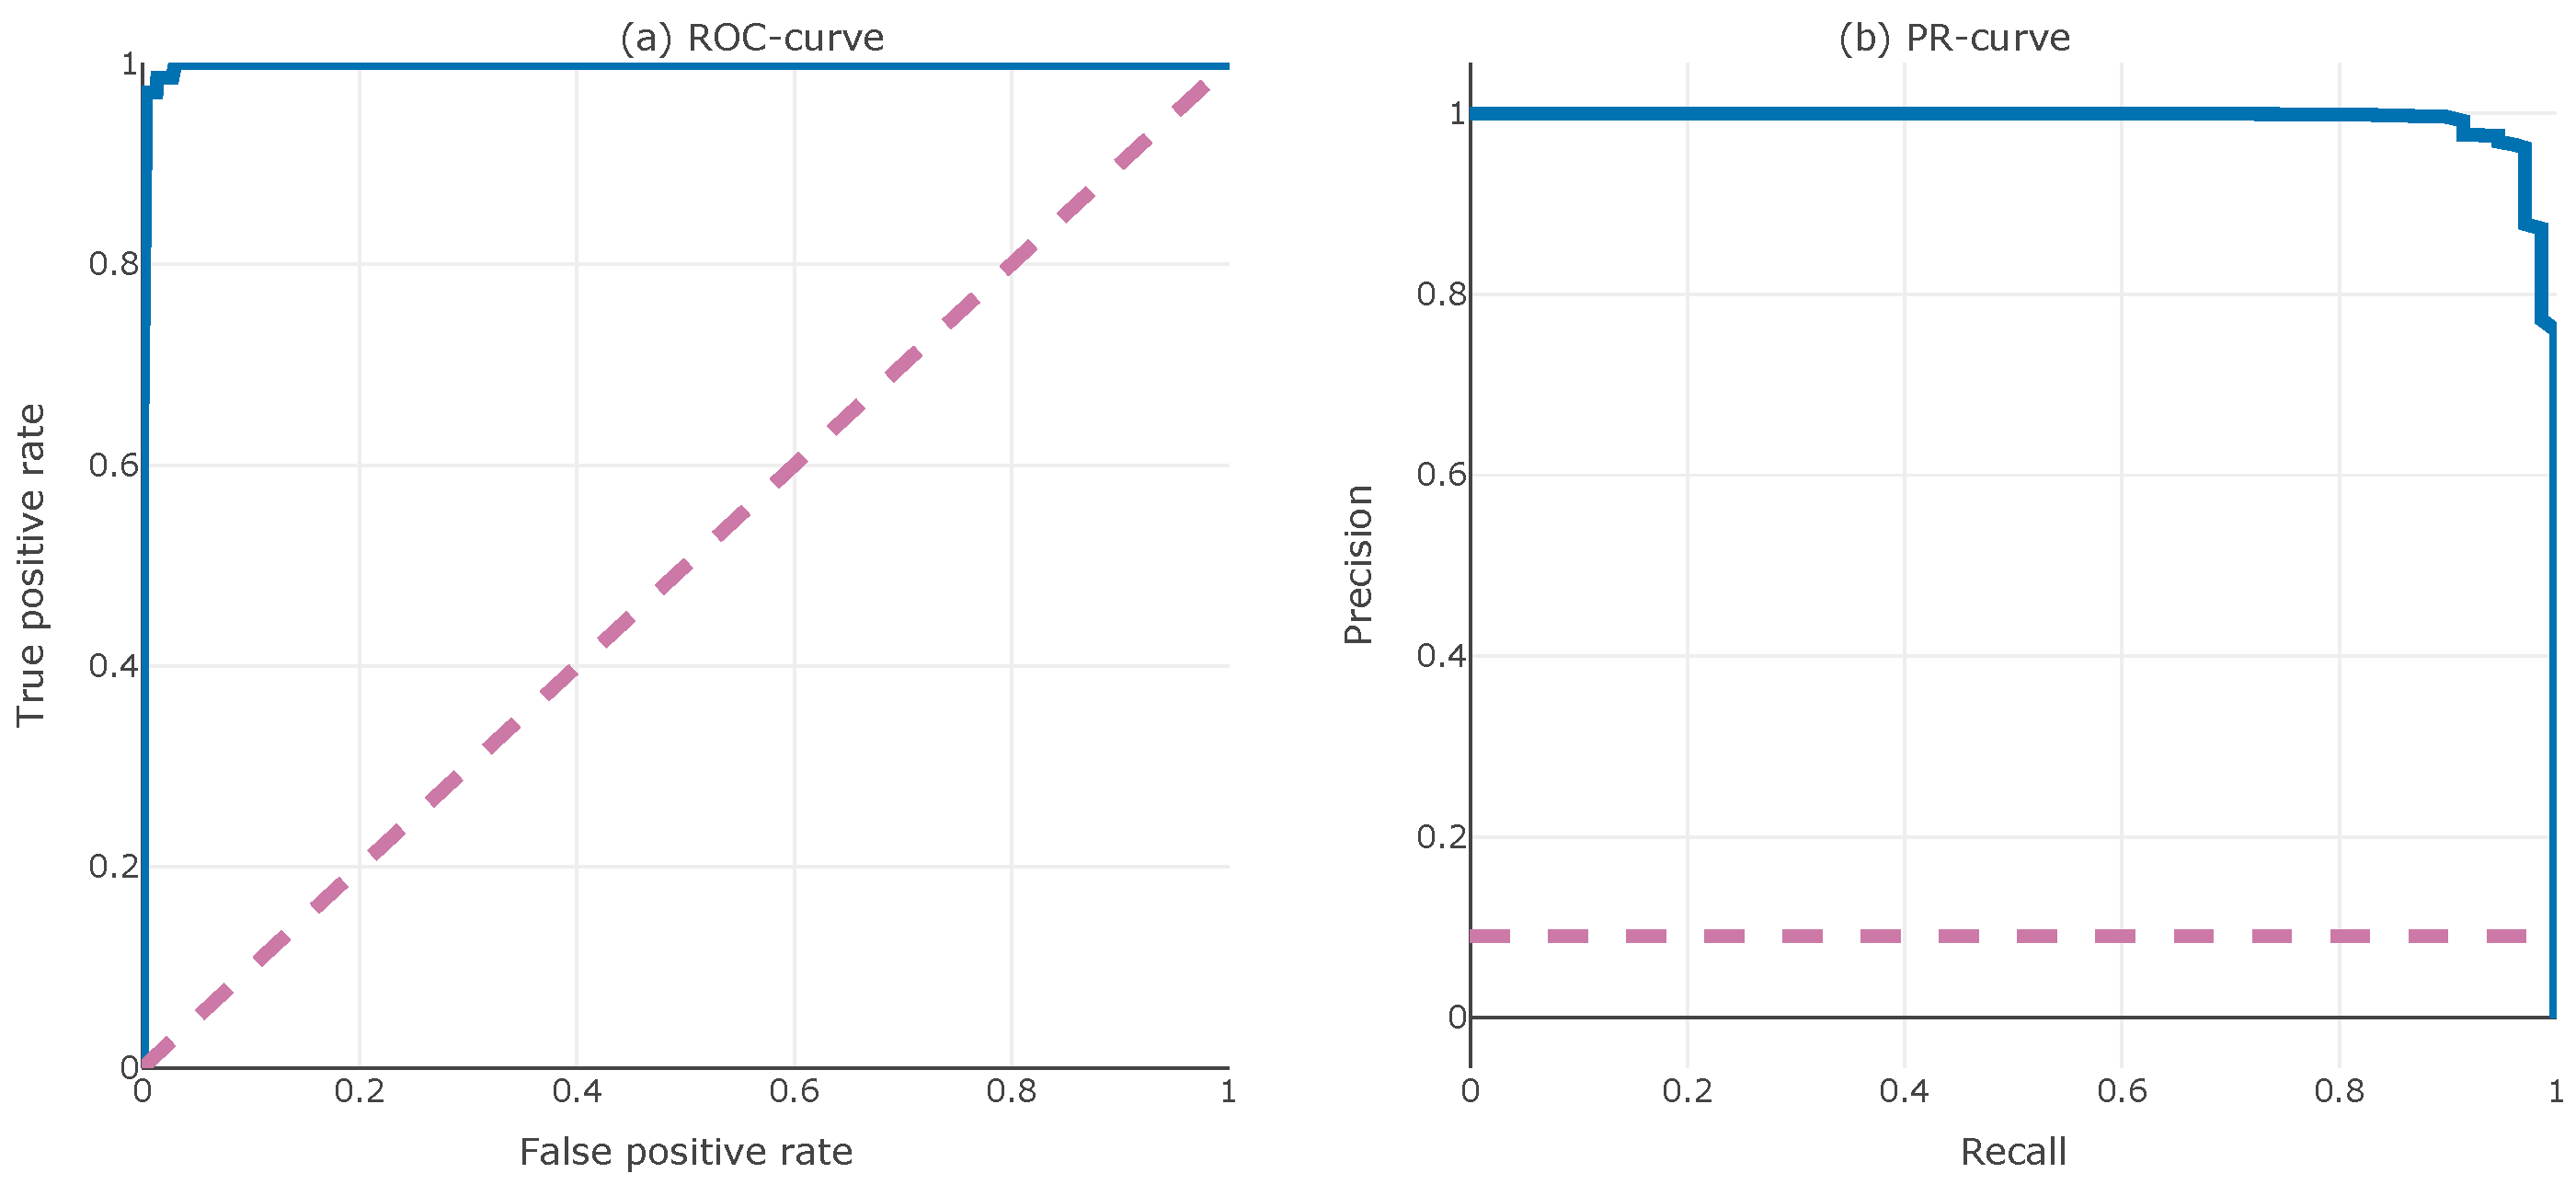


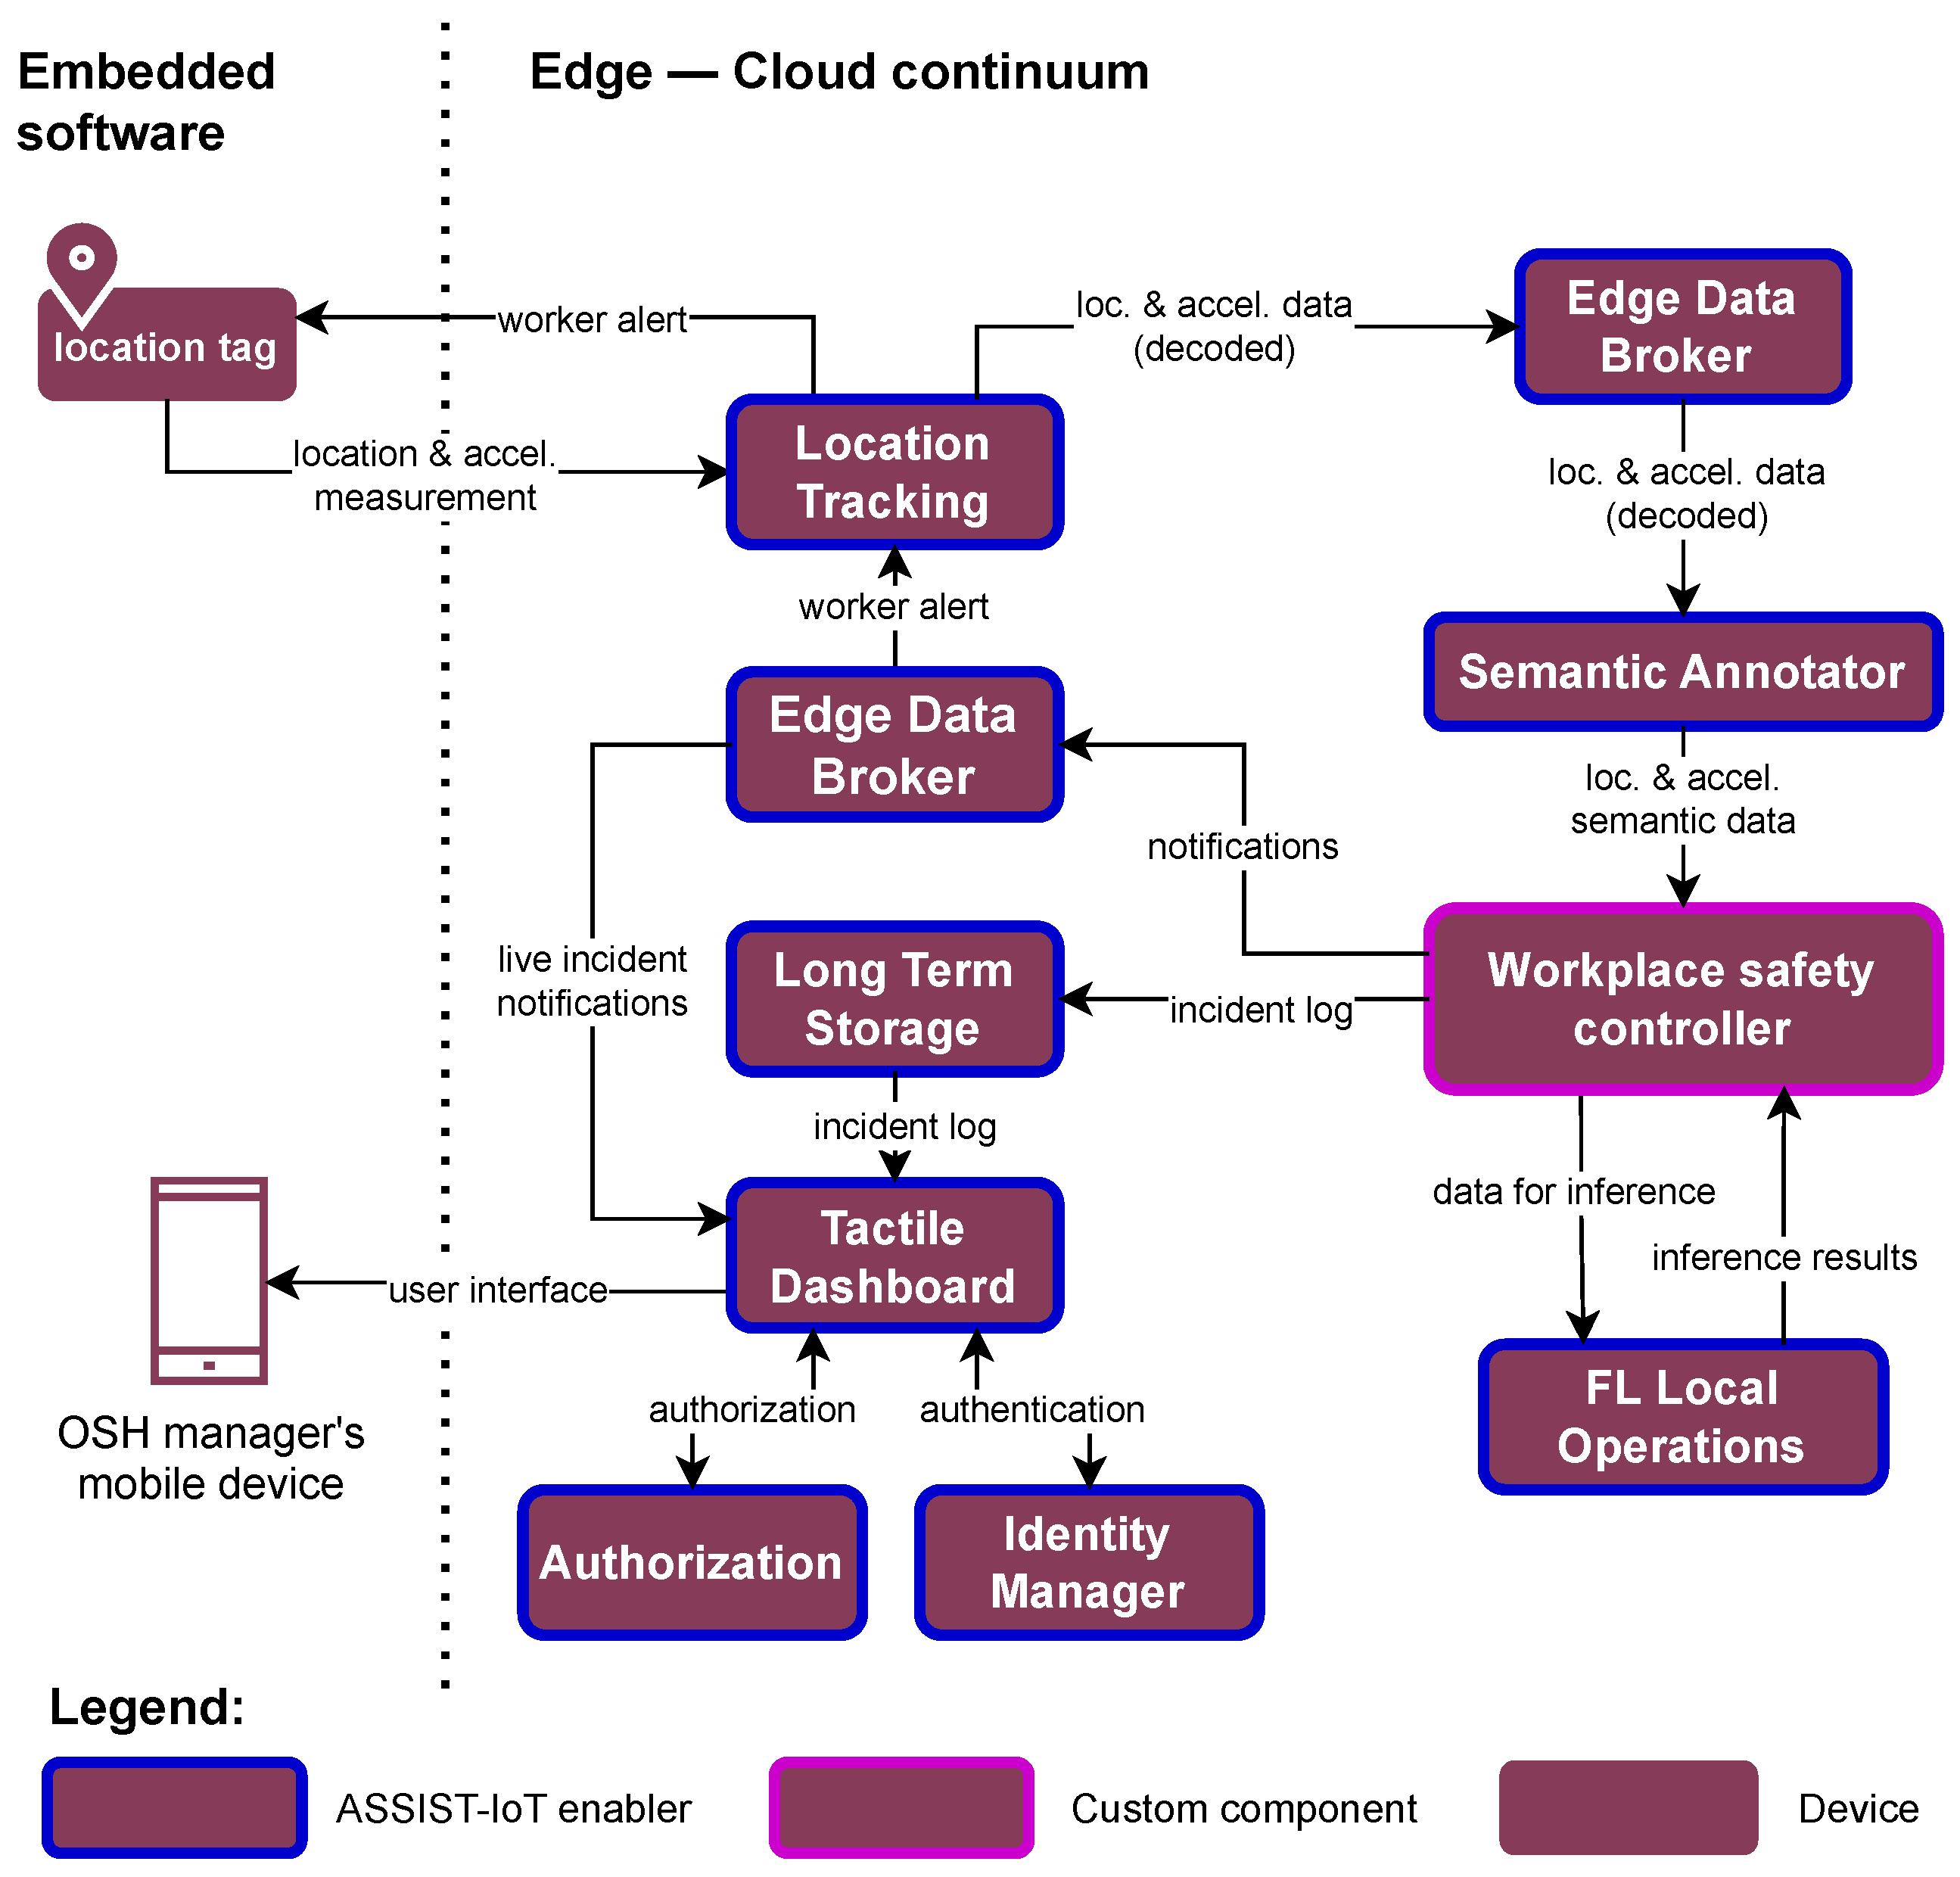
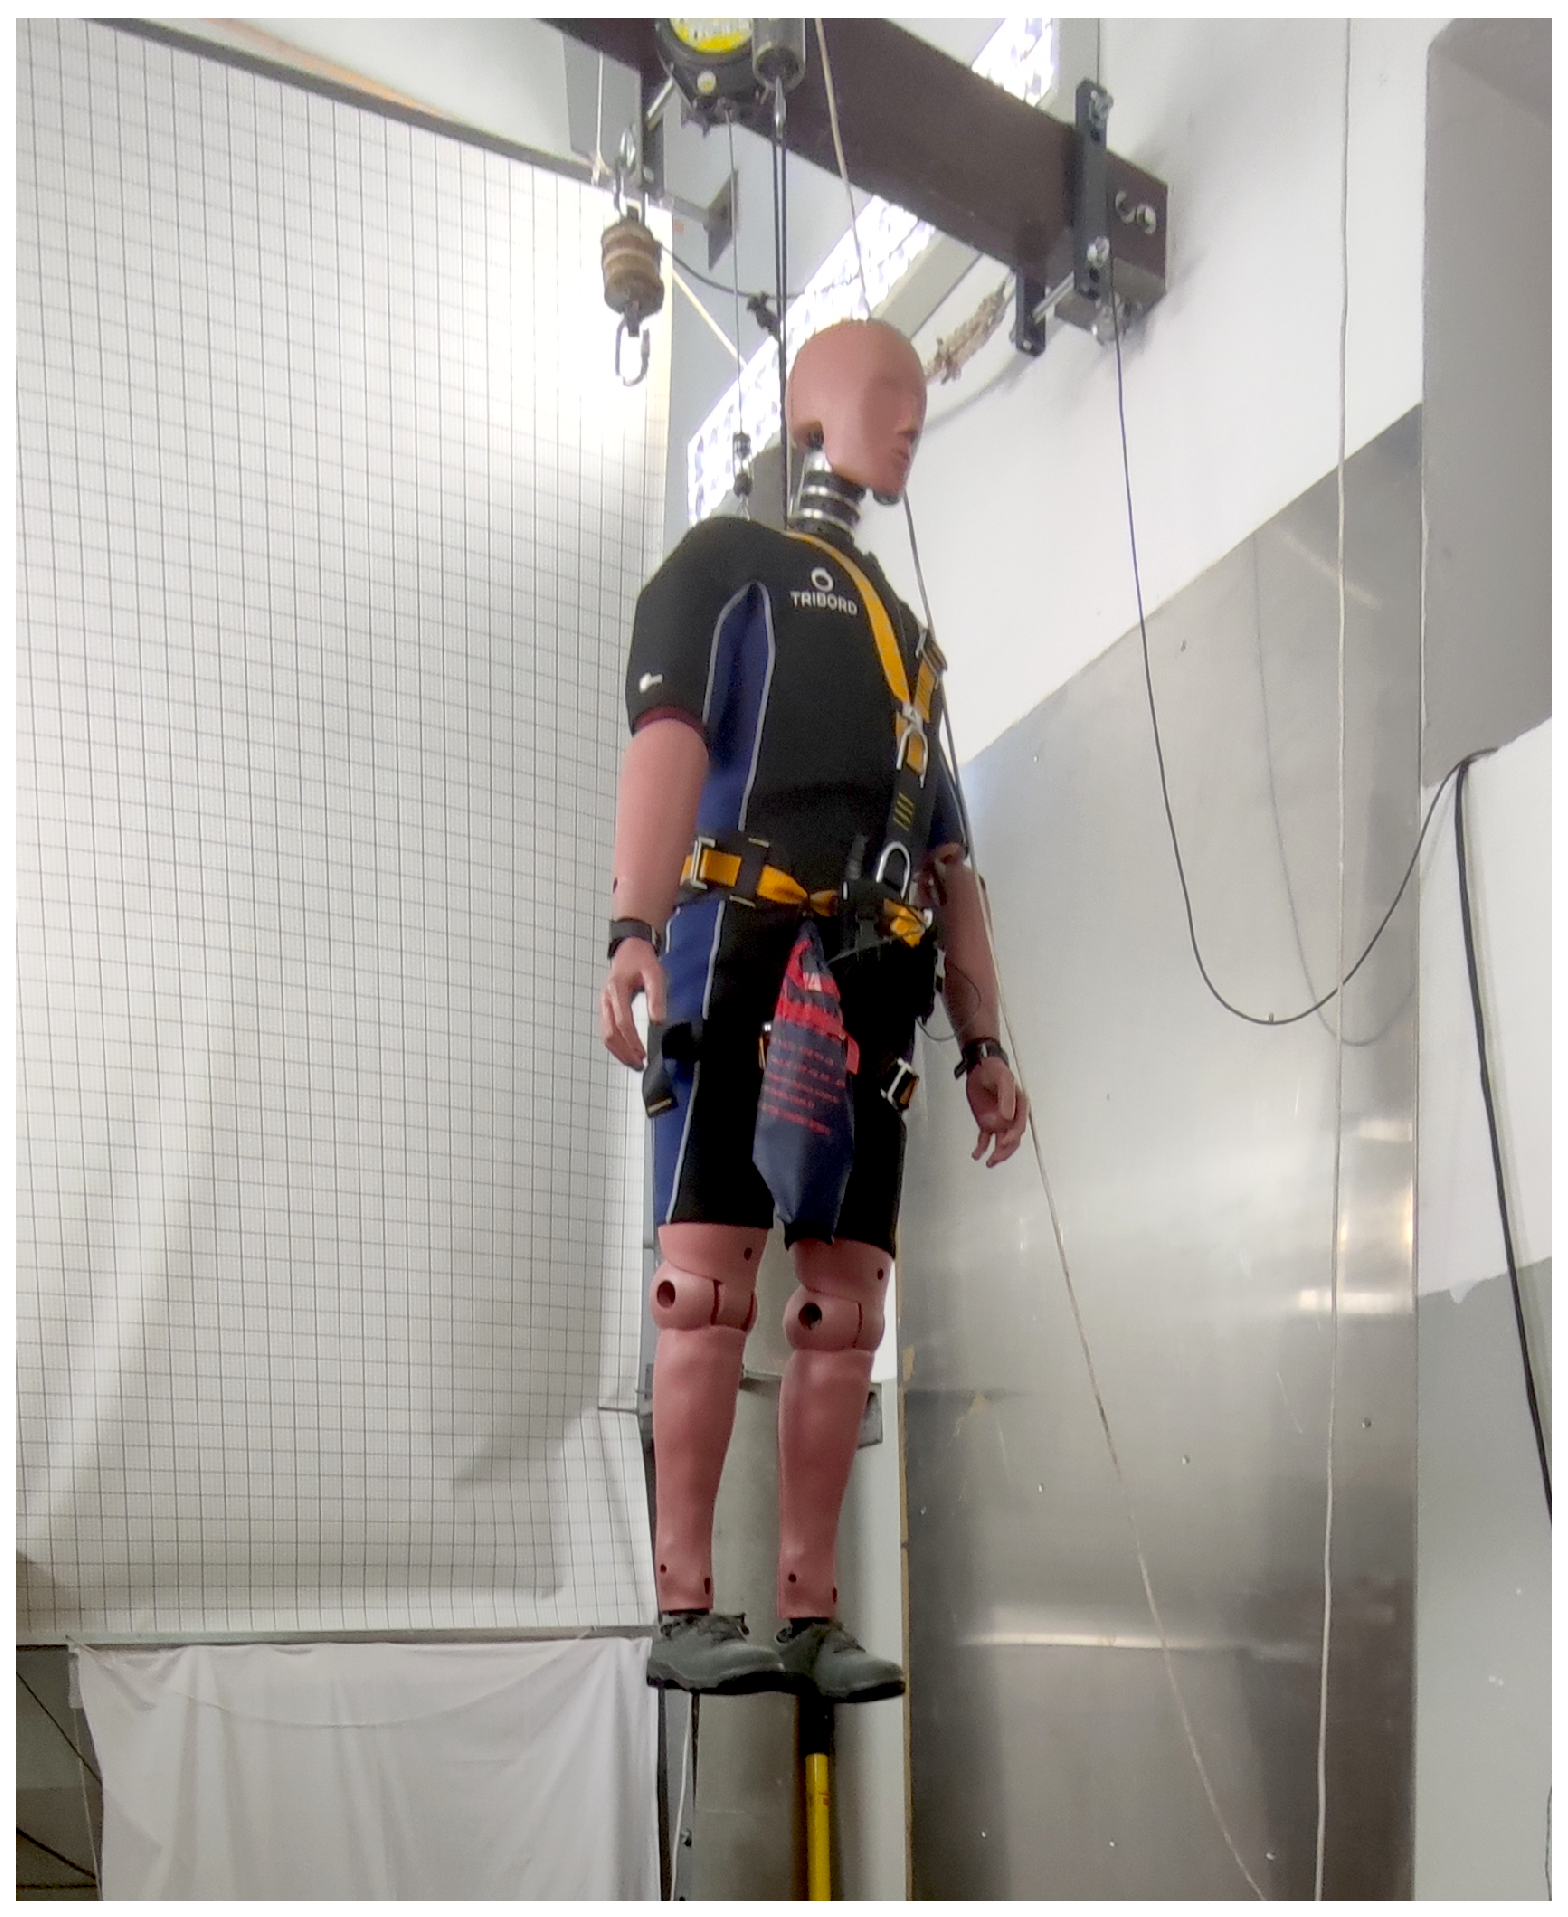
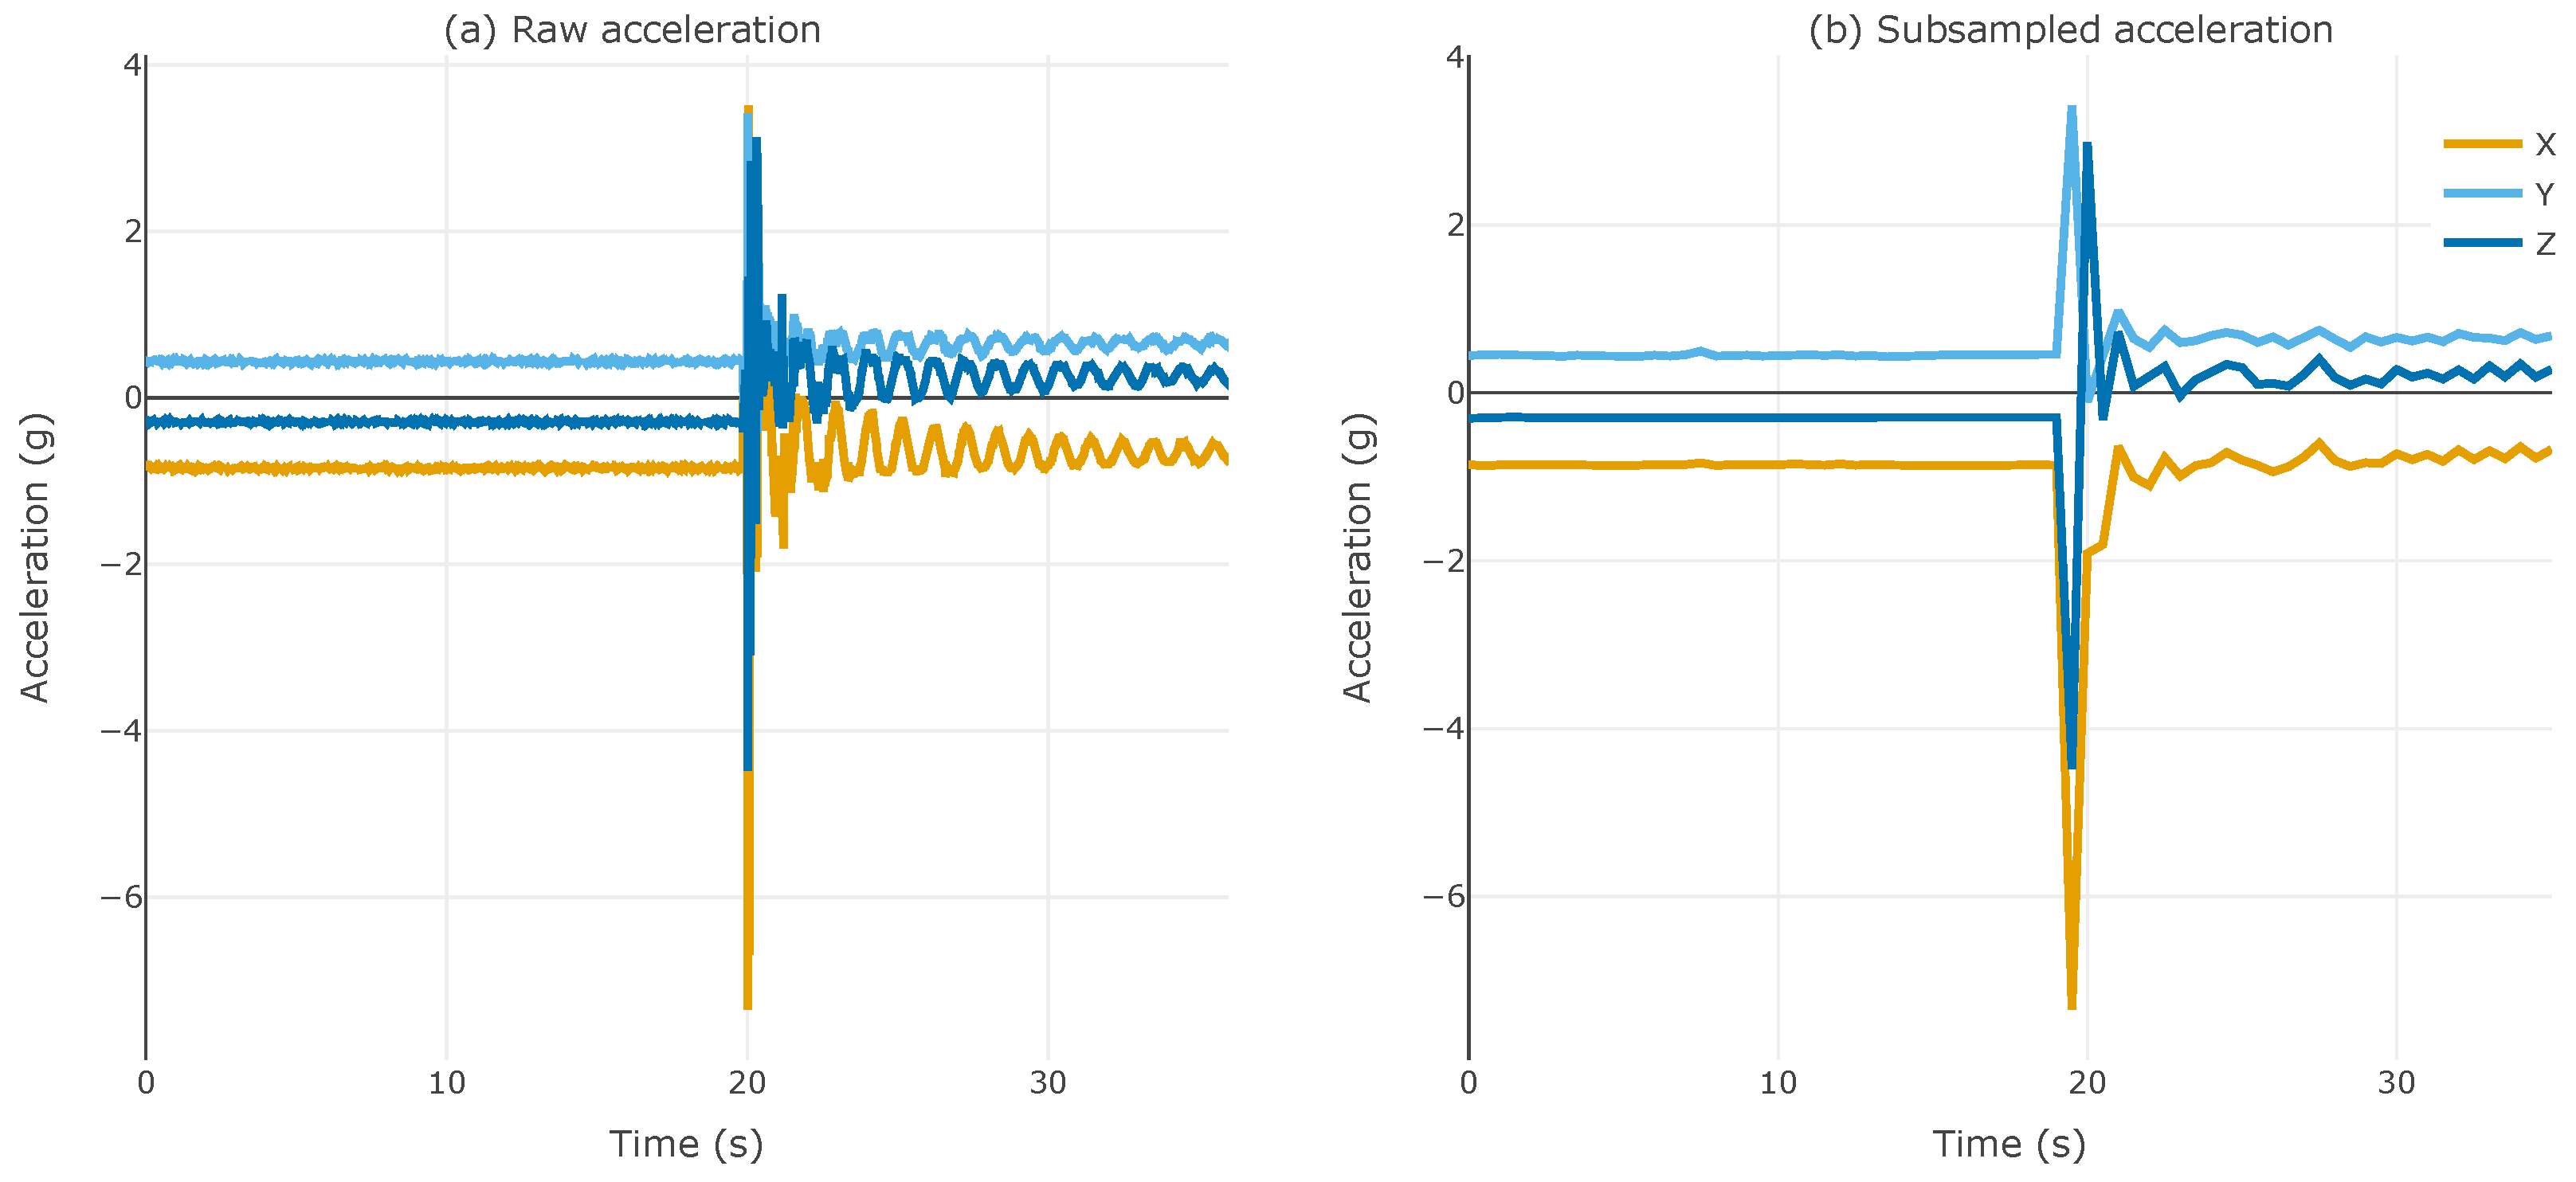
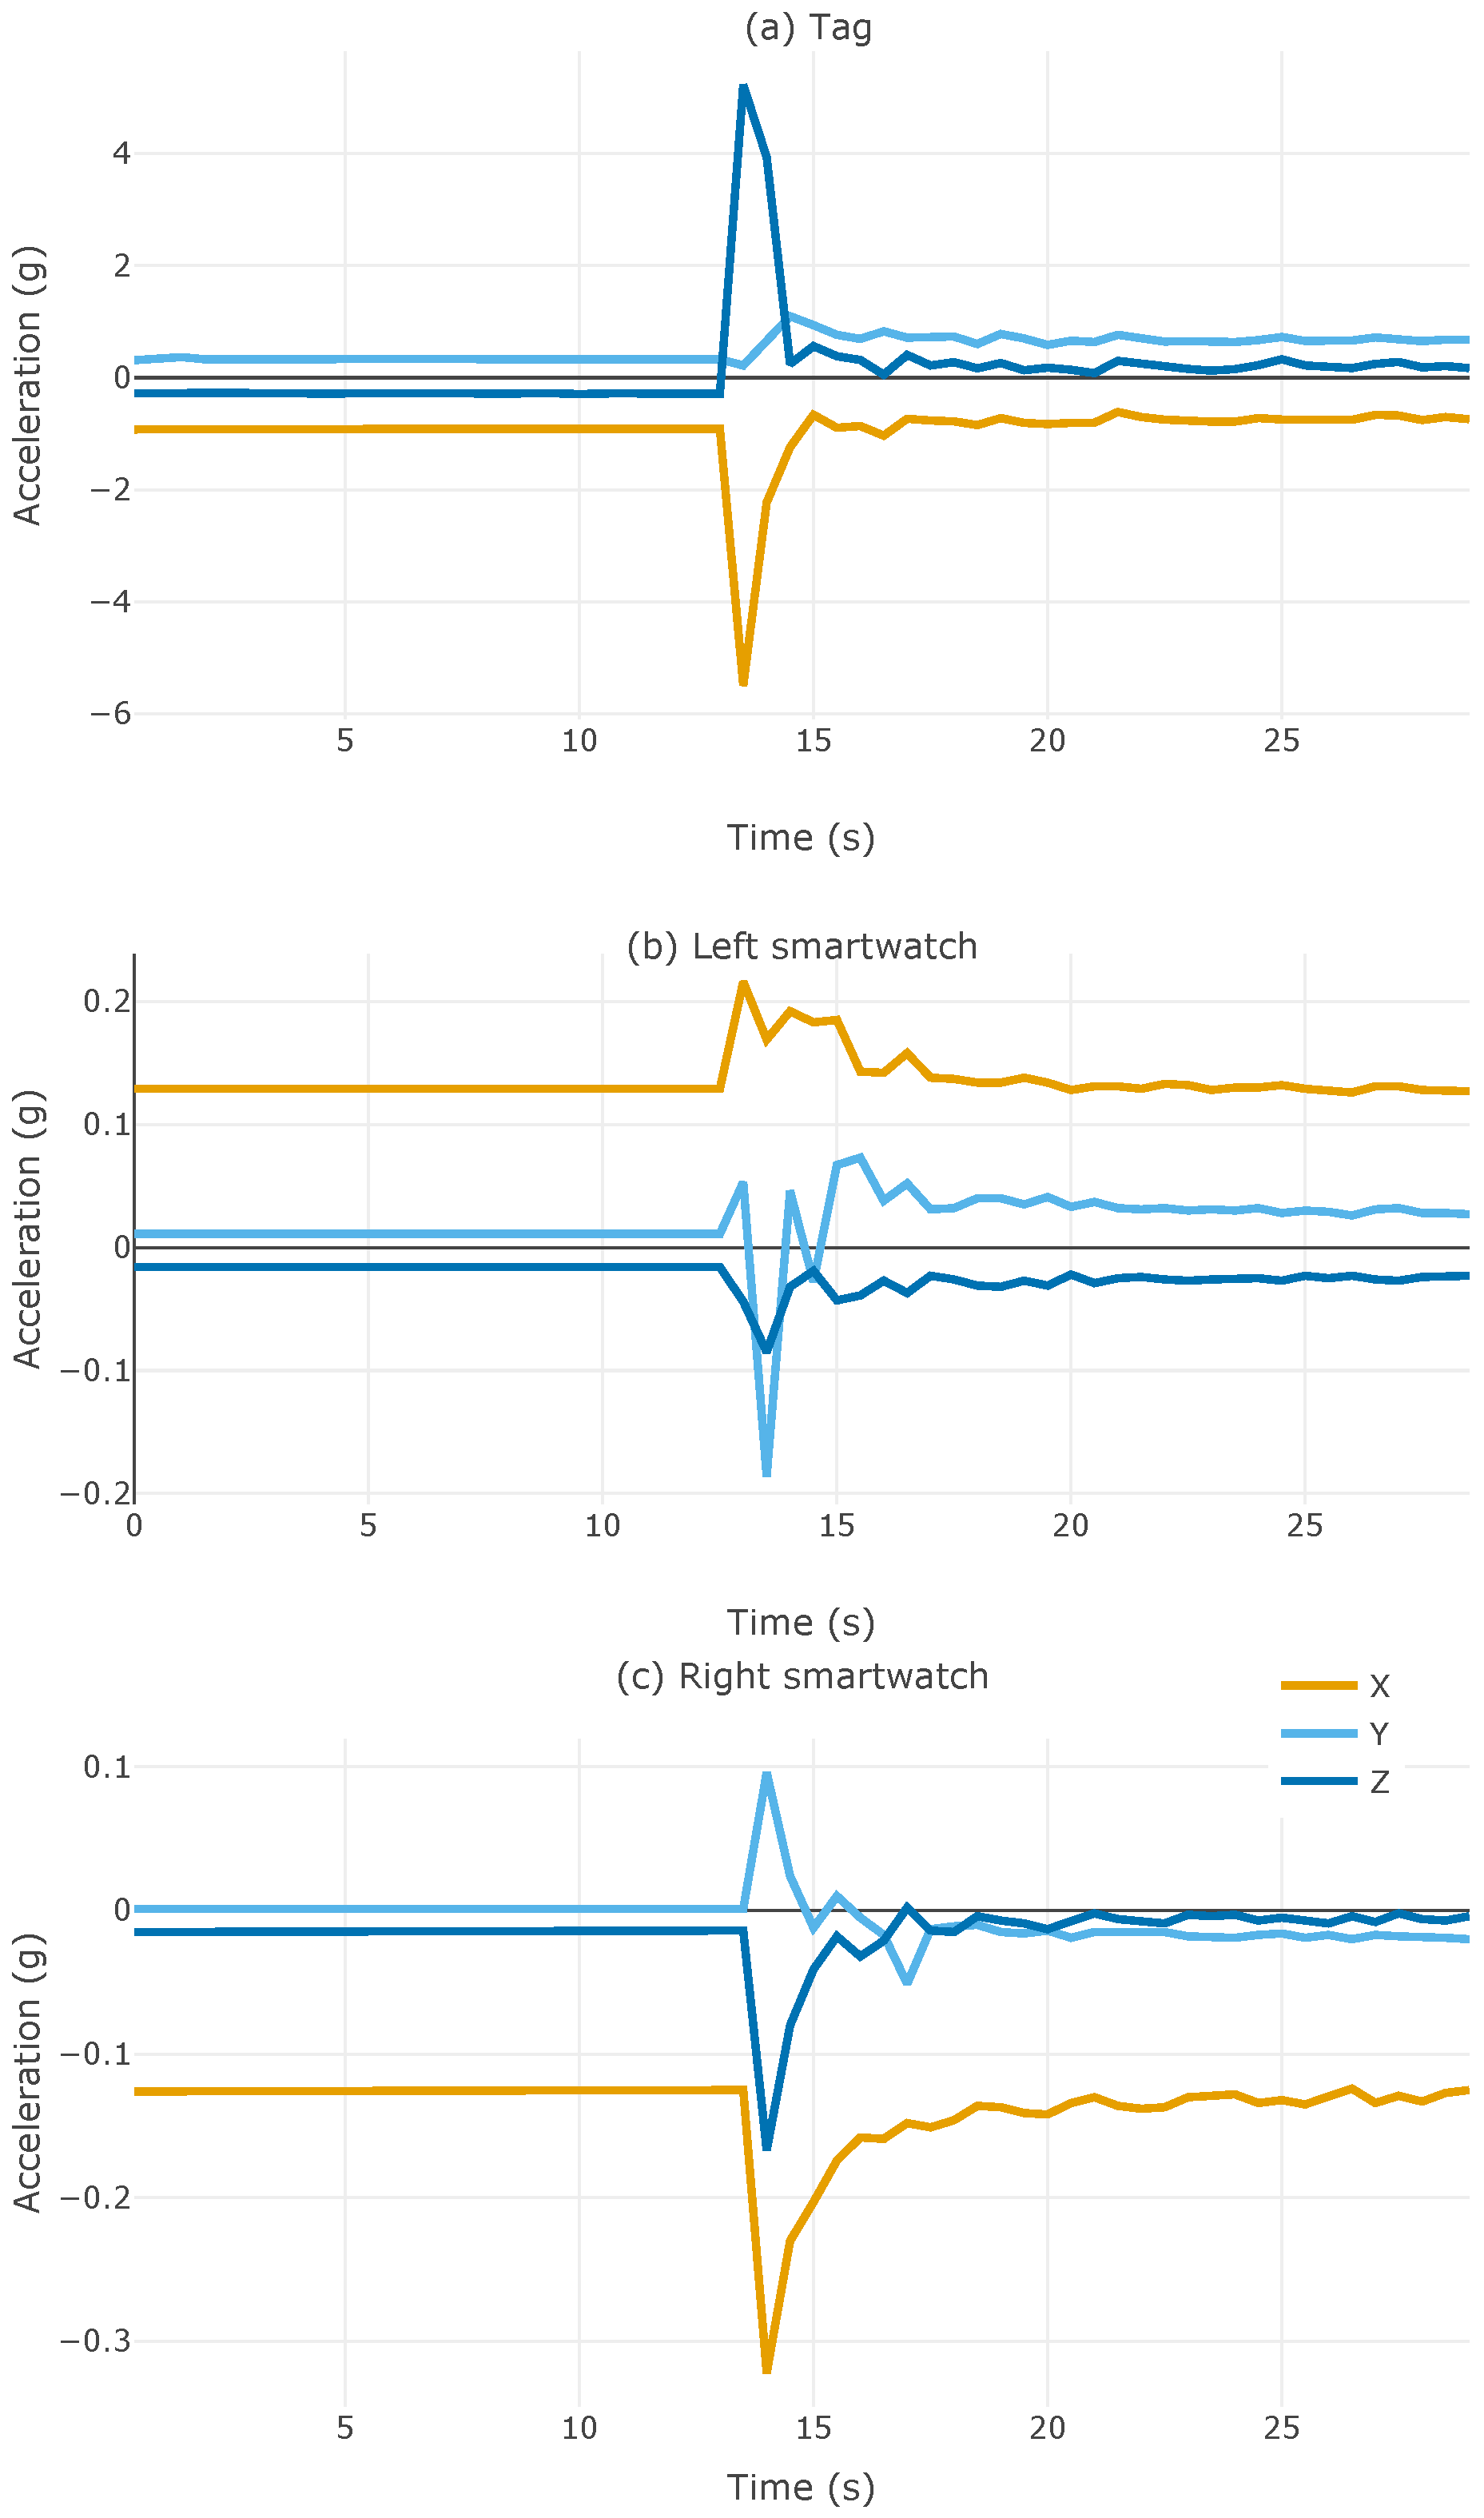
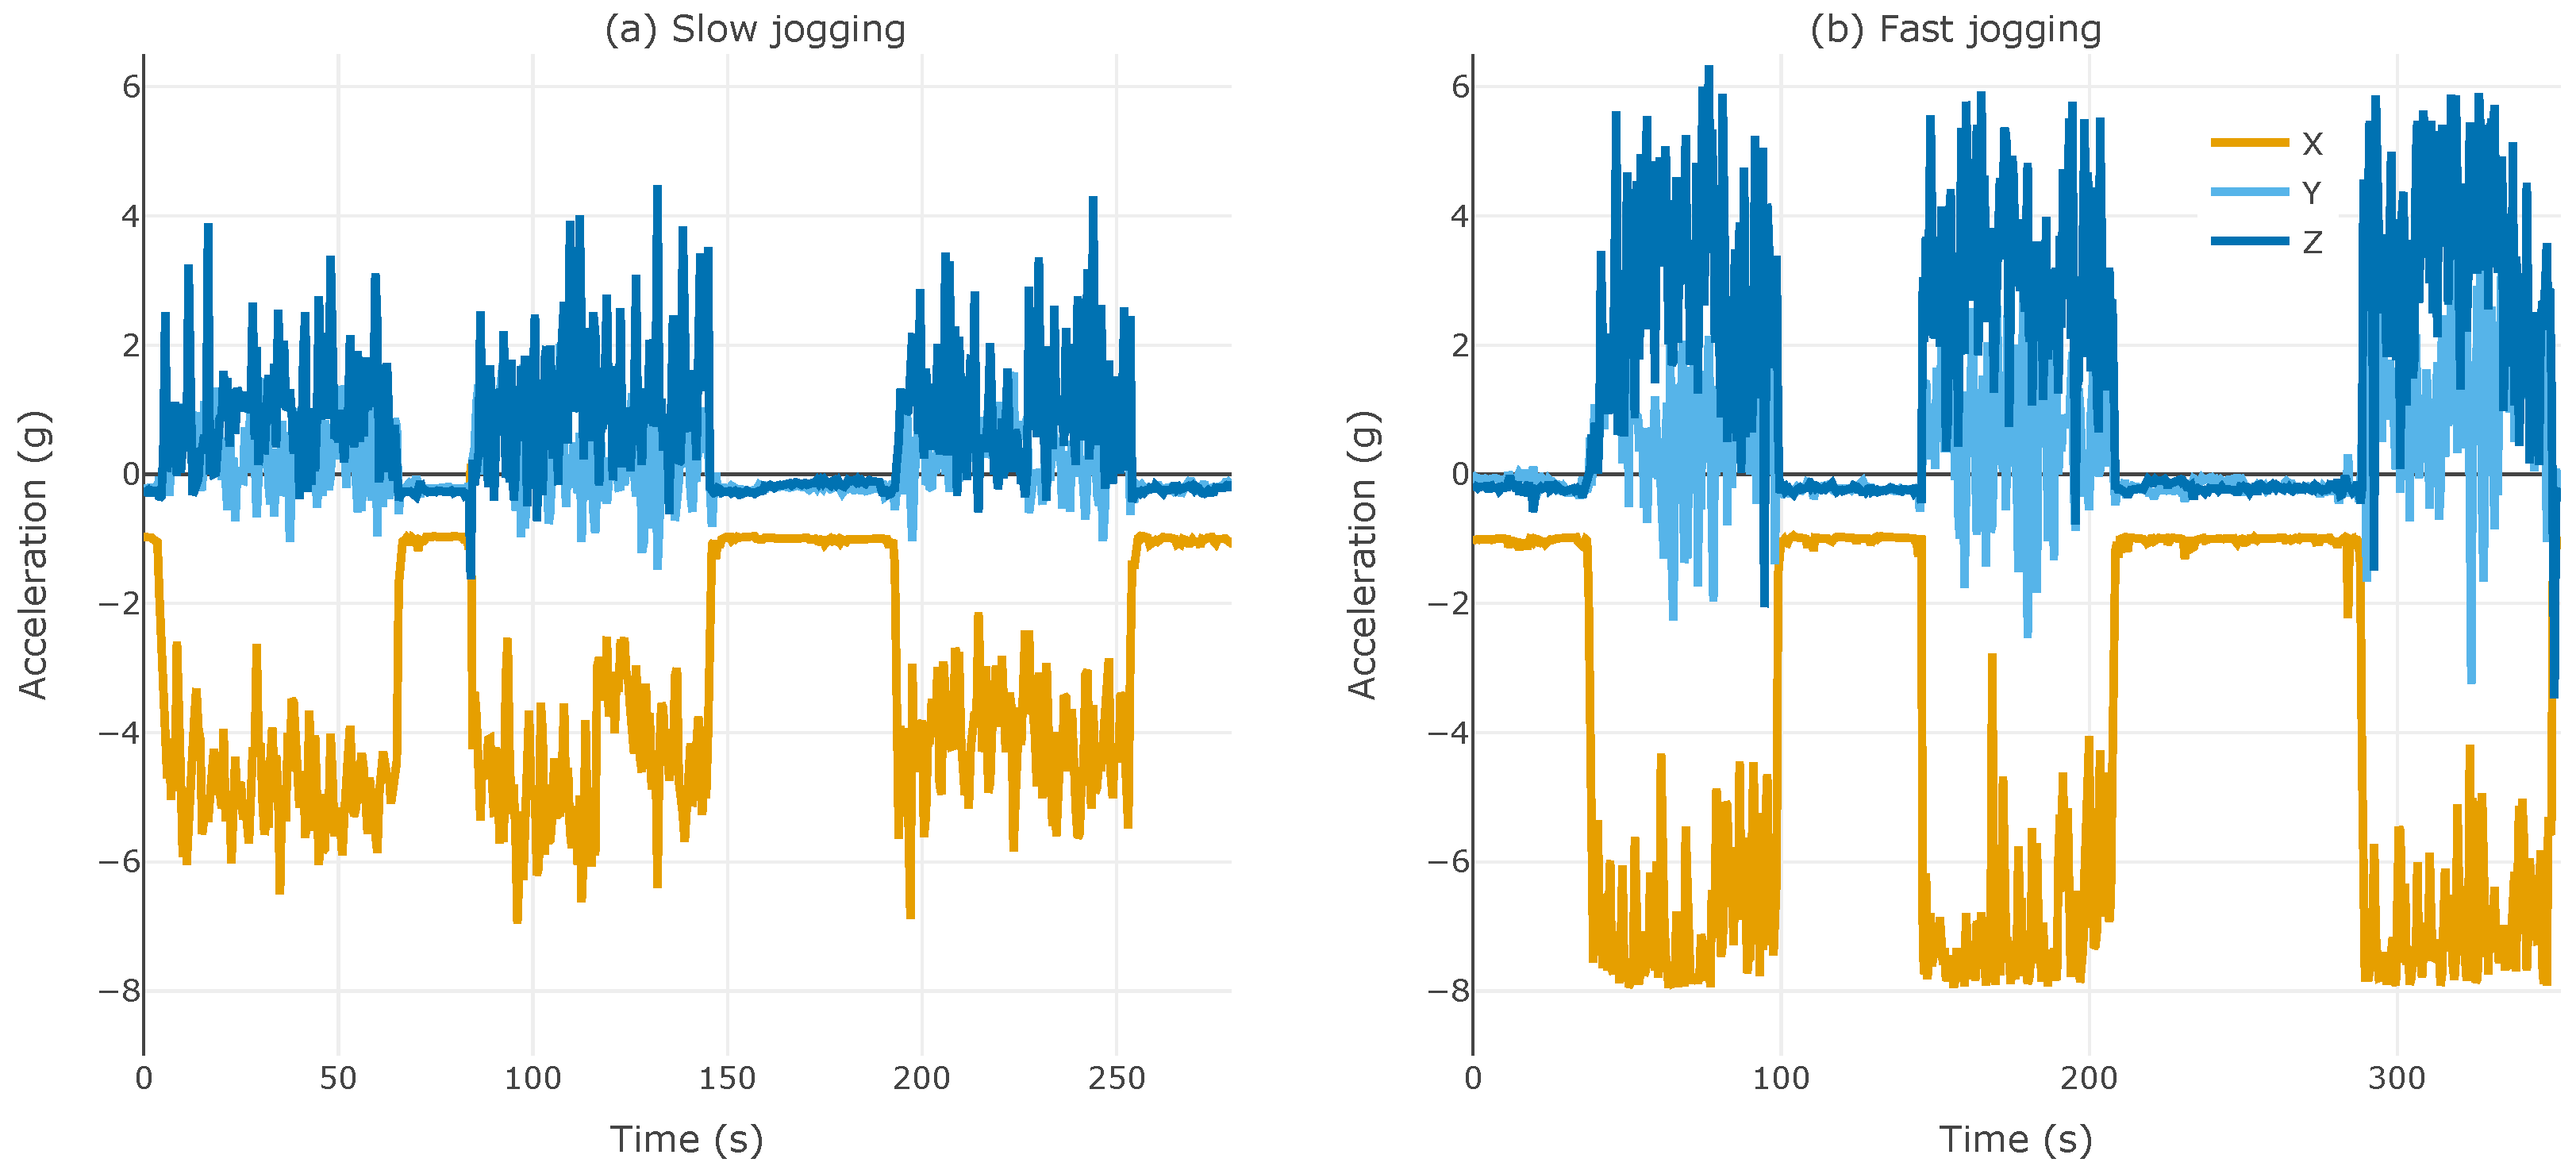
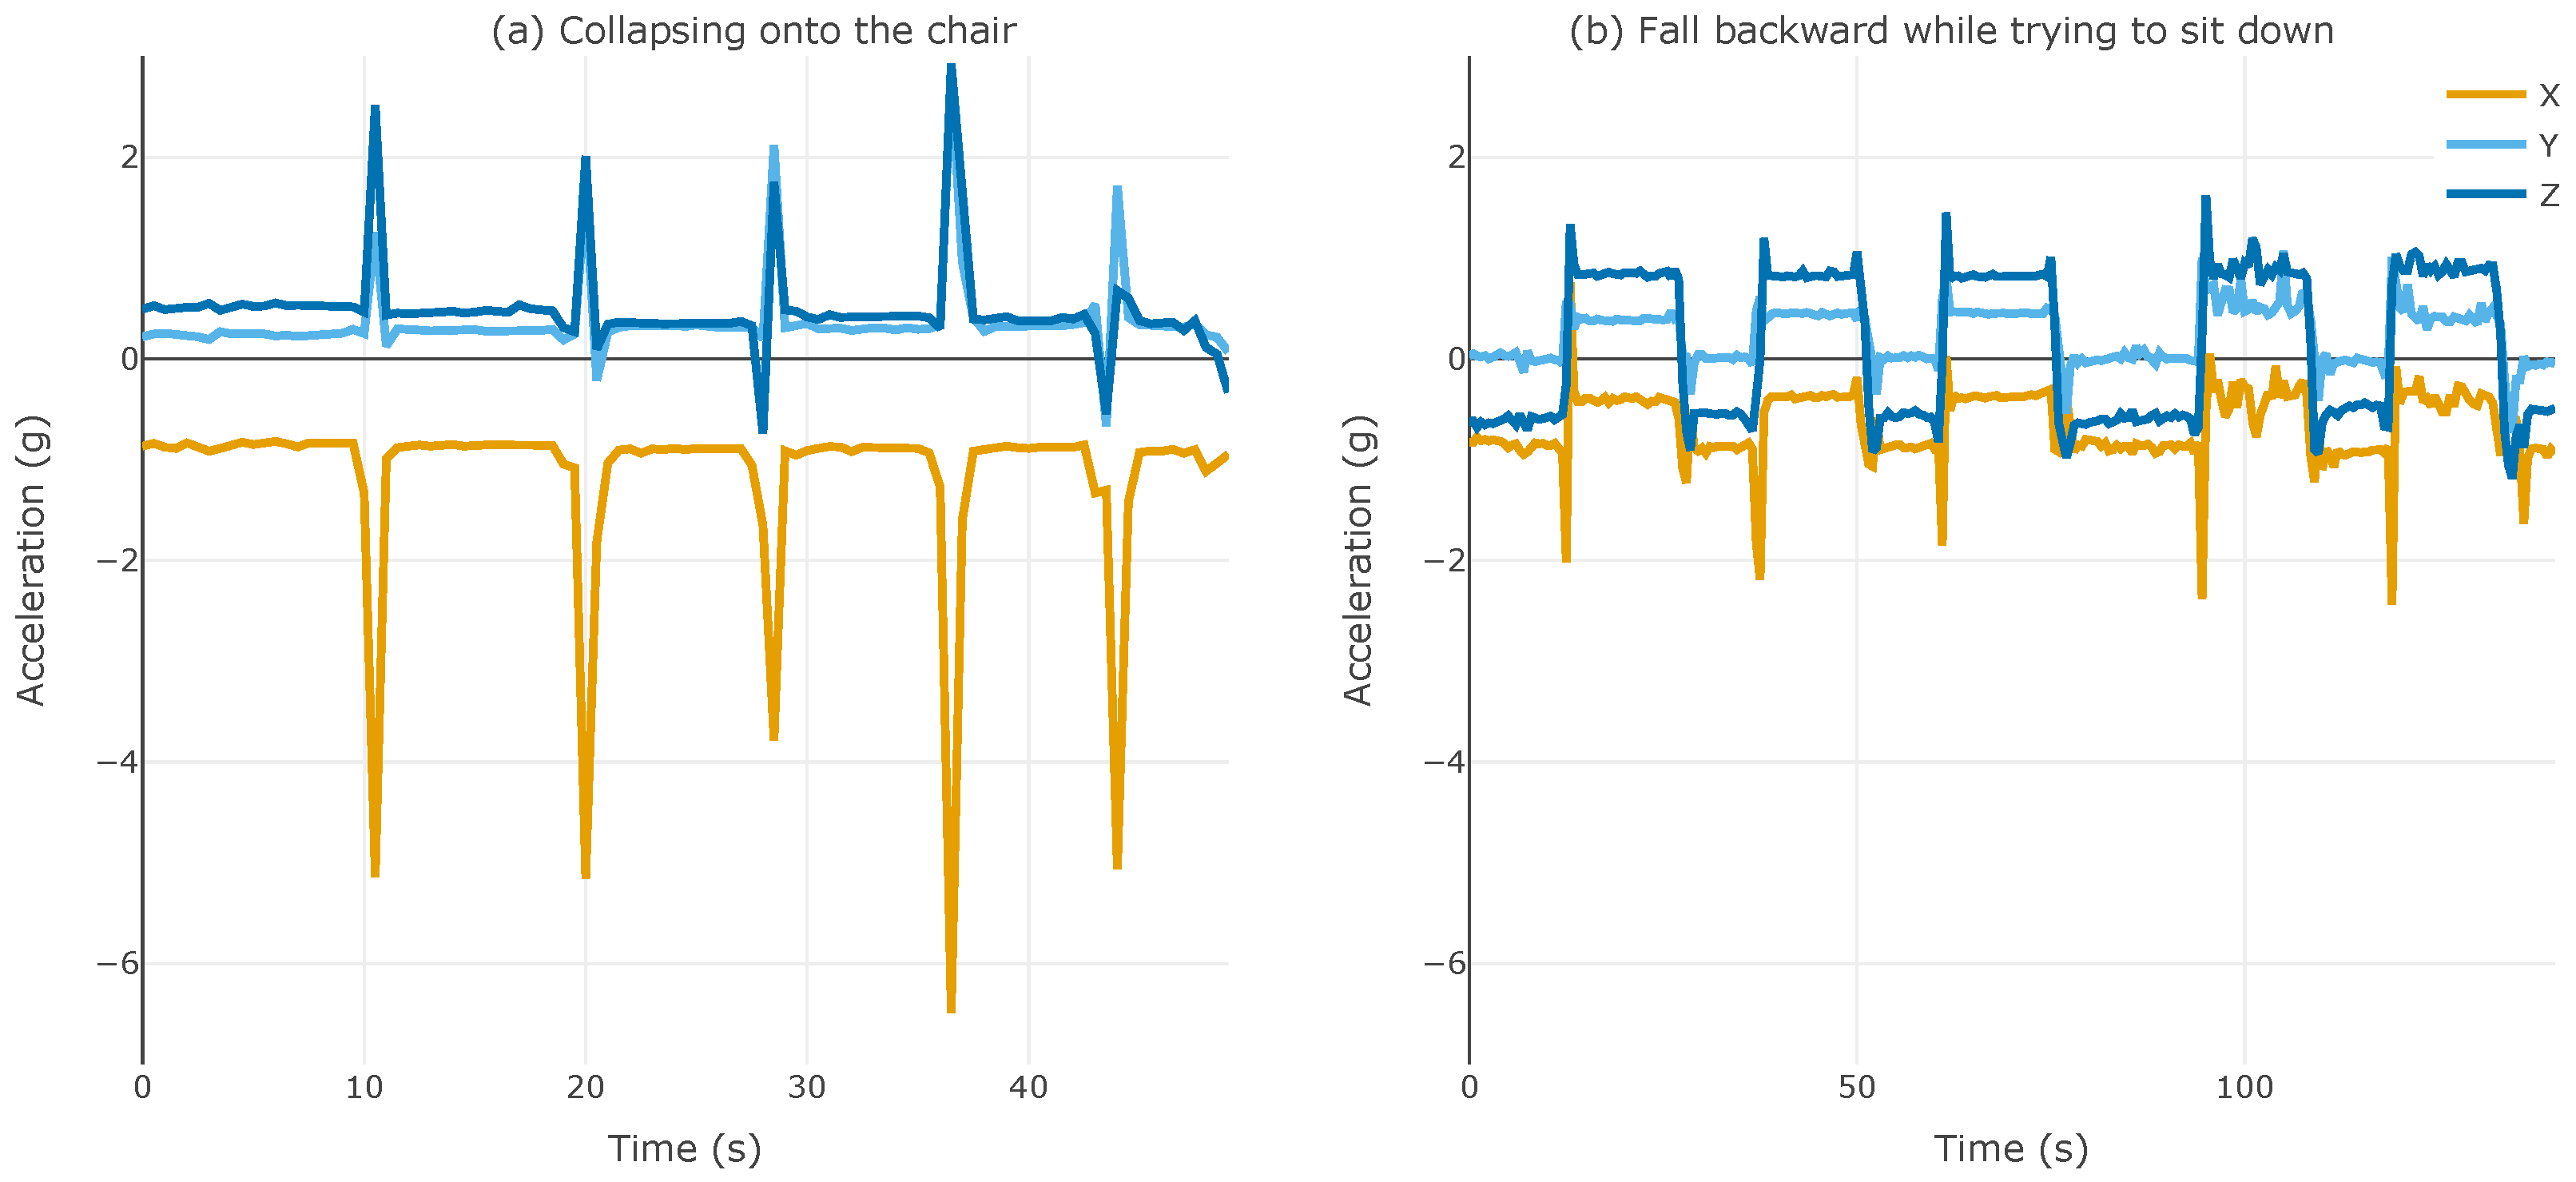
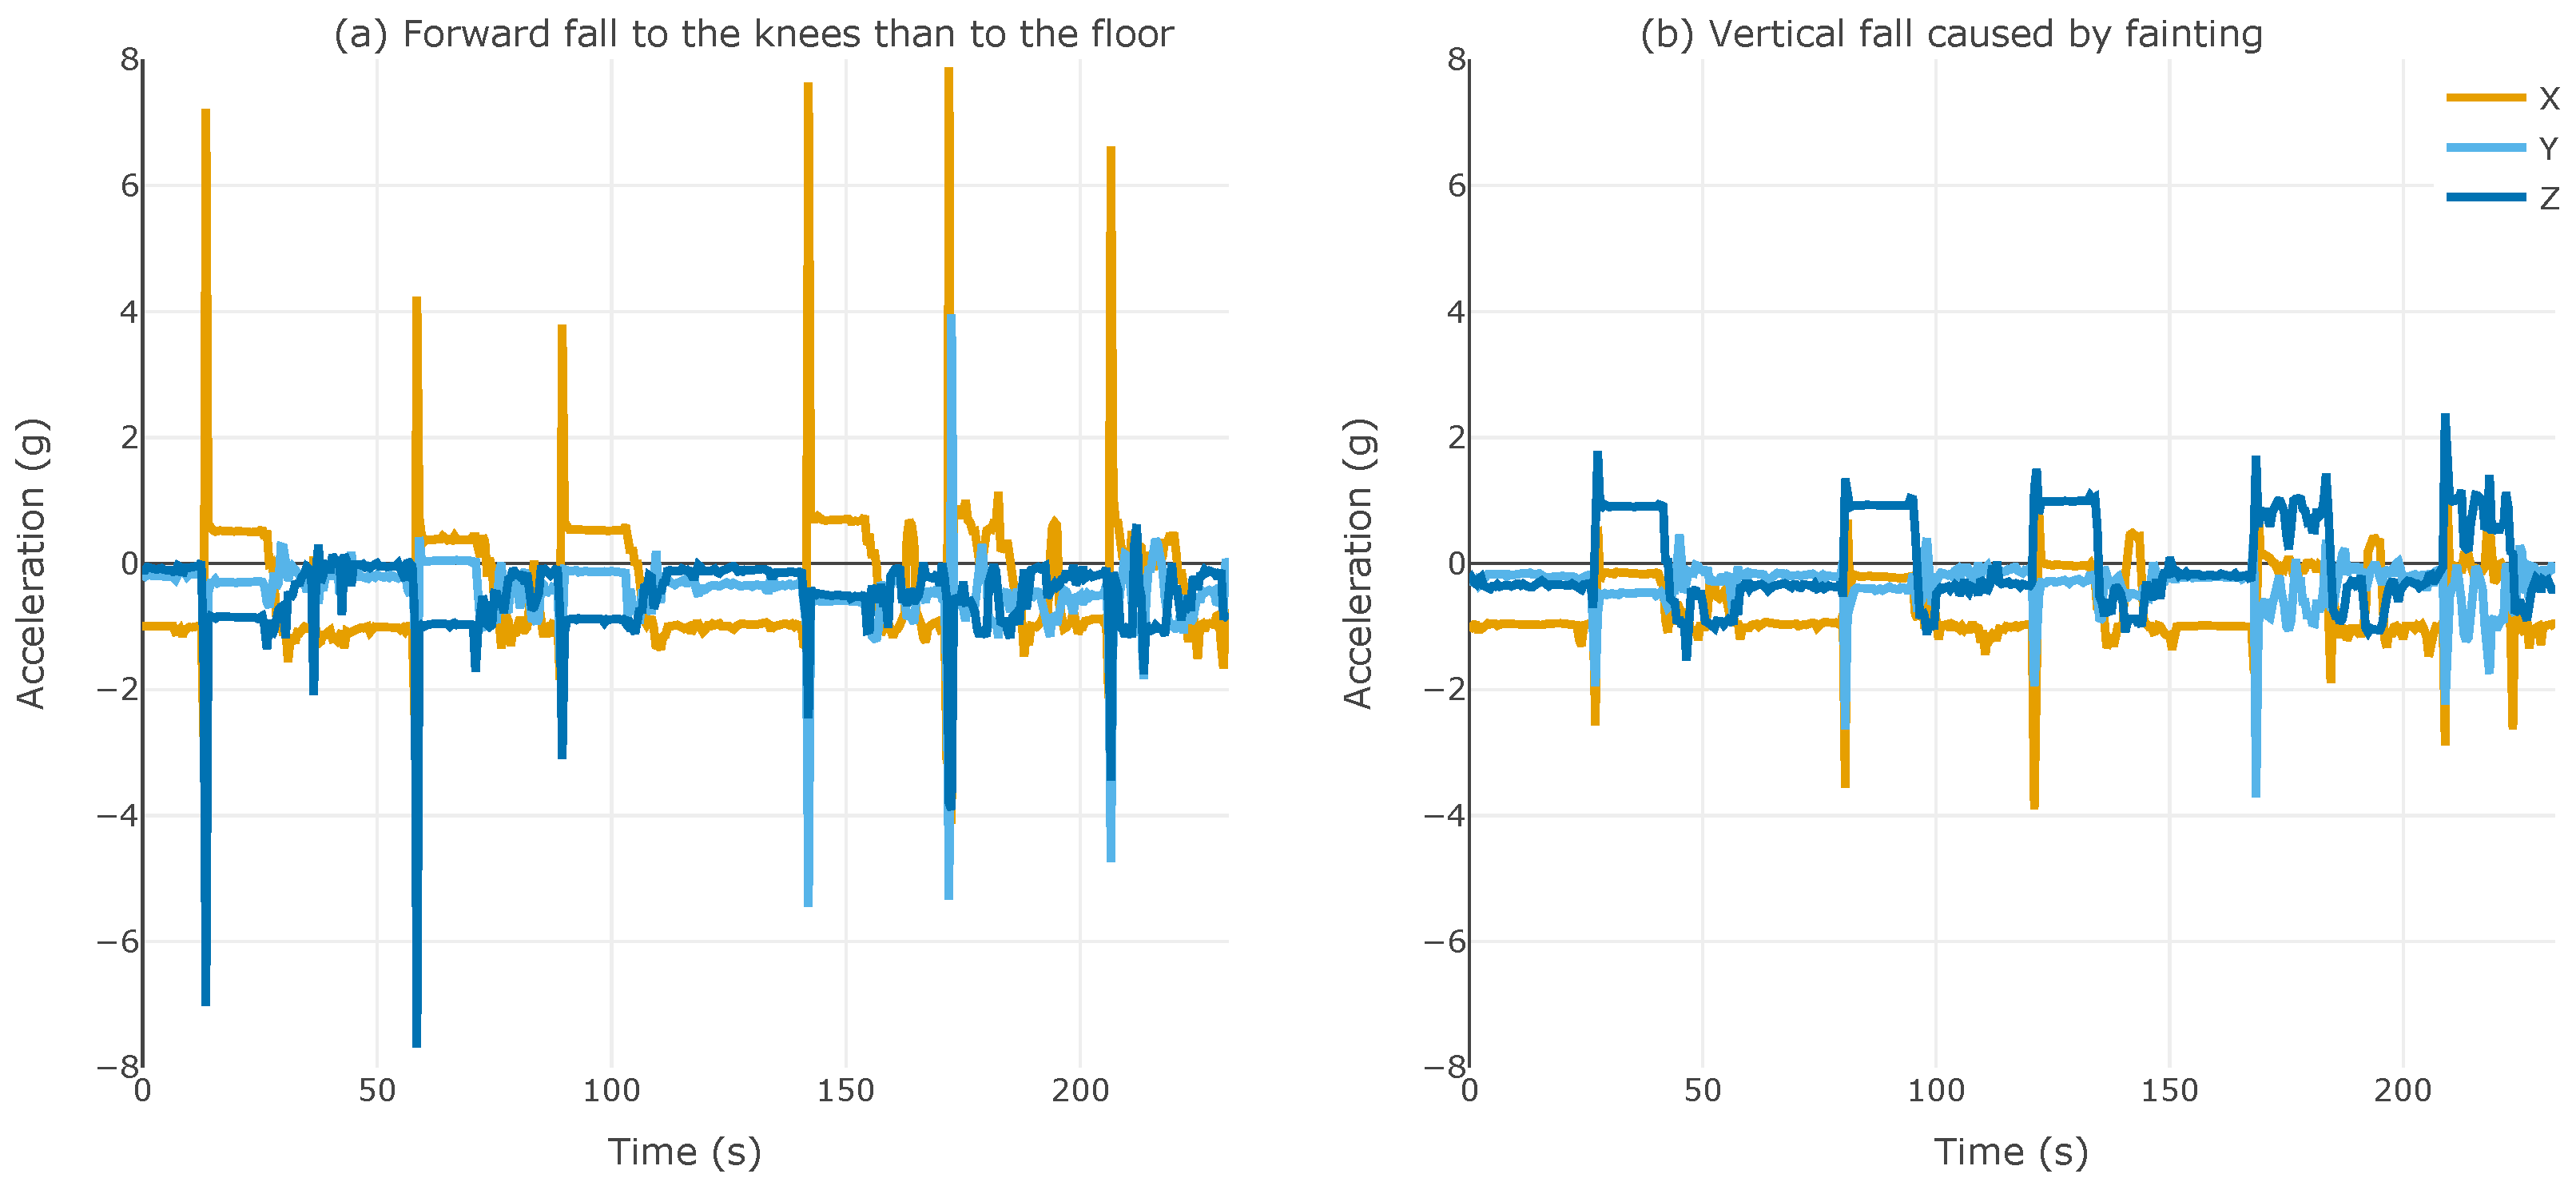
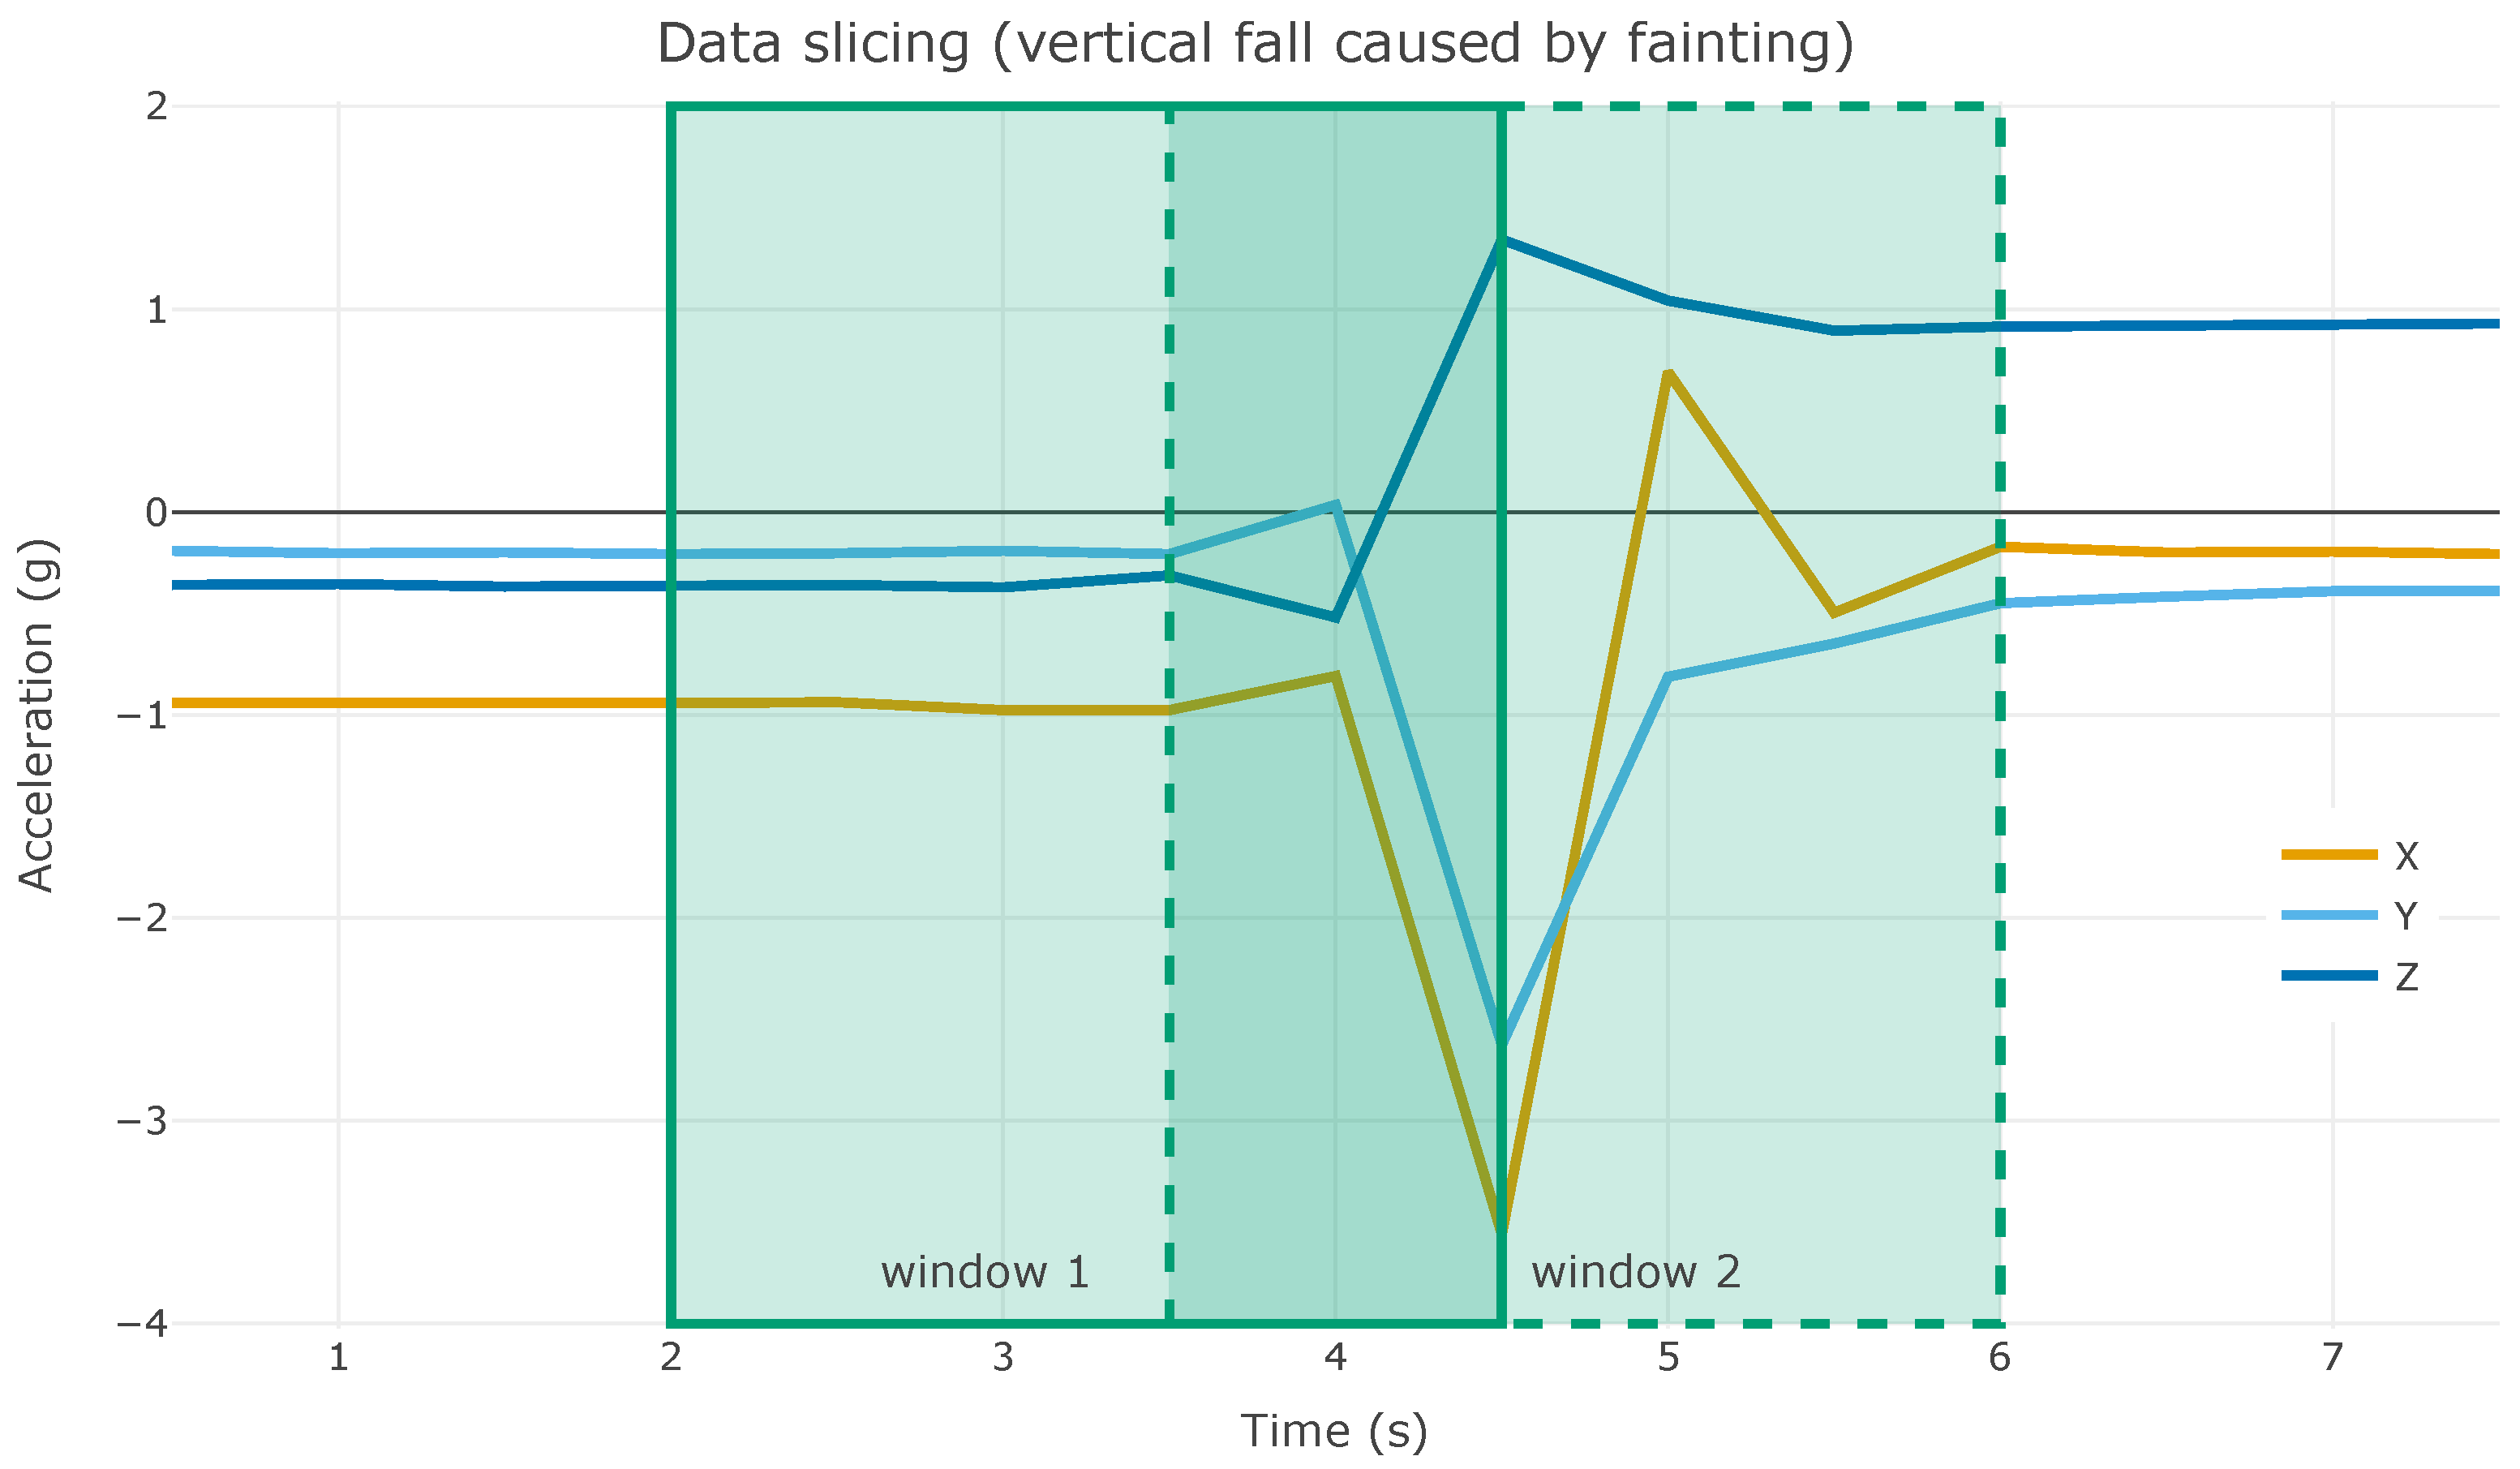
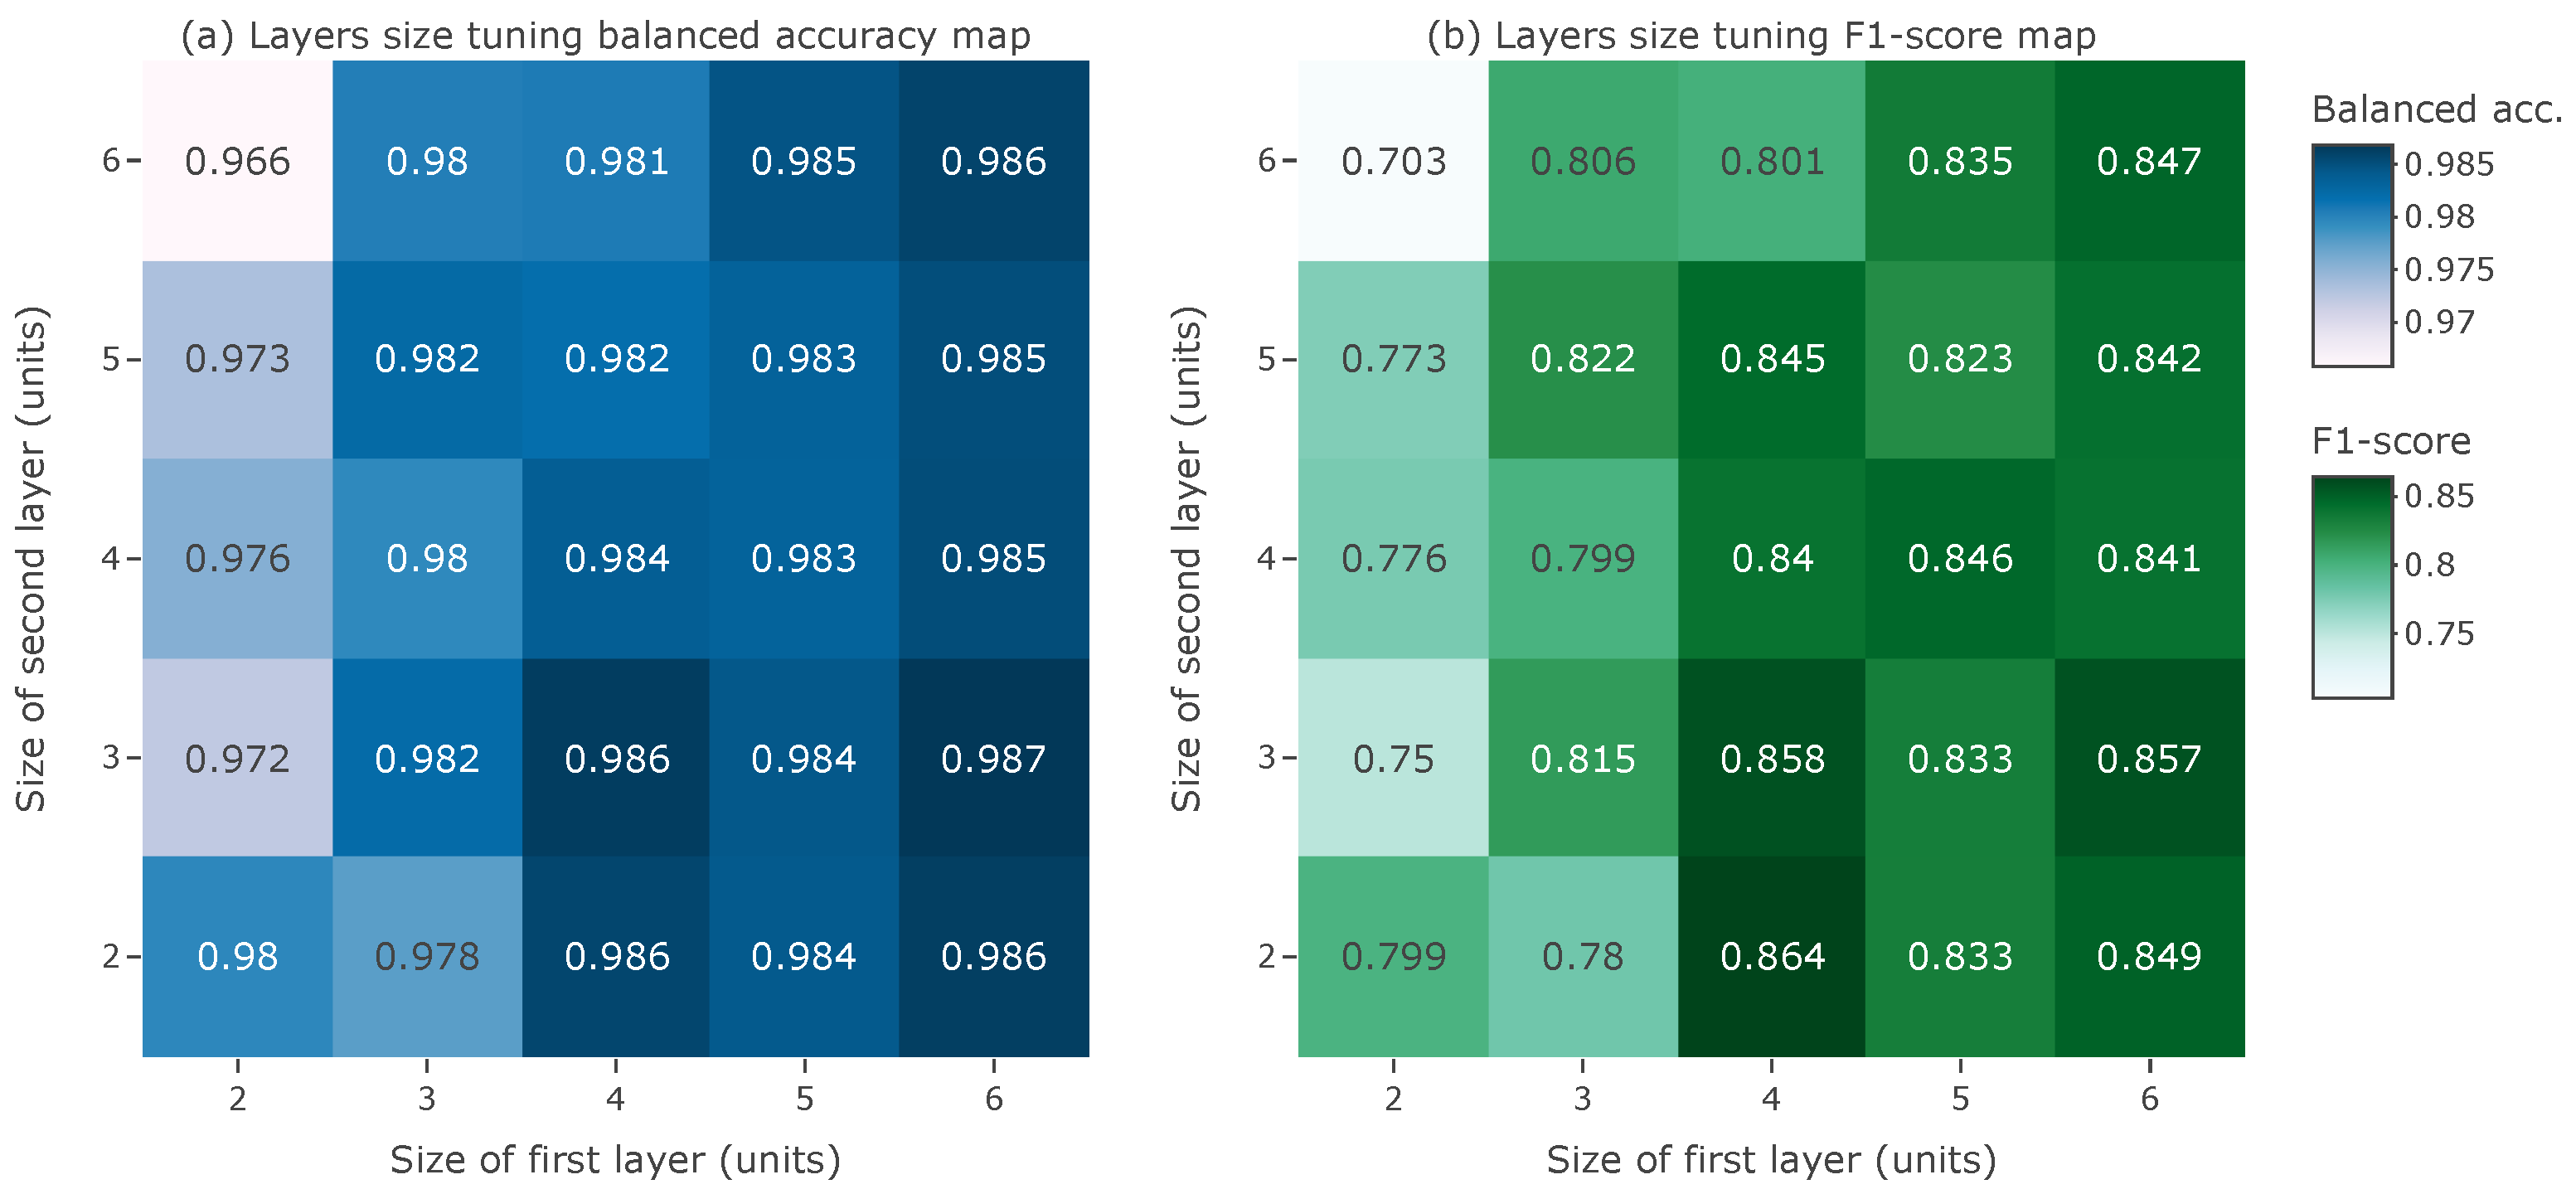
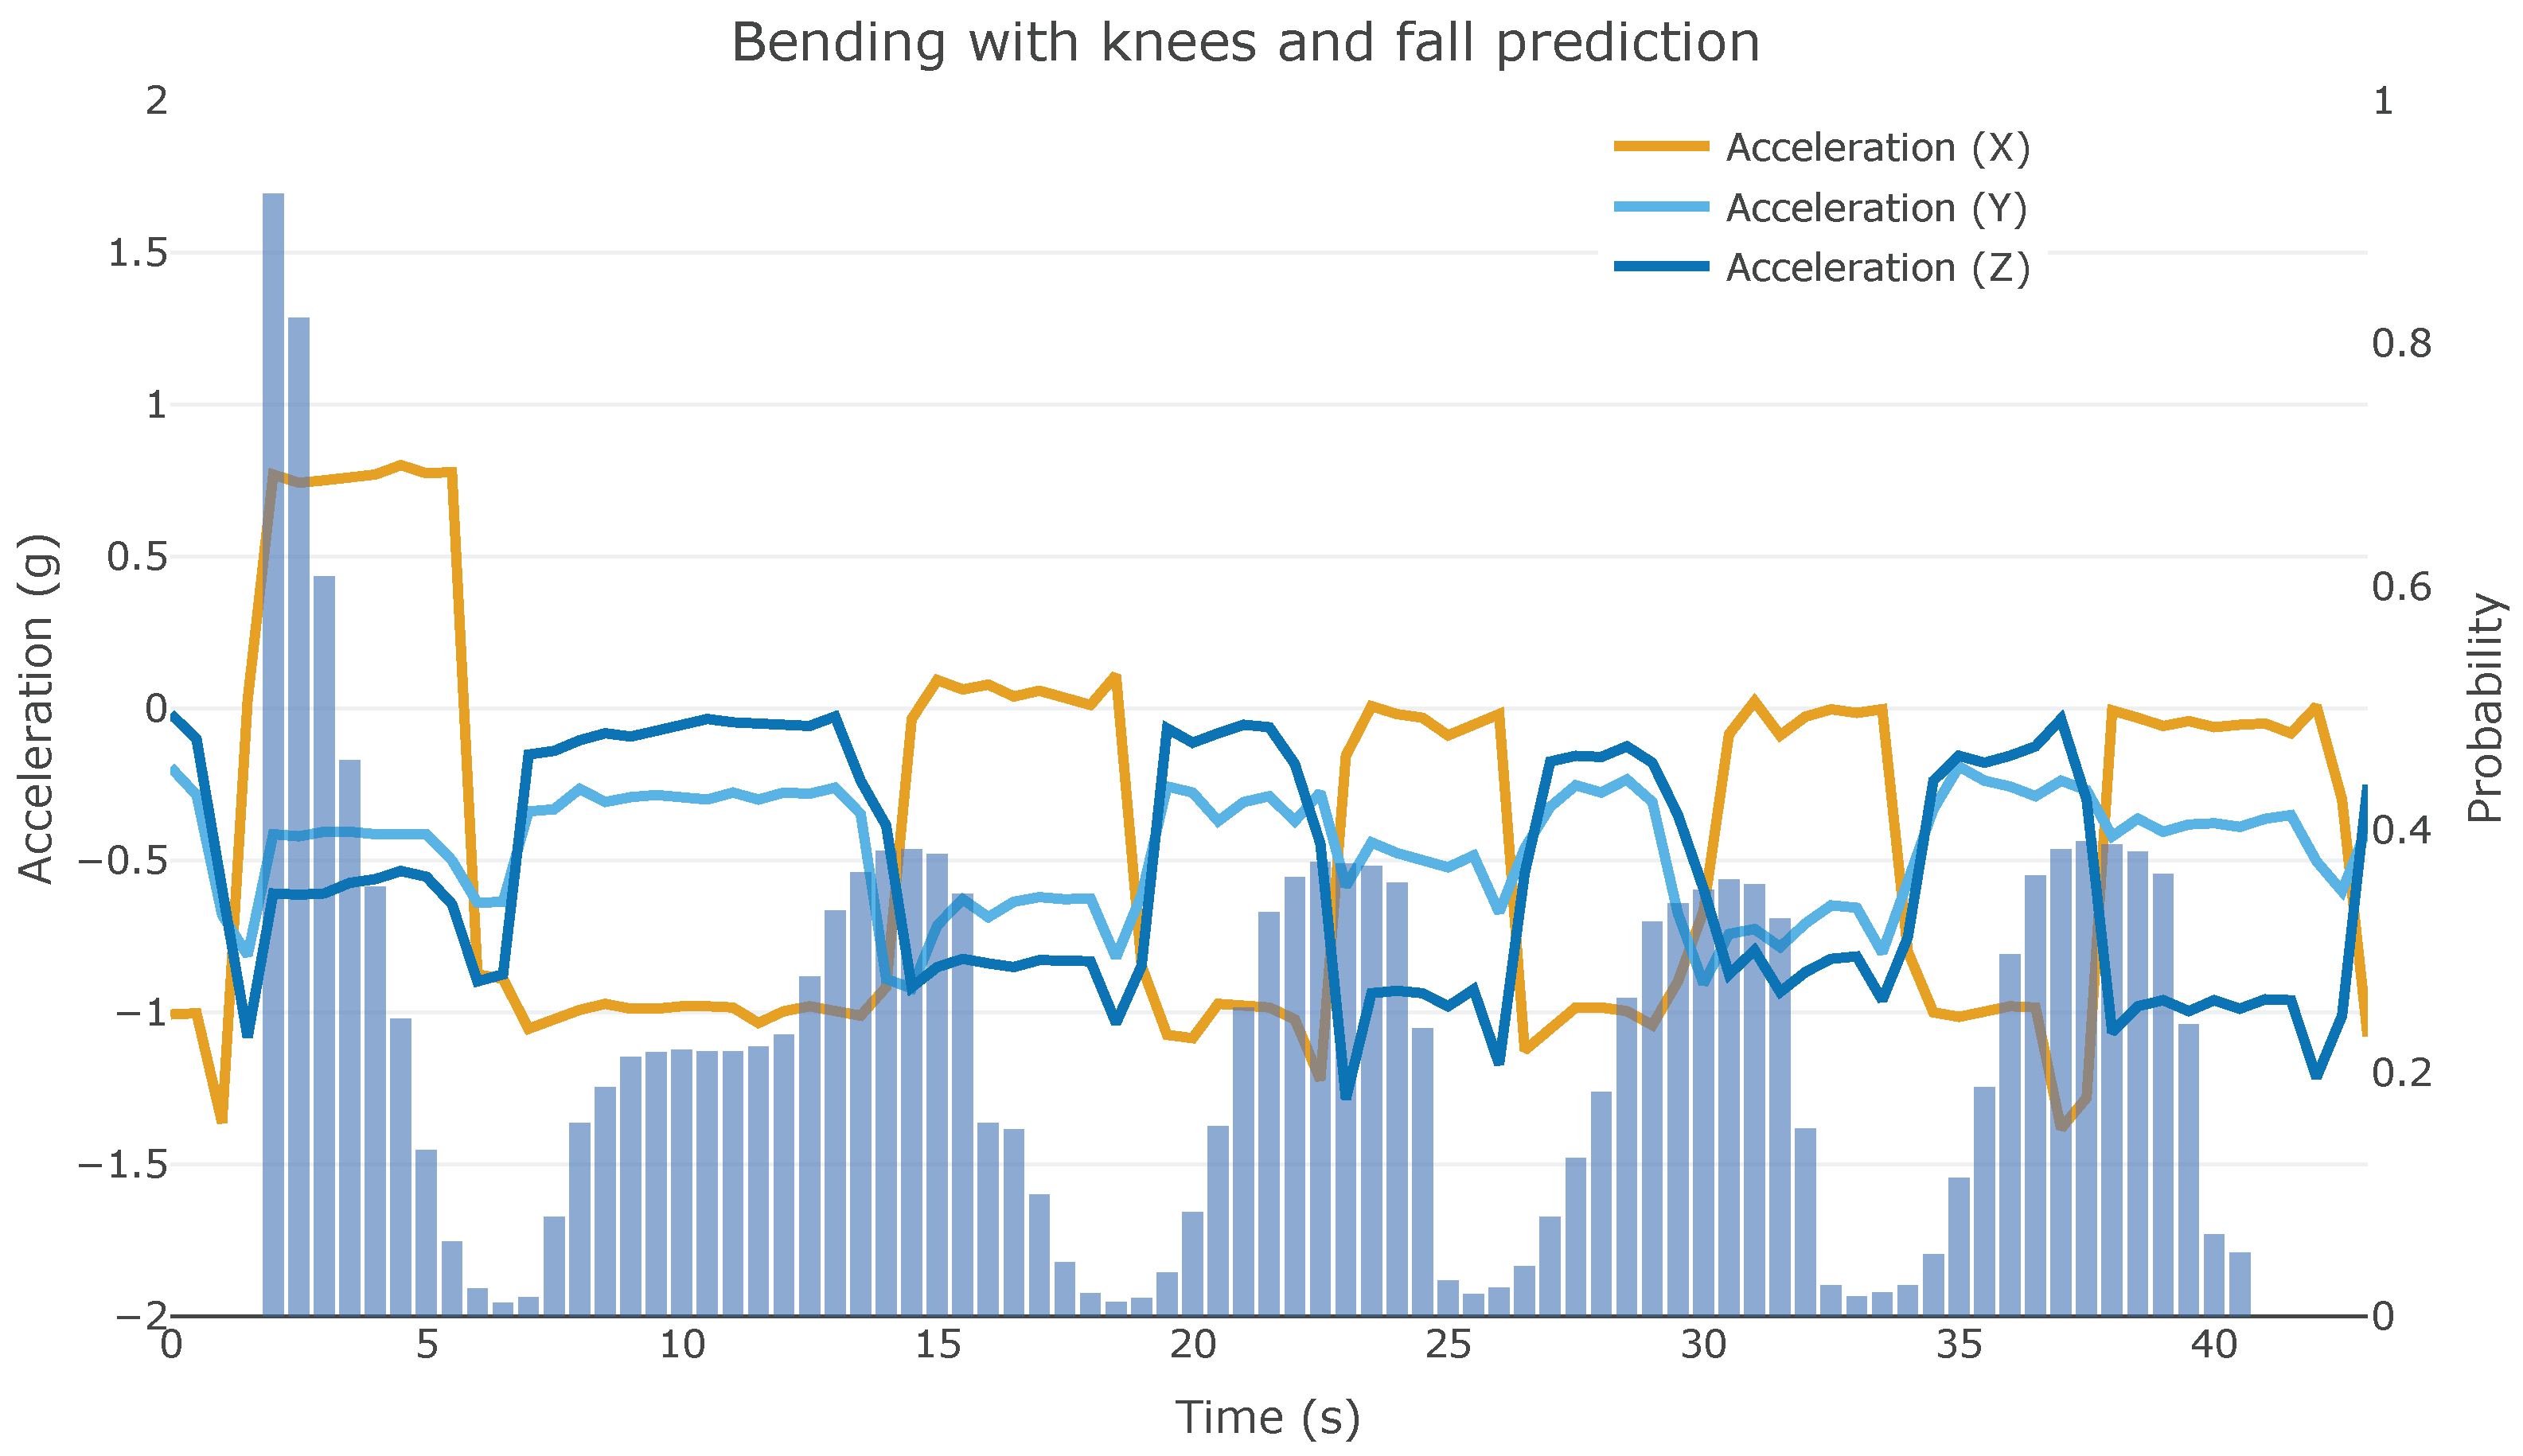