
Similarity Distribution Density: An Optimized Approach to Outlier Detection


Abstract
:1. Introduction
2. Related Work
2.1. Outlier Data Analysis
- (1)
- Sudden changes in data values, which are extreme manifestations of inherent variability in uncertain data in the overall numerical sense within the world model environment. Such outliers are essentially true and normal data, but their representation appears to be extreme. For example, a household may have minimal regular expenses but a large one-time purchase at a particular moment. Therefore, these outliers belong to the same population as the rest of the observations.
- (2)
- Due to the randomness inherent in specific experimental conditions, testing methods, or errors that arise during observation, recording, or calculation. These outliers are abnormal and erroneous data that do not belong to the same population as the rest of the observations.
2.2. Outlier Detection Model
- (1)
- K-Means Clustering Algorithm: Divides the data into several clusters and determines if a sample is an outlier based on the distance between the sample and the cluster center.
- (2)
- DBSCAN Algorithm: Divides the data into clusters based on density and determines if a sample is an outlier by checking if its density is below a certain threshold.
- (3)
- Hierarchical Clustering Algorithm: Merges clusters hierarchically based on the distance between clusters and determines if a sample is an outlier based on this distance.
- (4)
- Isolation Forest Algorithm: Based on the random forest concept, it isolates normal samples into the leaf nodes of the trees and determines if a sample is an outlier based on the depth of the sample in the tree.
- (5)
- Outlier Detection Algorithms: Based on distance or density measures, such as Local Outlier Factor (LOF) and Local Correlation Integral (LOCI).
- (6)
- Semi-supervised Outlier Detection Algorithms: Combines labeled and unlabeled data, such as Support Vector Machines (SVM) and graph-based semi-supervised outlier detection.
- (7)
- Statistic-based Outlier Detection Algorithms: Uses statistical hypothesis testing, such as Z-test and T-test, to determine if a sample is an outlier.
- (8)
- Clustering-based Outlier Detection Algorithms: Uses the distance between samples and cluster centers to determine if a sample is an outlier.
2.3. Related Research
- (1)
- Data feature boundaries
- (2)
- Detectors
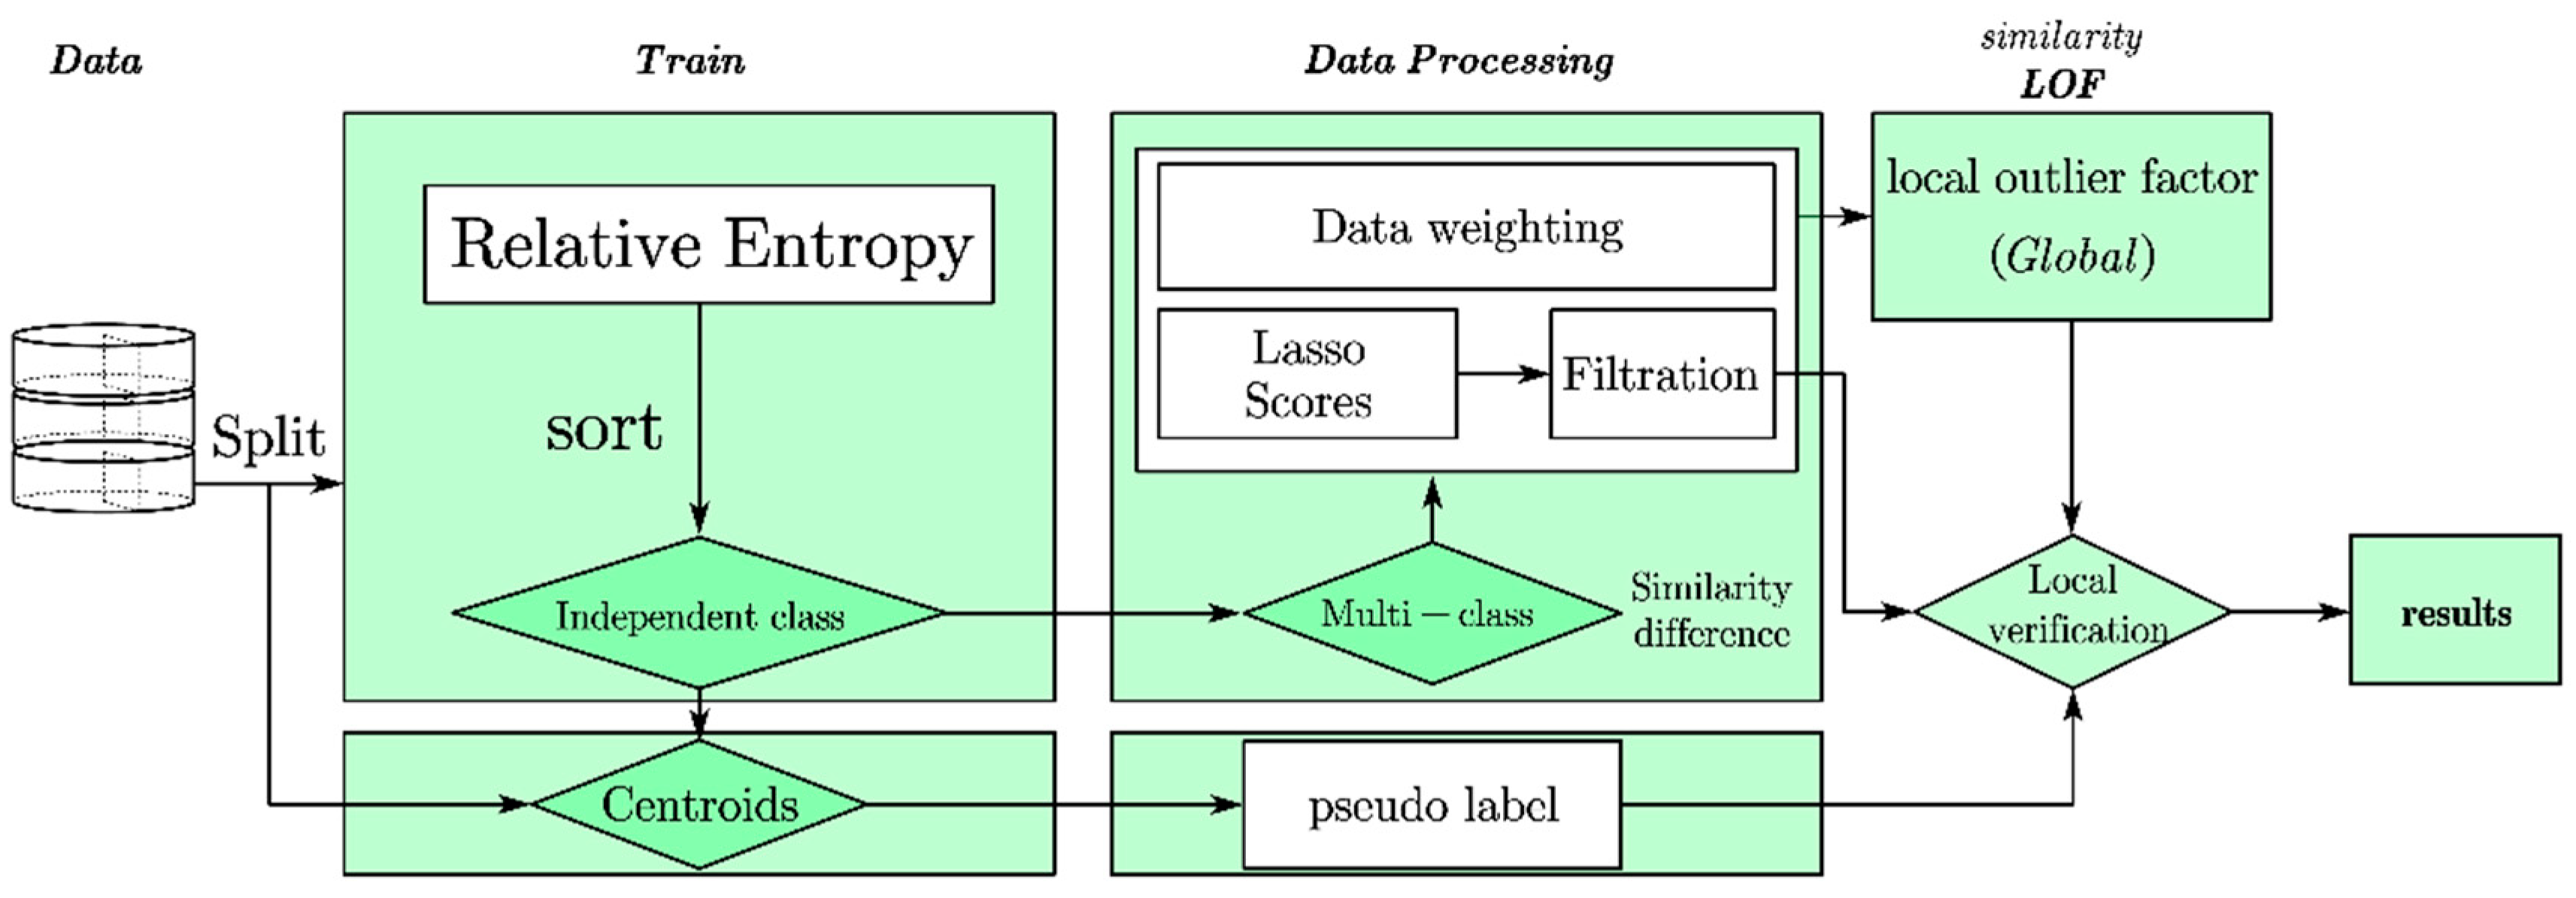
3. Detection Model Building
3.1. Feature Selection for Block Vectors
3.2. Pseudo-Labeling
- -
- Step 1: Initial model training: Train an initial model using a small, labeled training dataset.
- -
- Step 2: Pseudo-label generation: Use the trained initial model to make predictions on unlabeled data and select samples with predicted probabilities higher than a threshold as pseudo-labels.
- -
- Step 3: Expand the training set: Combine the pseudo-labels with the existing labeled dataset to form an expanded training set.
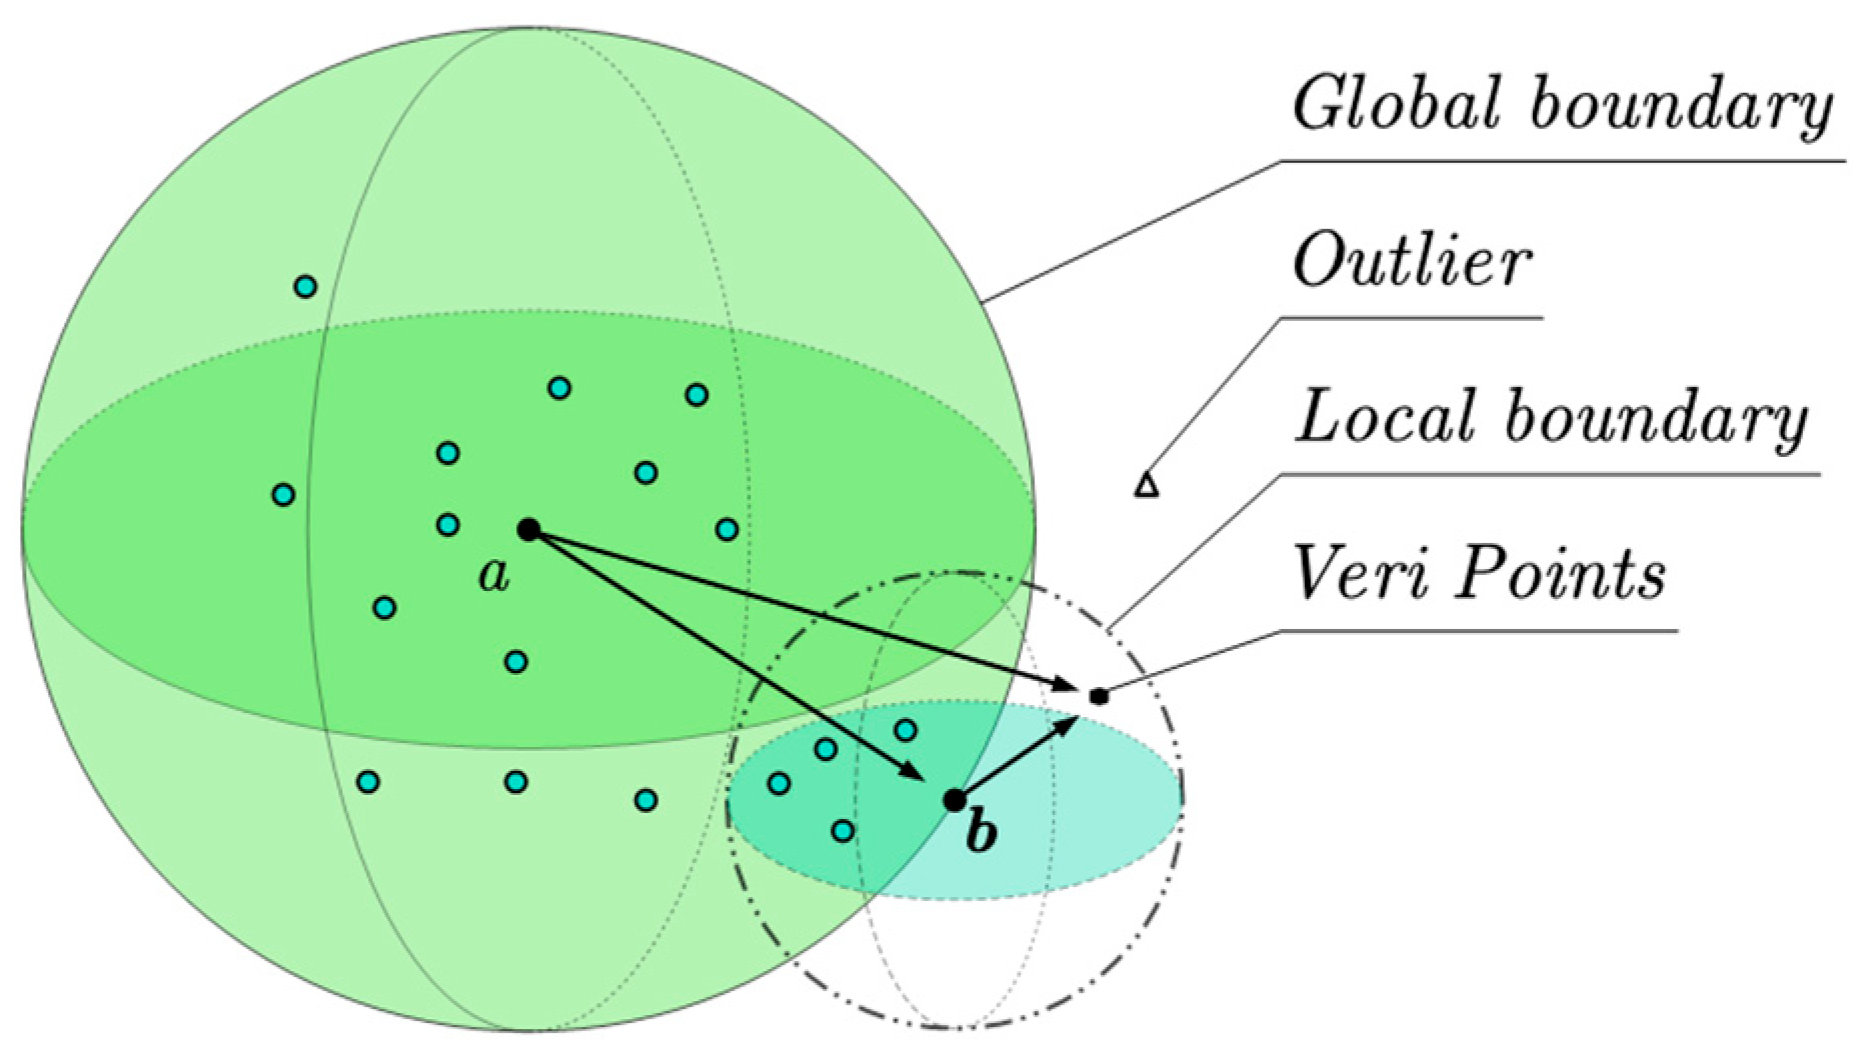
3.3. Local Similarity Density
3.4. Negating the Matching Authentication Relationship
4. Testing of Process
4.1. Experimental Environment
- (1)
- Contrast algorithms
- Local Outlier Factor (LOF): LOF is a density-based outlier detection method. It determines outlier points by calculating the difference in density between each sample point and its neighborhood points. If a sample point has a significantly lower density compared to its neighbors, it is likely to be an outlier.
- Local Correlation Integral (LOCI): LOCI is a method based on the principle of correlation. It determines outlier points by calculating the difference in density between a sample point and its neighboring points. Compared to global correlation integral methods, LOCI is more suitable for data with non-uniform density distribution.
- Stochastic Outlier Selection (SOS): SOS is a random selection-based outlier detection method. It determines outlier points by randomly selecting sample points and calculating their outlier scores. SOS method has good scalability and efficiency.
- k-Nearest Neighbors (KNN): KNN is a distance-based outlier detection method. It determines outlier points by calculating the distances between each sample point and its k-nearest neighbors. If a sample point has a large distance compared to its nearest neighbors, it is likely to be an outlier.
- Isolation Forest (IForest): IForest is a tree-based outlier detection method. It determines outlier points by randomly constructing binary search trees to partition the samples and calculating the path lengths of sample points in the trees. IForest method has high efficiency and scalability.
- Minimum Covariance Determinant (MCD): MCD is a method based on the distribution of high-dimensional data. It determines outlier points by selecting a subset with the minimum covariance determinant. MCD is suitable for high-dimensional data and multivariate anomaly detection.
- (2)
- Data set
- Wisconsin Breast Cancer (Diagnostics) Dataset (Breast Cancer) [49] (Kaggle). For this dataset, the data were extracted from digitized images of fine needle aspiration (FNA), by which breast lumps were diagnosed. Each feature in this dataset describes the characteristics of the nucleus found in the digitized image described earlier. There are three types of features in this dataset, where real-valued features are calculated from digitized images and contain information about regions, cell radii, textures, etc., which are used to predict whether a lump is benign or malignant (0 or 1).
- HCV Dataset: The HCV dataset contains laboratory values and demographic statistics such as age for blood donors and patients with Hepatitis C Virus (HCV). The target attribute for classification is the category, which includes blood donors and HCV (Hepatitis C, Fibrosis, Cirrhosis). All attributes, except for category and gender, are numeric real values. The laboratory data are represented in columns 5 to 14 of the sample vectors.
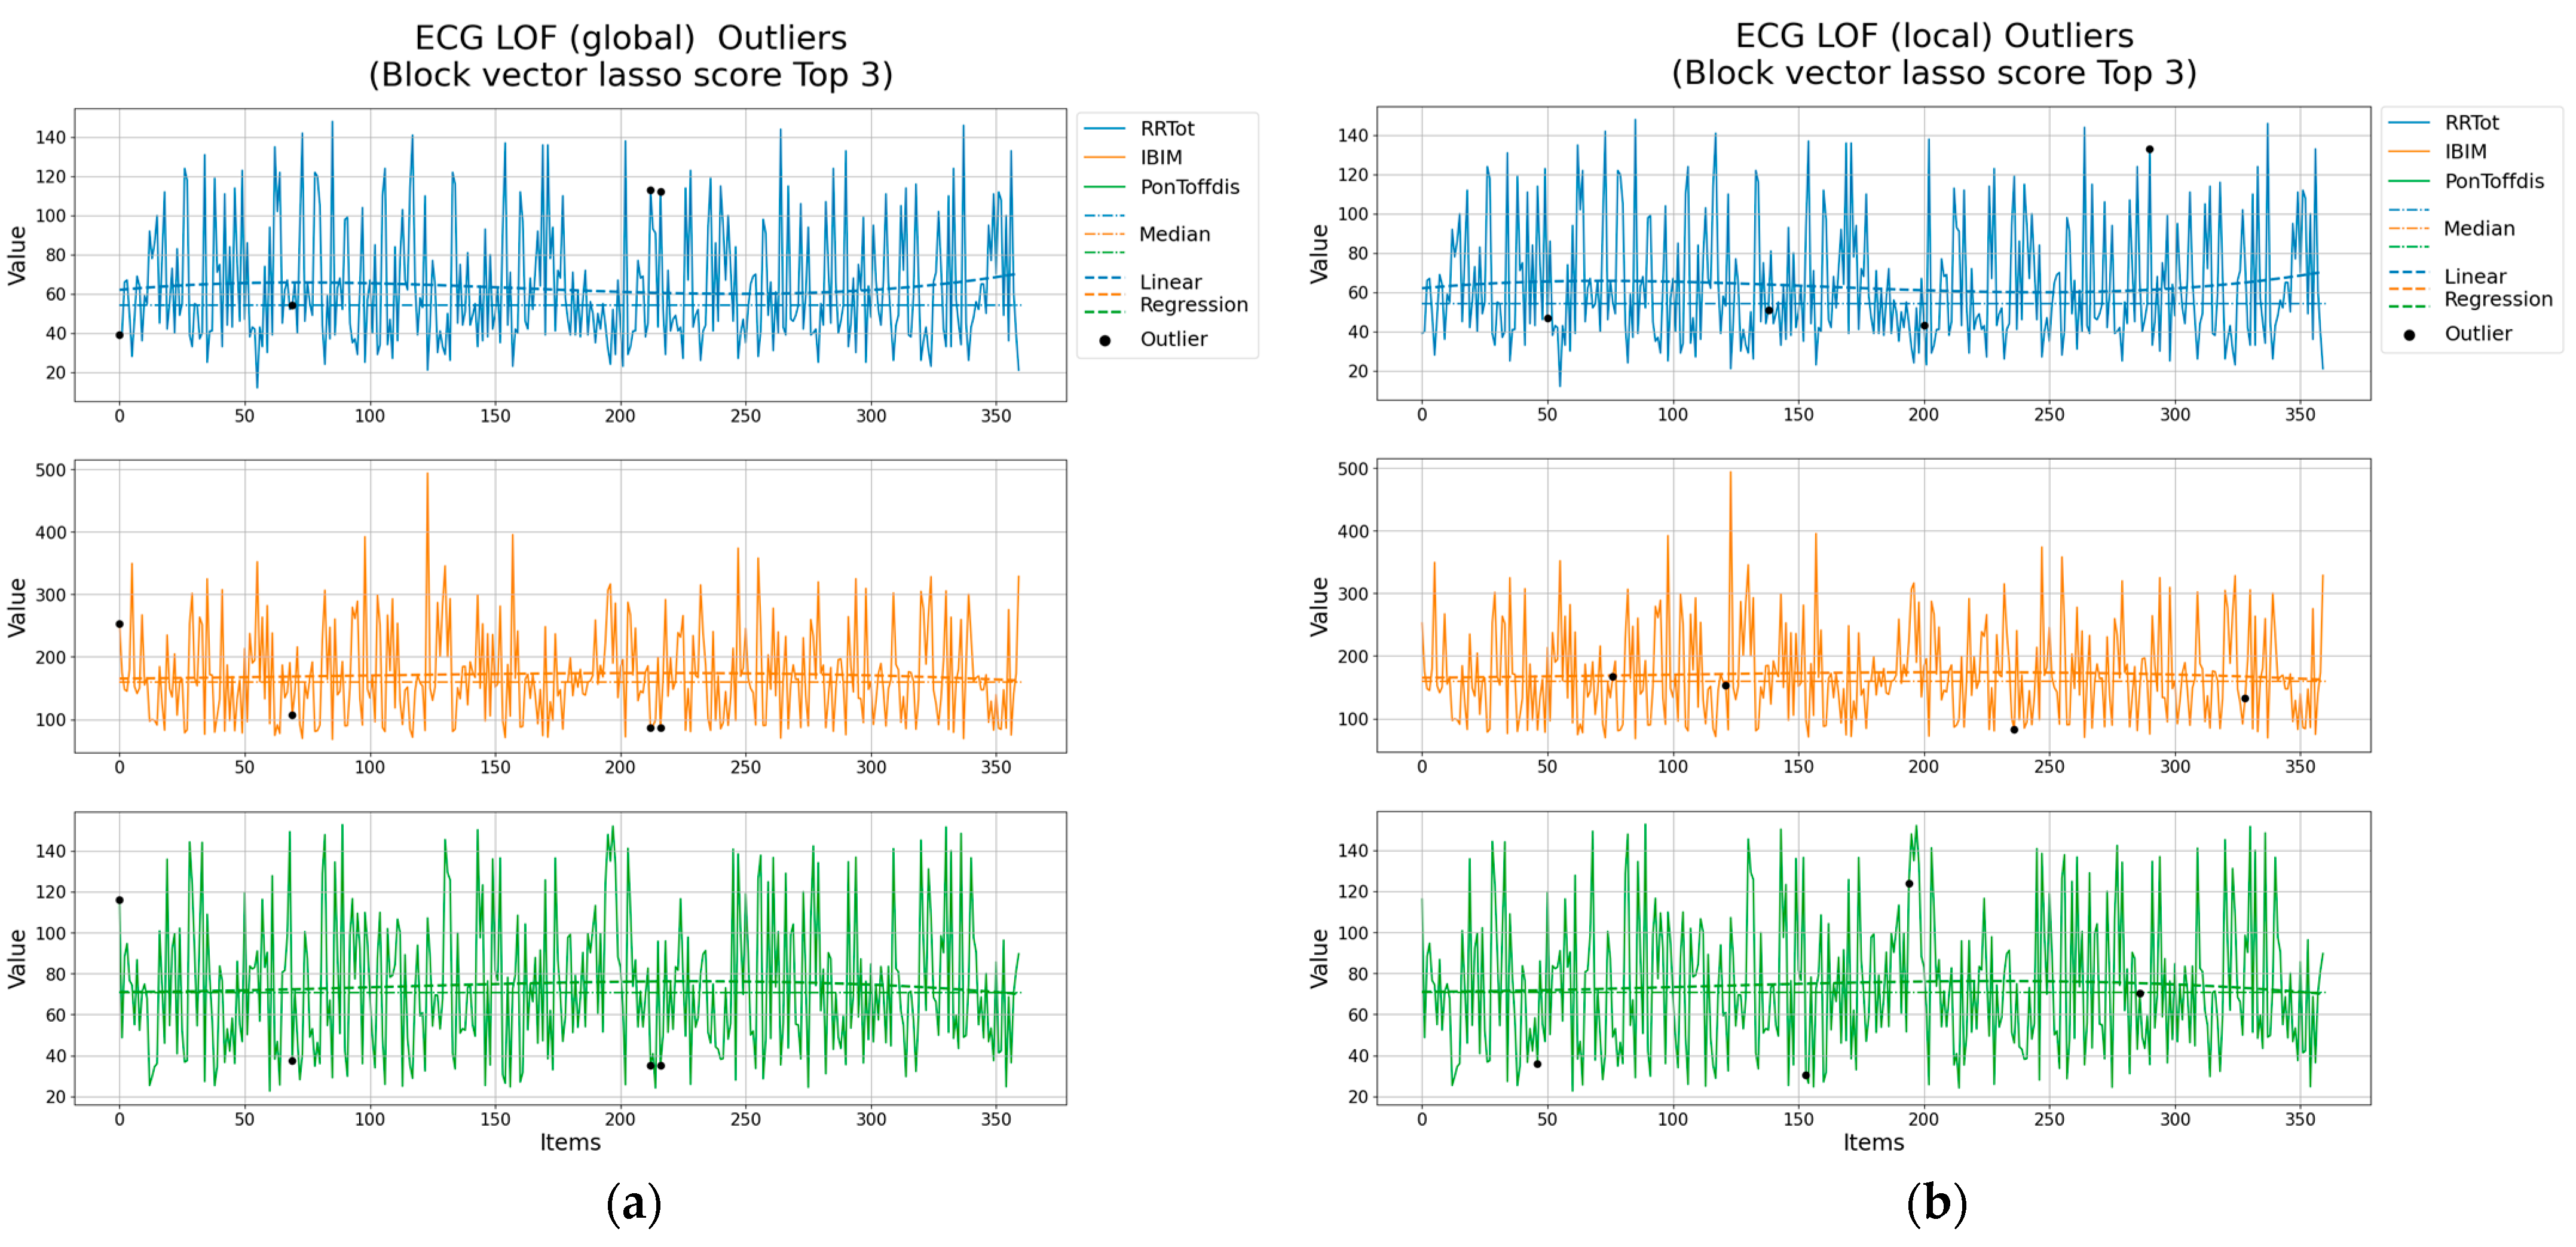
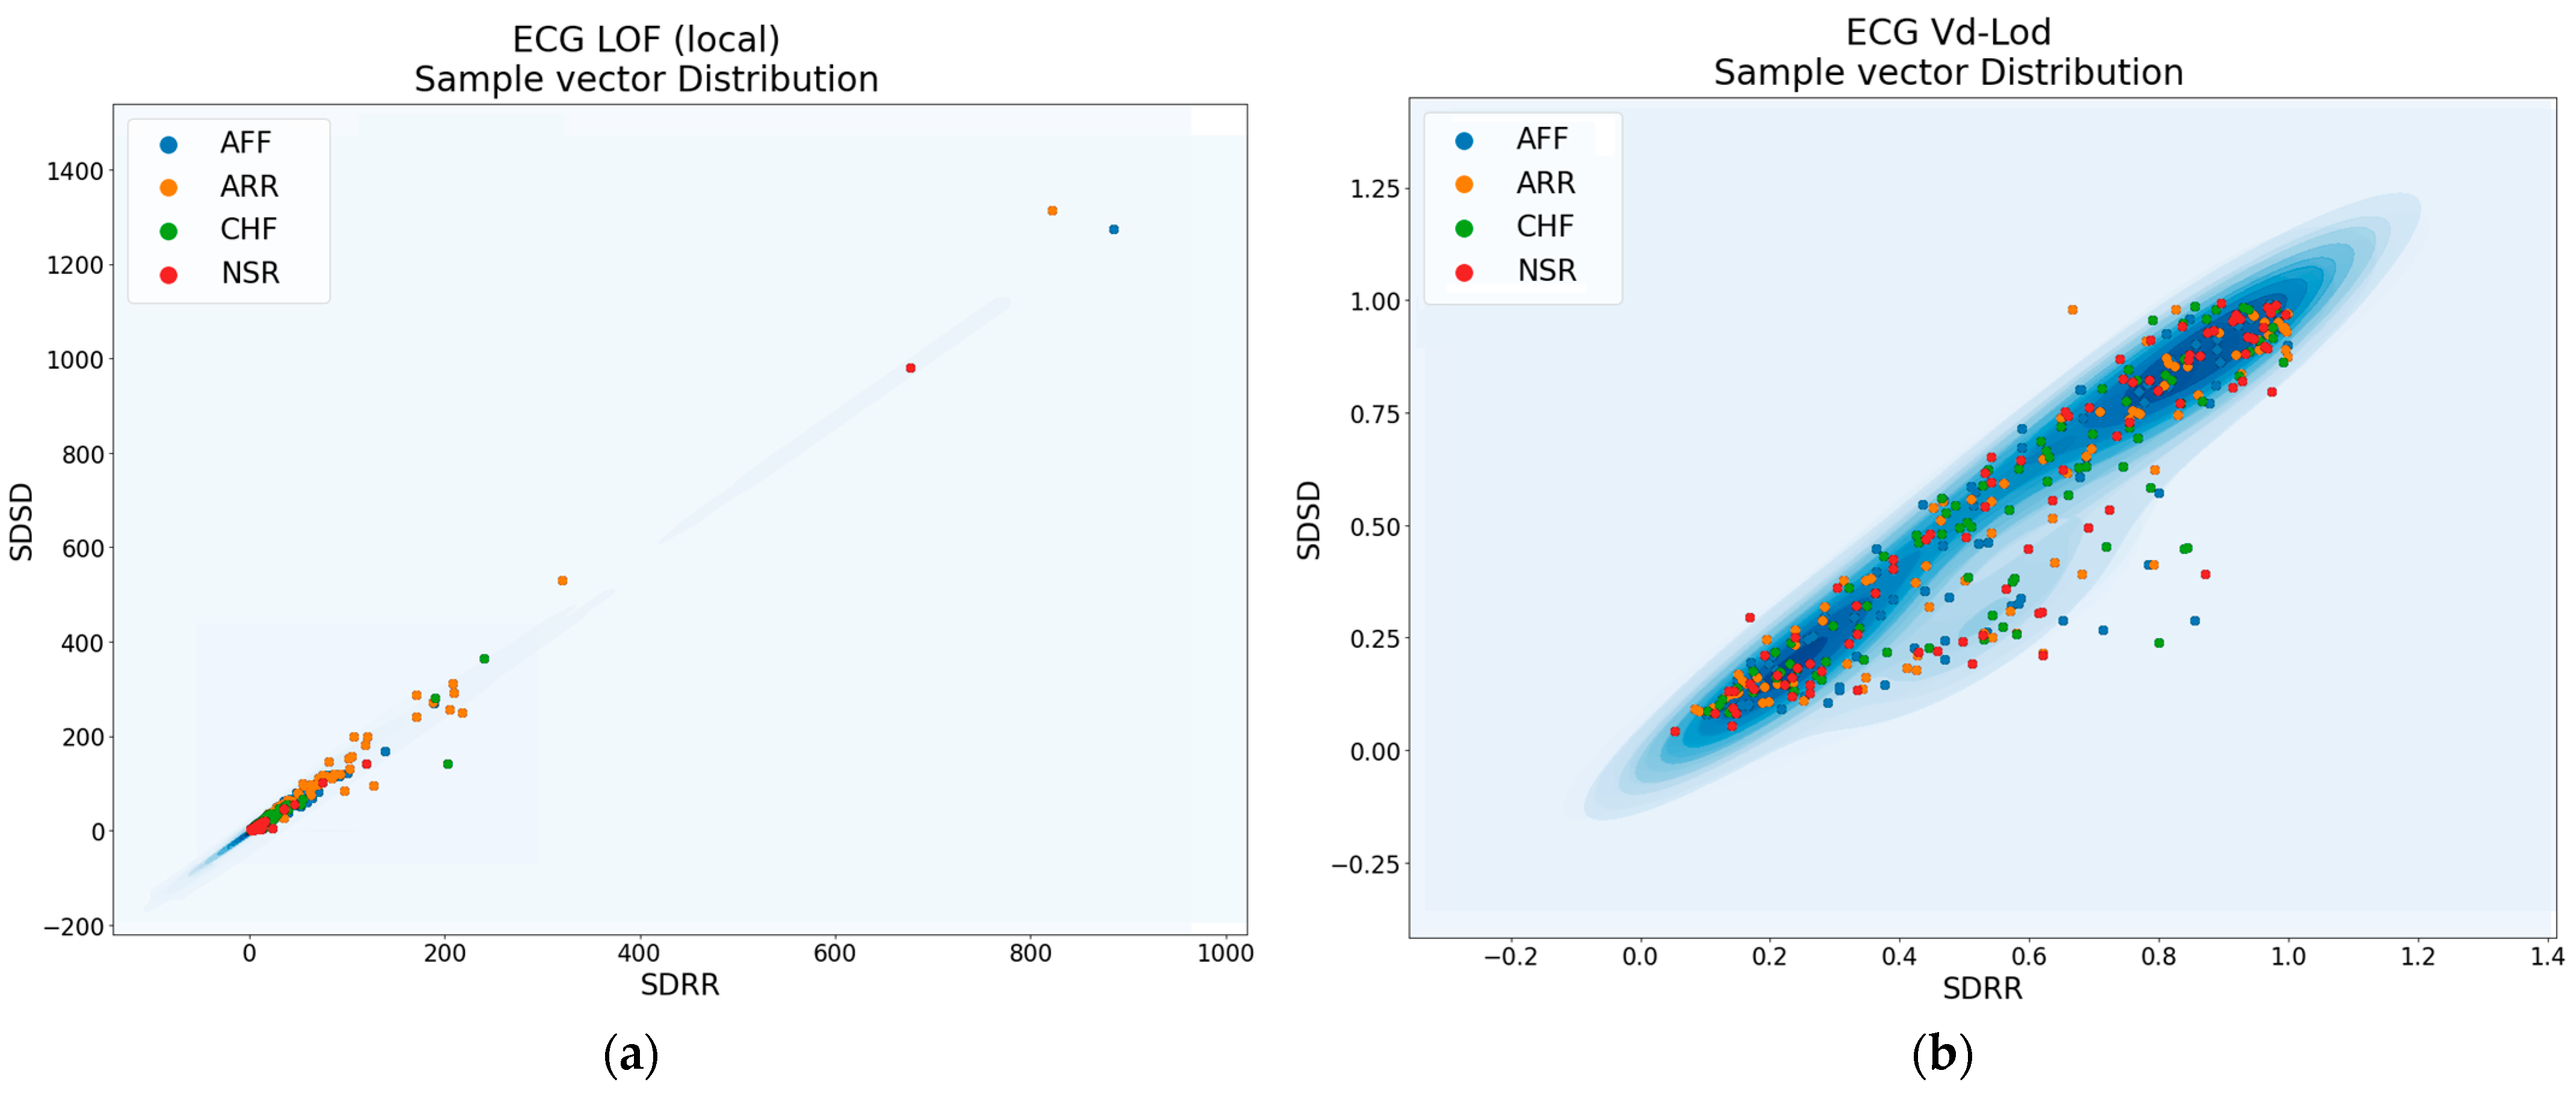
- ECG of Cardiac Ailments Dataset [50,51]: This dataset consists of 1200 cardiac electrocardiogram (ECG) records related to cardiovascular diseases. Each set of 300 records corresponds to a specific disease. A total of 54 features are extracted for each disease using the MODWPT technique, resulting in a file size of 1200 × 54 records.
- (3)
- Evaluation indicators
4.2. Result
5. Summary
- (1)
- High accuracy: Density-based outlier detection models can identify samples with low density based on the distribution characteristics of the dataset, which are often the outliers. In this way, the Negative Selection Algorithm can further determine non-self-invading behaviors based on these samples, improving the accuracy of recognition.
- (2)
- High robustness: Density-based outlier detection models determine outlier samples based on the density distribution of samples. Compared to traditional distance-based or statistical methods, they exhibit stronger robustness. This robustness enables the Negative Selection Algorithm to be more reliable and stable when dealing with different types of outlier samples.
- (3)
- Scalability: Density-based outlier detection models typically do not require pre-specifying the number of outlier samples and can adaptively identify them based on the dataset’s characteristics. This scalability allows the Negative Selection Algorithm to handle datasets of different scales and complexities.
- (1)
- Multi-level density models: Current density-based outlier detection models mainly rely on a single density threshold for judgment. However, real-world datasets often contain different density regions. Therefore, it is worth exploring multi-level density models to better adapt to outlier samples within different density ranges.
- (2)
- Dynamic density models: Existing density-based outlier detection methods typically assume static density models that do not change over time. However, in certain applications, the density of data may change over time. Therefore, research can be conducted on establishing dynamic density models that capture such changes.
- (3)
- Incremental learning and online outlier detection: Current density-based outlier detection models are mainly designed for offline datasets. For data streams or incremental updates, further research is needed on how to perform incremental learning and online outlier detection.
- (4)
- Integration with other techniques: Density-based outlier detection models can be combined with other machine learning and data mining techniques, such as clustering, classification, and anomaly detection, to enhance the performance and effectiveness of outlier detection models.
- (5)
- Real-world application and evaluation: Density-based outlier detection models face challenges in real-world applications, such as imbalanced datasets, noise, and missing labels. Therefore, more research is needed to evaluate and improve the performance of models in practical applications.
Author Contributions
Funding
Data Availability Statement
Conflicts of Interest
References
- Aggarwal, C.C. Outlier Analysis; Data Mining; Springer: Cham, Switzerland, 2015; pp. 237–263. [Google Scholar]
- Boukerche, A.; Zheng, L.; Alfandi, O. Outlier Detection: Methods, Models, and Classification. ACM Comput. Surv. 2020, 53, 1–37. [Google Scholar] [CrossRef]
- Günnemann, N.; Günnemann, S.; Faloutsos, C. Robust Multivariate Autoregression for Anomaly Detection in Dynamic Product Ratings; ACM: New York, NY, USA, 2014. [Google Scholar]
- Ben-Gal, I. Outlier Detection; Springer: Berlin/Heidelberg, Germany, 2005; pp. 131–146. [Google Scholar]
- Braei, M.; Wagner, S. Anomaly Detection in Univariate Time-series: A Survey on the State-of-the-Art. arXiv 2020, arXiv:2004.00433. [Google Scholar]
- Barnett, V. Some outlier tests for multivarlate samples. S. Afr. Stat. J. 1979, 13, 29–52. [Google Scholar]
- Collett, D.; Lewis, T. The subjective nature of outlier rejection procedures. J. R. Stat. Soc. Ser. C Appl. Stat. 1976, 25, 228–237. [Google Scholar] [CrossRef]
- Hawkins, D.M. Multivariate Outlier Detection; Springer: Berlin/Heidelberg, Germany, 1980; pp. 104–114. [Google Scholar]
- Salgado, C.M.; Azevedo, C.; Proença, H.; Vieira, S.M. Noise Versus Outliers. In Secondary Analysis of Electronic Health Records; Springer: Cham, Switzerland, 2016; pp. 163–183. [Google Scholar] [CrossRef]
- Erwig, M.; Güting, R.H.; Schneider, M.; Vazirgiannis, M. Abstract and discrete modeling of spatio-temporal data types. In Proceedings of the 6th ACM International Symposium on Advances in Geographic Information Systems, Washington, DC, USA, 6–7 November 1998; pp. 131–136. [Google Scholar]
- Yang, J.; Zhou, K.; Li, Y.; Liu, Z. Generalized out-of-distribution detection: A survey. arXiv 2021, arXiv:2110.11334. [Google Scholar]
- Samara, M.A.; Bennis, I.; Abouaissa, A.; Lorenz, P. A Survey of Outlier Detection Techniques in IoT: Review and Classification. J. Sens. Actuator Netw. 2022, 11, 4. [Google Scholar] [CrossRef]
- Warnat-Herresthal, S.; Schultze, H.; Shastry, K.L.; Manamohan, S.; Mukherjee, S.; Garg, V.; Sarveswara, R.; Händler, K.; Pickkers, P.; Aziz, N.A.; et al. Swarm learning for decentralized and confidential clinical machine learning. Nature 2021, 594, 265–270. [Google Scholar] [CrossRef]
- Zhao, Y.; Nasrullah, Z.; Hryniewicki, M.K.; Li, Z. LSCP: Locally selective combination in parallel outlier ensembles. In Proceedings of the 2019 SIAM International Conference on Data Mining. Society for Industrial and Applied Mathematics, Calgary, AB, Canada, 2–4 May 2019; pp. 585–593. [Google Scholar]
- Sun, B.; Cheng, W.; Ma, L.; Goswami, P. Anomaly-aware traffic prediction based on automated conditional information fusion. In Proceedings of the 2018 21st International Conference on Information Fusion (FUSION), Cambridge, UK, 10–13 July 2018; pp. 2283–2289. [Google Scholar]
- Shukla, R.M. Optimization and Anomaly Detection for Smart City-based Applications. Ph.D. Thesis, University of Nevada, Reno, NV, USA, 2020. [Google Scholar]
- Hasani, Z. Robust anomaly detection algorithms for real-time big data: Comparison of algorithms. In Proceedings of the 2017 6th Mediterranean Conference on Embedded Computing (MECO), Bar, Montenegro, 11–15 June 2017. [Google Scholar]
- Islek, I.; Aksayli, N.D.; Karamatli, E. Proactive Anomaly Detection Using Time Series Data of a Large Scale Platform. In Proceedings of the 2020 28th Signal Processing and Communications Applications Conference (SIU), Gaziantep, Turkey, 5–7 October 2020. [Google Scholar]
- Amati, G.; Angelini, S.; Gambosi, G.; Pasquin, D.; Rossi, G.; Vocca, P. Twitter: Temporal Events Analysis: Extended Abstract; ACM: New York, NY, USA, 2018. [Google Scholar]
- Ray, S.; Wright, A. Detecting anomalies in alert firing within clinical decision support systems using anomaly/outlier detection techniques. In Proceedings of the 7th ACM International Conference on Bioinformatics, Computational Biology, and Health Informatics, Seattle, WA, USA, 2–5 October 2016. [Google Scholar]
- Golic, M.; Zunic, E.; Donko, D. Outlier detection in distribution companies business using real data set. In Proceedings of the IEEE EUROCON 2019-18th International Conference on Smart Technologies, Novi Sad, Serbia, 1–4 July 2019. [Google Scholar]
- Shukla, R.M.; Sengupta, S. Toward Robust Outlier Detector for Internet of Things Applications; Kamhoua, C.A., Njilla, L.L., Kott, A., Shetty, S., Eds.; Wiley: Hoboken, NJ, USA, 2020; pp. 615–634. [Google Scholar]
- Hendrycks, D.; Gimpel, K. A Baseline for Detecting Misclassified and Out-of-Distribution Examples in Neural Networks. arXiv 2016, arXiv:1610.02136. [Google Scholar]
- Chen, M.; Gui, X.; Fan, S. Cluster-aware Contrastive Learning for Unsupervised Out-of-distribution Detection. arXiv 2023, arXiv:2302.02598. [Google Scholar]
- Li, Y.; Chen, Z.; Zha, D.; Zhou, K.; Jin, H.; Chen, H.; Hu, X. Autood: Automated outlier detection via curiosity-guided search and self-imitation learning. arXiv 2020, arXiv:2006.11321. [Google Scholar]
- Li, Y.; Chen, Z.; Zha, D.; Zhou, K.; Jin, H.; Chen, H.; Hu, X. Automated anomaly detection via curiosity-guided search and self-imitation learning. IEEE Trans. Neural Netw. Learn. Syst. 2021, 33, 2365–2377. [Google Scholar] [CrossRef] [PubMed]
- Grosse, K.; Manoharan, P.; Papernot, N.; Backes, M.; McDaniel, P. On the (Statistical) Detection of Adversarial Examples. arXiv 2017, arXiv:1702.06280. [Google Scholar]
- Fatemifar, S.; Arashloo, S.R.; Awais, M.; Kittler, J. Spoofing Attack Detection by Anomaly Detection. In Proceedings of the ICASSP 2019-2019 IEEE International Conference on Acoustics, Speech and Signal Processing (ICASSP), Brighton, UK, 12–17 May 2019. [Google Scholar]
- Satari, H.; Blair, C.; Ju, L.; Blair, D.; Zhao, C.; Saygin, E.; Meyers, P.; Lumley, D. Low coherency of wind induced seismic noise: Implications for gravitational wave detection. Class. Quantum Gravity 2022, 39, 215015. [Google Scholar] [CrossRef]
- Raza, A.; Munir, K.; Almutairi, M. A Novel Deep Learning Approach for Deepfake Image Detection. Appl. Sci. 2022, 12, 9820. [Google Scholar] [CrossRef]
- Shahrivari, F.; Zlatanov, N. An Asymptotically Optimal Algorithm for Classification of Data Vectors with Independent Non-Identically Distributed Elements. IEEE Int. Symp. Inf. Theory 2021, 2637–2642. [Google Scholar] [CrossRef]
- Dragoi, M.; Burceanu, E.; Haller, E.; Manolache, A.; Brad, F. AnoShift: A Distribution Shift Benchmark for Unsupervised Anomaly Detection. Adv. Neural Inf. Process. Syst. 2022, 35, 32854–32867. [Google Scholar]
- Hoeffding, W.; Wolfowitz, J. Distinguishability of sets of distributions—The case of independent and identically distributed chance variables. Ann. Math. Stat. 1958, 29, 700–718. [Google Scholar] [CrossRef]
- Pang, G.; Shen, C.; Cao, L.; van Hengel, A. Deep Learning for Anomaly Detection: A Review. ACM Comput. Surv. 2021, 54, 1–38. [Google Scholar] [CrossRef]
- Pang, G.; Yan, C.; Shen, C.; van den Hengel, A.; Bai, X. Self-trained Deep Ordinal Regression for End-to-End Video Anomaly Detection. arXiv 2020, arXiv:2003.06780v1. [Google Scholar]
- Liao, W.; Guo, Y.; Chen, X.; Li, P. A Unified Unsupervised Gaussian Mixture Variational Autoencoder for High Dimensional Outlier Detection. In Proceedings of the 2018 IEEE International Conference on Big Data (Big Data), Seattle, WA, USA, 10–13 December 2018. [Google Scholar]
- Li, Y.; Wang, Y.; Ma, X. Variational autoencoder-based outlier detection for high-dimensional data. Intell. Data Anal. 2019, 23, 991–1002. [Google Scholar] [CrossRef]
- Rastogi, V.; Suciu, D.; Hong, S. The Boundary between Privacy and Utility in Data Publishing. In Proceedings of the 33rd International Conference on Very Large Data Bases, Vienna, Austria, 23–27 September 2007. [Google Scholar]
- Wu, W.; Cheng, X.; Ding, M.; Xing, K.; Liu, F.; Deng, P. Localized outlying and boundary data detection in sensor networks. IEEE Trans. Knowl. Data Eng. 2007, 19, 1145–1157. [Google Scholar] [CrossRef]
- Ahmim, A.; Maglaras, L.; Ferrag, M.A.; Derdour, M.; Janicke, H. A novel hierarchical intrusion detection system based on decision tree and rules-based models. In Proceedings of the 2019 15th International Conference on Distributed Computing in Sensor Systems (DCOSS), Santorini, Greece, 29–31 May 2019. [Google Scholar]
- Keller, K. Entropy Measures for Data Analysis II: Theory, Algorithms and Applications. Entropy 2021, 23, 1496. [Google Scholar] [CrossRef] [PubMed]
- Costa, M.; Goldberger, A.L.; Peng, C.K. Multiscale entropy analysis of biological signals. Phys. Rev. E Stat. Nonlin. Soft. Matter. Phys. 2005, 71 2 Pt 1, 021906. [Google Scholar] [CrossRef]
- Wu, W.; Huang, Y.; Kurachi, R.; Zeng, G.; Xie, G.; Li, R.; Li, K. Sliding Window Optimized Information Entropy Analysis Method for Intrusion Detection on In-Vehicle Networks. IEEE Access 2018, 6, 45233–45245. [Google Scholar] [CrossRef]
- Atienza, N.; Gonzalez-Díaz, R.; Soriano-Trigueros, M. On the stability of persistent entropy and new summary functions for topological data analysis. Pattern Recognit. 2020, 107, 107509. [Google Scholar] [CrossRef]
- Richman, J.S.; Moorman, J.R. Physiological time-series analysis using approximate entropy and sample entropy. Am. J. Physiol. Heart Circ. Physiol. 2000, 278, H2039–H2049. [Google Scholar] [CrossRef] [PubMed]
- Gao, Y.; Kontoyiannis, I.; Bienenstock, E. Estimating the entropy of binary time series: Methodology, some theory and a simulation study. Entropy 2008, 10, 71–99. [Google Scholar] [CrossRef]
- Zaccarelli, N.; Li, B.-L.; Petrosillo, I.; Zurlini, G. Order and disorder in ecological time-series: Introducing normalized spectral entropy. Ecol. Indic. 2013, 28, 22–30. [Google Scholar] [CrossRef]
- Singh, V.P.; Cui, H. Entropy theory for streamflow forecasting. Environ. Process. 2015, 2, 449–460. [Google Scholar] [CrossRef]
- Kaggle. Breast Cancer Dataset. Available online: https://www.kaggle.com/datasets/yasserh/breast-cancer-dataset (accessed on 13 September 2023).
- ECG of Cardiac Ailments Dataset. Available online: https://www.kaggle.com/datasets/akki2703/ecg-of-cardiac-ailments-dataset (accessed on 13 September 2023).
- Alekhya, L.; Kumar, P.R. A new approach to detect cardiovascular diseases using ECG scalograms and ML-based CNN algorithm. Int. J. Comput. Vis. Robot. 2022. [Google Scholar] [CrossRef]


| PyOD Algorithm | Outliers Fraction | Parameters |
|---|---|---|
| LOF | 0.01/0.1/0.15 | n_neighbors = 20, algorithm = ‘auto’, leaf_size = 30, metric = ‘minkowski’, p = 2, metric_params = None |
| SOS | perplexity = 4.5, metric = ‘euclidean’, eps = 1 × 10⁻⁵ | |
| KNN | n_neighbors = 5, method = ‘largest’, radius = 1.0, algorithm = ‘auto’, leaf_size = 30, metric = ‘minkowski’, p = 2, | |
| HBOS | n_bins = 10, alpha = 0.1, tol = 0.5 | |
| IForest | n_estimators = 100, max_samples = “auto”, contamination = 0.1, max_features = 1., bootstrap = False, | |
| MCD | store_precision = True, assume_centered = False, support_fraction = None, |
| Data Set | Samples Number | Attributes Number | Classes Number | |
|---|---|---|---|---|
| 1 | Breast_Cancer | 569 | 30 | 2 |
| 2 | HCV | 598 1 | 13 | 4 |
| 3 | ECG | 1200 | 48 2 | 4 |
| Breast_Cancer Dataset | Digts: 2, Samples: 399, Features: 2 | ||||||||
|---|---|---|---|---|---|---|---|---|---|
| Split 0.3 | 0.01 | 0.1 | 0.15 | ||||||
| Init | Time | Outliers | Acc | Time | Outliers | Acc | Time | Outliers | Acc |
| PRAISE | 0.027 s | 4 | 0.99 | 0.025 s | 40 | 0.9 | 0.030 s | 60 | 0.85 |
| LOCI | 81.994 s | 30 | 0.925 | 84.140 s | 26 | 0.935 | 82.732 s | 32 | 0.92 |
| SOS | 0.677 s | 4 | 0.99 | 0.688 s | 40 | 0.9 | 0.687 s | 60 | 0.85 |
| KNN | 0.006 s | 4 | 0.99 | 0.005 s | 40 | 0.9 | 0.016 s | 60 | 0.85 |
| CBLOF | 1.793 s | 4 | 0.99 | 1.937 s | 40 | 0.9 | 1.832 s | 60 | 0.85 |
| HBOS | 1.511 s | 4 | 0.99 | 1.582 s | 40 | 0.9 | 1.532 s | 60 | 0.85 |
| IForest | 0.241 s | 4 | 0.99 | 0.253 s | 40 | 0.9 | 0.244 s | 60 | 0.85 |
| MCD | 0.126 s | 4 | 0.99 | 0.137 s | 40 | 0.9 | 0.119 s | 60 | 0.85 |
| Vd-LOD | 0.790 s | 2 | 0.995 | 8.075 s | 17 | 0.957 | 12.205 s | 27 | 0.932 |
| HCV Dataset | digts: 13, samples: 414, features: 4 | ||||||||
| Split 0.3 | 0.01 | 0.1 | 0.15 | ||||||
| init | time | outliers | Acc | time | outliers | Acc | time | outliers | Acc |
| PRAISE | 0.007 s | 5 | 0.988 | 0.007 s | 42 | 0.899 | 0.007 s | 62 | 0.85 |
| LOCI | 98.691 s | 44 | 0.894 | 98.906 s | 46 | 0.889 | 100.202 s | 42 | 0.899 |
| SOS | 0.684 s | 5 | 0.988 | 0.679 s | 42 | 0.899 | 0.682 s | 62 | 0.85 |
| KNN | 0.005 s | 5 | 0.988 | 0.005 s | 42 | 0.899 | 0.005 s | 62 | 0.85 |
| CBLOF | 1.573 s | 5 | 0.988 | 1.554 s | 42 | 0.899 | 1.549 s | 62 | 0.85 |
| HBOS | 1.501 s | 5 | 0.988 | 1.516 s | 42 | 0.899 | 1.507 s | 62 | 0.85 |
| IForest | 0.238 s | 5 | 0.988 | 0.239 s | 42 | 0.899 | 0.238 s | 62 | 0.85 |
| MCD | 0.049 s | 5 | 0.988 | 0.050 s | 42 | 0.899 | 0.046 s | 62 | 0.85 |
| Vd-LOD | 1.248 s | 2 | 0.995 | 10.361 s | 19 | 0.954 | 15.571 s | 31 | 0.925 |
| ECG Dataset | digts: 4, samples: 840, features: 4 | ||||||||
| Split 0.3 | 0.01 | 0.1 | 0.15 | ||||||
| init | time | outliers | Acc | time | outliers | Acc | time | outliers | Acc |
| PRAISE | 0.003 s | 3 | 0.986 | 0.003 s | 22 | 0.897 | 0.003 s | 32 | 0.85 |
| LOCI | 13.157 s | 9 | 0.958 | 12.998 s | 11 | 0.948 | 13.017 s | 10 | 0.953 |
| SOS | 0.560 s | 3 | 0.986 | 0.558 s | 22 | 0.897 | 0.552 s | 32 | 0.85 |
| KNN | 0.002 s | 3 | 0.986 | 0.002 s | 22 | 0.897 | 0.002 s | 31 | 0.854 |
| CBLOF | 1.536 s | 3 | 0.986 | 1.949 s | 22 | 0.897 | 1.559 s | 32 | 0.85 |
| HBOS | 1.496 s | 3 | 0.986 | 1.510 s | 22 | 0.897 | 1.545 s | 32 | 0.85 |
| IForest | 0.227 s | 3 | 0.986 | 0.227 s | 22 | 0.897 | 0.235 s | 32 | 0.85 |
| MCD | 0.053 s | 3 | 0.986 | 0.058 s | 22 | 0.897 | 0.060 s | 32 | 0.85 |
| V-LOD | 0.272 s | 1 | 0.995 | 2.103 s | 9 | 0.958 | 3.188 s | 15 | 0.93 |
Disclaimer/Publisher’s Note: The statements, opinions and data contained in all publications are solely those of the individual author(s) and contributor(s) and not of MDPI and/or the editor(s). MDPI and/or the editor(s) disclaim responsibility for any injury to people or property resulting from any ideas, methods, instructions or products referred to in the content. |
© 2023 by the authors. Licensee MDPI, Basel, Switzerland. This article is an open access article distributed under the terms and conditions of the Creative Commons Attribution (CC BY) license (https://creativecommons.org/licenses/by/4.0/).
Share and Cite
Quan, L.; Gong, T.; Jiang, K. Similarity Distribution Density: An Optimized Approach to Outlier Detection. Electronics 2023, 12, 4227. https://doi.org/10.3390/electronics12204227
Quan L, Gong T, Jiang K. Similarity Distribution Density: An Optimized Approach to Outlier Detection. Electronics. 2023; 12(20):4227. https://doi.org/10.3390/electronics12204227
Chicago/Turabian StyleQuan, Li, Tao Gong, and Kaida Jiang. 2023. "Similarity Distribution Density: An Optimized Approach to Outlier Detection" Electronics 12, no. 20: 4227. https://doi.org/10.3390/electronics12204227
APA StyleQuan, L., Gong, T., & Jiang, K. (2023). Similarity Distribution Density: An Optimized Approach to Outlier Detection. Electronics, 12(20), 4227. https://doi.org/10.3390/electronics12204227