Abstract
Food safety technologies are important in maintaining physical health for everyone. It is important to digitize the scents of foods to enable an effective human–computer interface for smells. In this work, an intelligent gas-sensing system is designed and integrated to capture the smells of food and convert them into digital scents. Fruit samples are used for testing as they release volatile organic components (VOCs) which can be detected by the gas sensors in the system. Decision tree, principal component analysis (PCA), linear discriminant analysis (LDA), and one-dimensional convolutional neural network (1D-CNN) algorithms were adopted and optimized to analyze and precisely classify the sensor responses. Furthermore, the proposed system and data processing algorithms can be used to precisely identify the digital scents and monitor the decomposition dynamics of different foods. Such a promising technology is important for mutual understanding between humans and computers to enable an interface for digital scents, which is very attractive for food identification and safety monitoring.
1. Introduction
In 2013, 14.3% of American households had pabulum insecurity [1]. It was estimated that 55,961 people are admitted to hospital with about 1350 deaths related to food each year in the United States [2]. In addition, food allergies caused by the confusion of food can result in life-threatening incidents [3,4,5]. Food safety is closely correlated to its species and quality, so monitoring and discrimination are essential. In pabulum quality monitoring, colorimetric designators are often used to identify transmutations in temperature and toxic gases to monitor food indirectly during storage [6]. Other designators have been selected for tracking the spoilage of chicken [7], salmon [8], and shrimp [9] through releasing volatile amines and amine derivatives. In addition, machine learning methods have been adopted and integrated with thermal imaging to monitor the quality of fruits in storage [10]. Recently, there is an increasing interest in integrating neural network methods (i.e., CNN) and image databases in classifying foods for controlling dietary intake [11]. In general, these artificial neural network studies showed good selectivity and reusability, which are promising for the identification of food odors.
In general, food designators, which are colorimetric stickers and labels to reflect food quality and conditions (e.g., storage time, temperature, and freshness), show color change upon exposure to food [6]. However, they are generally discarded after use, which is not environmentally friendly. In addition, food designators give limited information about foods and only work for a limited number of foods. Digital imaging is an option to categorize food [7]. However, images are easily affected by light, focus, and resolution and do not contain any detailed chemical information. Digitizing the scents of food with an array of sensors is a simple and probably more feasible method to identify food and guarantee the quality of food.
As an important category of food, fruits release scents with certain unique combinations and concentrations of VOCs [12,13,14,15,16,17]. The composition of VOCs, which determines the smells of fruits, depends on enzymes, substrate, temperature, and other factors [12,18]. Therefore, the detected composition of VOCs can be used to identify the type, maturity [19,20,21], origin [22], and storage conditions [23] of the fruits. By comparing the concentrations and types of the odors released from fruits, the fruits and decomposition conditions can be precisely identified and monitored. The previous E-nose studies related to the VOCs of fruits and other foods were based on traditional machine learning methods such as principal component analysis (PCA) [24,25,26], linear discriminant analysis (LDA) [27,28,29,30], and support vector machines (SVM) [30], while one-dimensional convolutional neural networks (1D-CNN) mainly composed of 1D convolutional layers for feature extraction and dense layers for classification [31,32,33] were gradually adopted in the VOCs analysis of food with high accuracy [34,35]. However, artificial neural networks (ANN), which mainly consists of multilayer perceptron (MLP) [36,37] as dense layers of 1D-CNN [38], have already shown high classification accuracy in E-nose studies [39,40,41]. It is still doubtful whether 1D convolutional layers themselves have a better feature extraction capability than commonly used manual feature extraction methods.
In this work, we developed an intelligent gas-sensing system to detect and process odor information of fruits of different types and different decomposition conditions. The system is equipped with an array of sensors, a microprocessor enabled with different algorithms, and a sniffing system. Metal oxide (MOX) sensors were selected for cost-effective and widely-used purposes. Typically, a deep learning algorithm, 1D-CNN, was adopted and optimized in the system to continuously improve its precision with more and more training and testing of food detection. For comparison, other methods, such as exponential fitting, PCA, LDA, and decision trees, were also adopted to test the system. In addition, this work demonstrates convolutional layers have a better feature extraction capability than the conventional feature extraction method represented by exponential fitting.
2. System Integration, Data Collection, and Analysis Methods
2.1. The Intelligent Gas-Sensing System
The design and assembled circuit of the intelligent gas-sensing system are illustrated in Figure 1. The operation of the sniffing system is precisely controlled by the microcontroller, electric valves, and pump. The blue and orange arrows indicate the flow of the gas and the electric signal transmission, respectively. The carrier gases, such as N2, Ar, or air, are used to carry the releasing fruit’s VOCs in the container onto the gas sensors. Its flow speed and direction are controlled by the pump and three-way electric valve.
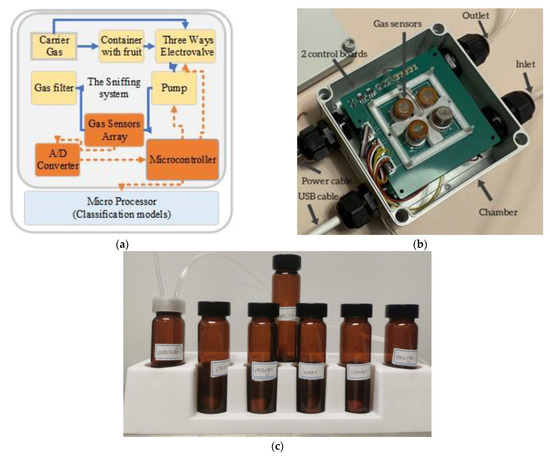
Figure 1.
The intelligent gas-sensing system: (a) the architecture of the intelligent gas-sensing system is built up with a gas control module (top), signal sampling module (middle), and classification module (bottom); (b) the hardware of the sniffing system, a chamber containing an array of gas sensors, A/D converter, micro control unit, gas inlet, and outlet on its edge; (c) 7 types of peeled fruits were placed in containers separately.
The conductance of the gas sensors shows a change in response to the fruit VOCs. The response of conductance is usually represented by the voltage of the resistors connected in a series in the gas sensor. An analog/digital (A/D) converter is adopted for sampling and converting the voltage signal into digital information which is transferred to the microcontroller. The microprocessor is equipped with the proposed algorithms to identify the fruits and monitor the decomposition dynamics of the fruits by analyzing the digital scents transferred from microcontroller.
As shown in Figure 1b, the sniffing system and circuit boards are integrated in a sealed chamber. The device has two printed circuit boards (PCBs). The top PCB integrates four different types of gas sensors, while the bottom one is composed of an A/D converter, microcontroller, electronic controls of a small mechanical pump, and three-way valve. The microcontroller is connected to the external microprocessor through a USB cable.
In this system, four metal oxide sensors, MQ3, MQ4, MQ7, and MQ9, which are manufactured by Winsen Electronics, are adopted to mainly detect alcohol, methane, carbon monoxide, and propane, respectively. To better detect the scents, the gas sensors with low conductance as a baseline are placed in the front, meeting the inlet in the chamber. The to-be-sniffed carrier gas carries the fruit scent from the container and flows through a three-way electric valve into the chamber. The percentage change in sensor conductance, defined as the change in conductance (∆G) divided by the initial conductance (G) and known as relative conductance, (∆G/G), increases upon exposure to carrying gases mixed with the typical VOCs of fruits. After a detection period, the gas mixture in the chamber is pumped out and refreshed with air through the three-way electric valve. The conductance gradually returns to the initial value. Figure 2a shows the relative conductance response of the MQ7 sensor upon exposure to different fruit scents. The remarkable difference in conductance response is caused by different fruit scents and different concentrations. As shown in Figure 2b, the peak values of ∆G/G increase quite linearly with an increasing number of storage days. Such a linear correlation is advantageous for the system to monitor the changes in fruit scents. Hence, the ∆G/G curves contain all the information, such as classifying features (discussed in Section C), to identify fruits and their decomposition states. It should be noted that drift is a concern in the application of MOX sensors and is difficult to completely avoid. To minimize its effect, we replace the absolute value in resistance change with the relative conductance change, ∆G/G. This way, the response curves begin at the same initial value, as shown in Figure 2b.
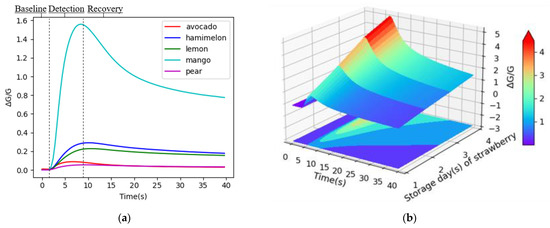
Figure 2.
The relative conductance response of the gas sensor to fruit: (a)the relative conductance response of the MQ7 sensor to different kinds of fruit odors, which consists of baseline region, detection region, and recovery region; (b) the relative conductance response of the MQ7 sensor to peeled strawberry on different storage days.
2.2. Data Collection and Testing
Due to the severe allergy caused by some fruit species, such as avocado [4,5], it is important to discriminate the fruit types. In this work, 7 types of peeled fruits were placed in containers and then sniffed and sampled by the intelligent gas-sensing system, as shown in Figure 1c, where avocado, melon, lemon, mango, and pear were selected for classification testing. The response (∆G/G) of 4 sensors to these 5 fruits was used to construct a dataset where each fruit smell contains 15 samples measured with one individual fruit. On the other hand, studies suggest that the decay of fruits is closely related to storage days [42,43,44,45,46], and we observed that there was mold on the surface of the fruits around the fourth storage day. Hence, we assume the decomposition states of fruit can be represented by the storage days to simplify the decay analysis of fruits in this work. During the testing in decomposition monitoring, peeled fruits, including strawberry and orange, were sampled on 4 days in series. This measurement constructs a different dataset which contains 20 samples measured with same individual fruits for each storage time. During the whole sampling process, the temperature stayed at 25 °C with an error within ±2 °C and relative humidity staying at 40–60%, which is detected by the HTU21D(F) sensor. In addition, 5-fold cross-validation [47] was introduced to randomly divide the whole set into 5 segments. Each segment was used as the validation dataset to evaluate the accuracy of the algorithms in the discussion section, while the remaining 4 segments were combined to form the training set. The accuracy is the mean value of 5 maximized accuracies which were tested by 5 validation sets.
2.3. Analysis Methods
For a comprehensive analysis of the ∆G/G curves, we integrated feature extraction methods with machine learning algorithms to enable intelligent gas sensing in classifying fruits and monitoring fruit decomposition. We applied exponential fitting, a manual feature extraction method, one-dimension (1D) convolutional layers, and a machine-learning-based method, to obtain key information (i.e., features) of fruit scents from the primitive response data. In exponential fitting, an exponential equation is adopted to fit the ∆G/G curves, whereas the main features are the fitting coefficients of the equation. On the other hand, the 1D convolutional layers integrate linear and nonlinear operations to extract the features progressively with hierarchical kernels applied across the curves [48]. To discriminate and visualize the features above, this work has studied decision tree, principal component analysis (PCA), one-dimensional convolutional neural network (1D-CNN), and linear discriminant analysis (LDA) methods. The decision tree partitions the feature space into pure single-class subspaces recursively with the coefficients of exponential fitting [49]. Principal component analysis (PCA) is applied in further extraction of more distinguishable features from the coefficients’ exponential fitting. 1D-CNN is adopted and modified for the training of 1D convolutional layers and then used to differentiate the features captured by these layers. Linear discriminant analysis (LDA) is used to intuitively visualize and compare the effectiveness of the features acquired from the feature extraction algorithms above.
3. Results and Discussion
In the comparison of feature extraction algorithms and machine learning methods, we adopted and optimized three classification models: the decision tree model, PCA model, and 1D-CNN model.
3.1. Results of Decision Tree Model
The decision tree is based on a hierarchical model with discriminant functions that partition the feature space of a data set into pure single-class subspaces recursively. The simplification of its structure is advantageous for fast computing and low requirements for the hardware system. In the decision tree model (Figure 3a), features fed as input to the decision tree are extracted by exponential fitting. In exponential fitting, an exponential equation [50] was adopted to fit the relative conductance curve and extract the main features, as in Equation (1):
where and represent the change of conductance and initial conductance of the curve, respectively; , , and are the coefficients to be solved by fitting process; t is the time. The fitting of increasing and decreasing curves of the sensor conductance response generated two sets of coefficients (, , ) which represent the features upon exposure to or recovering from fruit scents, corresponding to the detection and recovery region in Figure 2a. Before feeding into the decision tree, StandardScaler function was used to normalize and then scale the coefficients into the unit variance to mitigate the drift effect, which was also adopted in the PCA model. The decision tree uses these coefficient sets as the decision boundaries of discriminant functions to divide the feature space for each node [49]. It should be noted that the decision tree exponential fitting may exhibit low accuracy. However, it can select the gas sensors by evaluating and tracking the coefficients adopted in the structure of the decision tree.
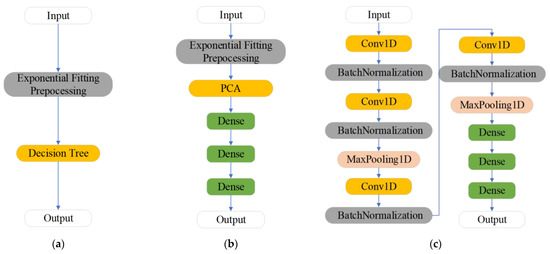
Figure 3.
The models for classification and monitoring of the fruits: (a) the decision tree model composed of exponential fitting and decision trees; (b) the PCA model composed of exponential fitting, PCA, and dense layers; (c) the 1D-CNN model composed of one-dimensional convolutional layers, batch normalization layers, max-pooling layers, and dense layers.
Figure 4 shows the process of a trained decision tree in classifying the training set with five types of fruits. There were four branch nodes, which represent the feature spaces, and five leaf nodes, which represent the types of fruits in the decision tree model. The root node in the top branch represents the entire feature space, while the remaining nodes represent subspaces of the original feature space [49]. The avocado data samples were first separated from the original feature space by the first decision boundary, e.g., the “c” of (1) by fitting the response data of the fourth sensor is equal to 1.21. According to the same manner, other fruit data samples were hierarchically separated by other decision boundaries. In the decision tree, we found that the fourth sensor played a vital role as its feature is adopted twice per cycle, while the feature of the third sensor is rarely utilized. Hence, the decision tree can also evaluate sensor effectiveness and investigate the reliability of exponential fitting. In addition, the decision tree models achieved their best prediction accuracies, 85.91%, 94.86%, and 77.21%, in classifying the five types of fruits, 4 different strawberry decomposition days and 4 days of orange decomposition, respectively. The results are also listed in Table 1, indicating that the decision tree model is capable of classifying both the types and decomposition of the fruits.
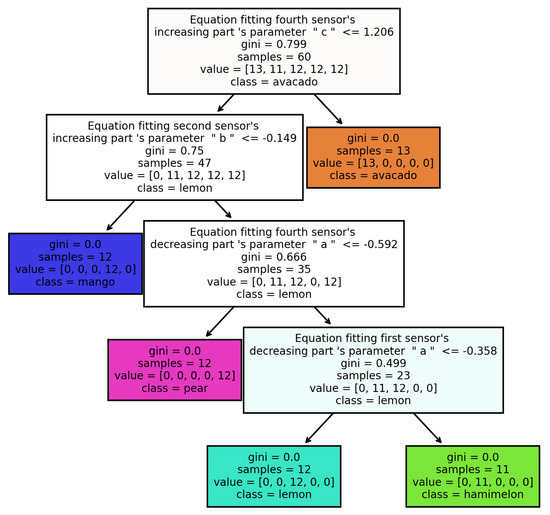
Figure 4.
The process and result of a decision tree model for classifying 5 types of fruits. The first node on the top relies on the parameter “c”, from equation (1) fitting of MQ3 response to separate the avocado samples from the whole training dataset. Other nodes use the same process to classify the fruits.

Table 1.
Five-fold cross-validation recognition accuracy with different models.
3.2. Results of PCA Model
Principal component analysis (PCA) is often used in analyzing the VOCs related to food [24,25,26,51,52,53,54,55,56]. It significantly reduces the dimension of the features while retaining the most important information, which is advantageous for classification [57]. In the PCA model (Figure 3b), coefficients provided by exponential fitting were fed into PCA with the dense layers. The embedded feature vectors generated by PCA were mapped and analyzed to predict the probability of each class in the dense layers, where the Softmax function [58] was adopted, as in Equation (2):
in which N is the number of classes; = 1, 2, …, N; is the input value; is the probability of sample corresponding to the class. After setup, the PCA model was trained using an Adam optimizer [59] for 200 epochs with a learning rate set to 0.001 and batch size set to 3. As listed in Table 1, it achieved 90.51% accuracy in classifying five types of fruit by using the five-fold cross-validation method. As for the classification of the strawberry dataset and the orange dataset stored on different days, the PCA model achieved its best accuracies, 97.33% and 81.90%, respectively. These results are reflected by PCA plots, as shown in Figure 5. The PCA model exhibited higher accuracy because it could extract more relevant and precise features in comparison with decision tree method, which directly used the fitting features. This comparison also indicated feature extraction is critical in classifying digital scents.
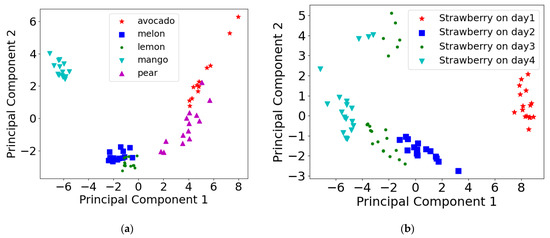
Figure 5.
(a) The PCA plot for features extracted from sensor conductance responses of different types of fruits by equation (1) fitting, with principal component 1 (PC1) accounting for 42.5% and principal component 2 (PC2) accounting for 16.1%. (b) PCA plot for features extracted from sensor conductance responses of strawberry on different storage days by equation (1) fitting, with PC1 accounting for 60.9% and PC2 accounting for 8.7%.
3.3. Result of 1D-CNN Model
In this work, we designed a 1D-CNN model for fruit scents (described in Figure 3c) to extract ∆G/G features more comprehensively than those of exponential fitting. It consists of four 1D convolutional layers, four batch normalization layers, two max-pooling layers and three dense layers. The 1D convolutional layers extract the features of ∆G/G curves with stride set to 1 and convolutional kernels set (i.e., channel number × size) to 64 × 10, 32 × 8, 16 × 5, and 8 × 1. The batch normalization layers normalized the outputs of the convolutional layers to mitigate the drift effect. The resulting feature maps are then activated by the rectified linear activation function for speeding up the training process [60]. To avoid overfitting, max-pooling was employed to downsample the feature maps by a factor of 2. Finally, the dense layers map the flattened and embedded features into the possibility for each class [48] with a Softmax function as (2). After setup, the 1D-CNN model was also trained using an Adam optimizer [59] for 200 or 400 epochs with a learning rate of 0.001 and batch size of 3.
In general, the values of log accuracy and loss over hundreds of epochs (i.e., iterations) are good indicators of the improvement by the training set and validation set. A smaller loss or larger accuracy value is achieved by a better model. Furthermore, over-fitting can be avoided if the validation loss is very close to the training loss [32]. The plots of accuracy and loss are shown in Figure 6. In this case, the Multi-Label Soft Margin Loss function was adopted to calculate the loss, as in Equation (3):
where C is the number of classes; N is the number of the training samples; is the prediction vector (i.e., the output of the model); is the corresponding label vector of [61]. The results indicate that the losses of both the training and validation sets were reduced sharply in the first 60 epochs and finally reached 0.62 after 350 epochs. The accuracy increased sharply and finally reached 100%. The results indicated that the adopted model successfully avoided overfitting. The five-fold cross-validation accuracy reached 100% in the classification of five types of fruits. In addition, identification of strawberry and orange decomposition at different storage days also achieved 100% accuracy with five-fold cross-validation (see Table 1). To compare the capability of the 1D-CNN we designed, a different 1D-CNN model consisting of the structure, hyperparameter of layers, and loss function given in [34,35] was trained and tested, while the other hyperparameters were kept the same. As shown in Table 1, the 1D-CNN model we designed can achieve higher classification accuracy. This is because we stacked denser layers to increase its classifying accuracy and set some of the convolutional layers with longer kernel sizes to capture the features of longer continuous patterns of ∆G/G. Overall, the 1D-CNN model has achieved the best accuracy among all the models in the classification of all the datasets. In this work, the features of sensor response are extracted from the curves of relative change in conduction (∆G/G) vs. time. For example, the slopes of the ∆G/G curves are the main indicators of how fast and how sensitive the sensors react with VOCs [62]. The convolutional layers in 1D-CNN model can capture the whole pattern of sensor response [63]. In comparison, the exponential fitting method can only capture part of the patterns reflected by the slopes when Equation (1) is used for curve fitting. This is further verified by LDA analysis in Section 3.4.
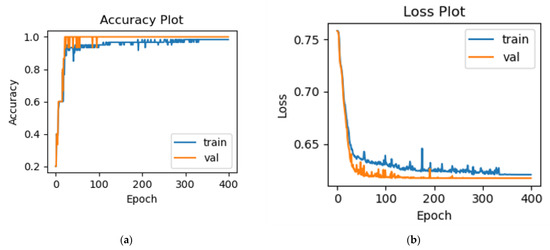
Figure 6.
The training results of 1D-CNN for classification of 5 types of fruits: (a) the accuracy plot and (b) the loss plot.
3.4. Result of LDA Assisted with 1D Convolutional Layers and Exponential Fitting
Linear discriminant analysis (LDA) is a commonly used technique aiming at dimensionality reduction, feature extraction and pattern classification in fruit analysis [24,25,26,27,28,29,30]. It increases the interclass variance while decreasing the intraclass variance with maximized class discrimination [64] and a clear indication of feature effectiveness. Figure 7a,b show the LDA results based on the features extracted by exponential fitting and one-dimensional convolutional layers, respectively. All fruits are identified and clearly separated in the plots. There is a slight overlap of the melon and lemon clusters for LDA with exponential fitting, but the result of LDA with features from 1-D convolutional layers shows significant improvement. This indicates that one-dimensional convolutional layers are better at capturing comprehensive and discriminating features than exponential fitting.
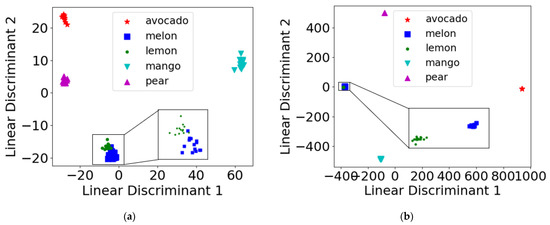
Figure 7.
The LDA plot for sensor conductance responses of different types of fruits: (a) LDA plot for features extracted by equation (1) fitting, with linear discriminant 1 (LD1) accounting for 77.2% and linear discriminant 2 (LD2) accounting for 16.8%; (b) LDA plot for features extracted by 1D convolutional layers, with linear discriminant 1 accounting for 65.2% and linear discriminant 2 accounting for 27.0%.
The intelligent gas-sensing system can also be used to monitor fruit decomposition. As shown in Figure 8, LDA was performed on the feature extracted by exponential fitting on the sensor response to orange and strawberry which were exposed to air for different days. The result indicated that the decomposition of both orange and strawberry can be clearly identified. For orange decomposition, the LD1 decreases with increasing exposure days, exhibiting certain linearity between feature and decomposition time. It should be noted that the linearity can be more remarkable if only one dimension of the linear discriminant is used. Nonetheless, this result indicates that our intelligent system and proposed analysis algorithms can measure and capture the key characteristics of fruit decomposition.
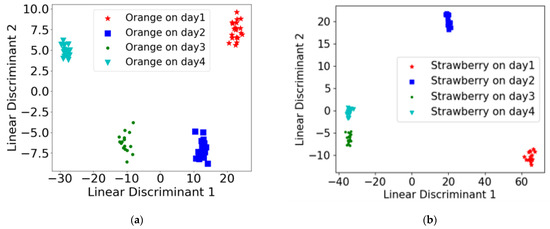
Figure 8.
LDA plot for sensor conductance responses of fruits in different storage days: (a) LDA plot for features extracted from orange by Eq.1, with linear discriminant 1 (LD1) accounting for 87.20% and linear discriminant 2 (LD2) accounting for 9.14%; (b) LDA plot for features extracted from strawberry by equation (1), with linear discriminant 1 accounting for 90.16% and linear discriminant 2 accounting for 6.56%.
3.5. Robustness and Reproducibility
So far, the robustness and reproducibility are still significant concerns for the gas-sensing system. With different individuals or circumstances, the features may be affected to some extent. To verify whether the system and models we designed are affected by other factors while capturing the features of the VOCs released by the fruits, we repeated the measurement and built up a robustness dataset, where several individual fruits of each category were detected in different temperatures and humidity levels. During the sampling of five types of the fruits, the temperature stayed at 26 °C with an error within ±1 °C and relative humidity close to the fruits staying at 60–70%, where the maximum temperature and humidity differences between individuals of the same category were 0.3 °C and 8%, respectively. During the decomposition tests for orange and strawberry, the temperature stayed at 26 °C with an error within ±2 °C and relative humidity staying at 65–80%, where the maximum temperature and humidity differences between individuals of the same category on the same days were 1.1 °C and 7%, respectively. For each fruit, we obtained around 15 and 26 samples (for each decomposition day) from different individual fruits of each category for type discrimination and decomposition monitoring, respectively. Model prediction accuracies for the robustness data set are shown in Table 2. Compared with the result in Table 1, the performance of the models is slightly reduced, while the accuracy rankings among the models for different prediction purposes remain the same. This accuracy reduction can be attributed to different individuals and the wide-range of humidity and temperature fluctuations which affect the resistance response in the sensors and therefore increase the difficulty in discrimination. However, the models we designed can still capture some of the significant features from the fruits under such effects.
Table 2.
Five-fold cross-validation recognition accuracy in the robustness dataset.
Among all the models, the optimized 1D-CNN still has the best performance. Figure 9a,b show the LDA results of the robustness dataset based on the features extracted by exponential fitting and 1D convolutional layers, respectively. Two types of fruit (pear and mango) clusters overlapped with each other in exponential fitting (Figure 9a), while 1D convolutional layers extracted the valuable features helping LDA to clearly separate different fruit categories in such a robustness dataset (Figure 9b). This further verified that the optimized 1D convolutional layers can extract key features even for the sampling data from different individuals and in circumstances with variation more comprehensive than those by exponential fitting. This further indicates the robustness and reproducibility of the proposed system and algorithm.
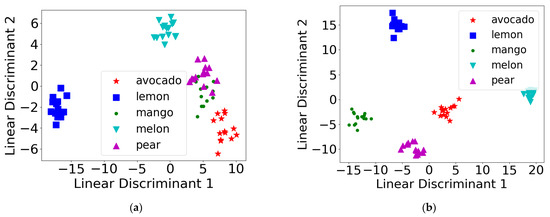
Figure 9.
The LDA plot for sensors’ conductance responses of different types of fruits in the robustness dataset: (a) LDA plot for features extracted by equation (1) fitting, with linear discriminant 1 (LD1) accounting for 81.40% and linear discriminant 2 (LD2) accounting for 10.70%; (b) LDA plot for features extracted by 1D convolutional layers, with linear discriminant 1 accounting for 49.86% and linear discriminant 2 accounting for 30.29%.
4. Conclusions
In this work, an intelligent gas-sensing system was designed to classify fruits and monitor their decomposition by collecting their smells. A 1D-CNN algorithm was engineered and used to capture the whole pattern of all sensor conductance responses. With LDA visualization and five-fold cross-validation, the 1D convolutional layers exhibited better feature extraction capability and robustness than the exponential fitting. In addition, the decomposition monitoring is demonstrated by the high accuracy of classification and the consistency of the primitive characteristics and the characteristics captured by LDA. In general, the 1D-CNN model achieved the highest accuracy in the classification and monitoring of fruit, while the decision tree model performed worst but evaluated the effectiveness of each sensor. This work provides a valuable reference to digitize scents for precise food identification and decomposition monitoring.
Author Contributions
Conceptualization, Q.L.; methodology, Q.L. and Y.L.; software, Z.Y. and Y.L.; validation, Z.Y. and Y.L.; formal experiment and analysis, Y.L.; investigation, Y.L. and Q.L.; resources, Q.L.; data curation, Y.L. and Z.Y.; writing—original draft preparation, Y.L.; Writing—review and editing, Y.L. and Q.L.; supervision, Q.L.; project administration, Q.L.; funding acquisition, Q.L. All authors have read and agreed to the published version of the manuscript.
Funding
The authors acknowledge the support of Virginia Microelectronics Consortium (VMEC) research grant and Distinguished VMEC Chair Professorship.
Institutional Review Board Statement
Not applicable.
Informed Consent Statement
Not applicable.
Data Availability Statement
The data are available and can be shared upon request.
Conflicts of Interest
The authors declare no conflict of interest.
References
- Coleman-Jensen, A.; Gregory, C.; Singh, A. Household Food Security in the United States in 2013; United States Department of Agriculture, Economic Research Service: Washington, DC, USA, 2014.
- Scallan, E.; Hoekstra, R.M.; Angulo, F.J.; Tauxe, R.V.; Widdowson, M.-A.; Roy, S.L.; Jones, J.L.; Griffin, P.M. Foodborne illness acquired in the United States--major pathogens. Emerg. Infect. Dis. 2011, 17, 7–15. [Google Scholar] [CrossRef]
- Lucas, J.; Lewis, S.; Hourihane, J. Kiwi fruit allergy: A review. Pediatr. Allergy Immunol. 2003, 14, 420–428. [Google Scholar] [CrossRef]
- Diaz-Perales, A.; Collada, C.; Blanco, C.; Sanchez-Monge, R.; Carrillo, T.; Aragoncillo, C.; Salcedo, G. Cross-reactions in the latex-fruit syndrome: A relevant role of chitinases but not of complex asparagine-linked glycans. J. Allergy Clin. Immunol. 1999, 104, 681–687. [Google Scholar] [CrossRef]
- Möller, M.; Kayma, M.; Vieluf, D.; Paschke, A.; Steinhart, H. Determination and characterization of cross-reacting allergens in latex, avocado, banana, and kiwi fruit. Allergy 1998, 53, 289–296. [Google Scholar] [CrossRef]
- Fuertes, G.; Soto, I.; Carrasco, R.; Vargas, M.; Sabattin, J.; Lagos, C. Intelligent Packaging Systems: Sensors and Nanosensors to Monitor Food Quality and Safety. J. Sens. 2016, 2016, 4046061. [Google Scholar] [CrossRef]
- Kuswandi, B.; Jayus; Oktaviana, R.; Abdullah, A.; Heng, L.Y. A Novel On-Package Sticker Sensor Based on Methyl Red for Real-Time Monitoring of Broiler Chicken Cut Freshness. Packag. Technol. Sci. 2014, 27, 69–81. [Google Scholar] [CrossRef]
- Tseng, S.-Y.; Li, S.-Y.; Yi, S.-Y.; Sun, A.Y.; Gao, D.-Y.; Wan, D. Food Quality Monitor: Paper-Based Plasmonic Sensors Prepared Through Reversal Nanoimprinting for Rapid Detection of Biogenic Amine Odorants. ACS Appl. Mater. Interfaces 2017, 9, 17306–17316. [Google Scholar] [CrossRef]
- Jia, R.; Tian, W.; Bai, H.; Zhang, J.; Wang, S.; Zhang, J. Amine-responsive cellulose-based ratiometric fluorescent materials for real-time and visual detection of shrimp and crab freshness. Nat. Commun. 2019, 10, 795. [Google Scholar] [CrossRef]
- Melesse, T.Y.; Bollo, M.; Di Pasquale, V.; Centro, F.; Riemma, S. Machine Learning-Based Digital Twin for Monitoring Fruit Quality Evolution. Procedia Comput. Sci. 2022, 200, 13–20. [Google Scholar] [CrossRef]
- Lo, F.P.W.; Sun, Y.; Qiu, J.; Lo, B. Image-Based Food Classification and Volume Estimation for Dietary Assessment: A Review. IEEE J. Biomed. Health Inform. 2020, 24, 1926–1939. [Google Scholar] [CrossRef]
- El Hadi, M.A.; Zhang, F.J.; Wu, F.F.; Zhou, C.H.; Tao, J. Advances in fruit aroma volatile research. Molecules 2013, 18, 8200–8229. [Google Scholar] [CrossRef]
- Le Phuc, H.; Tran, D.; Hertog, M.; Nicolaï, B. Effect of controlled atmosphere storage on the quality attributes and volatile organic compounds profile of dragon fruit (Hylocereus undatus). Postharvest Biol. Technol. 2020, 173, 111406. [Google Scholar]
- Spadafora, N.D.; Paramithiotis, S.; Drosinos, E.H.; Cammarisano, L.; Rogers, H.J.; Müller, C.T. Detection of Listeria monocytogenes in cut melon fruit using analysis of volatile organic compounds. Food Microbiol. 2016, 54, 52–59. [Google Scholar] [CrossRef]
- Chen, Y.; Yin, H.; Wu, X.; Shi, X.; Qi, K.; Zhang, S. Comparative analysis of the volatile organic compounds in mature fruits of 12 Occidental pear (Pyrus communis L.) cultivars. Sci. Hortic. 2018, 240, 239–248. [Google Scholar] [CrossRef]
- Liu, Y.; Bu, M.; Gong, X.; He, J.; Zhan, Y. Characterization of the volatile organic compounds produced from avocado during ripening by gas chromatography ion mobility spectrometry. J. Sci. Food Agric. 2021, 101, 666–672. [Google Scholar] [CrossRef]
- Parra-Palma, C.; Úbeda, C.; Gil, M.; Ramos, P.; Castro, R.I.; Morales-Quintana, L. Comparative study of the volatile organic compounds of four strawberry cultivars and it relation to alcohol acyltransferase enzymatic activity. Sci. Hortic. 2019, 251, 65–72. [Google Scholar] [CrossRef]
- Zhang, B.; Xi, W.-p.; Wei, W.-w.; Shen, J.-y.; Ferguson, I.; Chen, K.-s. Changes in aroma-related volatiles and gene expression during low temperature storage and subsequent shelf-life of peach fruit. Postharvest Biol. Technol. 2011, 60, 7–16. [Google Scholar] [CrossRef]
- Mavi, M.; Husin, Z.; Ahmad, R.B.; Mohd Yacob, Y.; Farook, R.; Tan, W. Mango ripeness classification system using hybrid technique. Indones. J. Electr. Eng. Comput. Sci. 2019, 14, 859–868. [Google Scholar]
- Cui, S.; Wang, J.; Yang, L.; Wu, J.; Wang, X. Qualitative and quantitative analysis on aroma characteristics of ginseng at different ages using E-nose and GC–MS combined with chemometrics. J. Pharm. Biomed. Anal. 2015, 102, 64–77. [Google Scholar] [CrossRef]
- Chen, X.; Fedrizzi, B.; Kilmartin, P.A.; Quek, S.Y. Development of volatile organic compounds and their glycosylated precursors in tamarillo (Solanum betaceum Cav.) during fruit ripening: A prediction of biochemical pathway. Food Chem. 2021, 339, 128046. [Google Scholar] [CrossRef]
- Cui, S.; Wu, J.; Wang, J.; Wang, X. Discrimination of American ginseng and Asian ginseng using electronic nose and gas chromatography–mass spectrometry coupled with chemometrics. J. Ginseng Res. 2017, 41, 85–95. [Google Scholar] [CrossRef]
- Cai, H.; Han, S.; Yu, M.; Ma, R.; Yu, Z. Exogenous nitric oxide fumigation promoted the emission of volatile organic compounds in peach fruit during shelf life after long-term cold storage. Food Res. Int. 2020, 133, 109135. [Google Scholar] [CrossRef]
- Shen, F.; Wu, Q.; Su, A.; Tang, P.; Shao, X.; Liu, B. Detection of adulteration in freshly squeezed orange juice by electronic nose and infrared spectroscopy. Czech J. Food Sci. 2016, 34, 224–232. [Google Scholar] [CrossRef]
- Hohmann, M.; Monakhova, Y.; Erich, S.; Christoph, N.; Wachter, H.; Holzgrabe, U. Differentiation of Organically and Conventionally Grown Tomatoes by Chemometric Analysis of Combined Data from Proton Nuclear Magnetic Resonance and Mid-infrared Spectroscopy and Stable Isotope Analysis. J. Agric. Food Chem. 2015, 63, 9666–9675. [Google Scholar] [CrossRef] [PubMed]
- Chen, Q.; Song, J.; Bi, J.; Meng, X.; Wu, X. Characterization of volatile profile from ten different varieties of Chinese jujubes by HS-SPME/GC–MS coupled with E-nose. Food Res. Int. 2018, 105, 605–615. [Google Scholar] [CrossRef]
- Khorramifar, A.; Rasekh, M.; Karami, H.; Malaga-Toboła, U.; Gancarz, M. A Machine Learning Method for Classification and Identification of Potato Cultivars Based on the Reaction of MOS Type Sensor-Array. Sensors 2021, 21, 5836. [Google Scholar] [CrossRef]
- Xiong, Y.; Xiao, X.; Yang, X.; Yan, D.; Zhang, C.; Zou, H.; Lin, H.; Peng, L.; Xiao, X.; Yan, Y. Quality control of Lonicera japonica stored for different months by electronic nose. J. Pharm. Biomed. Anal. 2014, 91, 68–72. [Google Scholar] [CrossRef] [PubMed]
- Esteki, M.; Shahsavari, Z.; Simal-Gandara, J. Use of spectroscopic methods in combination with linear discriminant analysis for authentication of food products (Spectroscopy–linear discriminant analysis for authenticating food products). Food Control 2018, 91, 100–112. [Google Scholar] [CrossRef]
- Karami, H.; Rasekh, M. Application of electronic nose with chemometrics methods to the detection of juices fraud. J. Food Process. Preserv. 2021, 45, e15432. [Google Scholar]
- Peng, P.; Zhao, X.; Pan, X.; Ye, W. Gas Classification Using Deep Convolutional Neural Networks. Sensors 2018, 18, 157. [Google Scholar] [CrossRef]
- Zhao, X.; Wen, Z.; Pan, X.; Ye, W.; Bermak, A. Mixture Gases Classification Based on Multi-Label One-Dimensional Deep Convolutional Neural Network. IEEE Access 2019, 7, 12630–12637. [Google Scholar] [CrossRef]
- Qi, P.F.; Meng, Q.H.; Zeng, M. A CNN-based simplified data processing method for electronic noses. In Proceedings of the 2017 ISOCS/IEEE International Symposium on Olfaction and Electronic Nose (ISOEN), Montreal, QC, Canada, 28–31 May 2017. [Google Scholar]
- Xiong, Y.; Chen, Y.; Chen, C.; Wei, X.; Xue, Y.; Wan, H.; Wang, P. An Odor Recognition Algorithm of Electronic Noses Based on Convolutional Spiking Neural Network for Spoiled Food Identification. J. Electrochem. Soc. 2021, 168, 077519. [Google Scholar] [CrossRef]
- Wang, Y.; Diao, J.; Wang, Z.; Zhan, X.; Zhang, B.; Li, N.; Li, G. An optimized deep convolutional neural network for dendrobium classification based on electronic nose. Sens. Actuators A Phys. 2020, 307, 111874. [Google Scholar] [CrossRef]
- Alom, M.Z.; Taha, T.M.; Yakopcic, C.; Westberg, S.; Sidike, P.; Nasrin, M.S.; Hasan, M.; Van Essen, B.C.; Awwal, A.A.S.; Asari, V.K. A State-of-the-Art Survey on Deep Learning Theory and Architectures. Electronics 2019, 8, 292. [Google Scholar] [CrossRef]
- Rasekh, M.; Karami, H. E-nose coupled with an artificial neural network to detection of fraud in pure and industrial fruit juices. Int. J. Food Prop. 2021, 24, 592–602. [Google Scholar] [CrossRef]
- Kalaycı, T.A.; Asan, U. Improving Classification Performance of Fully Connected Layers by Fuzzy Clustering in Transformed Feature Space. Symmetry 2022, 14, 658. [Google Scholar] [CrossRef]
- Zou, H.Q.; Li, S.; Huang, Y.H.; Liu, Y.; Bauer, R.; Peng, L.; Tao, O.; Yan, S.R.; Yan, Y.H. Rapid Identification of Asteraceae Plants with Improved RBF-ANN Classification Models Based on MOS Sensor E-Nose. Evid.-Based Complement. Altern. Med. 2014, 2014, 425341. [Google Scholar] [CrossRef]
- Ghasemi-Varnamkhasti, M.; Mohammad-Razdari, A.; Yoosefian, S.H.; Izadi, Z.; Siadat, M. Aging discrimination of French cheese types based on the optimization of an electronic nose using multivariate computational approaches combined with response surface method (RSM). LWT 2019, 111, 85–98. [Google Scholar] [CrossRef]
- Gonzalez Viejo, C.; Fuentes, S.; Godbole, A.; Widdicombe, B.; Unnithan, R.R. Development of a low-cost e-nose to assess aroma profiles: An artificial intelligence application to assess beer quality. Sens. Actuators B Chem. 2020, 308, 127688. [Google Scholar] [CrossRef]
- Vicente, A.R.; Martínez, G.A.; Chaves, A.R.; Civello, P.M. Effect of heat treatment on strawberry fruit damage and oxidative metabolism during storage. Postharvest Biol. Technol. 2006, 40, 116–122. [Google Scholar] [CrossRef]
- Fawole, O.A.; Opara, U.L. Effects of storage temperature and duration on physiological responses of pomegranate fruit. Ind. Crops Prod. 2013, 47, 300–309. [Google Scholar] [CrossRef]
- Perkins-Veazie, P.; Collins, J.K.; Clark, J.R. Shelf-life and quality of ‘navaho’ and ‘shawnee’ blackberry fruit stored under retail storage conditions1. J. Food Qual. 1999, 22, 535–544. [Google Scholar] [CrossRef]
- Gao, Y.; Liu, Y.; Kan, C.; Chen, M.; Chen, J. Changes of peel color and fruit quality in navel orange fruits under different storage methods. Sci. Hortic. 2019, 256, 108522. [Google Scholar] [CrossRef]
- Zheng, Y.; Yang, Z.; Chen, X. Effect of high oxygen atmospheres on fruit decay and quality in Chinese bayberries, strawberries and blueberries. Food Control 2008, 19, 470–474. [Google Scholar] [CrossRef]
- Rodriguez, J.D.; Perez, A.; Lozano, J.A. Sensitivity Analysis of k-Fold Cross Validation in Prediction Error Estimation. IEEE Trans. Pattern Anal. Mach. Intell. 2010, 32, 569–575. [Google Scholar] [CrossRef]
- Yamashita, R.; Nishio, M.; Do, R.K.G.; Togashi, K. Convolutional neural networks: An overview and application in radiology. Insights Into Imaging 2018, 9, 611–629. [Google Scholar] [CrossRef]
- Myles, A.J.; Feudale, R.N.; Liu, Y.; Woody, N.A.; Brown, S.D. An introduction to decision tree modeling. J. Chemom. 2004, 18, 275–285. [Google Scholar] [CrossRef]
- Ye, H.; Nallon, E.C.; Schnee, V.P.; Shi, C.; Yuan, H.; Jiang, K.; Gu, K.; Feng, S.; Wang, H.; Xiao, C.; et al. Optimization of the Transient Feature Analysis for Graphene Chemical Vapor Sensors: A Comprehensive Study. IEEE Sens. J. 2017, 17, 6350–6359. [Google Scholar] [CrossRef]
- Cui, S.; Cao, L.; Acosta, N.; Zhu, H.; Ling, P.P. Development of Portable E-Nose System for Fast Diagnosis of Whitefly Infestation in Tomato Plant in Greenhouse. Chemosensors 2021, 9, 297. [Google Scholar] [CrossRef]
- Cui, S.; Inocente, E.A.A.; Acosta, N.; Keener, H.M.; Zhu, H.; Ling, P.P. Development of Fast E-nose System for Early-Stage Diagnosis of Aphid-Stressed Tomato Plants. Sensors 2019, 19, 3480. [Google Scholar] [CrossRef]
- Esteki, M.; Heyden, Y.; Farajmand, B.; Kolahderazi, Y. Qualitative and quantitative analysis of peanut adulteration in almond powder samples using multi-elemental fingerprinting combined with multivariate data analysis methods. Food Control 2017, 82, 31–41. [Google Scholar] [CrossRef]
- Tahri, K.; Tiebe, C.; El Bari, N.; Hübert, T.; Bouchikhi, B. Geographical provenience differentiation and adulteration detection of cumin by means of electronic sensing systems and SPME-GC-MS in combination with different chemometric approaches. Anal. Methods 2016, 8, 7638–7649. [Google Scholar] [CrossRef]
- Karami, H.; Rasekh, M.; Mirzaee-Ghaleh, E. Identification of olfactory characteristics of edible oil during storage period using of MOS sensors signal and ANN methods. J. Food Process. Preserv. 2021, 45, e15749. [Google Scholar] [CrossRef]
- Esteki, M.; Farajmand, B.; Kolahderazi, Y.; Simal-Gandara, J. Chromatographic Fingerprinting with Multivariate Data Analysis for Detection and Quantification of Apricot Kernel in Almond Powder. Food Anal. Methods 2017, 10, 3312–3320. [Google Scholar] [CrossRef]
- Abdi, H.; Williams, L.J. Principal component analysis. WIREs Comput. Stat. 2010, 2, 433–459. [Google Scholar] [CrossRef]
- Wang, M.; Lu, S.; Zhu, D.; Lin, J.; Wang, Z. A High-Speed and Low-Complexity Architecture for Softmax Function in Deep Learning. In Proceedings of the 2018 IEEE Asia Pacific Conference on Circuits and Systems (APCCAS), Chengdu, China, 26–30 October 2018. [Google Scholar]
- Kingma, D.P.; Ba, J. Adam: A Method for Stochastic Optimization. arXiv 2015, arXiv:1412.6980. [Google Scholar]
- Zhang, Y.; Miyamori, Y.; Mikami, S.; Saito, T. Vibration-based structural state identification by a 1-dimensional convolutional neural network. Comput.-Aided Civ. Infrastruct. Eng. 2019, 34, 822–839. [Google Scholar] [CrossRef]
- Chen, J.; Gao, J.; Lyu, T.; Oloulade, B.M.; Hu, X. AutoMSR: Auto Molecular Structure Representation Learning for Multi-label Metabolic Pathway Prediction. IEEE/ACM Trans. Comput. Biol. Bioinform. 2022. [Google Scholar] [CrossRef]
- Yan, J.; Guo, X.; Duan, S.; Jia, P.; Wang, L.; Peng, C.; Zhang, S. Electronic Nose Feature Extraction Methods: A Review. Sensors 2015, 15, 27804–27831. [Google Scholar] [CrossRef] [PubMed]
- Zhang, Q.; Cao, R.; Shi, F.; Wu, Y.; Zhu, S.-C. Interpreting CNN Knowledge via an Explanatory Graph. Proc. AAAI Conf. Artif. Intell. 2017, 32, 11819. [Google Scholar] [CrossRef]
- Tharwat, A.; Gaber, T.; Ibrahim, A.; Hassanien, A.E. Linear discriminant analysis: A detailed tutorial. AI Commun. 2017, 30, 169–190. [Google Scholar] [CrossRef]


Disclaimer/Publisher’s Note: The statements, opinions and data contained in all publications are solely those of the individual author(s) and contributor(s) and not of MDPI and/or the editor(s). MDPI and/or the editor(s) disclaim responsibility for any injury to people or property resulting from any ideas, methods, instructions or products referred to in the content. |
© 2023 by the authors. Licensee MDPI, Basel, Switzerland. This article is an open access article distributed under the terms and conditions of the Creative Commons Attribution (CC BY) license (https://creativecommons.org/licenses/by/4.0/).