Article

SEDG-Yolov5: A Lightweight Traffic Sign Detection Model Based on Knowledge Distillation

1
College of Electrical Engineering, Henan University of Technology, Zhengzhou 450001, China
2
College of Computer and Communication Engineering, Zhengzhou University of Light Industry, Zhengzhou 450001, China
3
School of Artificial Intelligence and Big Data, Henan University of Technology, Zhengzhou 450001, China
*
Author to whom correspondence should be addressed.
Electronics 2023, 12(2), 305; https://doi.org/10.3390/electronics12020305
Submission received: 28 November 2022 / Revised: 30 December 2022 / Accepted: 2 January 2023 / Published: 6 January 2023
(This article belongs to the Section Artificial Intelligence)

Abstract

:
Most existing traffic sign detection models suffer from high computational complexity and superior performance but cannot be deployed on edge devices with limited computational capacity, which cannot meet the direct needs of autonomous vehicles for detection model performance and efficiency. To address the above concerns, this paper proposes an improved SEDG-Yolov5 traffic sign detection method based on knowledge distillation. Firstly, the Slicing Aided Hyper Inference method is used as a local offline data augmentation method for the model training. Secondly, to solve the problems of high-dimensional feature information loss and high model complexity, the inverted residual structure ESGBlock with a fused attention mechanism is proposed, and a lightweight feature extraction backbone network is constructed based on it, while we introduce the GSConv in the feature fusion layer to reduce the computational complexity of the model further. Eventually, an improved response-based objectness scaled knowledge distillation method is proposed to retrain the traffic sign detection model to compensate for the degradation of detection accuracy due to light-weighting. Extensive experiments on two challenging traffic sign datasets show that our proposed method has a good balance on detection precision and detection speed with 2.77M parametric quantities. Furthermore, the inference speed of our method achieves 370 FPS with TensorRT and 35.6 FPS with ONNX at FP16-precision, which satisfies the requirements for real-time sign detection and edge deployment.

1. Introduction

With the development of artificial intelligence and sensor technology, advanced assisted driving and autonomous driving are gradually becoming hot research topics in the industrial and academic sectors. Environmental perception is the key to the interaction of driverless vehicles with external information, aiming to simulate or replace the driver’s intuition and understand the driving situation quickly and accurately [1]. Traffic sign detection, as an essential part of autonomous environment perception, can provide indispensable reference information for the safe driving of vehicles, so that traffic accidents can be effectively reduced or avoided, and a smooth road network can be ensured. One of its main tasks is to accurately locate signs and differentiate their specific subclasses during vehicle driving, and then use the results as guidance information for the vehicle control center. Therefore, it is of great significance to implement traffic sign detection with rapid inference speed, high recognition accuracy, and strong robustness.
Traffic sign detection in real driving scenarios is not only a multi-category task but also a multi-objective task, which requires the usage of vehicle sensors to obtain information about natural scenes. However, traffic signs are often far away from vehicles, and most of them are not directly in front of the driving route, which brings specific difficulties to the accuracy of detection. Meanwhile, as shown in Figure 1, real-time detection of traffic signs is more challenging owing to the impact of complex road scenes such as illumination changes, object occlusion, and lousy weather.
Traffic sign detection has made a quantum leap from traditional detection algorithms to deep learning-based methods over recent years. Numerous experiments are conducted on traffic sign benchmark datasets such as GTSDB [2] and TT100K [3] to verify the effectiveness of the proposed method. The advancement of convolutional neural networks in computer vision tasks has led to the widespread application of object detection algorithms in the direction of traffic sign detection. Recent work on probabilistic models for image enhancement based on Naive Bayes machine learning algorithm [4] achieved excellent results for detecting traffic signs on the benchmark dataset. Liu et al. [5] and Wei et al. [6] both proposed an improved two-stage detection algorithm for solving the problem of small traffic sign detection and achieved competitive detection results on the benchmark dataset. A novel deep CNN-based traffic sign detection framework proposed in [7] achieves SOTA detection performance under challenging weather conditions and vastly outperforms conventional two-stage detection algorithms. Liang et al. [8] proposed an improved multiscale Sparse R-CNN detection model with a backbone consisting of a coordinate attention mechanism and ResNet network. It is also trained with a data augmentation method driven by complex traffic scenes and achieves optimal detection performance for both self-researched and benchmark datasets. These studies in data processing or model improvement mean that traffic sign detection has excellent detection performance in complex driving scenarios.
However, high-performance deep learning models tend to consume considerable computational resources, which are difficult to deploy on vehicles or other edge devices with limited computational capabilities. Therefore, to be able to run deep learning models on low-computing devices, improvements are imperative at the algorithm level to increase the model detection accuracy and inference ability so that the models can be deployed on edge computing devices such as in-vehicle cameras or electronic surveillance to meet the real-time and precise requirements for practical application.
In summary, our work makes the following contributions:
  • We innovatively use the Slicing Aided Hyper Inference method for handling the traffic sign detection datasets. The number of traffic sign instances is increased by slicing the original data in the data processing stage.
  • Inspired by the bottleneck structure and attention mechanism, we propose ESGBlock in this paper. The proposed ESGBlock can extract the semantic information of high-dimensional feature maps more effectively and pass it to the low-dimensional feature layer. It also avoids the problem of traffic sign information loss due to dimensionality reduction in the feature extraction process and makes the feature extraction layer pay more attention to the traffic sign information at different scales.
  • We construct a lightweight convolutional neural network based on ESGBlock as the backbone network of the traffic sign detection model, which significantly reduces the number of parameters and computational effort of the detection model, and further restructured the feature fusion layer regarding the GSConv module.
  • To compensate for the degradation of detection performance due to model light-weighting, an improved response-based knowledge distillation method with temperature coefficient is proposed to fine-tune the lightweight model.
The rest paper is organized as follows. We review some relevant research works in Section 2. Section 3 gives our proposed method for traffic sign detection. Detailed experimental setup and the comparison of experimental results with other detection models are given in Section 4. The last section presents the conclusion.

2. Related Work

2.1. Object Detection

Object detection, as an integral component of the computer vision field, is mainly to find out all the targets of interest to the user in the input image. Then, analyzing and discerning the information, such as the class to which the target belongs and the position where it is located. Object detection is the foundation and prerequisite for many tasks in computer vision and directly determines the performance of related applications. Numerous existing SOTA object detection results are reported in benchmark formats such as MS COCO [9] and Pascal VOC [10], where accuracy and real-time are the two key evaluation metrics.
Traditional object detection methods rely on highly defined manual designs to extract target features in candidate regions. The need for constant manual adjustment and intervention in the face of more complex object detection tasks leads to accuracy and real-time application challenges. Compared with traditional vision-based object detection approaches, detection techniques based on deep learning have better robustness and generalization ability, and can autonomously complete feature extraction and the recognition of objects. Two types of strategies can be distinguished depending on the subtasks of target localization and target classification, each of which has strengths and weaknesses in terms of accuracy and speed of reasoning. One type is the one-stage object detection method represented by the YOLO series, which directly uses full-image information for prediction. Up to now, the YOLO model has evolved from Yolov1 to Yolov5 [11,12,13,14,15], with a number of variants based on it to solve problems such as tiny objectives, intensive forecasting, and engineering practice. The other type is the two-stage detection method characterized by R-CNN [16], which has a higher detection accuracy but generates many repeated computations. In this paper, we choose the Yolov5 model as the research baseline by considering the overall requirements of the traffic sign detection task.

2.2. Traffic Sign Detection and Recognition

Rapidly separating sign areas of interest from the complex environmental backgrounds is the primary task of traffic sign detection, and then further identifying the specific location of the separated area that accurately reflects the traffic sign information.
Traditional traffic sign detection is generally applied as specific kinds of detection tasks, which require a high level of subjective human awareness in the feature extraction stage. Mu et al. [17] processed the high-level color images by color normalization, filtered the candidate regions using the color components of interest, and then used HOG and SVM to detect and classify the candidate regions. Huang et al. [18] adopted the circular Hough transform to detect circular traffic signs by locating the position of circular feature objects in the image. Generally speaking, traditional traffic sign detection algorithms can only perform well in specific scenarios, so they are not suitable for use in procedures with high requirements for real-time detection and complex and changing environments.
The deep learning-based traffic sign detection method is entirely driven by rich and diverse image samples and does not require any manual feature extraction design. You et al. [19] lightened the SSD model by replacing the larger convolutional kernels in the original network with 1 × 1 convolutional kernels and removing unnecessary convolutional layers. Different from the one-stage detection, Li et al. [20] proposed an improved Faster R-CNN model, which utilized an AC-FPN structure guided by an attention mechanism, to reduce the loss of information and achieved SOTA performance with an average precision of 99.5%. Dewi et al. [21] compared the quality and differences of traffic sign images generated by three adversarial generative networks, DCGAN, LSGAN, and WGAN, through extensive experiments. They achieved 89.33% accuracy on the Yolov4 model by training a mixture of the synthetic images with the real images. Le et al. [22] presented an approach to synthesizing realistic traffic sign images with annotations by randomly combining outdoor scene images with traffic signs, and achieved detection results close to those of actual datasets on the synthetic dataset. However, these methods still require a certain number of original images as samples and do not have uniform evaluation indicators. In the actual driving scenario, traffic signs are usually far away from the vehicle. The traffic signs account for a small percentage of the images collected by the vehicle camera, which is more likely to be influenced by the surrounding environment leading to wrong detection and omission. Attention mechanisms are widely used in neural networks to improve the performance of detection models. Liu et al. [23] inserted channel attention networks between feature channels to enhance the representation of extracted features, which achieved excellent performance on the benchmark dataset. An innovative proposal of a population multiscale attention pyramid network in [24] could effectively suppress invalid background information to achieve optimal feature fusion at different scales.
In addition, the performance of traffic sign detection in terms of computational speed cannot be ignored. Ayachi et al. [25] proposed a traffic sign detection model based on YOLO using a lightweight convolutional neural network named SqueezeNet and achieved an inference speed of 16 FPS on edge devices after model quantization and pruning. Gu et al. [26] adopted the MobileNetv3 network to construct a Yolov4 lightweight traffic sign detection model and proposed a hierarchical feature interaction structure to facilitate sign information transfer, finally achieving a detection speed of 57 FPS on the GTSDB dataset. However, these studies are limited to the following three categories: mandatory, dangerous, and prohibited, and they do not meet the detection needs of actual driving scenarios. Rehman et al. [27] proposed an anchor frame selection algorithm to reduce the miss rate of small traffic signs and achieved a good balance between detection accuracy and inference speed by pruning technique and patchwise strategy. Hoanh Nguyen [28] proposed a lightweight detection model with the ESPNetv2 network as the backbone, introducing an improved region proposal network and employing deconvolution to generate an enhanced feature map, which ultimately requires only 0.28 s of inference time to achieve good detection performance on TT100K. Lu et al. [29] proposed a detection model consisting of a single-stage prediction network and a two-stage domain adaptive network, which can achieve a detection speed of 55.9 FPS in complex scenes. Chen et al. [30] made a series of improvements to Yolov4 for the small traffic sign detection problem and achieved an inference speed of 58.1 FPS. Wang et al. [31] proposed an improved feature pyramid structure incorporating an adaptive attention module and a feature enhancement module to reconstruct the Yolov5 model. The improved model successfully achieved a detection precision of 65.14% and an inference speed of 95 FPS with only 8.039M parametric quantities. However, it is worth noting that the existing traffic sign detection model has much room for amelioration, especially in making the model as small as possible while ensuring that the detection precision and inference speed match the computational power of the edge devices. Considering this problem, we present a lightweight traffic sign detection model, which has fewer parameters and lower computational complexity.

2.3. Knowledge Distillation

Knowledge distillation, which allows knowledge to be transferred from one model to another at the cost of an acceptable range of performance loss, enables a structurally simple student network to achieve comparable performance to that of the teacher networks. Knowledge distillation has been extensively studied for image classification tasks. However, in the field of object detection, there are relatively few distillation methods due to the uncertainty of network output and the diversity of network structures.
Hinton et al. [32] first introduced the concept of knowledge distillation and the logits-based distillation method, which calculated the difference between the softmax output distributions of teacher and student models under the influence of temperature parameters, as a way to orient the optimization of student networks. Such methods are simple and easy to implement, but they cannot distill data without authentic labels, and the complexity of object detection task labels leads to unsatisfactory distillation results. Wang et al. [33] put forward the usage of signal maps to restrict the knowledge delivered by the teacher network to the vicinity of the true labels. During the knowledge transfer, the student network learns only the useful foreground knowledge provided by the teacher network to exclude the interference of background information, allowing the student network to obtain higher accuracy. However, the distilled network based on the two-stage object detection model is challenging to deploy on edge devices due to speed restrictions. Wang et al. [34] employed a neural network as the discriminator with reference to the generative adversarial network architecture. They used the feature mappings generated by the model as experimental samples for adversarial training, thus, guiding the student network to learn the distribution of the teacher network. The distilled SSD student model applying this approach promotes the average category accuracy by 2.8% on the VOC dataset, but the generative adversarial network has many uncertainties and is not easy to train. In addition, Yang et al. [35] proposed a feature map distillation method to address the degradation of distillation performance caused by the imbalance between foreground and background. They adopted local distillation to focus the model on the key pixels and channels of the image, and then employed global distillation to reconstruct the channel relationships between different pixels. The method shows an average class precision improvement of more than three percentage points on different object detection models. In this paper, we adopt the knowledge distillation strategy as the model enhancement method to offset the decrease in detection performance after light-weighting.

3. Methodology

A lightweight detection model is designed to implement real-time traffic sign detection in this paper. The algorithm mainly consists of an offline data augmentation method, an improved SEDG-Yolov5 model architecture, and a training method based on response knowledge distillation.

3.1. Data Augmentation

Due to the complexity of the imaging condition and the imbalanced characteristics of traffic sign dataset, the results of the detection model will deviate considerably, while the problem of the missing detection of small targets means the model cannot be applied in practice due to its weak detection performance. Slicing Aided Hyper Inference (SAHI) [36] can be adopted to perform smaller slice inference on super-resolution images without redesigning and retraining the detection model; then, the inference results can be merged into a slice prediction of the original images.
In this work, the SAHI approach is employed as our local offline data augmentation. Specifically, the benchmark images are sliced by an overlap rate of 0.2 and a sliding window size of 800 × 800 . By slicing the original data, we can expand the number of traffic sign instances and retain more efficient information, thus, making the detection model more robust and better performance.

3.2. Lightweight Network Architecture

Yolov5 [15] detection model is an extended and improved version of the Yolo series of algorithms. The network as a whole is organized with four components: the input layer, the backbone network layer, the feature fusion layer (neck), and the prediction output head. The model dramatically ameliorates the depth and width of the network from previous versions. It has been extensively studied as a benchmark model for its rapid detection speed while maintaining a remarkable detection precision. The input layer generally applies mosaic data enhancement to re-patch the input image into a new sample image, which enriches the background of the target and enables the model to detect weak targets with enhanced capability; The feature fusion layer adopts FPN+PAN structure to merge the superficial feature map with strong location information and the profound feature map with much semantic information; The output head makes predictions against the fused feature map, then outputs the prediction category with the highest confidence score and returns details about the border coordinates for detecting different target locations.
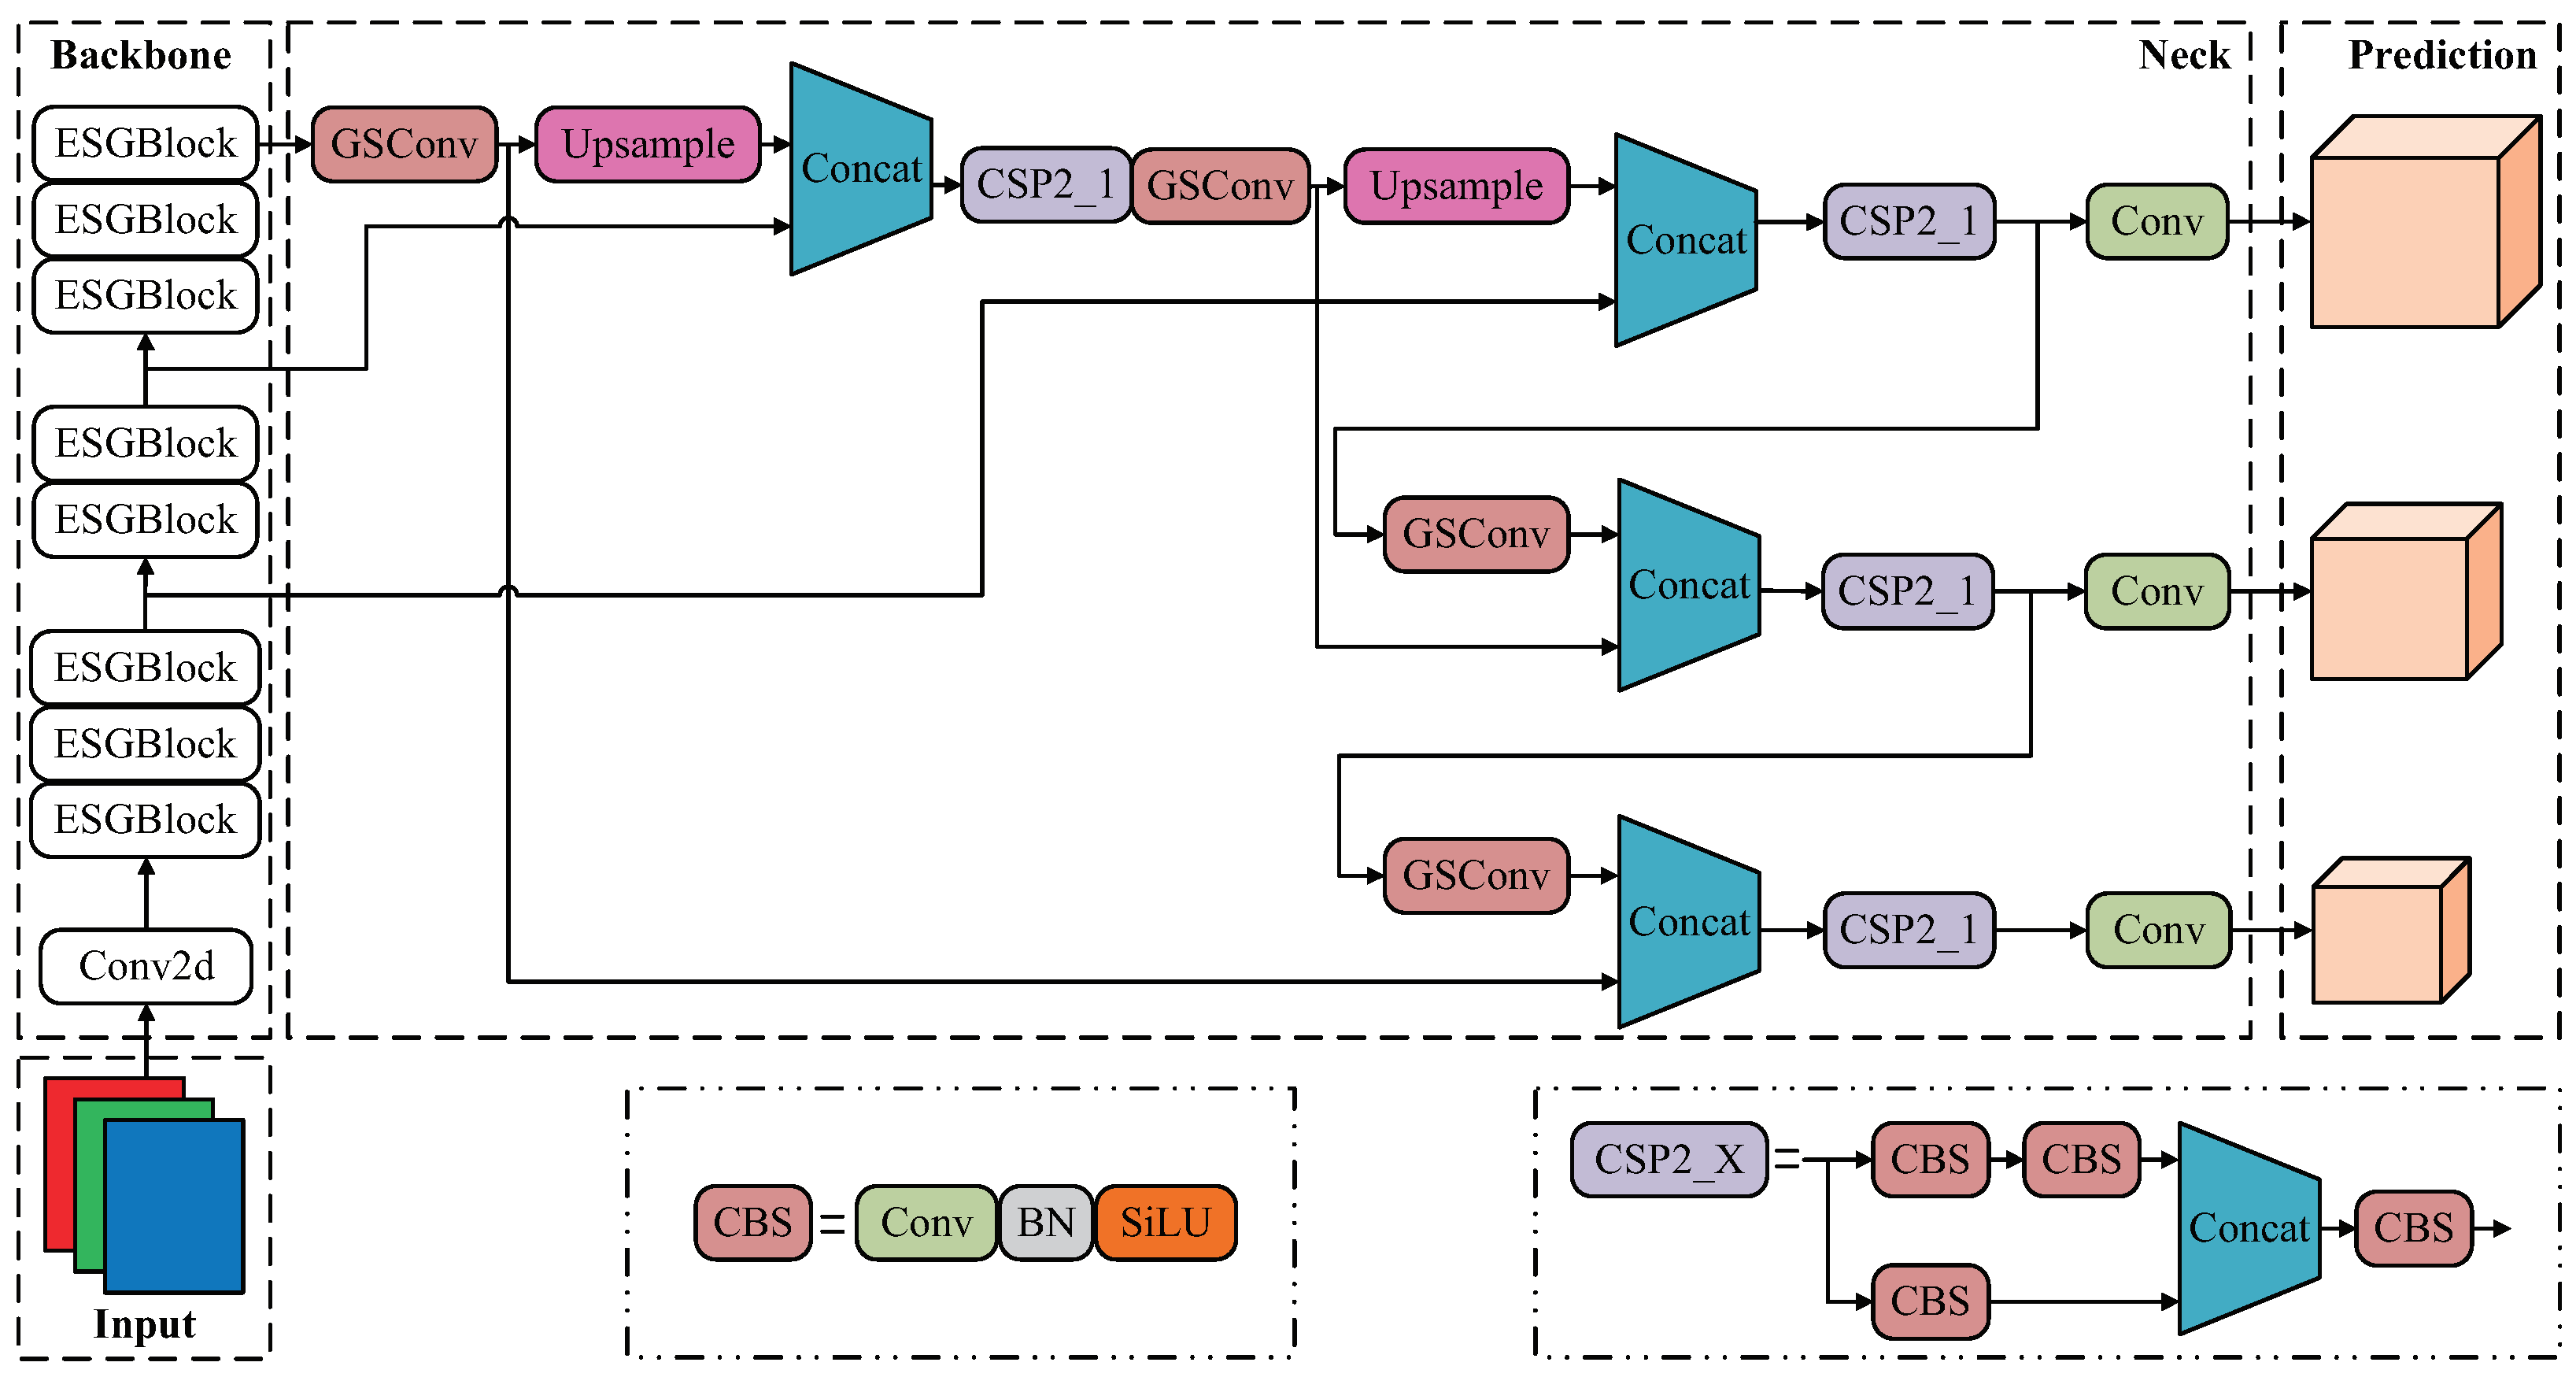
In this section, we present the structure of our proposed SEDG-Yolov5 detection model, as shown in Figure 2. The first is the proposed ESGBlock based on the attention mechanism, which is used to build a lightweight convolutional neural network to reconstruct the backbone network layer of the detection model. ESGBlock can reduce the loss of traffic sign information created by the feature extraction process and makes the model sampling process better in terms of accounting for the sign’s channel information. Second, we also refer to the GSConv proposed in [37] to replace part of the original convolution operation in the feature fusion layer, which further reduces the complexity of the traffic sign detection model and effectively balances the model between detection capability and detection speed.

3.2.1. ESGBlock

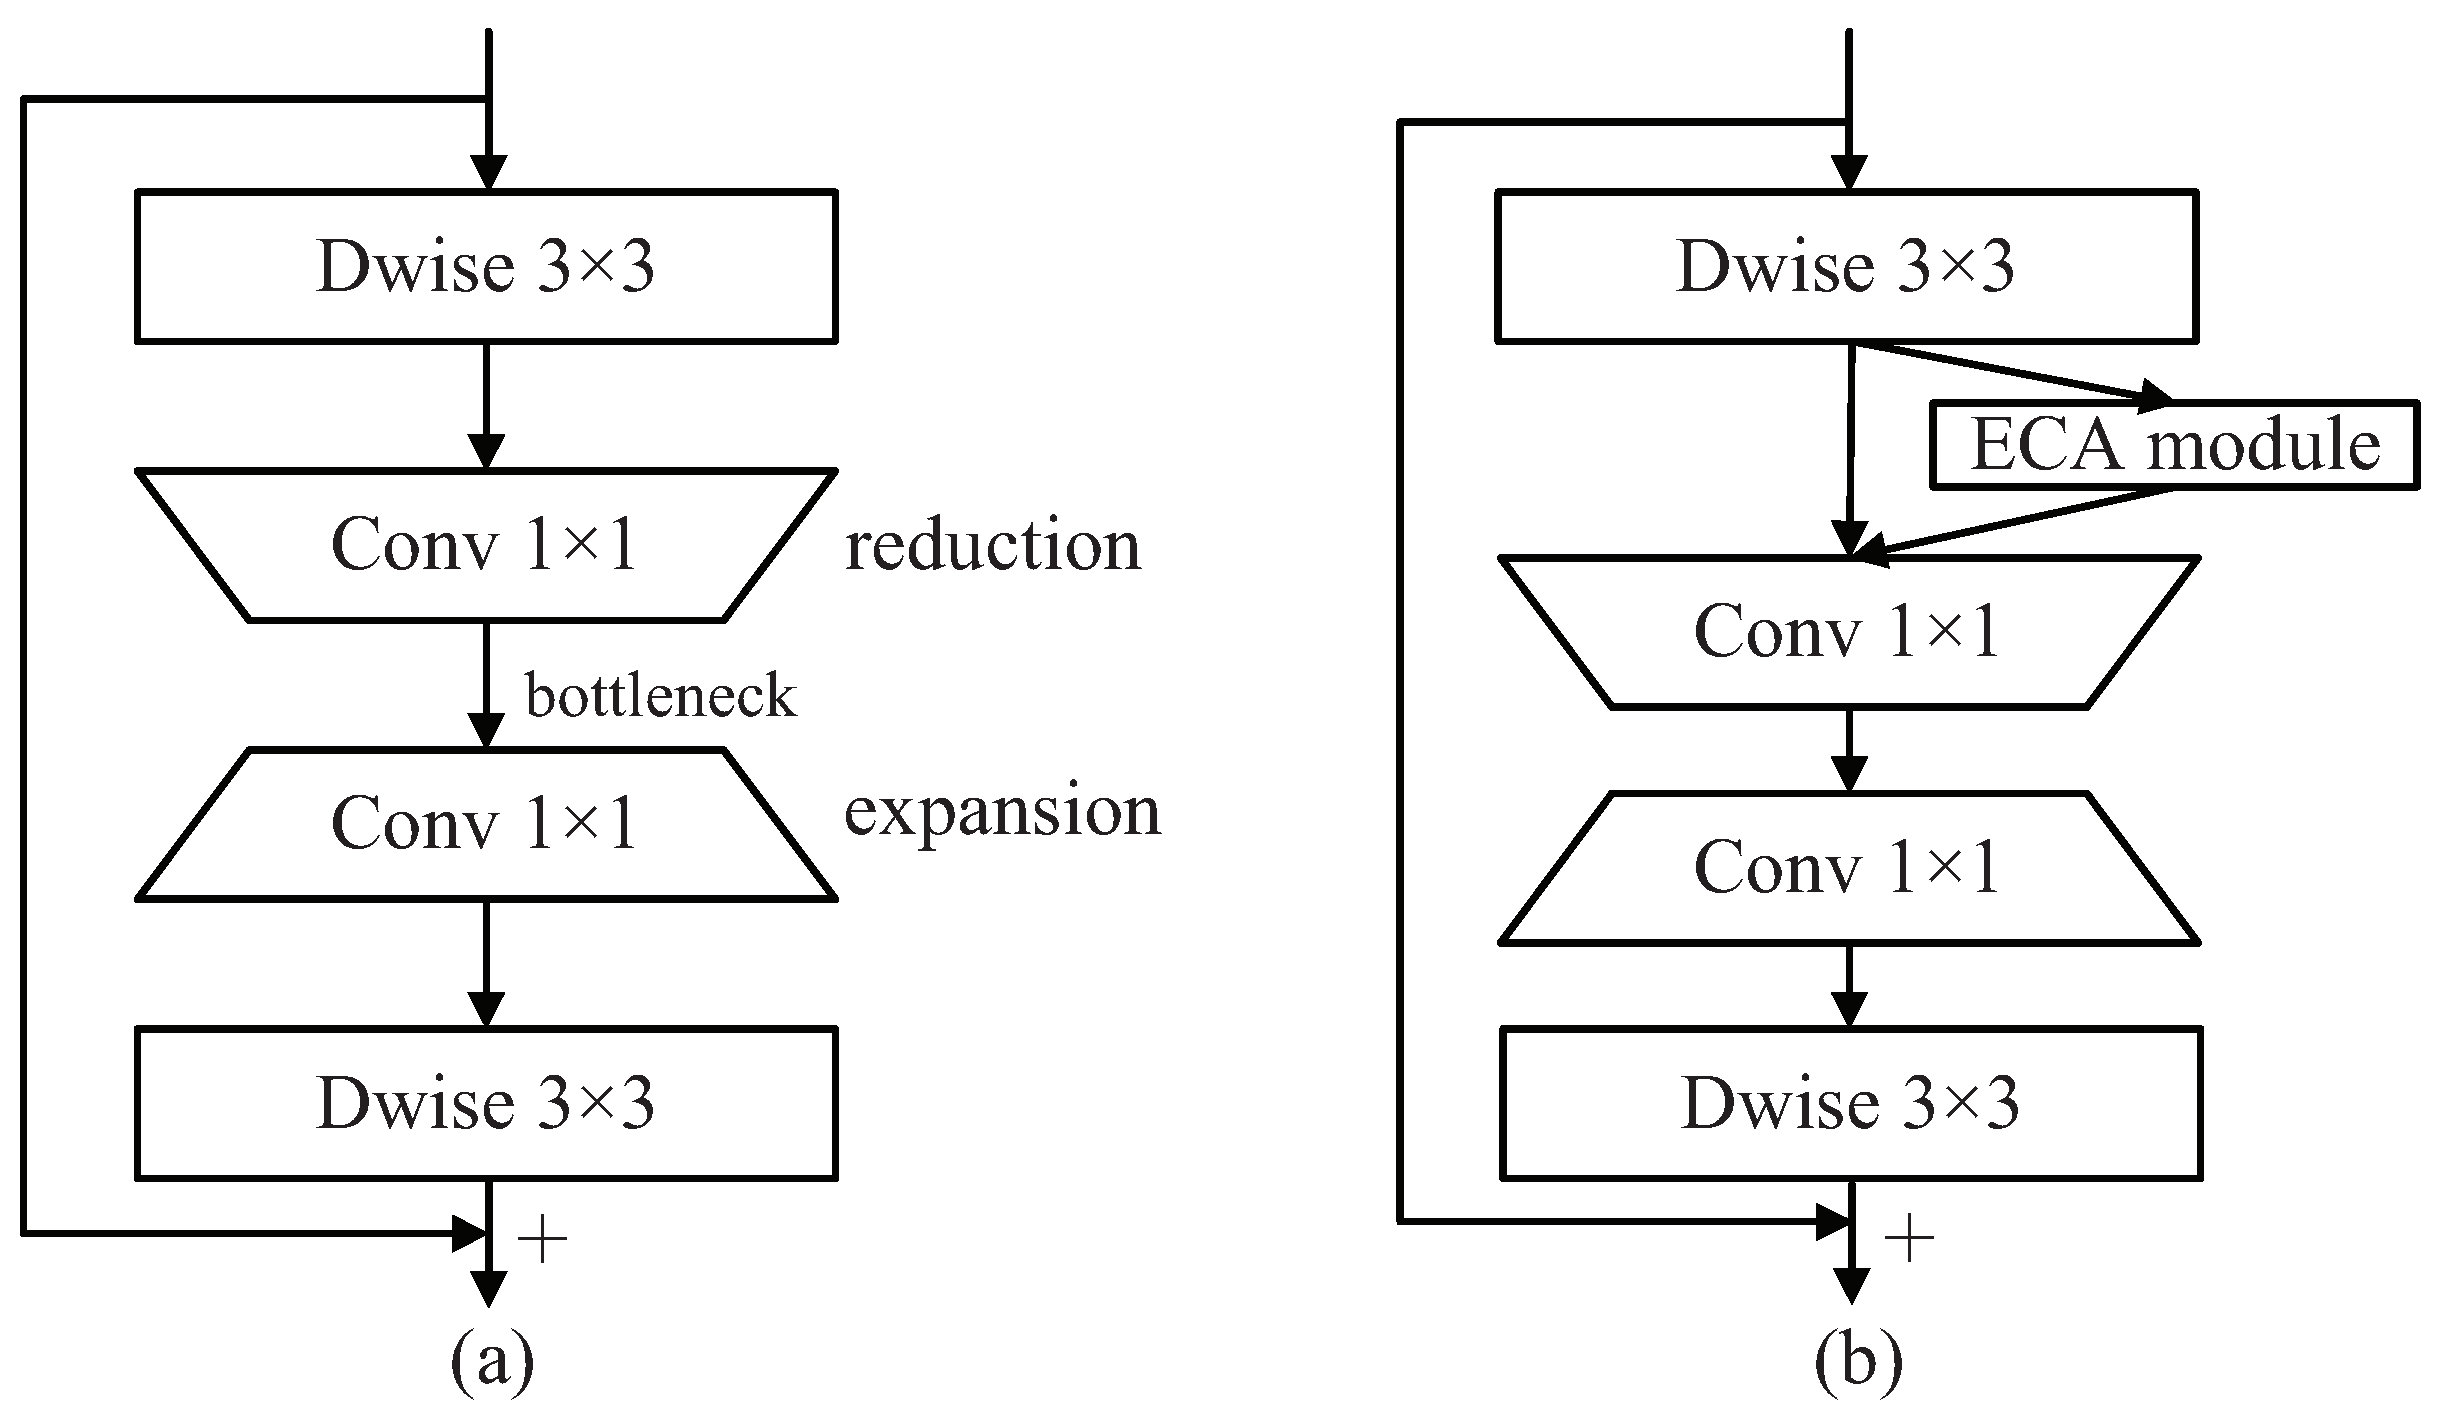
Many existing lightweight neural network models either based on manual design or automatic search utilize the inverted residual module as the basic constituent structure. However, its characteristic of inputting low-dimensional features will make it difficult for the model to retain enough valuable information. The Sandglass Bottleneck proposed in [38] places the shortcut from the bottleneck structure between the high-dimensional feature representations based on inverted residual blocks. It applies deep convolution to encode spatial information on the high-dimensional features. The basic structure of the Sandglass Bottleneck is illustrated in Figure 3a. The 1 × 1 point-by-point convolutional encoding of inter-channel information is used at the bottleneck structure so that the input feature maps are weighted and combined in the depth direction to obtain new feature information. In addition, the two depth separable convolutions at the head and tail retain more spatial information of the target, which contributes to the improvement of the detection performance.
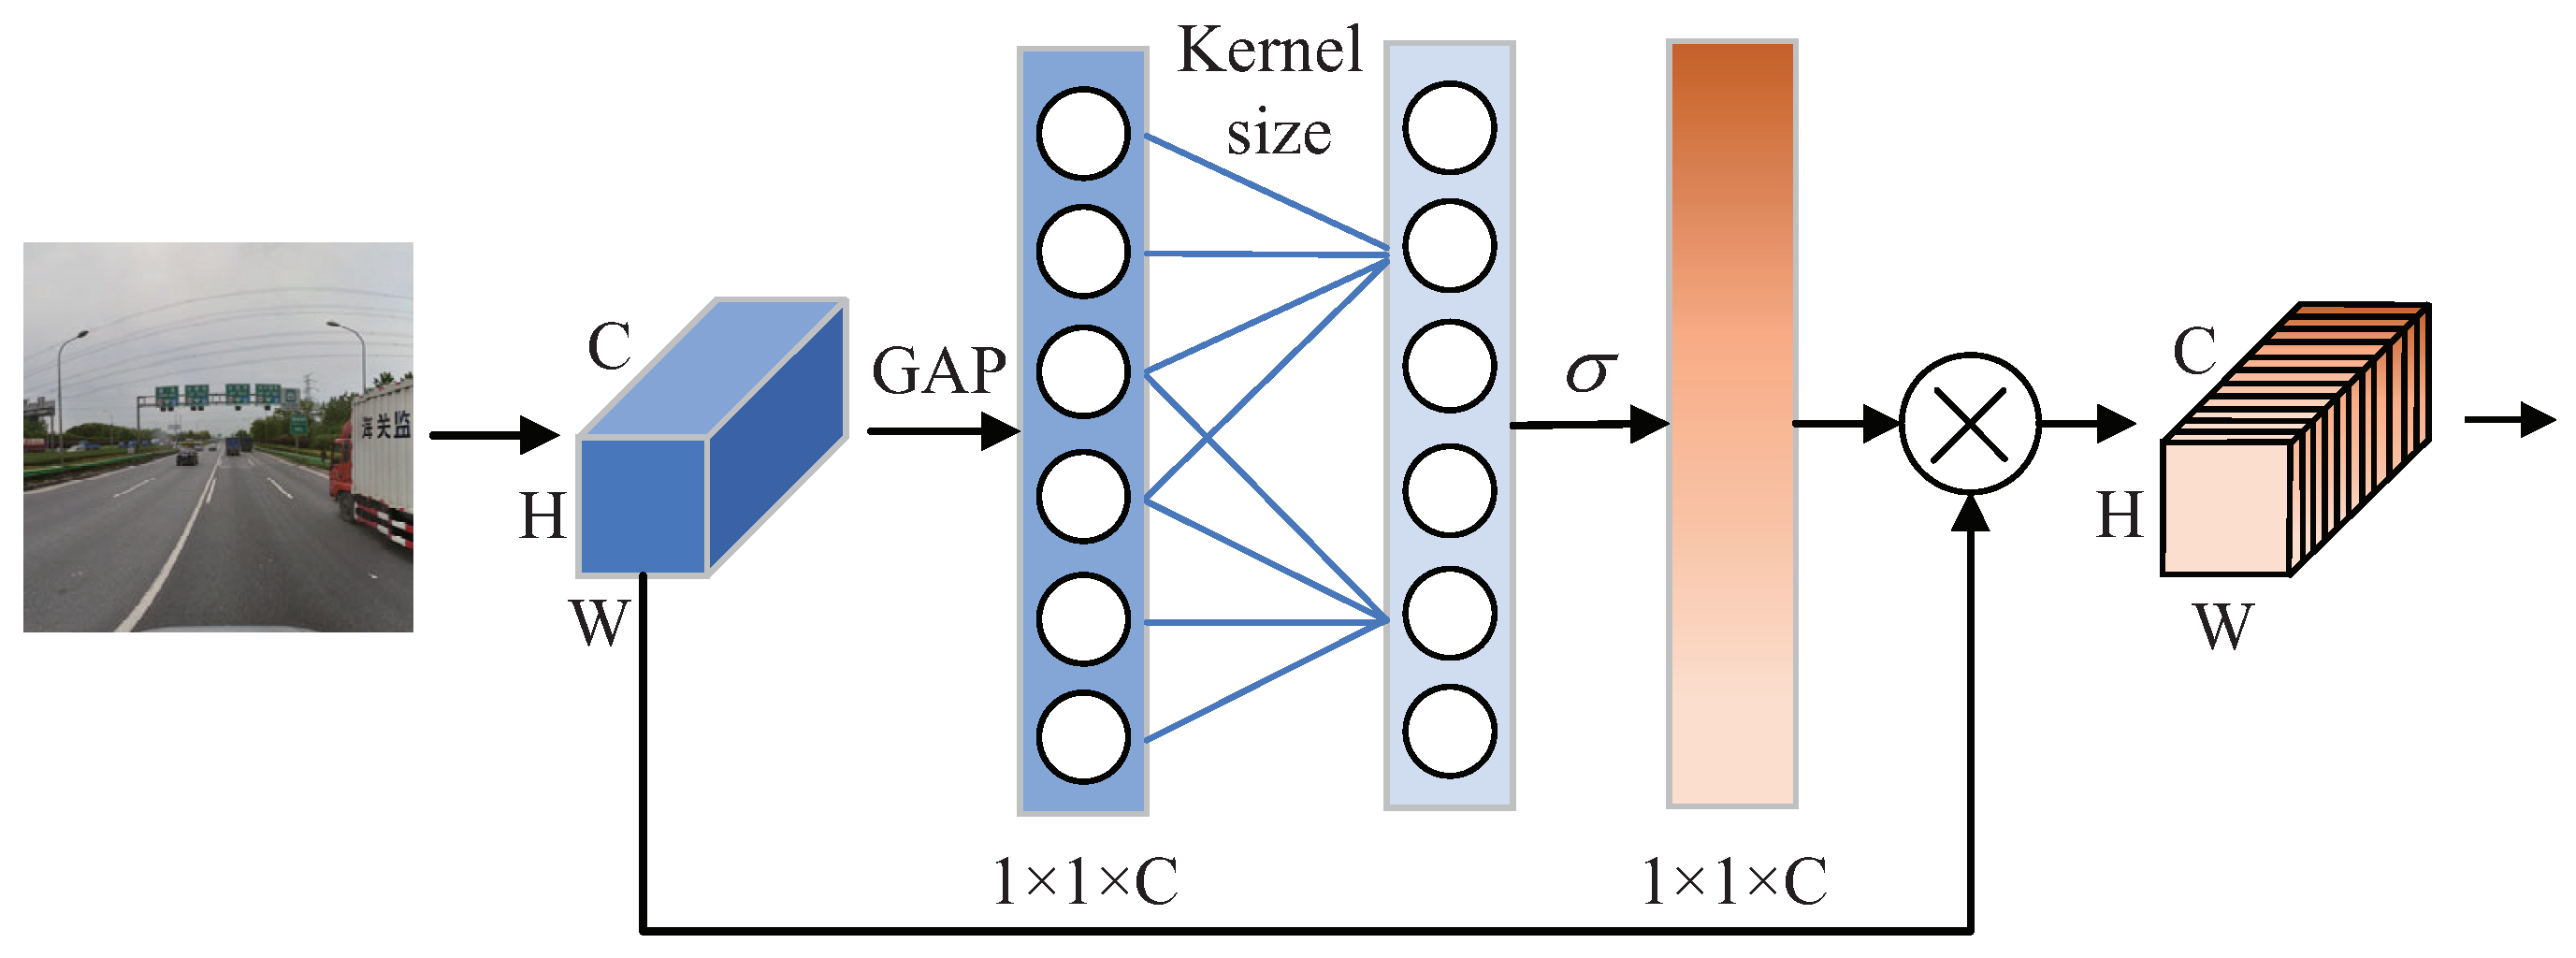
The specially tailored structure of the Sandglass Bottleneck allows high-dimensional features information to be transmitted. At the same time, the model requires fewer parameters than the other neural network models of the same type and can achieve better performance at a considerable computational cost. However, it is worth noting that the sign information contained in high-dimensional features and low-dimensional features are complementary to some extent. As shown in Figure 3b, inspired by some model light-weighting methods, we introduce the Efficient Channel Attention (ECA) module [39] in the high-dimensional feature layer to avoid the loss of traffic sign information due to dimensionality reduction in the feature extraction process. The schematic diagram of ECA is shown in Figure 4. When the feature map of the traffic sign image to be detected is input, it is changed by global average pooling (GAP) to one-dimensional features that retain only channel information. Then, the one-dimensional convolution that replaces the fully connected layer ensures that the information between the channels in each layer interacts. Finally, after sigmoid processing, the feature maps containing more information are calculated by multiplying with the input feature maps.
As the core component of the detection network, the backbone is designed to extract the information of the target to be detected and obtain the downsampled feature maps with different multiplicities, so as to meet the detection needs of different scales and types of targets. Specifically, the CSPDarknet backbone network is arranged for the Yolov5 model from the network structure perspective. Its residual structure is composed of a large number of convolutional kernels, which enhances the learning ability of the network as well as its operation cost. A large volume of redundant feature information can be generated in traffic sign detection, which leads to the additional consumption of computational budget and makes the Yolov5 model run slowly on some edge devices with limited computational resources. Therefore, we adopt the attention-based mechanism of ESGBlock to structure the lightweight convolutional neural network to reconstruct the backbone network of the Yolov5 model. The overall detection method reduces the parameter computation of the model, while the network structure remains the same, making the model more applicable to the traffic sign detection needs of edge devices.

3.2.2. GSConv Module

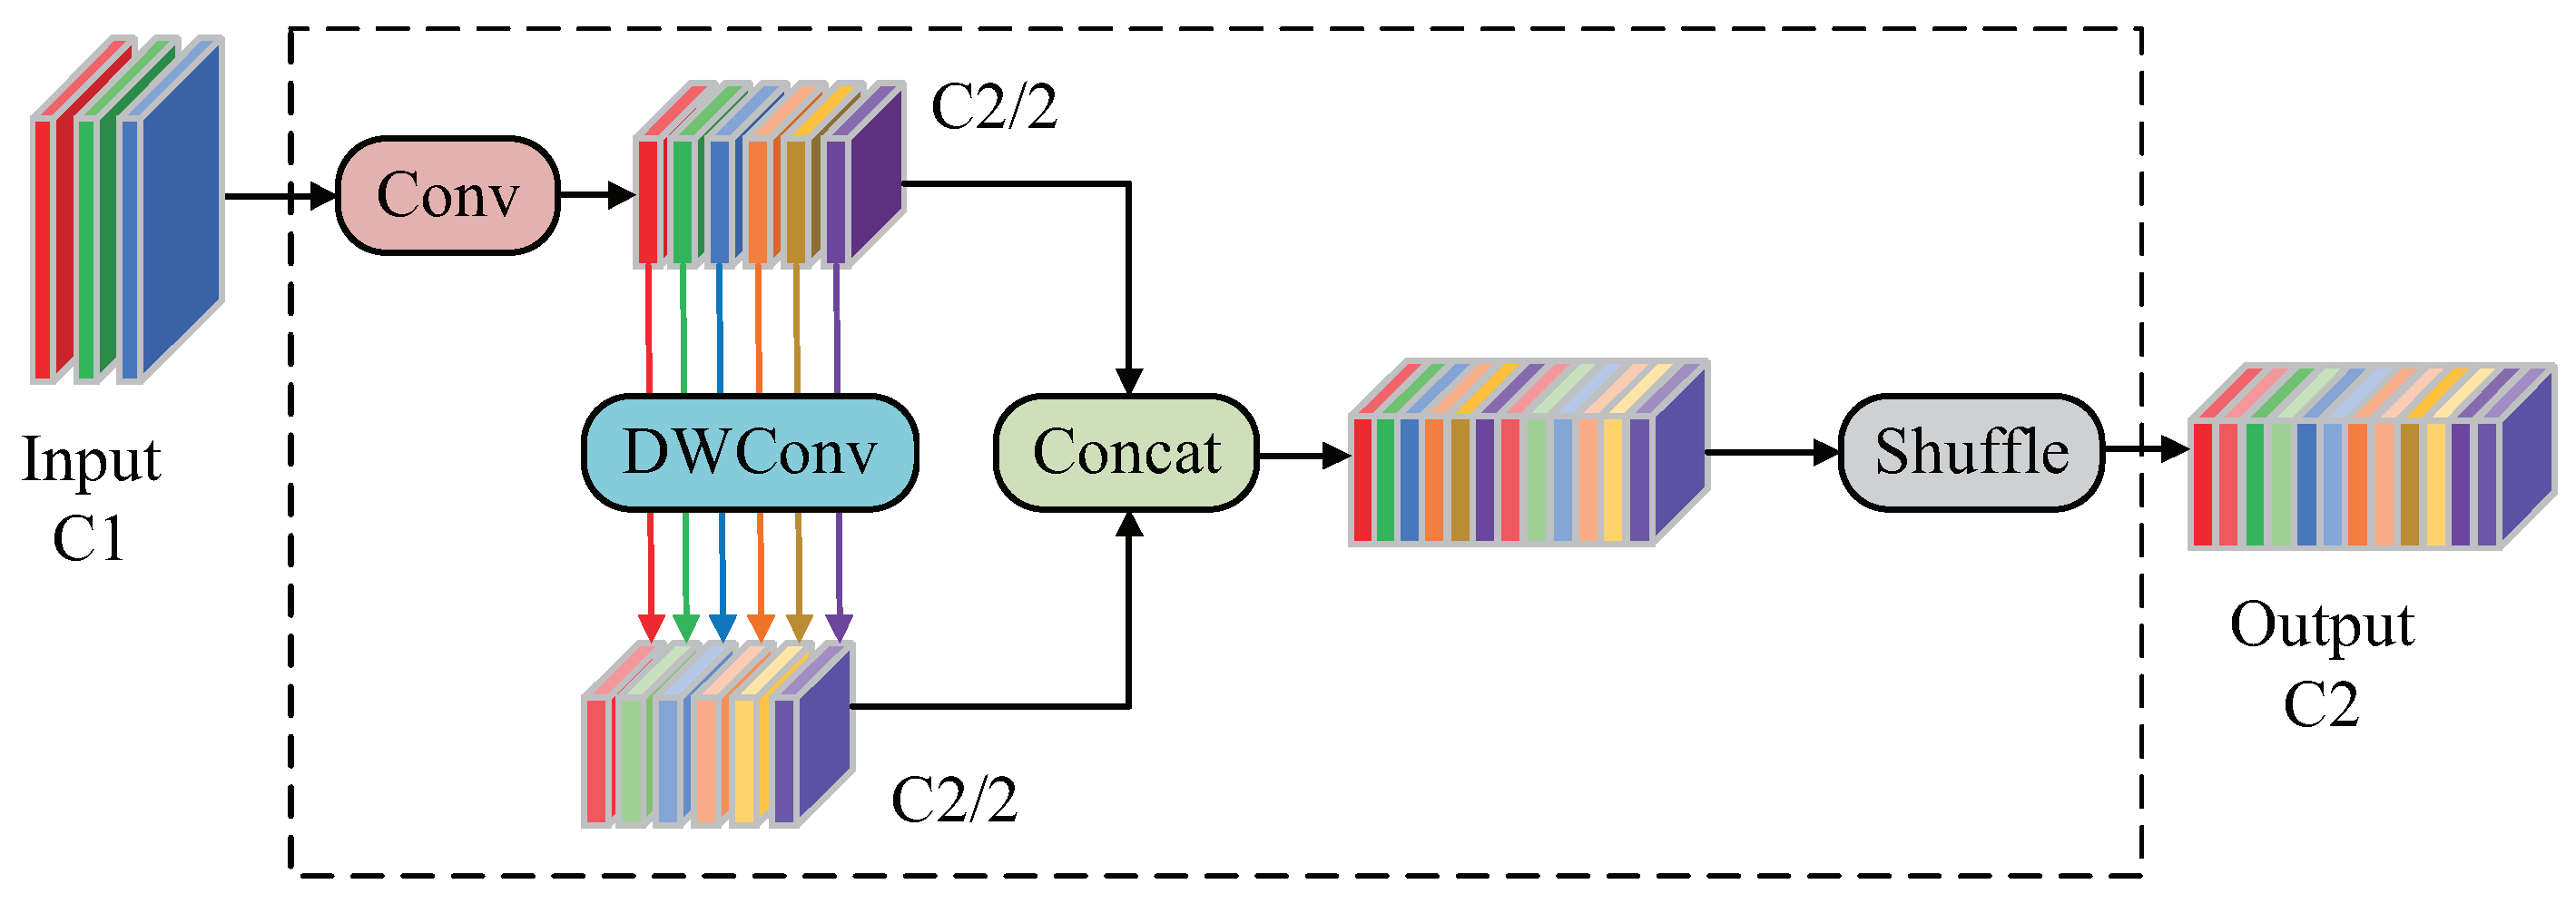
In the feature fusion layer, GSConv [37] is employed to replace the standard convolutional structure, which further reduces the computational complexity of the overall detection model. Figure 5 shows the structure of the GSConv module.
The traffic sign feature map from the backbone network undergoes partial loss of semantic information after the transformation of spatial information to channel transmission. GSConv allows retaining the hidden connection between each channel to the maximum extent. Meanwhile, GSConv used in the feature fusion layer can avoid the deepening of network hierarchy and maintain the transmission speed of feature data information, so that the detection speed can be effectively improved while keeping a certain detection precision.

3.3. Response-Based Objectness Scaled Knowledge Distillation

In the process of model lightweighting, the performance of the detection model will inevitably deteriorate as the number of parameters reduces in scale. Knowledge distillation can be employed not only for model compression but also for model enhancement; therefore, we leverage response-based knowledge distillation to retrain the lightweight model to compensate for the loss of detection performance.
The loss function, which directly determines the execution of the detection model, guides the optimization direction of the training model by calculating the output and target values. As for the Yolov5 detection algorithm, its loss function is a weighted sum of the objective classification loss, confidence loss, and bounding box loss, which can be expressed as follows:
L o s s = f c l s φ c i , c i g t + f o b j φ o i , o i g t + f b o x φ b i , b i g t
where c i , o i , b i represent the logical outputs of the category probability, object confidence, and bounding box of the detection model, respectively. The corresponding c i g t , o i g t , b i g t indicate the ground truth of the experimental data and φ ( · ) denotes the softmax function.
Among them, the classification loss f c l s ( · ) and confidence loss f o b j ( · ) are calculated by the binary cross-entropy function with the following formula:
L n x , y = ω n y n log σ x n + 1 y n log 1 σ x n
where n denotes the number of experimental samples, ω n is the weight adjustment coefficient, σ ( · ) represents the Sigmoid function, y n is the data label, and x n indicates the prediction value. Furthermore, the bounding box loss f b o x ( · ) is calculated by the CIoU method, which tackles the non-overlapping problem of anchor boxes while ensuring the convergence speed, making the target regression box more stable and more accurate positioning. The calculation formula can be expressed as follows:
L C I o U = 1 I o U + ρ 2 b , b g t c 2 + α ν
where α is the balance weight coefficient, ν is used to measure the similarity of the aspect ratio, ρ b , b g t calculates the Euclidean distance between the center points of the prediction box b and the target box b g t , c denotes the diagonal distance of the smallest external rectangle that can contain both the prediction box and the target box. IoU means the intersection and merging ratio of the prediction box and the target box is calculated.
Since the dense prediction output of the teacher network in the last layer will lead to incorrect learning in the bounding box of the student model, we leverage the strategy of objectness scaled [40] to avoid the student network learning the background predictions with the faculty model. In other words, the downstream model will just learn the target regression framework and category probabilities when the teacher model confidence value is high; otherwise, the loss function is still calculated according to Equation (1) with ground truth. Instead of directly adding the teacher prediction loss to the student loss in the original method, we propose a weighted sum approach to balance the share of teacher knowledge in student network training and prevent the overfitting of student models. Therefore, the improved distillation loss function of objectness scaled can be exhibited as
f D o b j = 1 ε f o b j φ o i , o i g t + ε F o b j φ o i t , φ o i
f D c l s = 1 ε f c l s φ c i , c i g t + ε φ ^ o i t F c l s φ c i t , φ c i
f D b o x = 1 ε f b o x φ b i , b i g t + ε φ ^ o i t F b o x φ b i t , φ b i
where ε is a weighting factor indicating the proportion of the distillation loss component to the total loss function. c i t , o i t , b i t denote the logical output of the category probability, object confidence, and bounding box of the pre-trained teacher model, respectively. φ ^ o i t is the objectness output of the teacher network, which indicates the probability that each bounding box contains an object. When the bounding box is background it has a small value, thus, effectively preventing the student model from incorrectly learning the background predictive knowledge of the teacher model. F computes the similarity of the predicted output of the teacher-student model, thus, motivating the downstream model to understand the output characteristics of the faculty network.
Moreover, we introduce a temperature factor to control the importance of the soft target of the teacher model, and the distillation loss function with the temperature factor is given as follows:
f D o b j = 1 ε f o b j φ o i , o i g t + ε T 2 F o b j φ o i t / T , φ o i / T
f D c l s = 1 ε f c l s φ c i , c i g t + ε φ ^ o i t T 2 F c l s φ c i t / T , φ c i / T
f D b o x = 1 ε f b o x φ b i , b i g t + ε φ ^ o i t T 2 F b o x φ b i t / T , φ b i / T
where T is the distillation temperature coefficient, a higher temperature can distill more knowledge of the teacher model, weakening the probability distribution of each category. All categories have the same probability when T tends to infinity.
We finally obtain the loss function for distillation training and it can be simply summed up as follows:
L O S S d i s t i l l = f D c l s + f D o b j + f D b o x
The overall knowledge distillation framework is shown in Figure 6. The values of the weighting factor ε and the temperature factor T are crucial for the performance of the student model distillation training, which we will illustrate experimentally in the next section.
We finally derive the overall training method and flow of the model in this section, as demonstrated in Algorithm 1. The teacher and student model weights are obtained by training on the augmented dataset, respectively. Then the distillation model is finally obtained under the supervised guidance of the distillation loss function.
Algorithm 1 The overall algorithm flow
Input: Training set D = x n , y n n = 1 N , validation set ν
Output: Original model f 1 , Lightweight model f 2 , Distillation model f 3
  1:
Build traffic sign augmentation dataset D ^ , ν ^ based on the input source data
  2:
f 1 Load the pre-trained model and iteratively train it on the augmented dataset according to Equation (1)
  3:
f 2 Calculate the loss function by Equation (1) without loading pre-training weights after model lightening
  4:
Set f 1 as the teacher model and f 2 as the student model
  5:
Allocate values to ε and T
  6:
repeat
  7:
    for  n = 1 9 N  do
  8:
        Randomly sample data x ^ n , y ^ n from D ^
  9:
        Compute f D c l s , f D o b j , f D b o x , respectively, according to Equations (7)–(9)
10:
         f 3 Update model parameters by Equation (10)
11:
    end for
12:
until Convergence on the validation set ν ^

4. Experiments and Analysis

4.1. Datasets

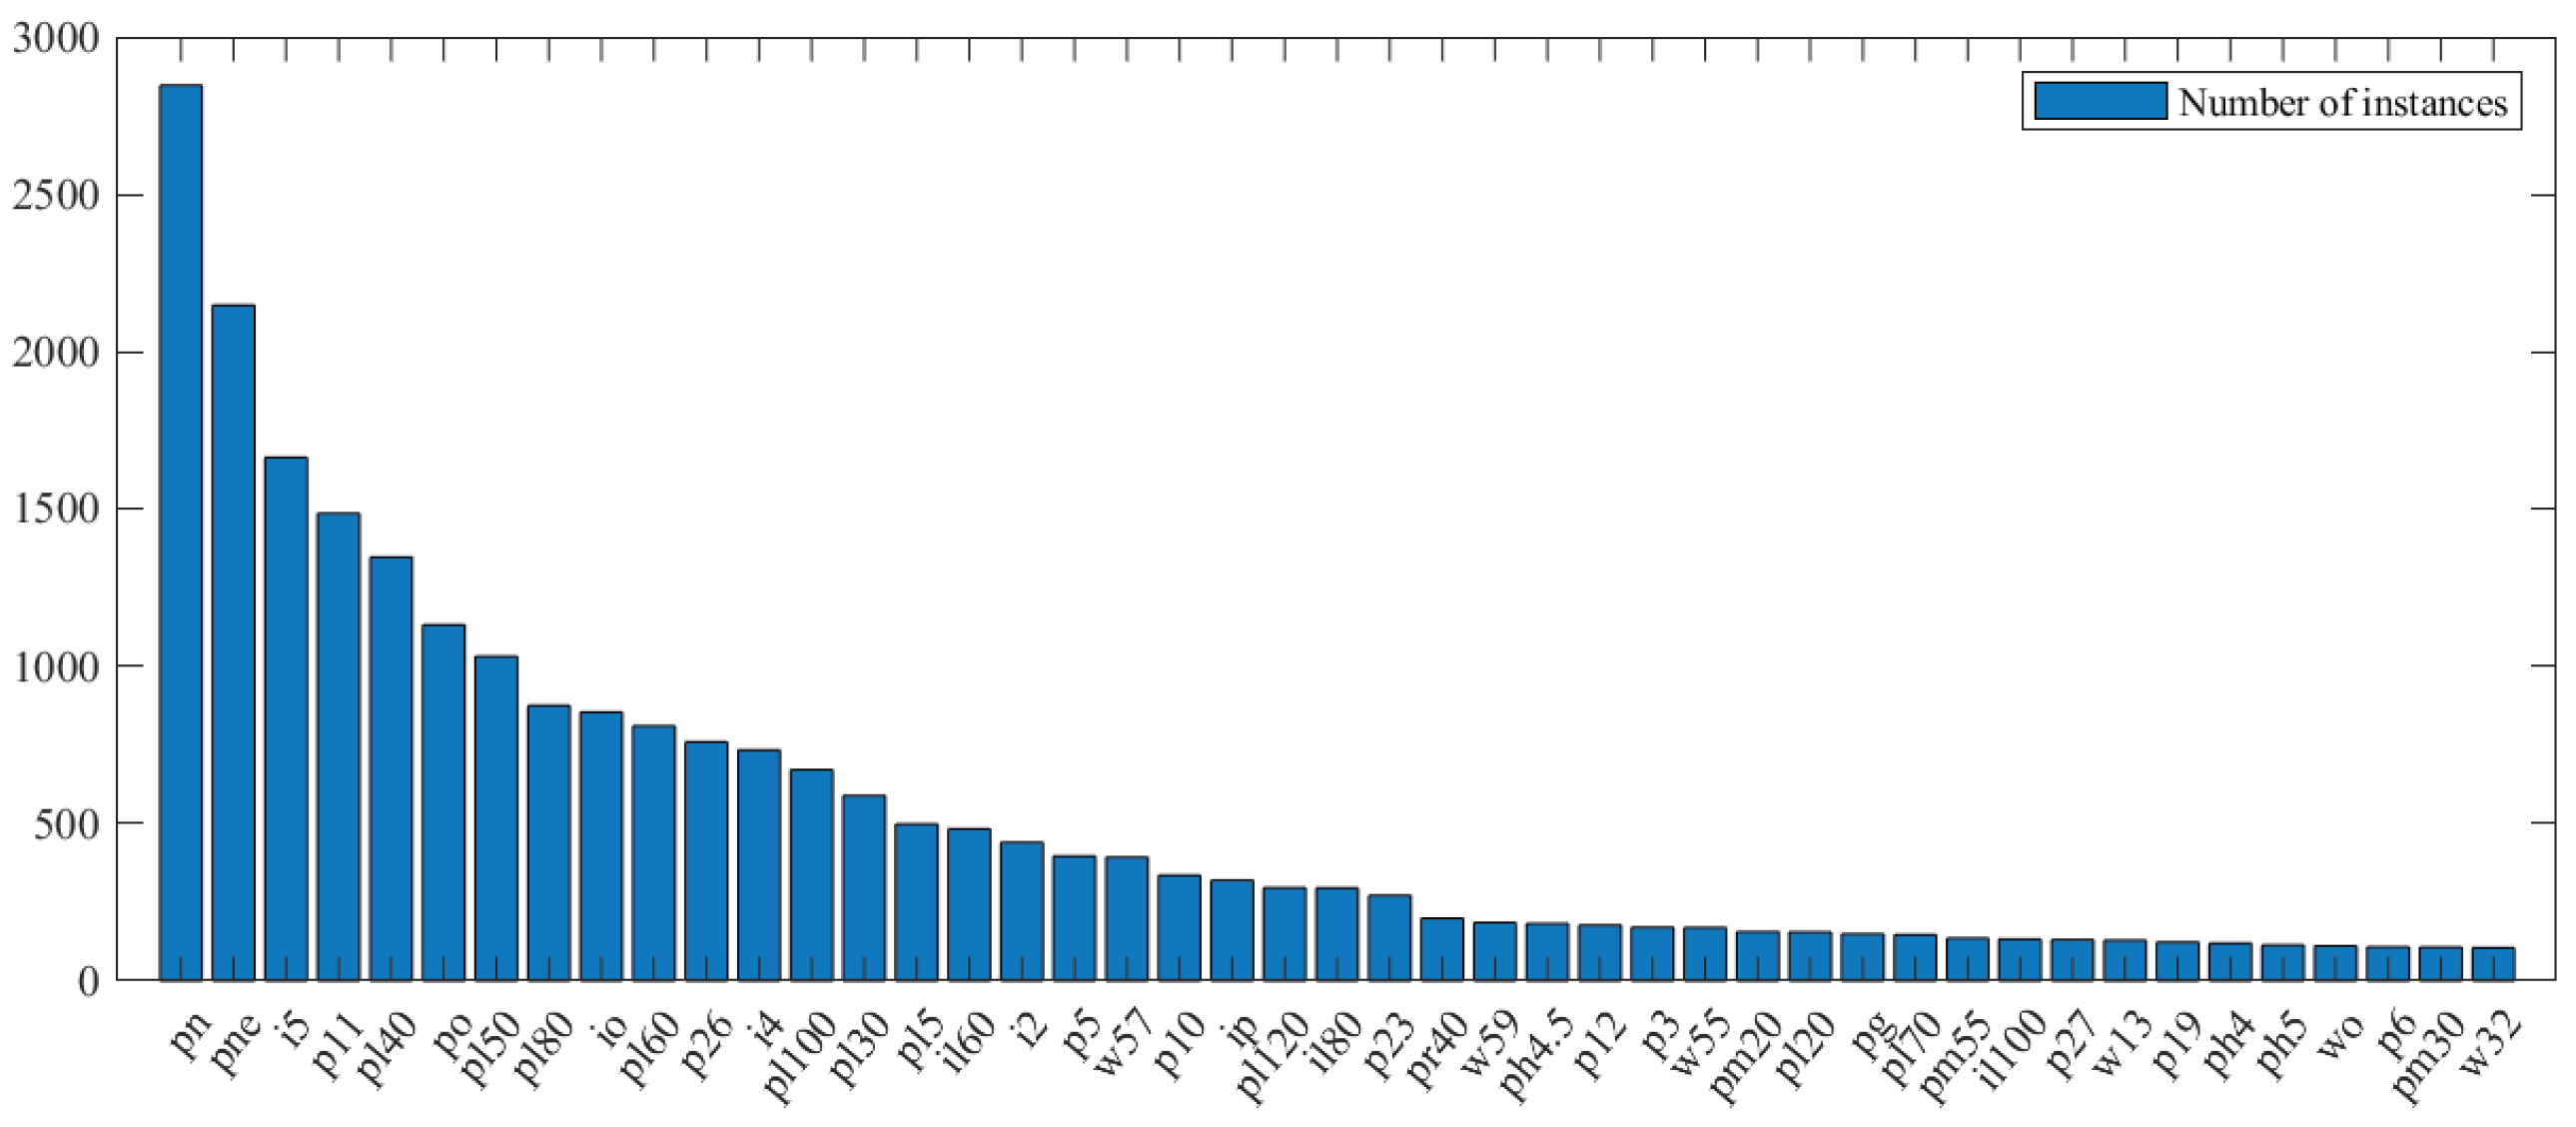
TT100K (Tsinghua–Tencent 100 K) is a Chinese traffic sign detection dataset that contains 30,000 traffic sign instances and more than two hundred categories. It has 6105 images in the training set and 3071 images in the test set. The benchmark images in the dataset all have a resolution of 2048 × 2048 and include a range of realistic driving scenarios such as lighting changes, object occlusion, bad weather, and multiple angles. We follow most of the existing studies [3,19,24,30] and select 45 categories of common traffic signs with more than 100 instances from the dataset as the subjects of study. The distribution of instances of each class can be observed in Figure 7. In our experiments, we redistribute the training set into training and validation sets in the ratio of 8:2.
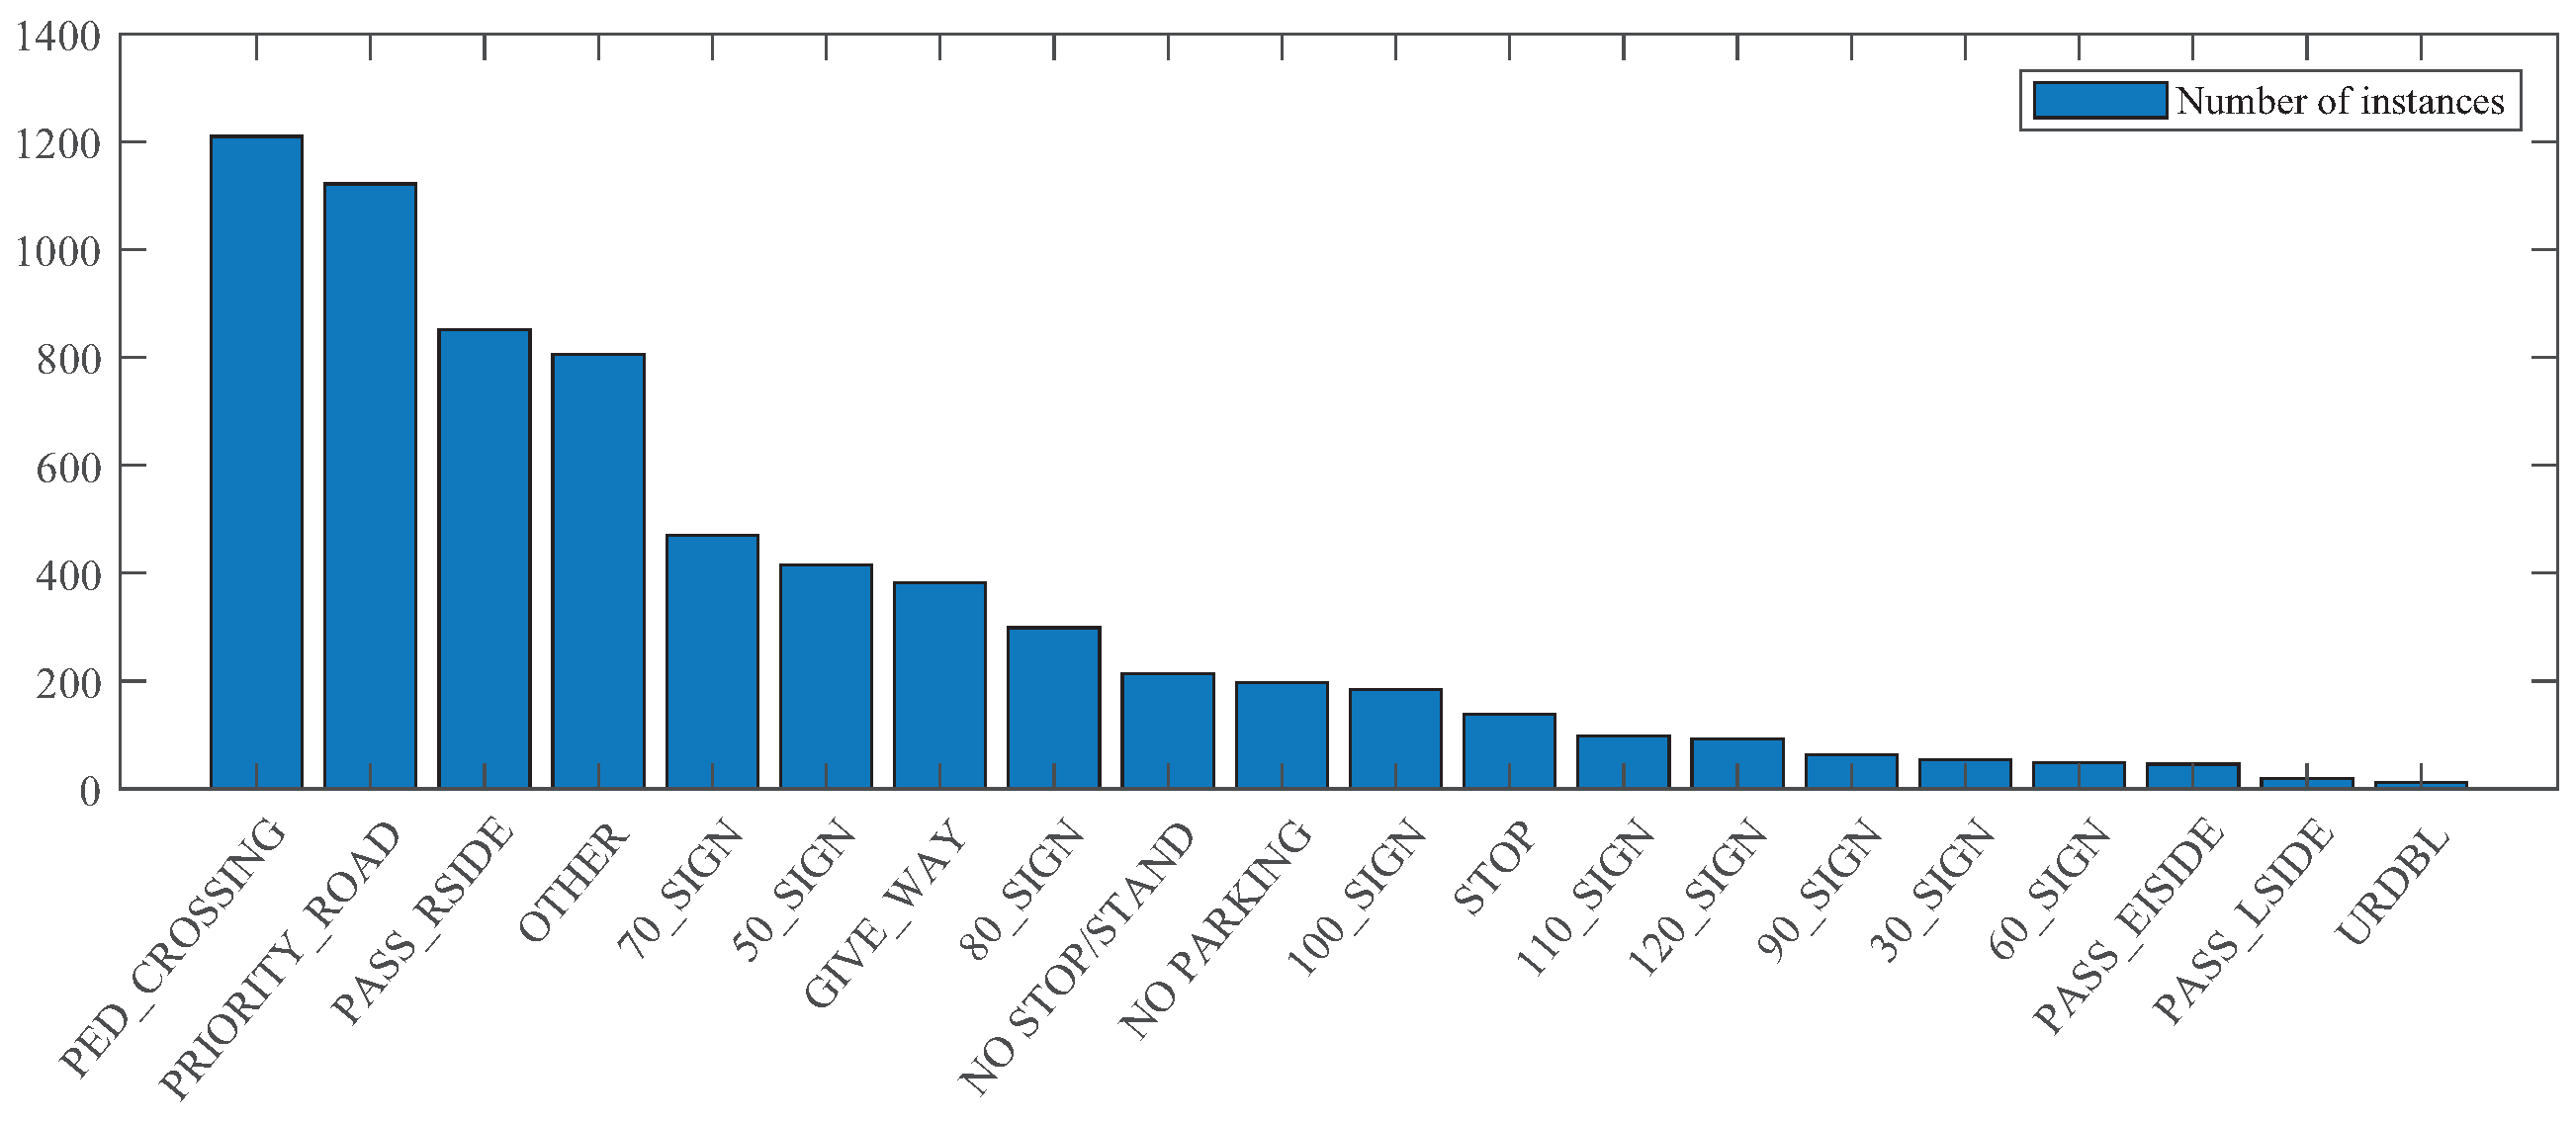
STSD [41] is a Swedish traffic sign dataset containing 20 categories, with a resolution of 1280 × 960 for all the benchmark images. The dataset covers more than 20,000 urban roads and high-speed road traffic scenes under various lighting variations. The experiment only takes 3777 annotated images containing traffic signs as the object of study, and the distribution of the number of instances in each category is shown in Figure 8. At the same time, the dataset is split according to the ratio of 6:2:2.

4.2. Experiment Details

We perform light-weighting and knowledge distillation experiments using the python language under the PyTorch deep learning framework. The hardware and software allocations for the experiments are as follows: Intel Xeon Silver 4214 CPU, 8 Nvidia GTX2080Ti graphics cards with 11 GB video memory, CUDA 10.1, and Ubuntu 20.04 operating system. Moreover, the detailed experimental parameters are set as follows: AdamW optimizer is employed to adjust the network parameters. The momentum is optimized as 0.937, and a weight decay of 0.0005 is leveraged to prevent the model from overfitting. A total of 300 epochs are conducted with a batch size of 128. The experiments are all carried out at a single scale with 640 resolution, and three scales of anchor boxes sizes are obtained by clustering the dataset: [5, 6, 7, 7, 9, 10], [12, 12, 15, 16, 19, 20], [25, 26, 33, 35, 51, 52]. In addition, the distillation training temperature T is elected as 20 and the weighting factor ε is taken as 0.5, which is obtained through extensive experiments.
For the evaluation of model effectiveness, mean average precision (mAP), precision (P), recall (R), F1-Score, model size, frames per second (FPS), and floating-point operations (FLOPs) are adopted as our evaluation metrics for model performance. The fraction of positive samples in the target detected by the model is expressed as the precision, and recall represents how many of all true positive samples are detected by the model. The F1-score, as an overall evaluation metric, can comprehensively reflect the detection results of the algorithm in terms of recall and precision, and its higher value indicates the better detection capability of the method. Apart from this, the mAP calculates the average value of AP for all categories, and can be divided into [email protected] and [email protected]:.95 according to the different intersection ratios. Their calculation equations are expressed, respectively, as
P = T P T P + F P
R = T P T P + F N
F 1 - score = 2 P · R P + R
A P = 0 1 P R d R
mAP = 1 N i = 1 N A P i
Among them, AP is the area enclosed by the P-R curve; TP indicates the number of samples in which traffic signs are detected correctly; FP denotes the number of samples in which traffic signs are detected but the detection results miss match the ground truth; FN indicates the number of samples in which no traffic signs are detected; and N is the number of detected sign categories.
We compare the commonly used lightweight convolutional neural network as the backbone with our proposed method under the same conditions, and the results are presented in Table 1. The number of parameters and FLOPs are calculated by the python package named thop. As can be distinctly observed, for the same input size of the image to be detected, our proposed approach requires minimal layers and parameters. Even approximately 61.2% fewer parameters compared to the baseline model Yolov5s, which considerably strengthens the transportability of the detection model.

4.3. Results on the TT100K Dataset

Table 2 shows the experimental results on the TT100K dataset. We evaluate the results under the same experimental conditions and compare them with the original Yolov5, Swin Transformer [42], EfficientDet [43], TsingNet [44], and NanoDet [45]. Firstly, the proposed SEDG-Yolov5 model requires only 5.9 MB of occupied memory to yield 91.0% detection accuracy, which is only 0.5% lower than that of the baseline model Yolov5s. Compared with the minimal model Yolov5n of the Yolov5 method, a remarkable enhancement in detection capability can be obtained by increasing the number of parameters by only 0.95 M. Although our distillation model has 1.82M more parameters than the ultra-lightweight model NanoDet, our detection results are more favorable for application in real driving scenarios.
Moreover, we evaluate the performance of large, medium, and small traffic signs based on the division rule of [3] as a way to demonstrate the detection capability of our method for different sizes of traffic signs. The average precisions (AP) of the proposed method are 0.5% and 2.9% higher than those of Yolov5s as a teacher model on medium and large scales, respectively. Although the average recall (AR) in small target is lower than that of Yolov5s with a value of 66.1%, the other values in medium and large targets are significantly higher than those of the other detection models. It is undeniable that the performance of detecting small-scale targets still suffers to some extent from a slight decrease in this work.
The overall model performance has been compared and analyzed, hence in Table 3 we leverage the F1-score to assess the performance of each category of traffic signs. Our method yields similar scores to those of the baseline model Yolov5s in most categories, and even “i4”, “il60”, “ip”, “pl120”, and many other categories of signs have slightly better F1-score. This implies that our method delivers excellent detection capabilities with a significant reduction in the number of parameters.

4.4. Results on the STSD Dataset

To further validate the effectiveness and robustness of our proposed method, we conduct the same experiments on the STSD dataset. The results of our proposed method and other methods are presented in Table 4. It can be observed that our method achieves 92.9% of [email protected], which is only 0.5% lower than the baseline model Yolov5s and better than other detection methods. It is further shown that our method achieves excellent detection performance with a small number of parameters. In addition, we obtain state-of-the-art average precision values of 49.8%, 73.5%, and 79.5% on small, medium, and large scales, respectively. We believe that this is because our method successfully achieves knowledge transfer between student and teacher models during knowledge distillation. The detection performance of student models is more likely to be improved when the dataset is relatively simple or has fewer categories.
As shown in Table 5, our method outperforms other detection methods in 12 out of 20 traffic sign categories in the F1-score. In particular, eight of the top ten categories with a high number of instances have optimal results. It shows that our method has good classification precision while accurately detecting the location of traffic signs.

4.5. Results of Inference Speed

One thousand images are randomly picked from the dataset to evaluate the model detection speed, and the comparison of inference results is displayed in Table 6. Since certain metrics of other models cannot be uniformly controlled, we only compare computational speed with the benchmark model Yolov5. To fairly compare the model results, we test with the same experimental conditions at FP16-precision, and all results are reported with batch size = 1 without non-maximal suppression. Furthermore, we also provide GPU inference based on TensorRT and CPU inference speed based on ONNX. An inference speed of 30 FPS is generally considered to enable smooth detection. The reasoning speed on GPU (without TensorRT) of our proposed method can reach 178.8 FPS, which is 11.2% faster than the original Yolov5s under the same conditions. Further investigation reveals that the inference speed of our method yields a significant increase from 4.7 FPS to 13.9 FPS even on CPUs with relatively weak computational power, and in particular acquires a real-time inference speed of 35.6 FPS with ONNX.

4.6. Ablation Studies

As observed in Table 7, we reveal the experimental results of the three approaches for the detection model. A significant amelioration in model performance can be distinctly perceived after data augmentation, yielding an increase of 7.1% [email protected] on Yolov5s compared to the original model. In comparison, detection accuracy decreases from 84.4% to 68.9% caused by light-weighting, and ameliorates by about 19.5% after leveraging data augmentation. This is because SAHI method ensures that the input images to the model exist at a smaller resolution and retain the traffic signs as completely as possible so that the model retains more semantic information in the data preprocessing stage compared to crop and resize directly from the original image. When the teacher model is Yolov5s, distillation training has a remarkable performance promotion for both SEDG-Yolov5 and Yolov5s. In addition, when all three methods are applied simultaneously, the model detection performance yields a change from 84.4% to 91.0%, although it is still lower than the results leveraging only data augmentation. Consequently, it can be concluded that model light-weighting inevitably presents the problem of diminished detection capability, but data augmentation and knowledge distillation methods can effectively compensate for performance degradation.
In the knowledge distillation experiment, the weighting coefficient ε determines the amount of knowledge transmitted by the teacher model, and its larger value indicates the more extensive amount of knowledge learned by the student model. At the same time, temperature coefficient T directly determines the propensity information carried by the teacher model. Therefore, how to select the value will have a direct impact on the detection capability of the student model. We experiment with several different typical combinations to test the effect on detection performance. Table 8 depicts an essential fact that the detection model SEDG-Yolov5 has the highest mean average precision of 91.0% for T = 20 and ε = 0.5 , and the highest classification precision and recall.
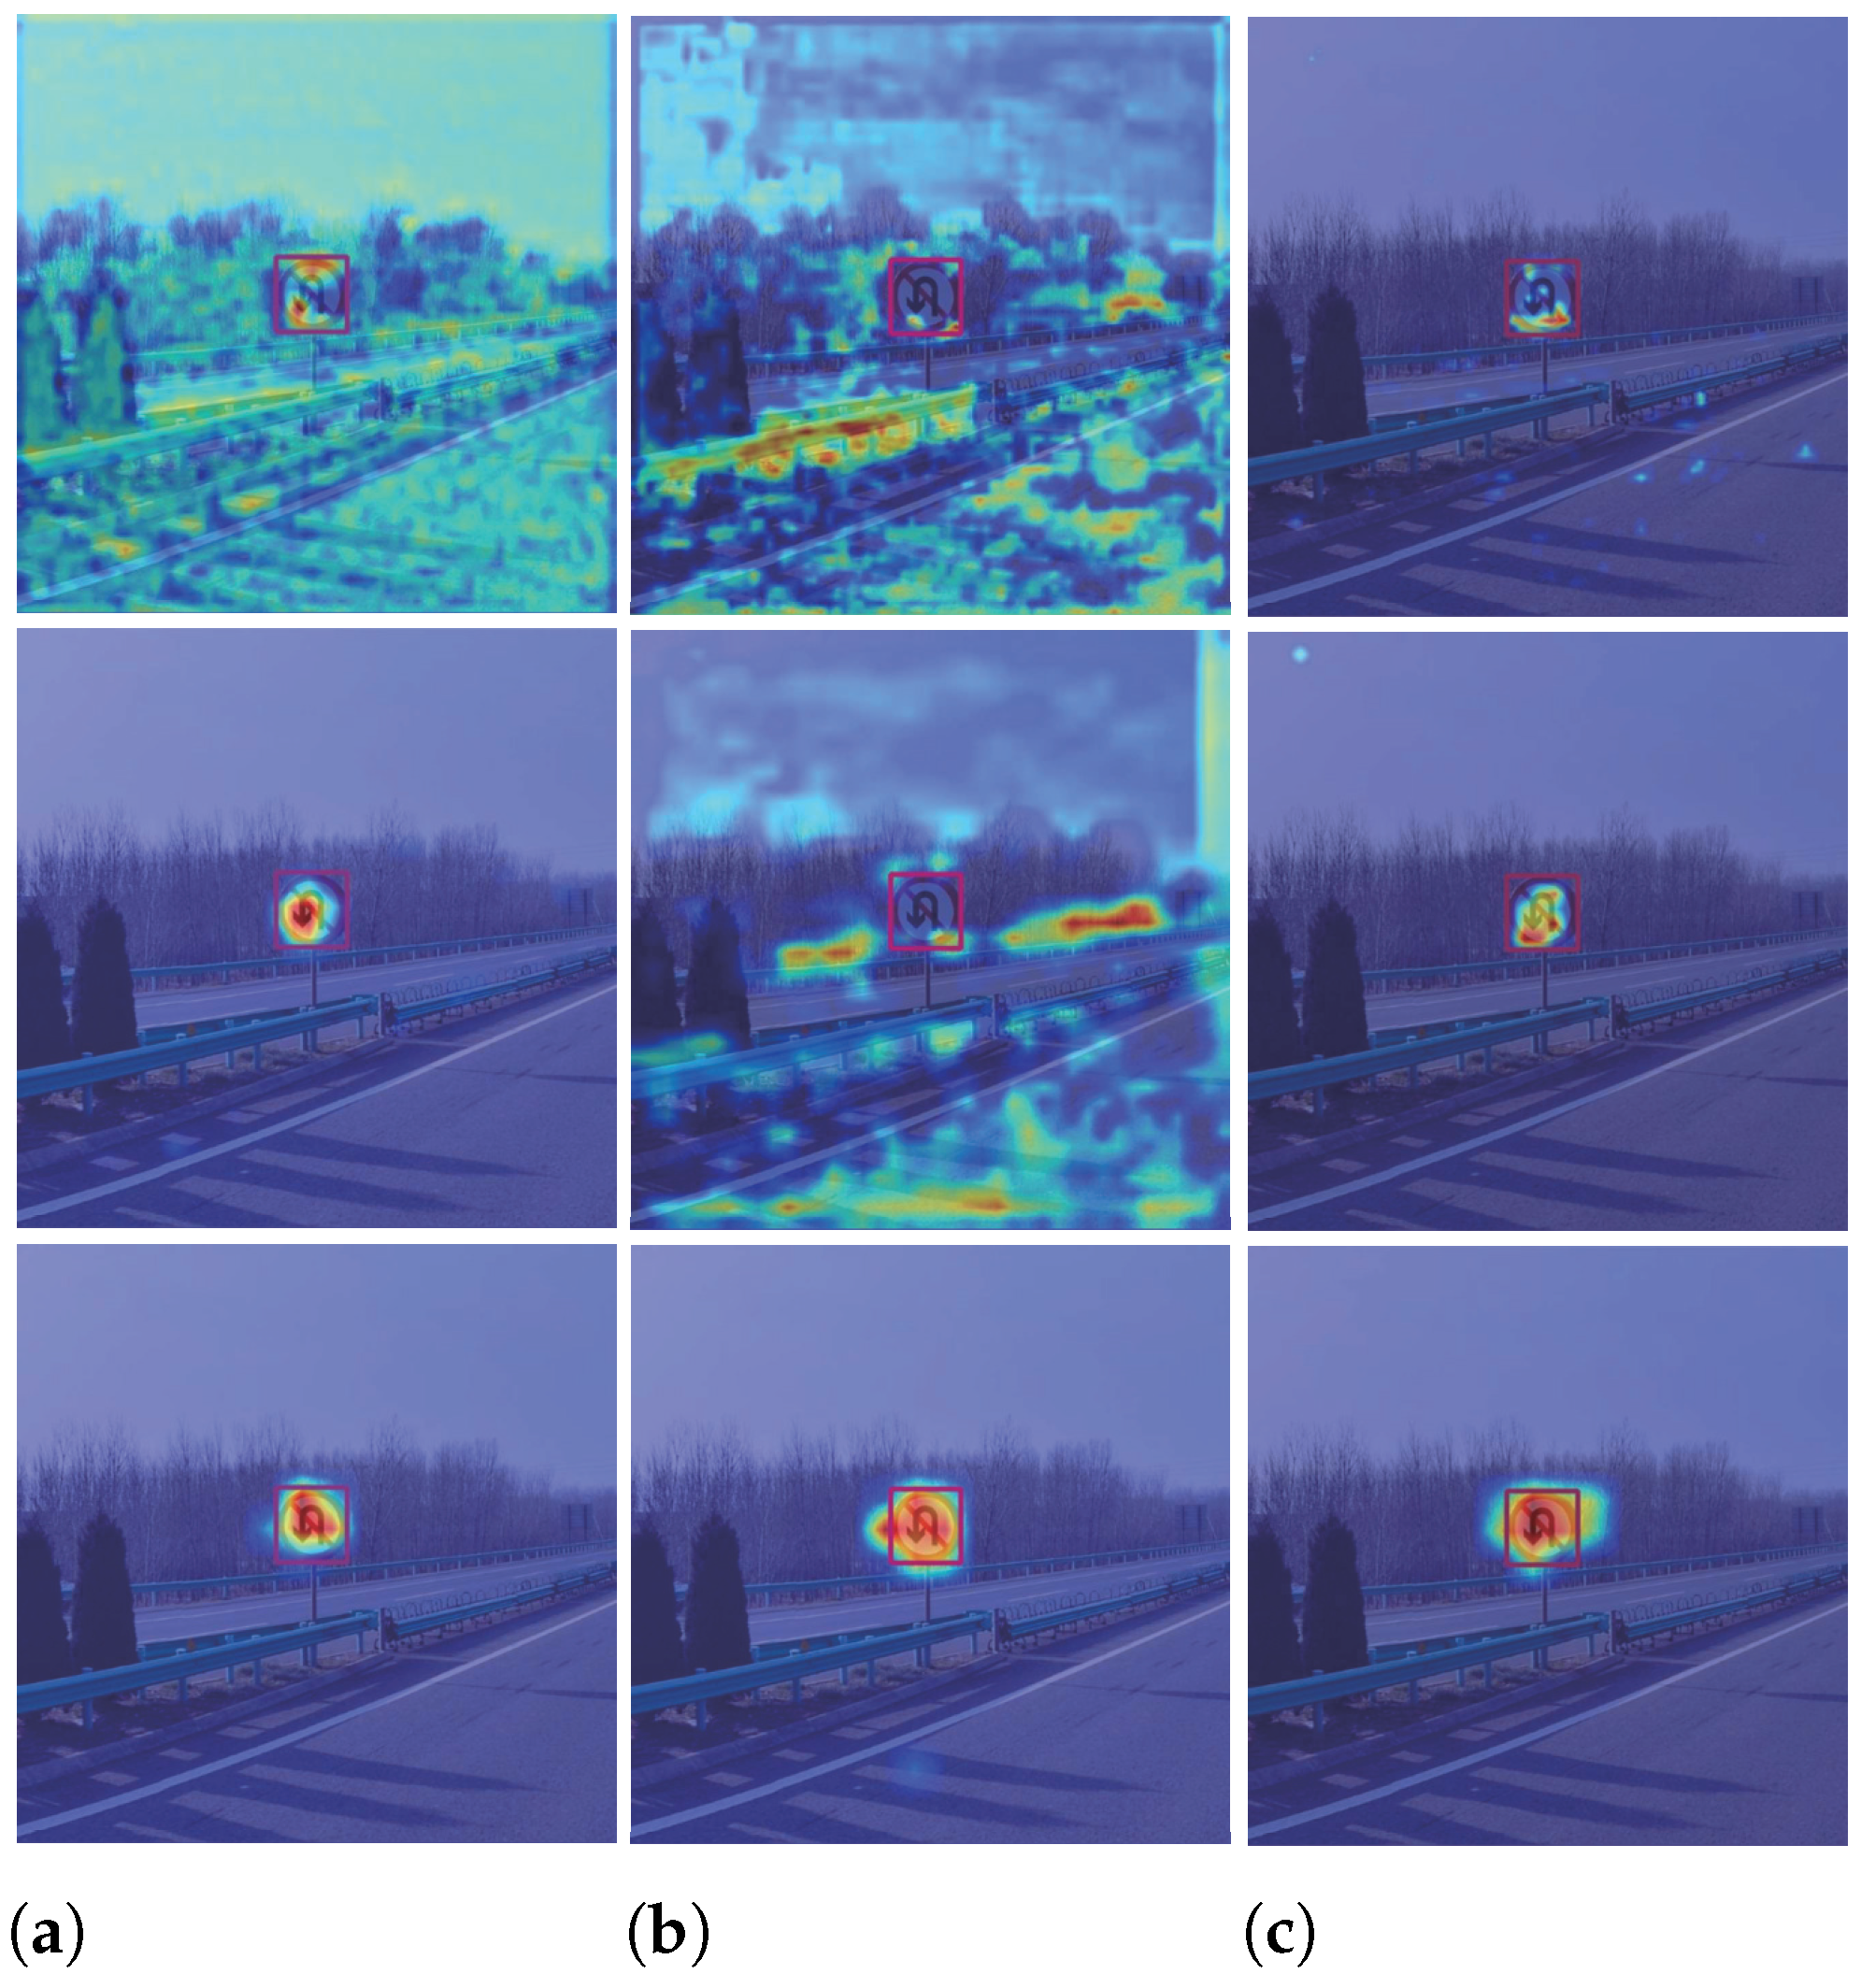
To directly verify the effectiveness of our proposed method, we leverage heat maps to visualize the feature map extraction and the target localization information. As shown in Figure 9, it is indicated that the proposed method can successfully extract the features of traffic signs and give correct predictions. The lightweight model has relatively poor performance in the low-dimensional feature layer compared with the baseline model Yolov5s. In contrast, the SEDG-Yolov5 model after distillation training can quickly locate where traffic signs are even in the low-dimensional feature layer, and is more abundant in semantic information.

5. Conclusions

In this paper, an improved lightweight SEDG-Yolov5 based on knowledge distillation is proposed for the traffic sign detection task. We use the SAHI method for the dataset to retain as much of the sign information as possible and to ameliorate the robustness of our model. We then propose ESGBlock, which can effectively improve traffic sign feature extraction and construct a lightweight backbone network; we also introduce the GSConv module to further reduce the computational complexity of the model. Finally, the model is fine-tuned for the performance degradation of the detection model caused by light-weighting leveraging of the improved response-based knowledge distillation method. The numerous experimental results demonstrate that our proposed method can perfectly satisfy the deployment requirements of end-side devices and can yield relatively high detection precision while ensuring smooth reasoning. More specifically, how to minimize performance loss or achieve performance improvements, and ways to further promote the inference speed of the model to yield faster detection will be studied in future.

Author Contributions

Conceptualization, L.Z. and Z.W.; methodology, L.Z. and Z.W.; software, L.Z.; validation, Z.W., Y.L., J.J. and X.L.; formal analysis, Z.W.; investigation, L.Z. and Z.W.; resources, X.L.; data curation, Y.L. and J.J.; writing—original draft preparation, Z.W.; writing—review and editing, L.Z. and Z.W.; visualization, X.L.; supervision, L.Z.; project administration, L.Z.; funding acquisition, L.Z., Y.L. and J.J. All authors have read and agreed to the published version of the manuscript.

Funding

This research was funded by the National Natural Science Foundation of China (No. 61473114, No. 62106068 and No. 62106233), the Science and Technology Research Project of Henan Province (No. 222102210058), and the Fundamental Research Funds for the Henan Provincial Colleges and Universities in Henan University of Technology (No. 2018RCJH16).

Data Availability Statement

The data that support the findings of this study are openly available at https://cg.cs.tsinghua.edu.cn/traffic-sign/ and http://www.cvl.isy.liu.se/en/research/datasets/traffic-signs-dataset/.

Acknowledgments

The authors want to thank the editor and anonymous reviewers for their valuable suggestions for improving this paper.

Conflicts of Interest

The authors declare no conflict of interest.

References

  1. Chen, Q.; Xie, Y.; Guo, S.; Bai, J.; Shu, Q. Sensing System of Environmental Perception Technologies for Driverless Vehicle: A Review of State of the Art and Challenges. Sens. Actuators Phys. 2021, 319, 1–18. [Google Scholar] [CrossRef]
  2. Houben, S.; Stallkamp, J.; Salmen, J.; Schlipsing, M.; Igel, C. Detection of Traffic Signs in Real-world Images: The German Traffic Sign Detection Benchmark. In Proceedings of the 2013 International Joint Conference on Neural Networks, Dallas, TX, USA, 4–9 August 2013; pp. 1–8. [Google Scholar]
  3. Zhu, Z.; Liang, D.; Zhang, S.; Huang, X.; Li, B.; Hu, S. Traffic Sign Detection and Classification in the Wild. In Proceedings of the IEEE Conference on Computer Vision and Pattern Recognition, Las Vegas, NV, USA, 27–30 June 2016; pp. 2110–2118. [Google Scholar]
  4. Sütő, J. An Improved Image Enhancement Method for Traffic Sign Detection. Electronics 2022, 11, 871. [Google Scholar] [CrossRef]
  5. Liu, Z.; Qi, M.; Shen, C.; Fang, Y.; Zhao, X. Cascade Saccade Machine Learning Network with Hierarchical Classes for Traffic Sign detection. Sustain. Cities Soc. 2021, 67, 102700. [Google Scholar] [CrossRef]
  6. Wei, H.; Zhang, Q.; Qian, Y.; Xu, Z.; Han, J. MTSDet: Multi-scale Traffic Sign Detection with Attention and Path Aggregation. Appl. Intell. 2023, 53, 238–250. [Google Scholar] [CrossRef]
  7. Ahmed, S.; Kamal, U.; Hasan, M.K. DFR-TSD: A Deep Learning Based Framework for Robust Traffic Sign Detection Under Challenging Weather Conditions. IEEE Trans. Intell. Transp. Syst. 2022, 23, 5150–5162. [Google Scholar] [CrossRef]
  8. Liang, T.; Bao, H.; Pan, W.; Pan, F. Traffic Sign Detection via Improved Sparse R-CNN for Autonomous Vehicles. J. Adv. Transp. 2022, 2022, 3825532. [Google Scholar] [CrossRef]
  9. Lin, T.Y.; Maire, M.; Belongie, S.; Hays, J.; Perona, P.; Ramanan, D.; Dollár, P.; Zitnick, C.L. Microsoft COCO: Common Objects in Context. In Proceedings of the 13th European Conference on Computer Vision, Zurich, Switzerland, 6–12 September 2014; pp. 740–755. [Google Scholar]
  10. Everingham, M.; Van Gool, L.; Williams, C.K.; Winn, J.; Zisserman, A. The PASCAL Visual Object Classes (VOC) Challenge. Int. J. Comput. Vis. 2010, 88, 303–338. [Google Scholar] [CrossRef] [Green Version]
  11. Redmon, J.; Divvala, S.; Girshick, R.; Farhadi, A. You Only Look Once: Unified, Real-time Object Detection. In Proceedings of the IEEE Conference on Computer Vision and Pattern Recognition, Las Vegas, NV, USA, 27–30 June 2016; pp. 779–788. [Google Scholar]
  12. Redmon, J.; Farhadi, A. YOLO9000: Better, Faster, Stronger. In Proceedings of the IEEE Conference on Computer Vision and Pattern Recognition, Honolulu, HI, USA, 21–26 July 2017; pp. 7263–7271. [Google Scholar]
  13. Redmon, J.; Farhadi, A. Yolov3: An Incremental Improvement. arXiv 2018, arXiv:1804.02767. [Google Scholar]
  14. Bochkovskiy, A.; Wang, C.Y.; Liao, H.Y.M. Yolov4: Optimal Speed and Accuracy of Object Detection. arXiv 2020, arXiv:2004.10934. [Google Scholar]
  15. Jocher, G.; Chaurasia, A.; Stoken, A.; Borovec, J.; Kwon, Y.; Xie, T.; Fang, J.; Michael, K.; Montes, D.; Nadar, J.; et al. Ultralytics/Yolov5: V6.1—TensorRT, TensorFlow Edge TPU and OpenVINO Export and Inference. Available online: https://github.com/ultralytics/yolov5/tree/v6.1 (accessed on 10 March 2022).
  16. Girshick, R.; Donahue, J.; Darrell, T.; Malik, J. Rich Feature Hierarchies for Accurate Object Detection and Semantic Segmentation. In Proceedings of the IEEE Conference on Computer Vision and Pattern Recognition, Columbus, OH, USA, 23–28 June 2014; pp. 580–587. [Google Scholar]
  17. Mu, C.Y.; Ma, X.; Wang, Y.; Zhang, C.T. Traffic Sign Detection Based on Colour Standardization and HOG Descriptor. In Proceedings of the 2015 International Conference on Advanced Management Science and Information Engineering(AMSIE 2015), Hong Kong, China, 20 September 2015; pp. 699–706. [Google Scholar]
  18. Huang, H.; Huang, Z. Circular Traffic Signs Detection in Natural Environments. In Proceedings of the 2017 2nd International Conference on Artificial Intelligence: Techniques and Applications(AITA 2017), Shenzhen, China, 17 September 2017; pp. 353–357. [Google Scholar]
  19. You, S.; Bi, Q.; Ji, Y.; Liu, S.; Feng, Y.; Wu, F. Traffic Sign Detection Method Based on Improved SSD. Information 2020, 11, 475. [Google Scholar] [CrossRef]
  20. Li, X.; Xie, Z.; Deng, X.; Wu, Y.; Pi, Y. Traffic Sign Detection Based on Improved Faster R-CNN for Autonomous Driving. J. Supercomput. 2022, 78, 7982–8002. [Google Scholar] [CrossRef]
  21. Dewi, C.; Chen, R.C.; Liu, Y.T.; Jiang, X.; Hartomo, K.D. Yolo V4 for Advanced Traffic Sign Recognition with Synthetic Training Data Generated by Various GAN. IEEE Access 2021, 9, 97228–97242. [Google Scholar] [CrossRef]
  22. Le, H.; Nguyen, M.; Yan, W.Q.; Lo, S. Training a Convolutional Neural Network for Transportation Sign Detection Using Synthetic Dataset. In Proceedings of the 2021 36th International Conference on Image and Vision Computing New Zealand (IVCNZ), Tauranga, New Zealand, 9–10 December 2021; pp. 1–6. [Google Scholar]
  23. Liu, F.; Qian, Y.; Li, H.; Wang, Y.; Zhang, H. CAFFNet: Channel Attention and Feature Fusion Network for Multi-target Traffic Sign Detection. Int. J. Pattern Recognit. Artif. Intell. 2021, 35, 26–30. [Google Scholar] [CrossRef]
  24. Shen, L.; You, L.; Peng, B.; Zhang, C. Group Multi-scale Attention Pyramid Network for Traffic Sign Detection. Neurocomputing 2021, 452, 1–14. [Google Scholar] [CrossRef]
  25. Ayachi, R.; Afif, M.; Said, Y.; Ben Abdelali, A. An edge implementation of a traffic sign detection system for Advanced driver Assistance Systems. Int. J. Intell. Robot. Appl. 2022, 6, 207–215. [Google Scholar] [CrossRef]
  26. Gu, Y.; Si, B. A Novel Lightweight Real-Time Traffic Sign Detection Integration Framework Based on YOLOv4. Entropy 2022, 24, 487. [Google Scholar] [CrossRef]
  27. Rehman, Y.; Amanullah, H.; Shirazi, M.A.; Kim, M.Y. Small Traffic Sign Detection in Big Images: Searching Needle in a Hay. IEEE Access 2022, 10, 18667–18680. [Google Scholar] [CrossRef]
  28. Nguyen, H. Fast Traffic Sign Detection Approach Based on Lightweight Network and Multilayer Proposal Network. J. Sensors 2020, 2020, 8844348. [Google Scholar] [CrossRef]
  29. Lu, G.; He, X.; Wang, Q.; Shao, F.; Wang, J.; Hu, C. A Traffic Sign Detection Network Based on PosNeg-Balanced Anchors and Domain Adaptation. Arab. J. Sci. Eng. 2022, 1–15. [Google Scholar] [CrossRef]
  30. Chen, J.; Jia, K.; Chen, W.; Lv, Z.; Zhang, R. A Real-time and High-precision Method for Small Traffic-signs Recognition. Neural Comput. Appl. 2022, 34, 2233–2245. [Google Scholar] [CrossRef]
  31. Wang, J.; Chen, Y.; Dong, Z.; Gao, M. Improved YOLOv5 Network for Real-time Multi-scale Traffic Sign Detection. Neural Comput. Appl. 2022, 1–13. [Google Scholar] [CrossRef]
  32. Hinton, G.; Vinyals, O.; Dean, J. Distilling the Knowledge in a Neural Network. arXiv 2015, arXiv:1503.02531. [Google Scholar]
  33. Wang, T.; Yuan, L.; Zhang, X.; Feng, J. Distilling Object Detectors with Fine-Grained Feature Imitation. In Proceedings of the IEEE/CVF Conference on Computer Vision and Pattern Recognition, Long Beach, CA, USA, 15–20 June 2019; pp. 4933–4942. [Google Scholar]
  34. Wang, W.; Hong, W.; Wang, F.; Yu, J. GAN-Knowledge Distillation for One-Stage Object Detection. IEEE Access 2020, 8, 60719–60727. [Google Scholar] [CrossRef]
  35. Yang, Z.; Li, Z.; Jiang, X.; Gong, Y.; Yuan, Z.; Zhao, D.; Yuan, C. Focal and Global Knowledge Distillation for Detectors. In Proceedings of the IEEE/CVF Conference on Computer Vision and Pattern Recognition, New Orleans, LA, USA, 18–24 June 2022; pp. 4643–4652. [Google Scholar]
  36. Akyon, F.C.; Altinuc, S.O.; Temizel, A. Slicing Aided Hyper Inference and Fine-tuning for Small Object Detection. arXiv 2022, arXiv:2202.06934. [Google Scholar]
  37. Li, H.; Li, J.; Wei, H.; Liu, Z.; Zhan, Z.; Ren, Q. Slim-neck by GSConv: A better design paradigm of detector architectures for autonomous vehicles. arXiv 2022, arXiv:2206.02424. [Google Scholar]
  38. Zhou, D.; Hou, Q.; Chen, Y.; Feng, J.; Yan, S. Rethinking Bottleneck Structure for Efficient Mobile Network Design. In Proceedings of the European Conference on Computer Vision, Glasgow, UK, 23–28 August 2020; pp. 680–697. [Google Scholar]
  39. Wang, Q.; Wu, B.; Zhu, P.; Li, P.; Zuo, W.; Hu, Q. ECA-Net: Efficient Channel Attention for Deep Convolutional Neural Networks. In Proceedings of the 2020 IEEE/CVF Conference on Computer Vision and Pattern Recognition, Seattle, WA, USA, 13–19 June 2020; pp. 11531–11539. [Google Scholar]
  40. Mehta, R.; Ozturk, C. Object Detection at 200 Frames Per Second. In Proceedings of the 15th European Conference on Computer Vision (ECCV) Workshops, Munich, Germany, 8–14 September 2018; pp. 4321–4330. [Google Scholar]
  41. Larsson, F.; Felsberg, M. Using Fourier Descriptors and Spatial Models for Traffic Sign Recognition. In Proceedings of the Scandinavian Conference on Image Analysis, Ystad, Sweden, 23–25 May 2011; pp. 238–249. [Google Scholar]
  42. Liu, Z.; Lin, Y.; Cao, Y.; Hu, H.; Wei, Y.; Zhang, Z.; Lin, S.; Guo, B. Swin transformer: Hierarchical Vision Transformer using Shifted Windows. In Proceedings of the IEEE/CVF International Conference on Computer Vision, Montreal, QC, Canada, 10–17 October 2021; pp. 10012–10022. [Google Scholar]
  43. Tan, M.; Pang, R.; Le, Q.V. EfficientDet: Scalable and Efficient Object Detection. In Proceedings of the IEEE/CVF Conference on Computer Vision and Pattern Recognition, Seattle, WA, USA, 13–19 June 2020; pp. 10781–10790. [Google Scholar]
  44. Liu, Y.; Peng, J.; Xue, J.H.; Chen, Y.; Fu, Z.H. TSingNet: Scale-aware and Context-rich Feature Learning for Traffic Sign Detection and Recognition in the Wild. Neurocomputing 2021, 447, 10–22. [Google Scholar] [CrossRef]
  45. RangiLyu. NanoDet-Plus: Super Fast and High Accuracy Lightweight Anchor-Free Object Detection Model. Available online: https://github.com/RangiLyu/nanodet (accessed on 25 April 2022).
Figure 1. Examples of common factors affecting traffic sign detection capabilities sampled from the original dataset.
Electronics 12 00305 g001
Figure 2. The overall structure of the SEDG-Yolov5 detection model.
Electronics 12 00305 g002
Figure 3. Schematic diagram of the bottleneck structure: (a) Sandglass Bottleneck (b) ESGBlock.
Electronics 12 00305 g003
Figure 4. Architecture of the Efficient Channel Attention Module.
Electronics 12 00305 g004
Figure 5. Schematic diagram of GSConv module.
Electronics 12 00305 g005
Figure 6. Response-based objectness scaled distillation framework.
Electronics 12 00305 g006
Figure 7. Distribution of instances for the TT100K dataset.
Electronics 12 00305 g007
Figure 8. Distribution of instances for the STSD dataset.
Electronics 12 00305 g008
Figure 9. Visualization results of three scales of feature maps for different models: (a) Yolov5s. (b) SEDG-Yolov5 before distillation. (c) SEDG-Yolov5 after distillation.
Electronics 12 00305 g009
Table 1. Performance comparison of different lightweight models with our proposed method.
ModelInput SizeLayersParameters(M)FLOPs(G)
Yolov5s640 × 6402707.1416.2
Yolov5-Lite-c640 × 6403194.609.3
Yolov5s-Ghost640 × 6404533.808.5
Yolov5s-MobileNetv3s640 × 6403403.666.6
Yolov5s-ShuffleNetv2640 × 6402303.306.3
SEDG-Yolov5640 × 6402162.776.2
Table 2. Performance comparison with different detection models on the TT100K dataset.
MethodInput SizeParameters[email protected][email protected]:.95 AP S AP M AP L AR S AR M AR L
Swin-T64028M91.471.055.778.084.262.984.286.1
TsingNet80023.1M89.265.344.872.779.151.177.181.7
NanoDet-m6400.95M63.953.624.558.269.637.674.380.2
EfficientDet-d16406.60M81.959.139.665.570.648.778.980.1
Yolov5n6401.82M86.967.348.874.977.165.283.383.3
Yolov5s6407.14M91.571.856.178.179.668.483.983.3
SEDG-Yolov56402.77M91.071.653.178.682.566.184.487.9
Table 3. Comparison of F1-score for the 45 selected categories in the TT100K dataset (in %).
Methodi2i4i5il100il60il80ioipp10p11p12p19p23p26p27
NanoDet-m69.581.284.994.993.892.065.476.345.361.730.369.175.578.379.9
Swin-T67.974.665.280.383.486.170.680.966.163.567.274.283.680.383.6
Zhu et al. [16]76.987.893.395.691.190.381.884.783.088.188.788.990.786.085.9
Yolov5s89.793.395.394.597.892.982.186.390.586.787.083.485.688.794.3
SEDG-Yolov587.893.595.292.698.092.183.187.490.088.289.490.291.588.196.8
Methodp3p5p6pgph4ph4.5ph5pl100pl120pl20pl30pl40pl5pl50pl60
NanoDet-m81.980.350.665.673.273.367.385.586.071.179.780.466.768.164.8
Swin-T80.777.567.475.279.785.280.383.990.160.476.570.083.376.478.8
Zhu et al. [16]81.591.784.291.986.385.383.494.496.888.189.191.388.389.487.1
Yolov5s83.289.685.487.783.691.784.994.497.685.088.891.793.088.389.6
SEDG-Yolov581.990.975.792.081.585.684.594.798.381.287.991.689.588.090.3
Methodpl70pl80pm20pm30pm55pnpnepopr40w13w32w55w57w59wo
NanoDet-m80.878.765.270.873.384.185.053.478.848.576.152.177.266.954.2
Swin-T80.278.277.480.574.278.969.274.589.565.976.271.166.462.759.5
Zhu et al. [16]90.291.889.685.373.391.692.273.785.564.574.775.285.373.147.9
Yolov5s95.393.388.186.295.290.894.078.889.571.790.085.081.877.069.2
SEDG-Yolov591.790.492.390.095.092.194.280.286.375.590.576.284.178.274.1
Table 4. Performance comparison with different detection models on the STSD dataset.
MethodInput SizeParameters[email protected][email protected]:.95 AP S AP M AP L AR S AR M AR L
NanoDet-m6400.95M72.154.846.362.570.751.273.579.1
TsingNet80023.1M85.360.444.971.074.353.171.475.9
Swin-T64028M89.257.345.771.778.858.676.180.6
Yolov5n6401.82M87.656.247.871.973.152.572.978.3
Yolov5s6407.14M93.361.648.572.474.856.677.076.4
SEDG-Yolov56402.77M92.959.449.873.579.558.077.680.7
Table 5. Comparison of results for F1-score on the STSD dataset (in %).
Method30_SIGN70_SIGN100_SIGNOTHERPASS_RSIDEPED_CROSSINGGIVE_WAY
NanoDet-m65.463.567.871.275.989.257.4
Swin-T72.972.384.286.186.788.784.8
Yolov5s87.197.097.686.388.490.187.2
Yolov5n84.094.897.386.685.289.883.1
SEDG-Yolov587.591.795.487.288.590.787.9
Method50_SIGN80_SIGN110_SIGNURDBLPASS_LSIDEPRIORITY_ROADNO_PARKING
NanoDet-m52.967.282.556.465.480.364.8
Swin-T93.884.177.185.595.189.673.6
Yolov5s94.592.093.499.097.793.298.9
Yolov5n91.891.596.680.295.393.095.2
SEDG-Yolov595.093.292.396.798.894.196.7
Method60_SIGN90_SIGN120_SIGNSTOPPASS_EISIDENO_STOP/STAND
NanoDet-m63.679.481.268.675.286.3
Swin-T67.987.289.651.186.090.9
Yolov5s93.984.086.382.993.591.8
Yolov5n92.574.990.567.789.992.1
SEDG-Yolov593.188.591.570.091.695.2
Table 6. Performance comparison with different detection models.
MethodInput SizeModel SizeFPS (GPU)FPS (CPU)
w/o TRTwith TRTw/o ONNXwith ONNX
Yolov5n6404.0 MB161.3357.111.831.2
Yolov5s64014.7 MB158.7347.24.717.2
SEDG-Yolov56405.9 MB178.8370.013.935.6
Table 7. Comparison of ablation experiments with different training methods on the TT100K dataset.
AblationAugmentationLightweightDistillation[email protected][email protected]:.95
Yolov5s84.464.7
91.271.7
68.949.6
85.665.5
88.468.8
91.771.9
72.953.2
91.071.6
Table 8. Comparison of detection performance for different combinations of values.
T ε [email protected][email protected]:.95Precision (%)Recall (%)
50.589.570.089.883.1
100.389.670.188.583.9
100.590.070.489.184.8
100.889.670.288.382.4
200.389.970.389.084.1
200.591.071.691.285.8
200.889.770.288.083.7
500.589.770.290.484.3
1000.588.569.788.283.1
Disclaimer/Publisher’s Note: The statements, opinions and data contained in all publications are solely those of the individual author(s) and contributor(s) and not of MDPI and/or the editor(s). MDPI and/or the editor(s) disclaim responsibility for any injury to people or property resulting from any ideas, methods, instructions or products referred to in the content.