
Concept of an Innovative System for Dimensioning and Predicting Changes in the Coastal Zone Topography Using UAVs and USVs (4DBatMap System)


Abstract
:1. Introduction
1.1. Effects of a Lack of Dimensioning and Predicting Changes in the Coastal Zone Topography
1.2. Current State of Knowledge
- The tachymetric method involves determining the position of a depth point based on the measurement of horizontal and vertical angles and distances, usually carried out using an electronic total station. This method is characterised by a high position measurement accuracy (<1 cm). However, its main disadvantage is the low coverage of the bottom with measurements, which is determined by the depth to which the surveyor with a pole can enter [31,33].
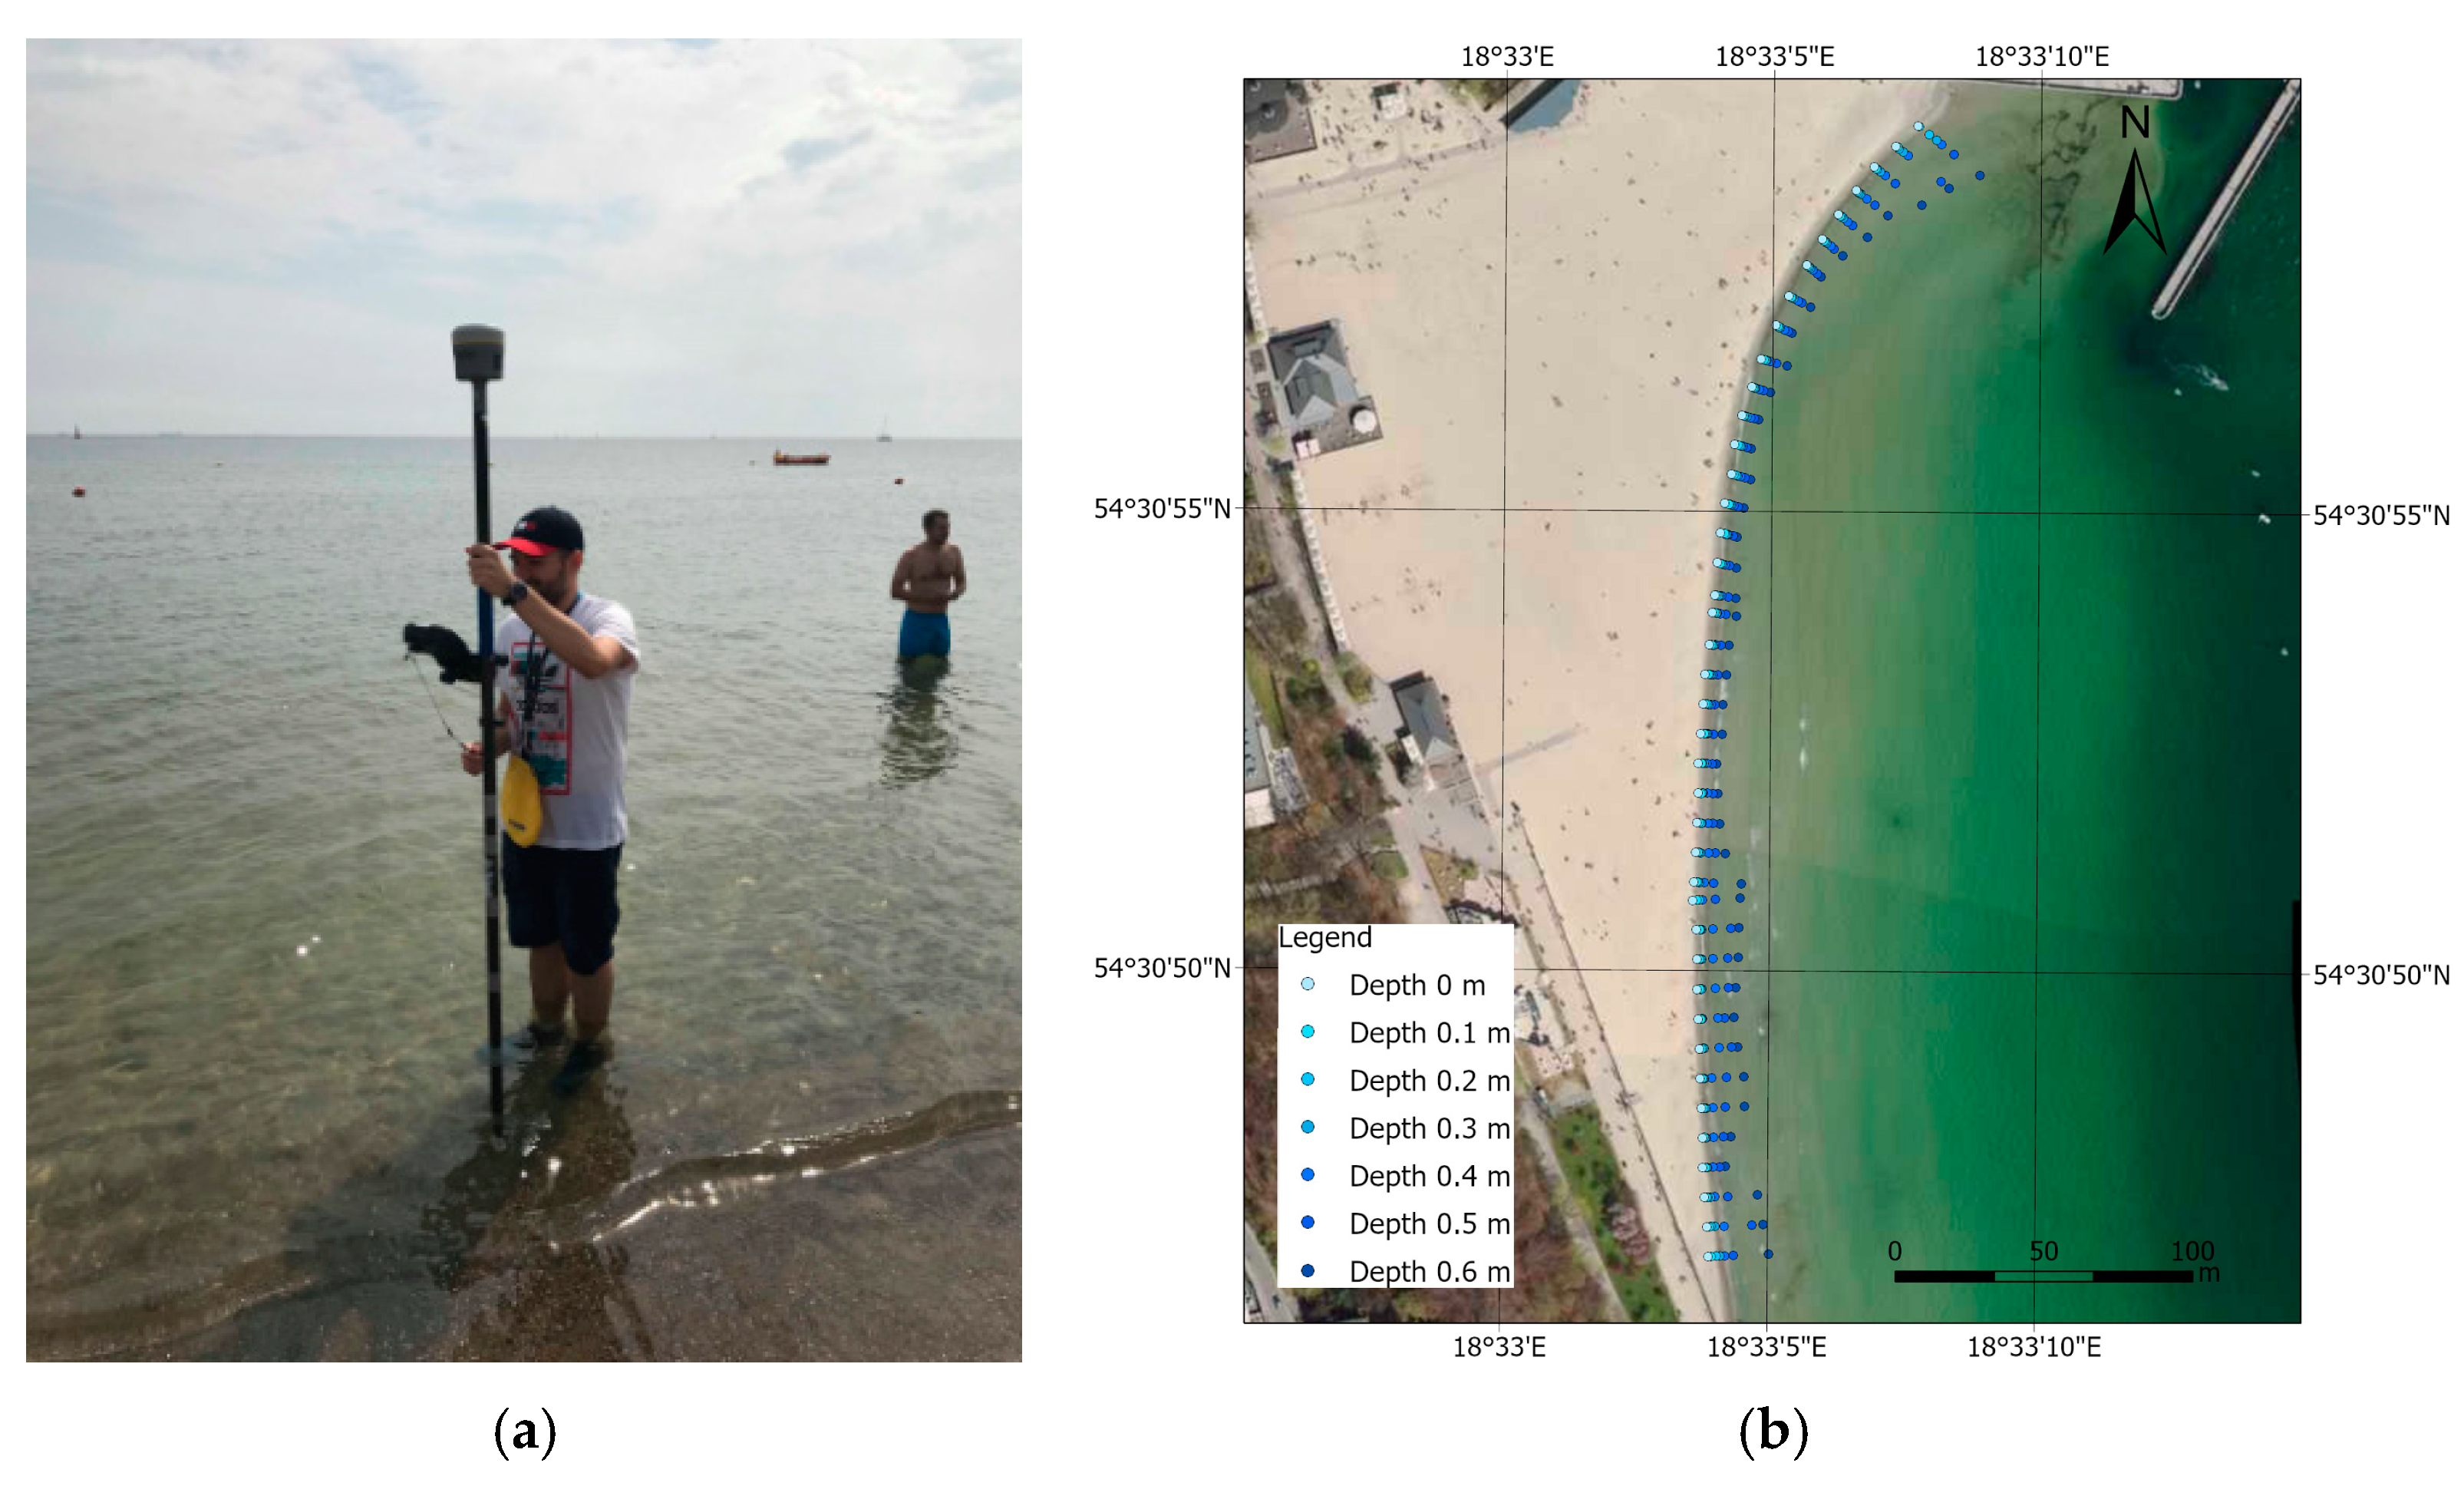
- The geodetic method involves a surveyor entering marine water depths to a preset depth using a Global Navigation Satellite System (GNSS) receiver mounted on a pole. Similarly to the tachymetric method, it is characterised by a high positioning accuracy (1–2 cm when using a GNSS Real Time Kinematic (RTK) receiver) and a low coverage of the bottom with measurements [34,35] (Figure 5).
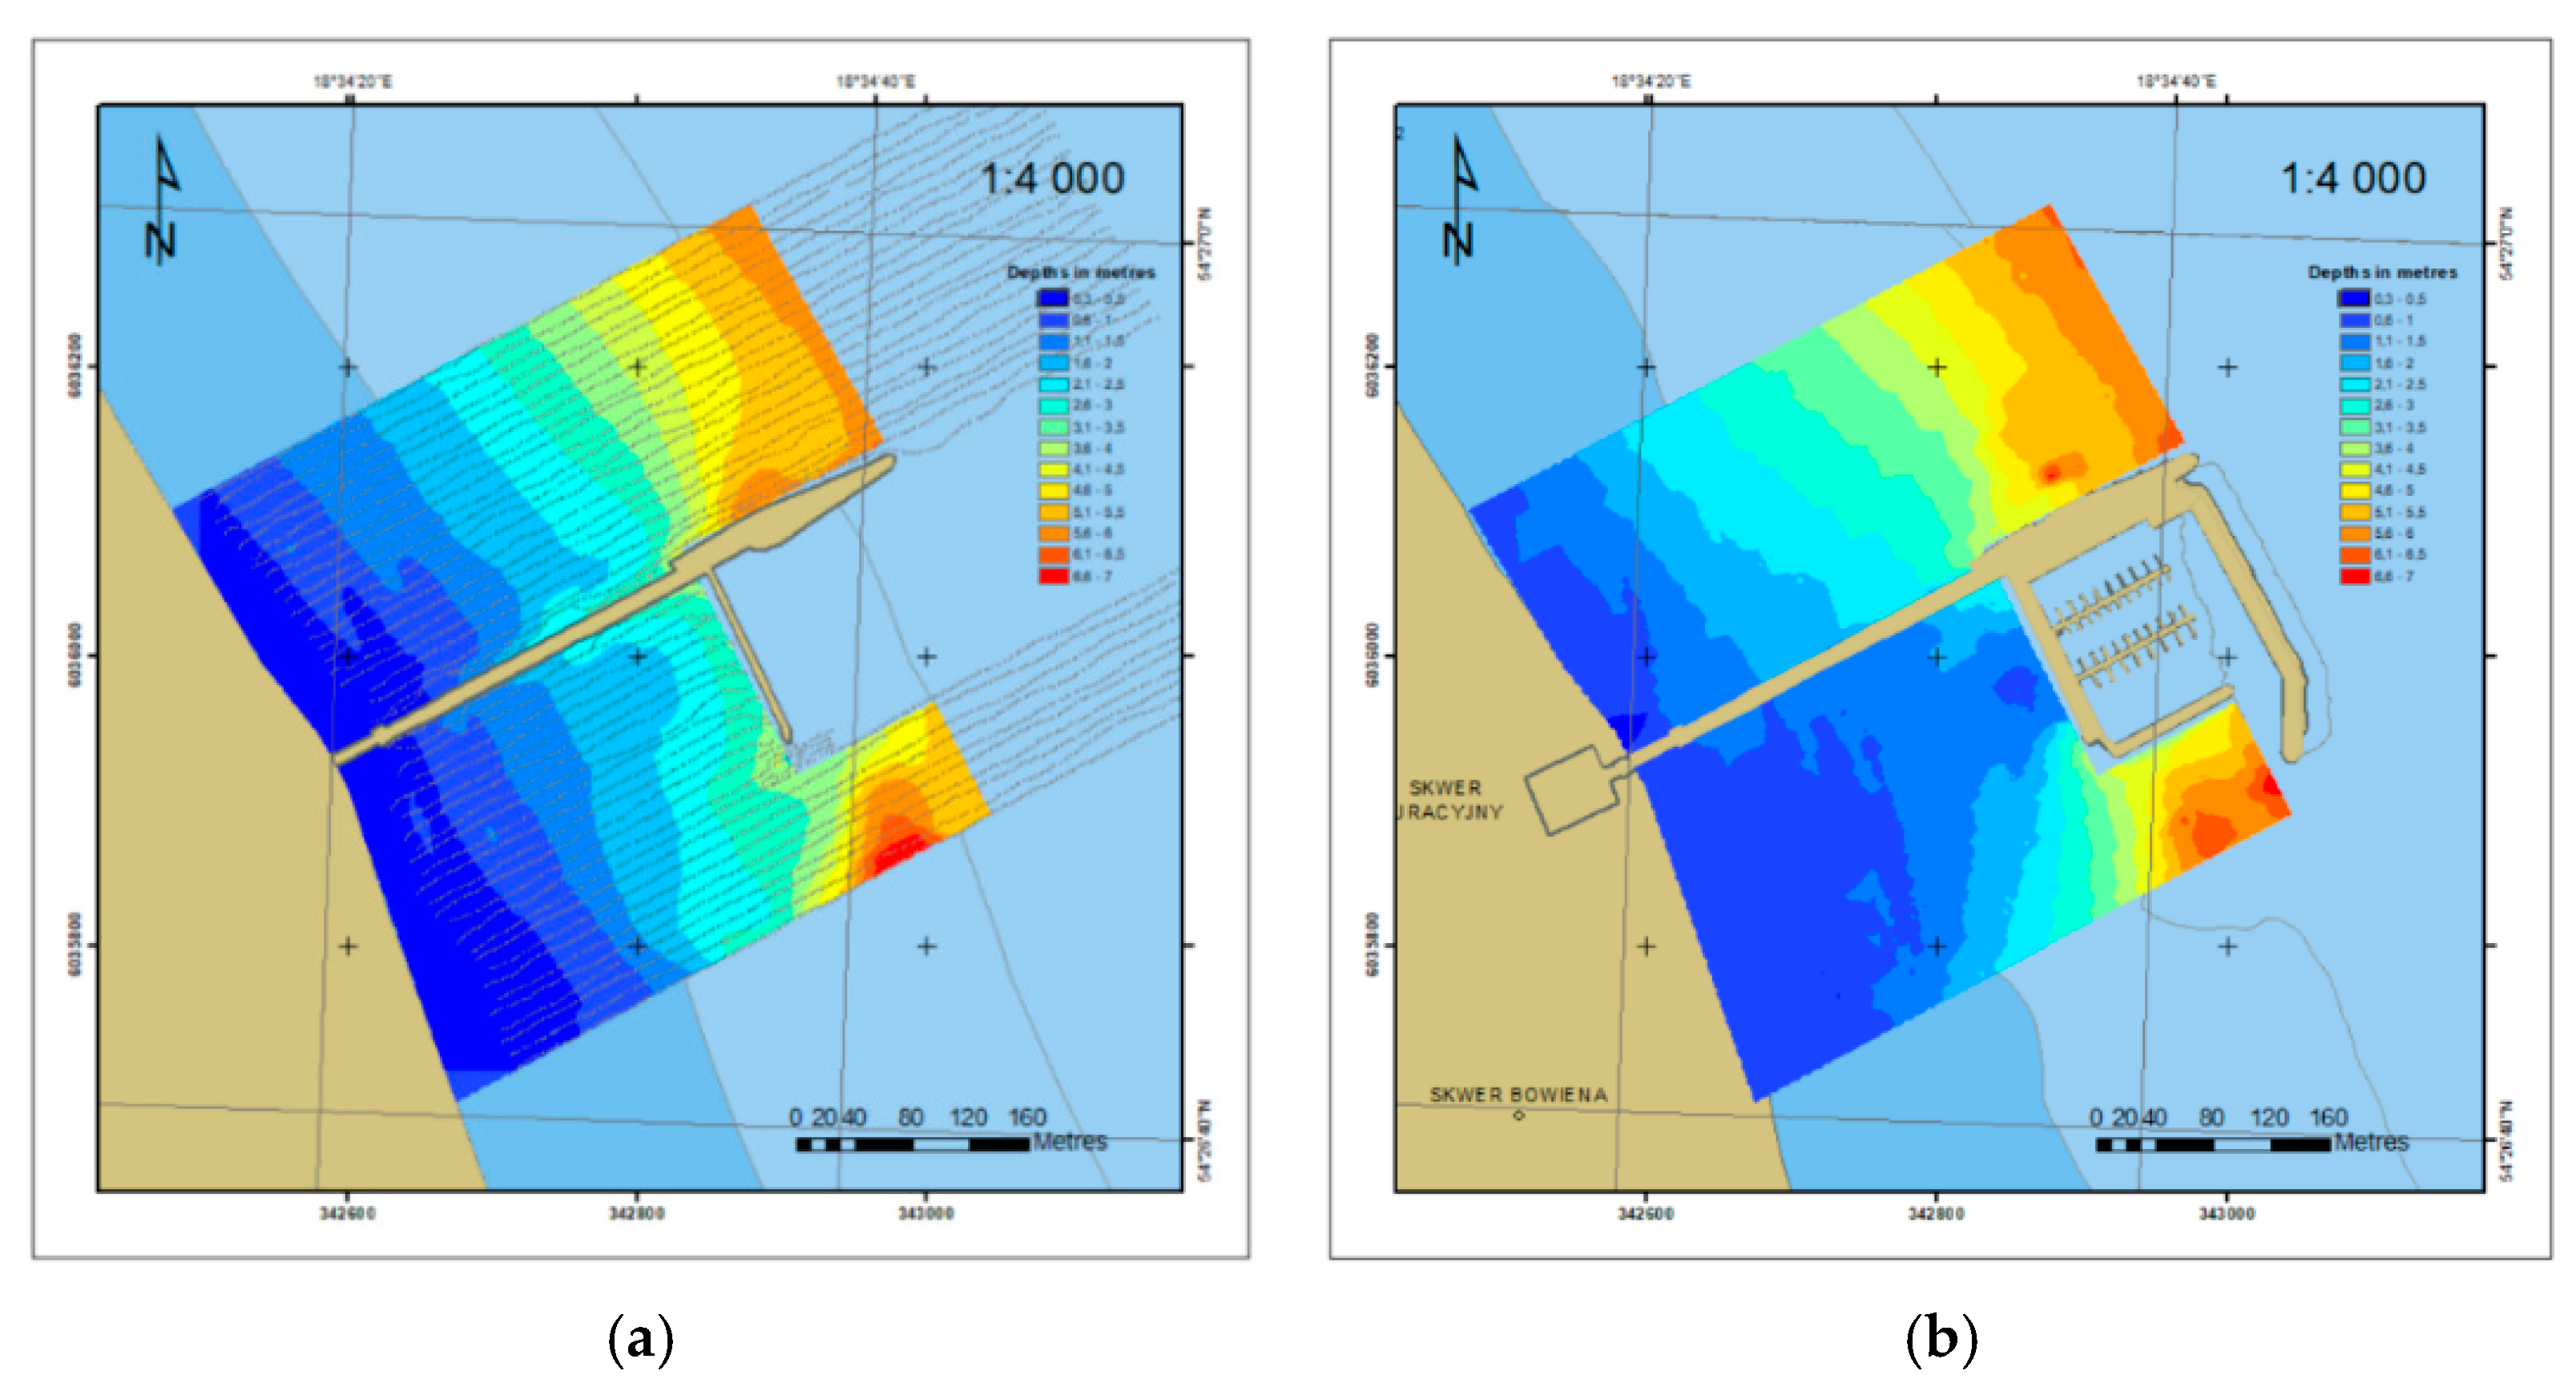
- The hydrographic method involves performing a bathymetric survey using a manned vessel with a measurement set comprising a hydroacoustic device (SBES) and a positioning system (maritime Differential Global Positioning System (DGPS) receiver) usually mounted on it. This method has a limited range of operation due to the draft of hydrographic vessels (approx. 1 m and more) and the echo sounder transducers mounted on their bows. It can be assumed that bathymetric measurements down to a depth of 1 m are virtually not carried out using the hydrographic method. In addition, it should be noted that hydrographic surveys of this type involve considerable financial outlays [36,37].
- Satellite-Derived Bathymetry (SDB) involves the determination of the waterbody depth by measuring light intensity using high-resolution (0.5–2.5 m) multi-spectral images derived from DubaiSat, IKONOS, QuickBird and WorldView satellites, or moderate-resolution multi-spectral images derived from Landsat satellites [38]. Undoubtedly, the advantages of satellite bathymetry include the lack of costs associated with the performance of hydrographic surveys, the considerably shorter time it takes to carry out the measurements as compared to the traditional methods and the possibility of conducting research in remote and inaccessible areas. The disadvantage of the SDB method is the unsatisfactory accuracies of depth measurements (of several metres), which are strongly determined by water transparency [39,40].
- Airborne LiDAR Bathymetry (ALB)/Airborne LiDAR Hydrography (ALH) involve determining the depths of a waterbody by measuring the time difference between the moments of reception of two pulses recorded by the on-board sensors of a manned aircraft [41]. The advantage of the ALH/ALB systems is the full coverage of the bottom with measurements, the accuracy of which, however, depends on water transparency [42]. A study conducted by [43] proved that these systems failed to meet the accuracy requirements provided for the most stringent IHO Orders (Exclusive and Special). The disadvantages of the ALB/ALH systems also include the relatively low resolution that is largely determined by the local hydrometeorological and hydrological conditions, as well as the considerable financial outlays for the research.
2. Materials and Methods
2.1. Measurement Aspect
- The measurement aspect, which will involve the optimal selection of equipment, survey methods and techniques for acquiring geospatial data that meet the accuracy requirements provided for the IHO Special Order.
- The mathematical modelling aspect, which will involve the analytical processing of geospatial data for predicting changes in the coastal zone topography. As a result, an optimal method will be determined to describe the temporal and spatial variability of the coastal zone topography and criteria for the assessment of these changes will be determined.
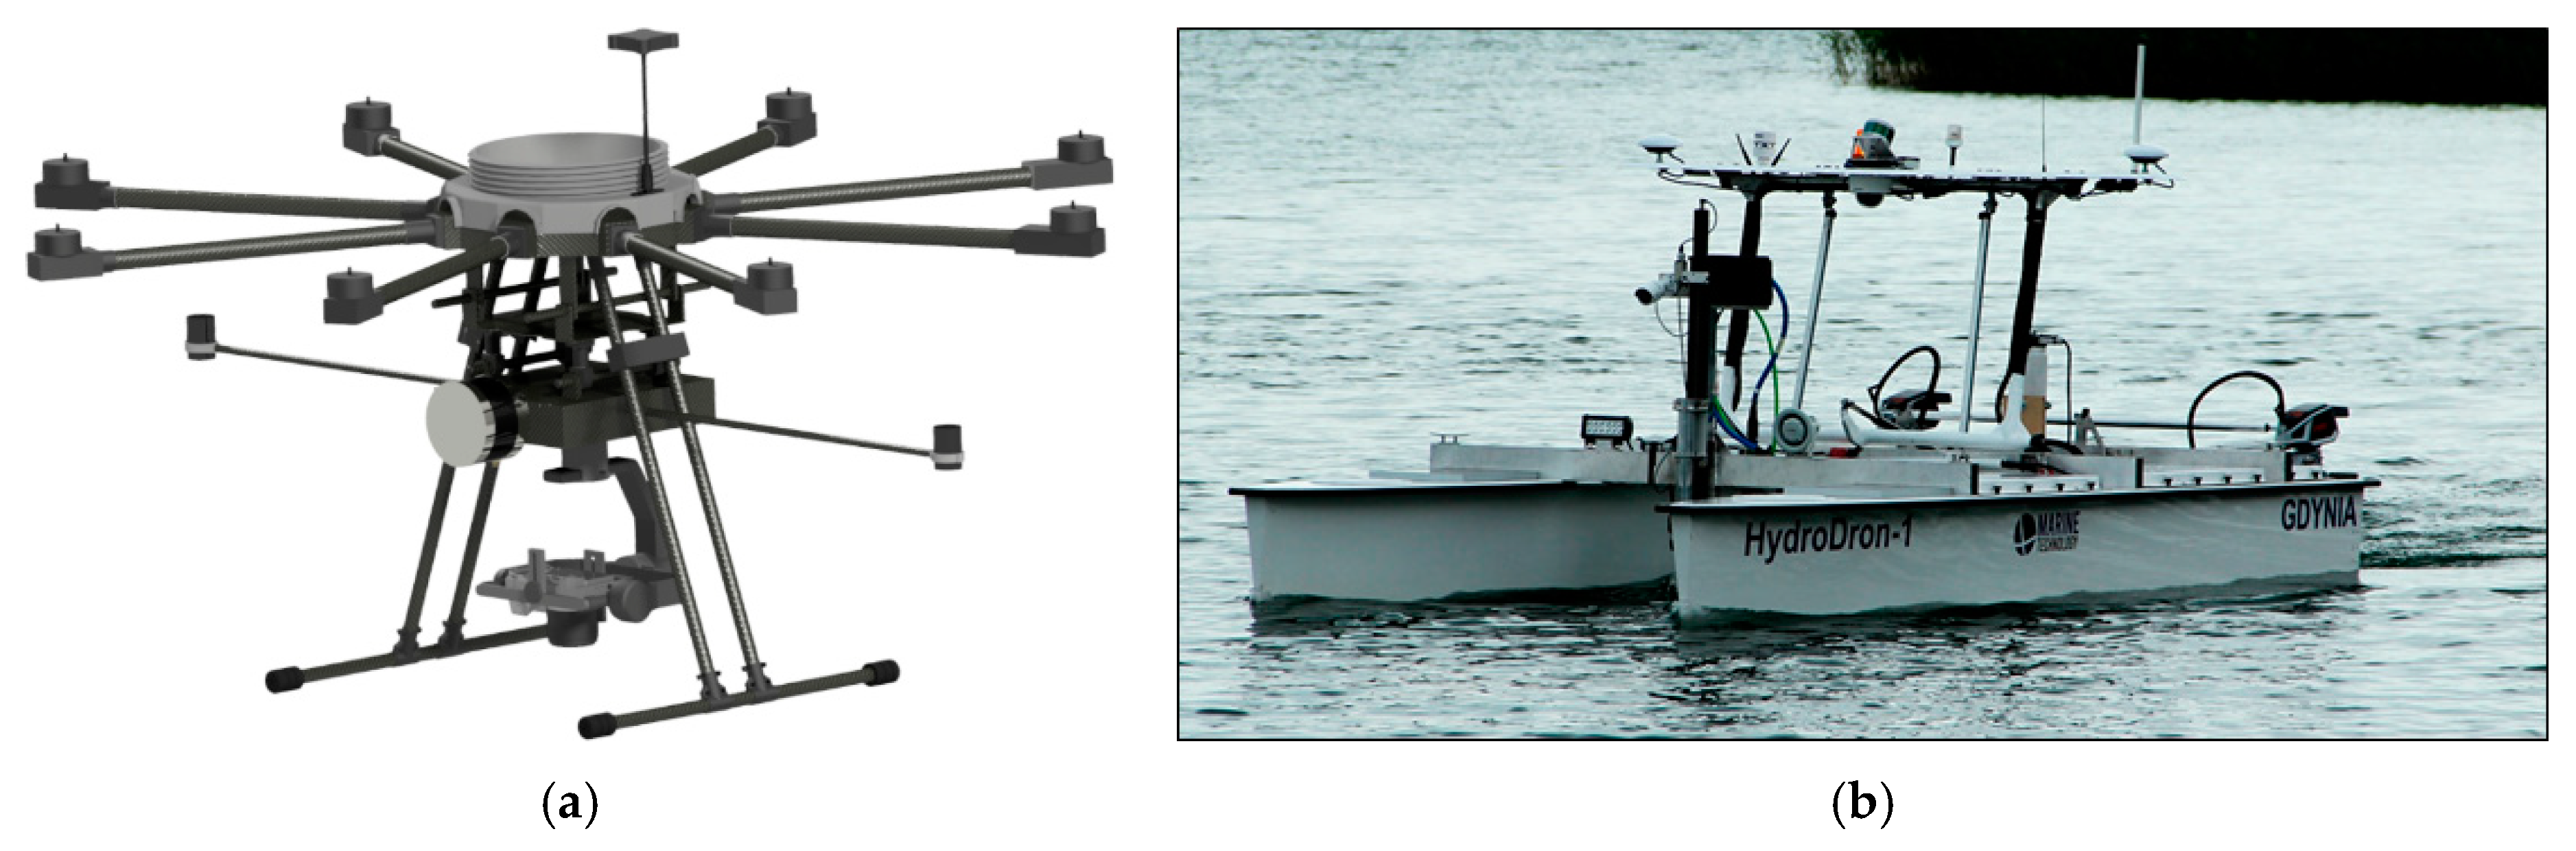
- A UAV is an aircraft capable of performing a flight with no pilot on-board. Therefore, the flight of the aircraft must be performed autonomously, in pre-programmed mode or using remote control [44,45]. Aerial drones are characterised by their high manoeuvrability, small size and high accessibility, and they enable the performance of complex photogrammetric surveys with an accuracy of up to several centimetres thanks to the possibility of mounting high-resolution digital cameras or 3D laser scanners on them [46,47,48,49,50]. The system will use an Aurelia X8 UAV, on which a prototype optoelectronic module comprising the following nine components will be mounted: a camera (Sony A6500 + Sony E 35 mm f/1.8 OSS), communication module, gimbal (Gremsy T3V3), GNSS/Inertial Navigation System (INS) (SBG Ellipse-D), Internet modem, LiDAR (Velodyne VLP-16 Puck LITE), module supporting camera and gimbal control, power control module and a single-board computer (PICO-WHU4) (Figure 6a). A UAV will enable the performance of photogrammetric surveys of the coastal zone onshore topography and the determination of the depths between the shoreline of the shallow waterbody and the min. isobath recorded by the echo sounder [51]. The prototype optoelectronic module to be mounted on the UAV was designed during the implementation of a research project entitled “Innovative autonomous unmanned system for bathymetric monitoring of shallow waterbodies” (INNOBAT system), funded by the National Centre for Research and Development (NCBR) in Poland under the LIDER XI programme [35].Photogrammetric measurements using a UAV will be carried out under appropriate weather conditions, i.e., sunny and windless weather. In order to obtain LiDAR data and low-altitude images, the research will be conducted along previously planned flight profiles parallel and perpendicular to the coastline, spaced every 10 m from each other, with a longitudinal and transverse coverage of approx. 80%. To fully cover the area with photos, the flight will be carried out at a speed of 10 km/h at a height of 70 m. Thanks to this, it will be possible to obtain the Ground Sample Distance (GSD) of approx. 2–3 cm [45,52].
- A hydrographic USV is a remotely, radio-controlled surface vessel that enables hardware integration with a GNSS receiver and a vertical echo sounder (min. equipment), designed to carry out hydrographic surveys in harbour basins, lakes, rivers and small waterbodies [53,54,55,56,57]. The main advantage of USVs is their shallow draft (10–20 cm in certain cases). This allows them, in contrast to manned hydrographic vessels, to carry out bathymetric measurements on shallow water areas with depths of up to 1 m. The system will use a hydrographic “HydroDron” USV (Figure 6b) [58,59], built during the implementation of a research project entitled “Development of an autonomous/remotely controlled surface platform dedicated to hydrographic surveys in restricted waterbodies”, funded by the NCBR in Poland under the INNOSBZ programme [60]. This is undoubtedly a solution that meets the highest global standards for the performance of hydrographic surveys. Thanks to the state-of-the-art equipment, the “HydroDron” vessel allows bathymetric, LiDAR and sonar measurements to be carried out in autonomous mode. The “HydroDron” USV enables the implementation of hydrographic surveys of fixed and floating objects, aids to navigation, features above the vertical reference significant to navigation, coastline, overhead clearances, water flow direction, water flow speed and angular measurements in accordance with the accuracy requirements provided for the most stringent IHO Order, i.e., the Exclusive Order.Hydrographic surveys using a USV will be carried out under appropriate hydrometeorological conditions, i.e., no waves and no wind. For depths exceeding 1 m, bathymetric measurements will be performed with the use of the “HydroDron” USV equipped with an MBES parallel to the coastline. However, at depths of up to 1 m a shallow-draft USV equipped with a SBES will be used. Hydrographic surveys will be conducted along main and control profiles. In places where it is impossible to obtain bathymetric data at depths, the geodetic method will be applied, which will enable full coverage of the bottom with measurements [52,61].
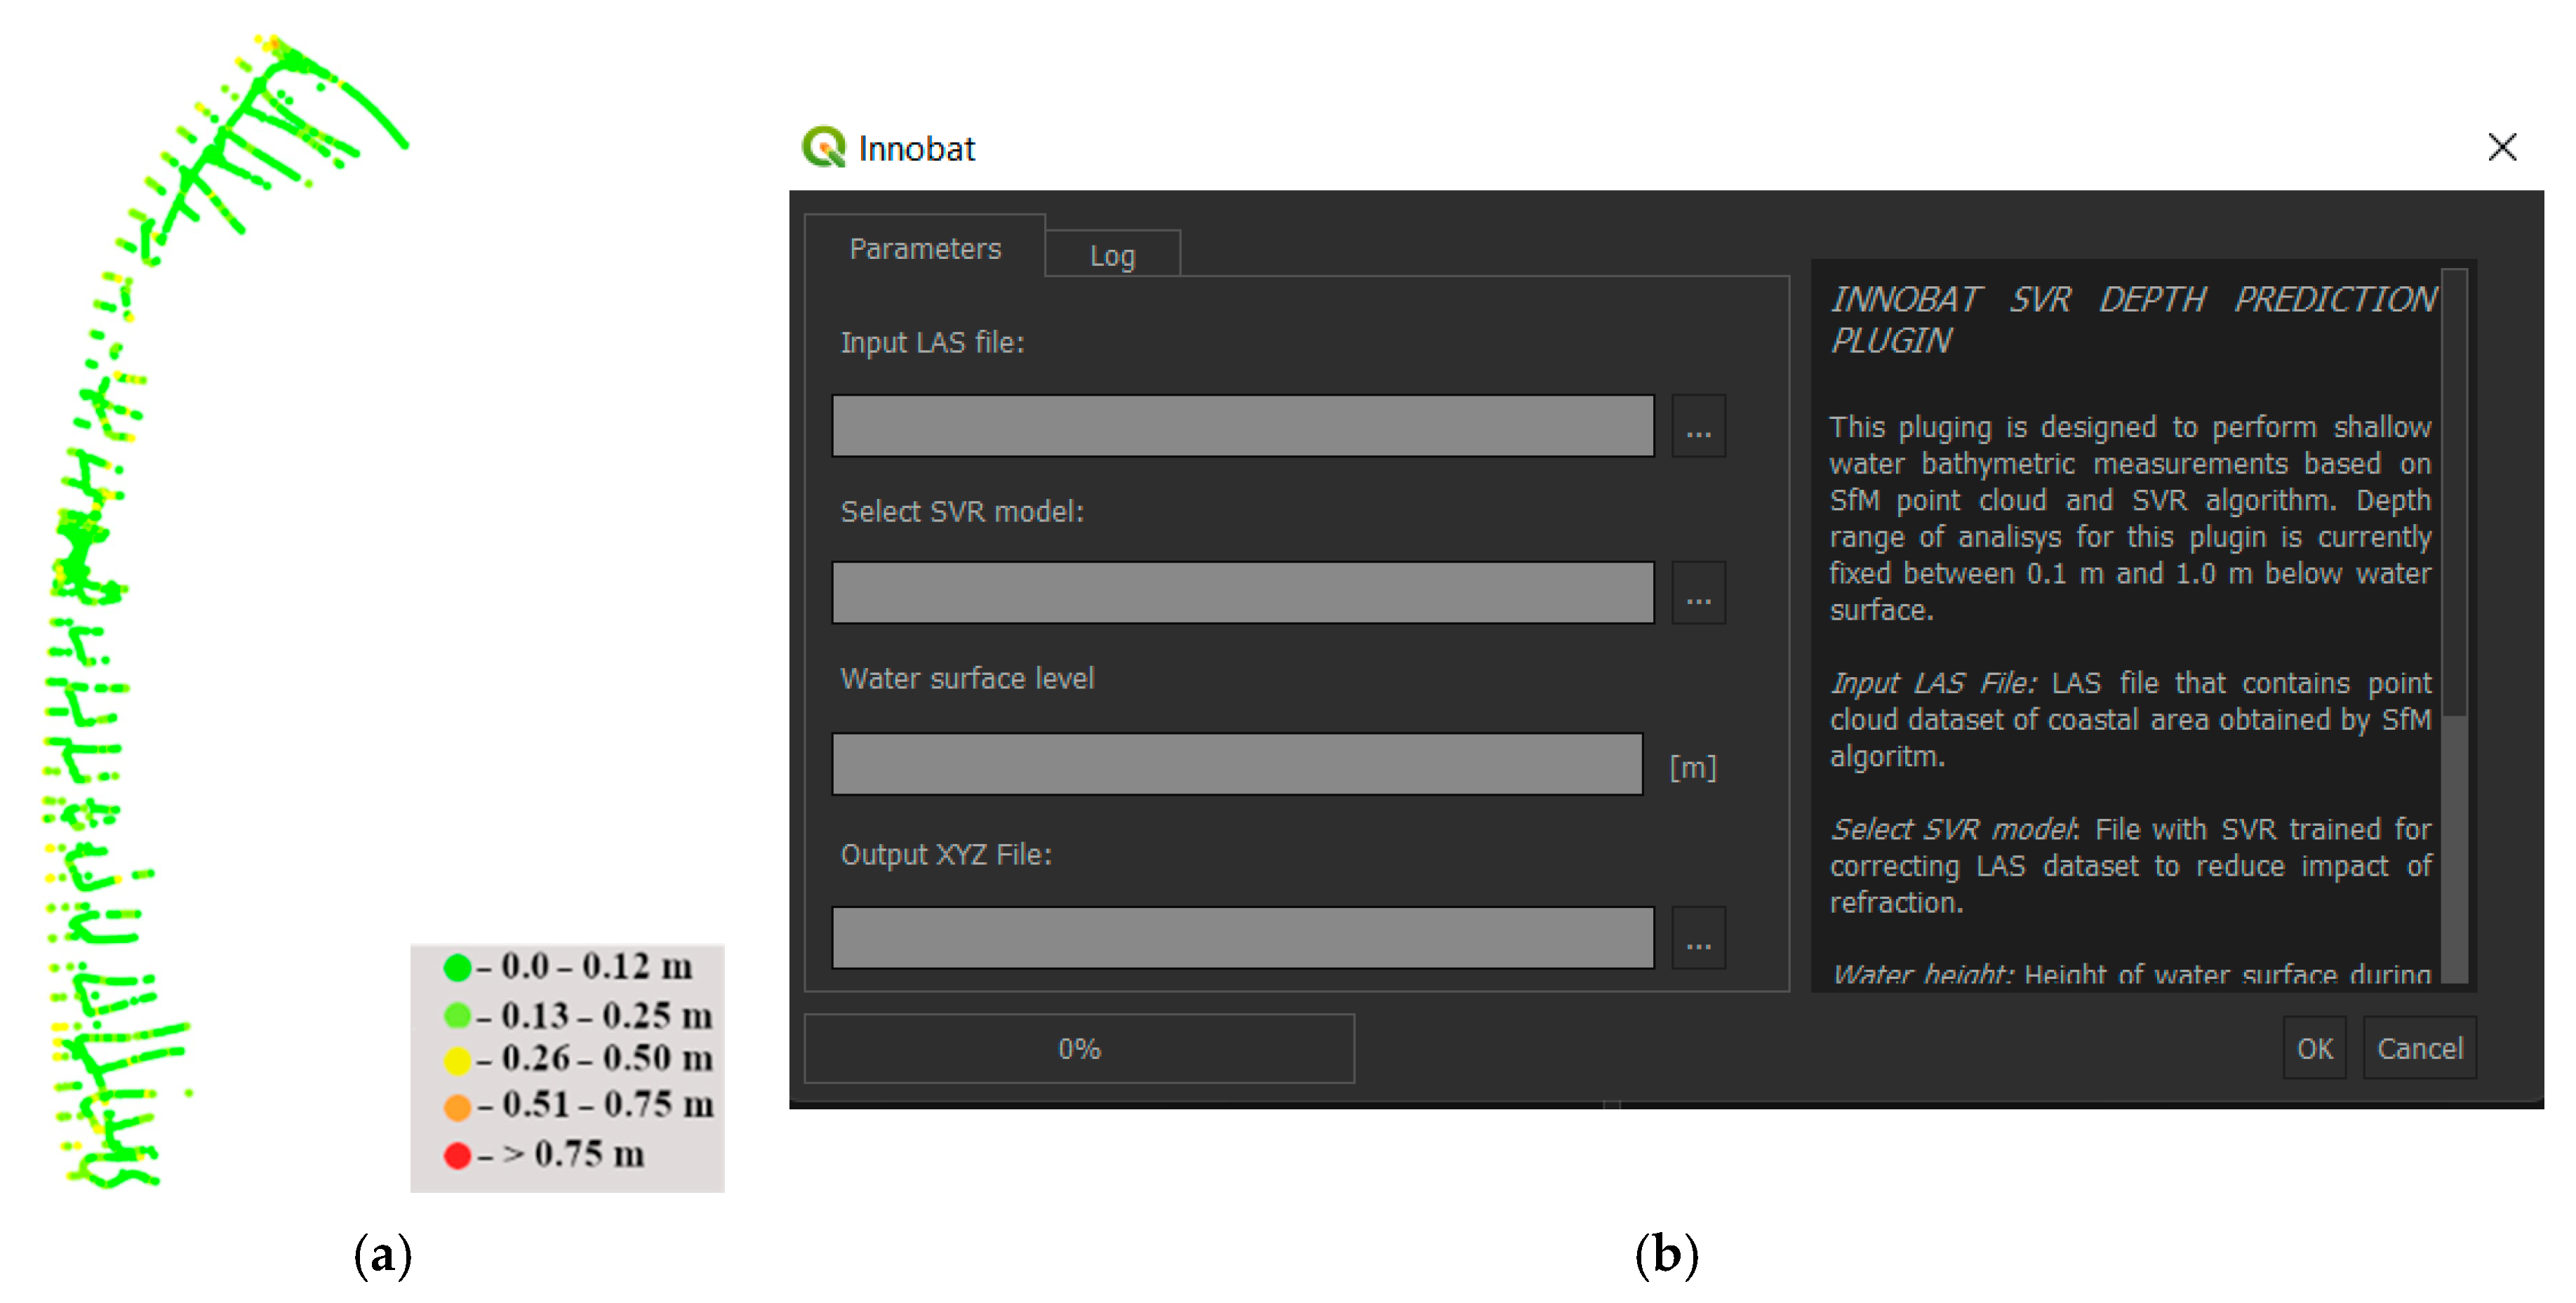
- A method for determining the depth of shallow waterbodies, which involves acquiring aerial images from the UAV and then processing (interpreting) them in post-processing mode. The Support Vector Regression (SVR) algorithm [62] will allow the depth of a shallow-water area to be determined based on the radiometry of the field pixel image [63]. As part of the INNOBAT project, a validation study of this method was carried out on two waterbodies: marine and inland. In the marine water area, the 2σ depth measurement accuracy (p = 0.95) was 0.16 m (Figure 7a), while in the inland waterbody, the 2σ depth measurement error (p = 0.95) ranged from 0.22 to 0.24 m. It should be noted that the above results were obtained for a depth range of up to 1 m. The study demonstrated that the proposed method for determining the depth of shallow water areas within a range of 0.1 to 1 m met the accuracy requirements provided for the IHO Special Order [30]. In addition, the INNOBAT project implemented this method in the form of the “Depth prediction” plug-in in the QGIS software (Figure 7b).
2.2. Analysis of Time Series
- Step I: Analysis of the basic properties of the series. In this step, the measurement data will be presented as graphs. They will enable the determination of a long-term tendency (trend) and seasonal fluctuations (seasonality). In addition, a graph will be produced to assess whether a temporal correlation is occurring in the data and how strong it is (the so-called autocorrelation).
- Step II: Necessary transformations. Before starting the proper analysis and predicting of time series, the measurement data must be prepared in an appropriate way. To this end, transformations are used to simplify the modelling and predict the construction process. These include:
- ○
- Box–Cox transformation (power transform) is applied when variance in the data under analysis increases or decreases with the series level. Very importantly, the application of this transformation allows the effect on the analysis results, occurring in the series of atypical (outlier) observations, to be mitigated, and the data distribution more similar to the normal one to be obtained (a typical assumption for classical models for time series).
- ○
- Differentiation is used to transform data to the stationary form, i.e., one whose properties do not change over time (no occurrence of a long-term trend and seasonality). If a stationary series is obtained following the elimination of the trend and seasonality, it will then be possible to fit a suitable model from an extensive family of stationary models, e.g., AR, MA and ARMA models.
- ○
- The division of data into a training set and a test set. In order to be able to reliably assess the accuracy and to compare the performance of different prediction methods, the measurement data will be divided into two parts: the training set and the test set. Forecasts will be constructed based on the training set, while the assessment of their accuracy will be carried out using the test set.
- Step III: Model fitting and diagnostics. When analysing time series, the choice of an appropriate mathematical model for the measurement data is of vital importance. To this end, the following models will be used to predict changes in the coastal zone topography:
- ○
- Stationary models, e.g., AR (p), MA (q) and ARMA (p,q).
- ○
- Non-stationary models to account for the differentiation operations, e.g., ARIMA (p,d,q).
- ○
- Seasonal models, e.g., ARIMA (p,d,q) (P,D,Q)s.
- ○
- Models based on ExponenTial Smoothing (ETS).
- ○
- Decomposition models to account for the breakdown of the series into seasonality, trend and random fluctuations.
- ○
- Basic information will be presented for each model and diagnostic charts will be produced to confirm the model fit correctness.
- Step IV: Prediction. Forecasting future values based on historical data is among the main tasks of time series analysis. The choice of an appropriate prediction method is determined by many factors, e.g., long-term trends occurring in the series under analysis and seasonality. In order to assess the actual suitability of the prediction construction methods applied, it is advisable to also take into account simple reference methods in the comparison to assess whether the forecasts determined using advanced methods are more accurate and how much more accurate they are.
- ○
- Criteria based on prediction methods, e.g., Mean Absolute Error (MAE), Mean Square Error (MSE) and the Root Mean-Square Error (RMSE).
- ○
- Criteria based on percentage prediction methods, e.g., Mean Absolute Percentage Error (MAPE), Mean Percentage Error (MPE) and the Maximum Absolute Percentage Error (MaxAPE).
- ○
- Criteria based on scaled errors, e.g., Mean Absolute Scaled Error (MASE).
- ○
- Criteria using reference forecasting methods, e.g., Theil and Theil’s U indexes.
3. Results
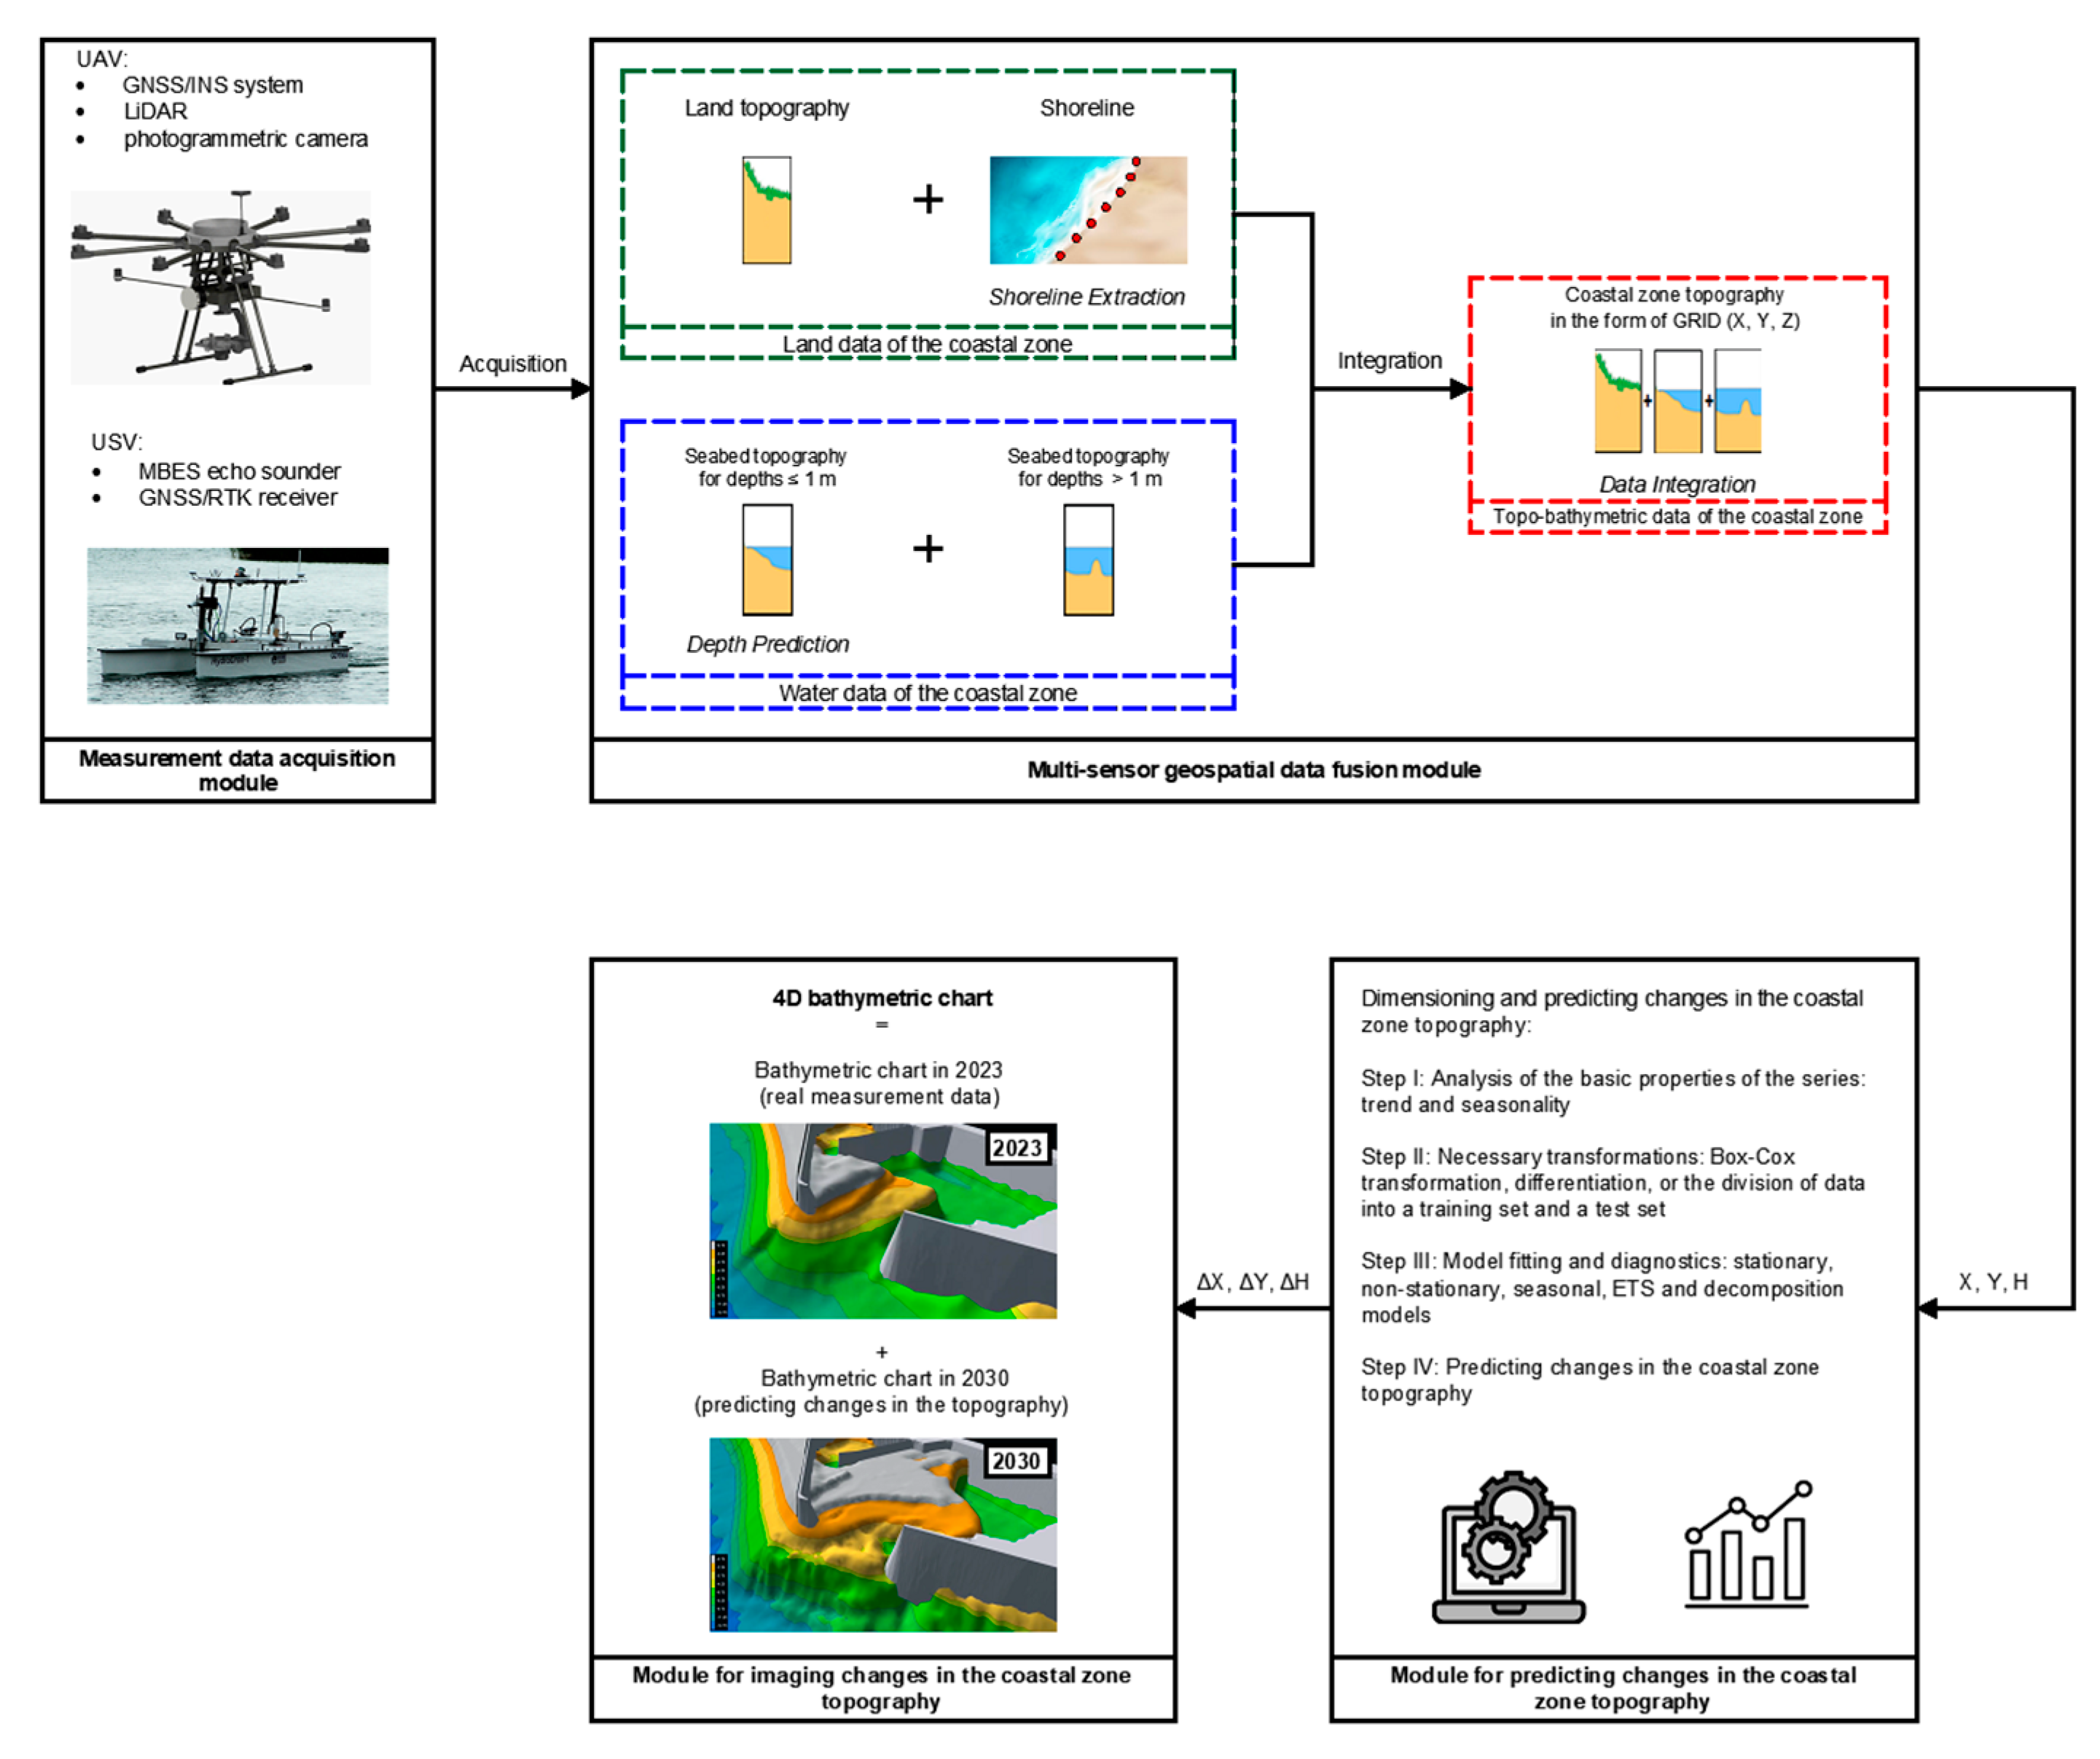
- The 4DBatMap system should be understood as a system that provides a service:
- The performance of bathymetric and photogrammetric surveys with an appropriate frequency using unmanned flying and floating measurement platforms for studying short-term (seasonal) and long-term changes in the coastal zone topography.
- 1
- Measurement data acquisition module. For the purposes of this module, bathymetric and photogrammetric surveys will be carried out with an appropriate frequency (ascertained on the basis of research) to identify short-term (seasonal) and long-term changes in the coastal zone topography. To this end, a UAV with a prototype optoelectronic module comprising a GNSS/INS system, LiDAR and a photogrammetric camera mounted on it, as well as a USV equipped with an MBES and a GNSS/RTK receiver will be used.
- 2
- Multi-sensor geospatial data fusion module. In this module, the geospatial data recorded using autonomous unmanned measurement platforms will be processed. LiDAR data will allow a land area model to be developed. The images taken by the photogrammetric camera will enable the determination of the waterbody shoreline and the determination of the water area depth between its shoreline and the min. isobath recorded by an echo sounder mounted on an unmanned vessel, which is approx. 1 m. The remaining part of the seabed will be surveyed by an integrated hydrographic system (MBES + GNSS/RTK receiver) mounted on the USV. For the processing of geospatial data, three plug-ins for the QGIS software, developed as part of the INNOBAT project implementation, will be used:
- ○
- ○
- “Depth prediction”—a module designed to determine the shallow waterbody depth based on the Structure from Motion (SfM) point cloud using the SVR algorithm [62].
- ○
- “Data integration”—a module designed to integrate hydroacoustic and optoelectronic data using the method proposed by Dąbrowski P.S. et al. [78] and also to use the algorithms designed to model the coastal zone topography.
The final result of this module will be the coastal zone topography, accurate and completely covered with measurements in the form of a regular grid of squares (GRID). It will be generated using the “Data integration” plug-in. - 3
- Module for predicting changes in the coastal zone topography. For the purposes of this module, an analysis of the time series will be carried out in four steps:
- ○
- Step I: Analysis of the basic properties of the series. In this step, the measurement data will be presented as graphs in order to identify long-term tendencies and seasonal fluctuations.
- ○
- Step II: Necessary transformations. Before starting the proper analysis and predicting of time series, the measurement data must be prepared in an appropriate way on the basis of, e.g., Box–Cox transformation, differentiation or the division of data into a training set and a test set.
- ○
- Step III: Model fitting and diagnostics. When analysing time series, the choice of an appropriate mathematical model for the measurement data is of vital importance. To this end, the following models will be used to predict changes in the coastal zone topography: stationary, non-stationary, seasonal, ETS and decomposition models.
- ○
- Step IV: Prediction. The main criterion in selecting the appropriate method for predicting changes in the coastal zone topography will be the accuracy of the forecasts constructed. The statistical measures will enable an assessment of the risk associated with decisions taken based on the selected forecasting methods. Based on these, an optimal method will be then selected to describe the temporal dynamics of the variation in the coastal zone topography.
- 4
- Module for imaging changes in the coastal zone topography. The final result of the 4DBatMap system will be a 4D bathymetric chart to illustrate how the coastal zone topography changes over time. Among other things, it will help in investigating navigability conditions, anchorages, fairways and other usable waterbodies, determining safe depth parameters for fairways in the vicinity of ports, as well as taking proper navigational and hydrographic decisions.
4. Discussion
- A new methodology for carrying out bathymetric and photogrammetric surveys, using unmanned aerial and surface measurement platforms for predicting changes in the coastal zone topography.
- A computer application for predicting changes in the coastal zone topography based on the geospatial data acquired using UAVs and USVs.
- A new method for predicting changes in the coastal zone topography based on the geospatial data acquired using unmanned aerial and surface measurement platforms, which meets the accuracy requirements provided for the IHO Special Order.
5. Conclusions
- Investors in construction projects in port and inland waterbodies.
- Hydrographic companies performing work on waterway sections that are involved in measurement data acquisition.
- Public administration offices, including the Geodetic Bureaus of Marshal’s Offices, Hydrographic Office of the Polish Navy, Maritime Offices, Offices of Inland Navigation, port authorities and the State Water Holding Polish Waters (Regional Water Management Authorities).
- Carrying out hydrographic surveys, investigating navigability conditions, anchorages, fairways and other usable waterbodies, as well as determining safe depth parameters for fairways in the vicinity of ports.
- Surveying the watercourse and waterbody bottom topography. This particularly applies to the Great Masurian Lake district, whose bathymetric charts are based on measurements carried out in the 1950s and 1960s and therefore include outdated and insufficiently detailed data on the water area bottom topography.
- Bathymetric measurements of inland marinas.
- Inventory of the bottom before the commencement and after the completion of dredging and silting works.
- Performance of hydrotechnical works, e.g., the construction of breakwaters and groynes.
- Checking the capacity of waterbodies.
- Regeneration of sea beaches.
- Shore protection and strengthening.
Author Contributions
Funding
Conflicts of Interest
References
- Christ, R.D.; Wernli, R.L. Chapter 17—Navigational Sensors. In The ROV Manual (Second Edition). A User Guide for Remotely Operated Vehicles; Elsevier: Amsterdam, The Netherlands, 2014; pp. 453–475. [Google Scholar]
- NOAA. 3-D Bathymetric Chart Activity: An Introduction to the Nautical Chart. Available online: https://web.archive.org/web/20090509101307/http://channelislands.noaa.gov//edu/pdf/chartlesson.pdf (accessed on 8 August 2023).
- CCOM. Bathymetric Globe. Available online: http://ccom.unh.edu/project/bathymetry-globe (accessed on 8 August 2023).
- Yunus, A.P.; Dou, J.; Song, X.; Avtar, R. Improved Bathymetric Mapping of Coastal and Lake Environments Using Sentinel-2 and Landsat-8 Images. Sensors 2019, 19, 2788. [Google Scholar] [CrossRef] [PubMed]
- Li, Z.; Zhai, J.; Wu, F. Shape Similarity Assessment Method for Coastline Generalization. ISPRS Int. J. Geo-Inf. 2018, 7, 283. [Google Scholar] [CrossRef]
- Mury, A.; Jeanson, M.; Collin, A.; James, D.; Etienne, S. High Resolution Shoreline and Shelly Ridge Monitoring over Stormy Winter Events: A Case Study in the Megatidal Bay of Mont-Saint-Michel (France). J. Mar. Sci. Eng. 2019, 7, 97. [Google Scholar] [CrossRef]
- Mahamud, U.; Takewaka, S. Shoreline Change around a River Delta on the Cox’s Bazar Coast of Bangladesh. J. Mar. Sci. Eng. 2018, 6, 80. [Google Scholar] [CrossRef]
- Fu, Y.; Guo, Q.; Wu, X.; Fang, H.; Pan, Y. Analysis and Prediction of Changes in Coastline Morphology in the Bohai Sea, China, Using Remote Sensing. Sustainability 2017, 9, 900. [Google Scholar] [CrossRef]
- Nikolakopoulos, K.; Kyriou, A.; Koukouvelas, I.; Zygouri, V.; Apostolopoulos, D. Combination of Aerial, Satellite, and UAV Photogrammetry for Mapping the Diachronic Coastline Evolution: The Case of Lefkada Island. ISPRS Int. J. Geo-Inf. 2019, 8, 489. [Google Scholar] [CrossRef]
- Zhang, Y.; Hou, X. Characteristics of Coastline Changes on Southeast Asia Islands from 2000 to 2015. Remote Sens. 2020, 12, 519. [Google Scholar] [CrossRef]
- Kanwal, S.; Ding, X.; Sajjad, M.; Abbas, S. Three Decades of Coastal Changes in Sindh, Pakistan (1989–2018): A Geospatial Assessment. Remote Sens. 2020, 12, 8. [Google Scholar] [CrossRef]
- Chu, Z.X.; Yang, X.H.; Feng, X.L.; Fan, D.J.; Li, Y.K.; Shen, X.; Miao, A.Y. Temporal and Spatial Changes in Coastline Movement of the Yangtze Delta during 1974–2010. J. Asian Earth Sci. 2013, 66, 166–174. [Google Scholar] [CrossRef]
- Cowart, L.; Corbett, D.R.; Walsh, J.P. Shoreline Change along Sheltered Coastlines: Insights from the Neuse River Estuary, NC, USA. Remote Sens. 2011, 3, 1516–1534. [Google Scholar] [CrossRef]
- Kuleli, T.; Guneroglu, A.; Karsli, F.; Dihkan, M. Automatic Detection of Shoreline Change on Coastal Ramsar Wetlands of Turkey. Ocean Eng. 2011, 38, 1141–1149. [Google Scholar] [CrossRef]
- Martínez, C.; Quezada, M.; Rubio, P. Historical Changes in the Shoreline and Littoral Processes on a Headland Bay Beach in Central Chile. Geomorphology 2011, 135, 80–96. [Google Scholar] [CrossRef]
- Pattanshetti, S.S.; Chauhan, O.S.; Sivakholundu, K.M. Quantification of Changes in Seabed Topography with Special Reference to Hansthal Creek, Gulf of Kachchh, India. J. Coast. Res. 1993, 9, 934–943. [Google Scholar]
- Specht, M.; Specht, C.; Lewicka, O.; Makar, A.; Burdziakowski, P.; Dąbrowski, P. Study on the Coastline Evolution in Sopot (2008–2018) Based on Landsat Satellite Imagery. J. Mar. Sci. Eng. 2020, 8, 464. [Google Scholar] [CrossRef]
- Zhang, X.; Pan, D.; Chen, J.; Zhao, J.; Zhu, Q.; Huang, H. Evaluation of Coastline Changes under Human Intervention Using Multi-temporal High-resolution Images: A Case Study of the Zhoushan Islands, China. Remote Sens. 2014, 6, 9930–9950. [Google Scholar] [CrossRef]
- Paull, C.K.; Dallimore, S.R.; Jin, Y.K.; Caress, D.W.; Lundsten, E.; Gwiazda, R.; Anderson, K.; Clarke, J.H.; Youngblut, S.; Melling, H. Rapid Seafloor Changes Associated with the Degradation of Arctic Submarine Permafrost. Proc. Natl. Acad. Sci. USA 2022, 119, e2119105119. [Google Scholar] [CrossRef] [PubMed]
- Specht, M.; Specht, C.; Mindykowski, J.; Dąbrowski, P.; Maśnicki, R.; Makar, A. Geospatial Modeling of the Tombolo Phenomenon in Sopot Using Integrated Geodetic and Hydrographic Measurement Methods. Remote Sens. 2020, 12, 737. [Google Scholar] [CrossRef]
- Wlodarczyk-Sielicka, M.; Stateczny, A. Clustering Bathymetric Data for Electronic Navigational Charts. J. Navig. 2016, 69, 1143–1153. [Google Scholar] [CrossRef]
- Makar, A.; Specht, C.; Specht, M.; Dąbrowski, P.; Burdziakowski, P.; Lewicka, O. Seabed Topography Changes in the Sopot Pier Zone in 2010–2018 Influenced by Tombolo Phenomenon. Sensors 2020, 20, 6061. [Google Scholar] [CrossRef]
- Mohamed, A.S. 2D and 1D Numerical Model Simulations for the Effect of a Single Detached Breakwater on the Shore. MSc Thesis, Delft University of Technology, Delft, The Netherlands, 1997. [Google Scholar]
- Institute of Oceanology of the Polish Academy of Sciences. Conducting Research and Modeling of the Seafloor and Sea Shore Near the Pier in Sopot. Available online: https://bip.umsopot.nv.pl/Download/get/id,32756.html (accessed on 9 June 2019). (In Polish).
- Di Martino, G.; Innangi, S.; Sacchi, M.; Tonielli, R. Seafloor Morphology Changes in the Inner-shelf Area of the Pozzuoli Bay, Eastern Tyrrhenian Sea. Mar. Geophys. Res. 2021, 42, 13. [Google Scholar] [CrossRef]
- Mielck, F.; Hass, H.C.; Michaelis, R.; Sander, L.; Papenmeier, S.; Wiltshire, K.H. Morphological Changes due to Marine Aggregate Extraction for Beach Nourishment in the German Bight (SE North Sea). Geo-Mar. Lett. 2019, 39, 47–58. [Google Scholar] [CrossRef]
- Maritime Office in Gdynia. Monitoring of Sea Shores Based on Data Obtained by LiDAR, Orthophotomap and Transverse Profiles of the Sea Shore. Available online: https://umgdy.ezamawiajacy.pl/pn/umgdy/demand/notice/public/15421/details (accessed on 8 August 2023). (In Polish).
- Drążkiewicz, J.; Golan, M.; Kasprzak, A.; Kiejzik-Głowińska, M.; Klasa, D.; Kowalski, M.; Michniewicz, T.; Nadolny, A.; Pauś, P.; Żochowska, M. Construction of the Waterway Connecting the Vistula Lagoon with the Gdańsk Bay—The Waterway Concept according to the Solution of Consortium Mosty Gdańsk—Projmors (Part 3 B). Mar. Eng. Geotech. 2020, 1, 30–43. (In Polish) [Google Scholar]
- Hydrographic Office of the Polish Navy. Notice to Mariners. Available online: https://bhmw.gov.pl/c/news/pdf/2022/9/WZ_37_2022.pdf (accessed on 8 August 2023). (In Polish)
- IHO. IHO Standards for Hydrographic Surveys, 6th ed.; Special Publication No. 44; IHO: Monaco, Monaco, 2020. [Google Scholar]
- Lane, S.N.; Richards, K.S.; Chandler, J.H. Developments in Monitoring and Modelling Small-scale River Bed Topography. Earth Surf. Process. Landf. 1994, 19, 349–368. [Google Scholar] [CrossRef]
- Westaway, R.M.; Lane, S.N.; Hicks, D.M. Remote Sensing of Clear-water, Shallow, Gravel-bed Rivers Using Digital Photogrammetry. Photogramm. Eng. Remote Sens. 2001, 67, 1271–1282. [Google Scholar]
- Koljonen, S.; Huusko, A.; Mäki-Petäys, A.; Louhi, P.; Muotka, T. Assessing Habitat Suitability for Juvenile Atlantic Salmon in Relation to In-stream Restoration and Discharge Variability. Restor. Ecol. 2012, 21, 344–352. [Google Scholar] [CrossRef]
- Baptista, P.; Bastos, L.; Bernardes, C.; Cunha, T.; Dias, J. Monitoring Sandy Shores Morphologies by DGPS—A Practical Tool to Generate Digital Elevation Models. J. Coast. Res. 2008, 24, 1516–1528. [Google Scholar] [CrossRef]
- Specht, M.; Stateczny, A.; Specht, C.; Widźgowski, S.; Lewicka, O.; Wiśniewska, M. Concept of an Innovative Autonomous Unmanned System for Bathymetric Monitoring of Shallow Waterbodies (INNOBAT System). Energies 2021, 14, 5370. [Google Scholar] [CrossRef]
- Popielarczyk, D.; Templin, T. Application of Integrated GNSS/Hydroacoustic Measurements and GIS Geodatabase Models for Bottom Analysis of Lake Hancza: The Deepest Inland Reservoir in Poland. Pure Appl. Geophys. 2014, 171, 997–1011. [Google Scholar] [CrossRef]
- Specht, C.; Weintrit, A.; Specht, M. Determination of the Territorial Sea Baseline—Aspect of Using Unmanned Hydrographic Vessels. TransNav Int. J. Mar. Navig. Saf. Sea Transp. 2016, 10, 649–654. [Google Scholar] [CrossRef]
- Salameh, E.; Frappart, F.; Almar, R.; Baptista, P.; Heygster, G.; Lubac, B.; Raucoules, D.; Almeida, L.P.; Bergsma, E.W.J.; Capo, S.; et al. Monitoring Beach Topography and Nearshore Bathymetry Using Spaceborne Remote Sensing: A Review. Remote Sens. 2019, 11, 2212. [Google Scholar] [CrossRef]
- Kasvi, A.; Salmela, J.; Lotsari, E.; Kumpula, T.; Lane, S.N. Comparison of Remote Sensing Based Approaches for Mapping Bathymetry of Shallow, Clear Water Rivers. Geomorphology 2019, 33, 180–197. [Google Scholar] [CrossRef]
- Li, J.; Knapp, D.E.; Schill, S.R.; Roelfsema, C.; Phinn, S.; Silman, M.; Mascaro, J.; Asner, G.P. Adaptive Bathymetry Estimation for Shallow Coastal Waters Using Planet Dove satellites. Remote Sens. Environ. 2019, 232, 111302. [Google Scholar] [CrossRef]
- Szafarczyk, A.; Toś, C. The Use of Green Laser in LiDAR Bathymetry: State of the Art and Recent Advancements. Sensors 2023, 23, 292. [Google Scholar] [CrossRef]
- Guo, K.; Li, Q.; Wang, C.; Mao, Q.; Liu, Y.; Zhu, J.; Wu, A. Development of a Single-wavelength Airborne Bathymetric LiDAR: System Design and Data Processing. ISPRS J. Photogramm. Remote Sens. 2022, 185, 62–84. [Google Scholar] [CrossRef]
- Su, D.; Yang, F.; Ma, Y.; Wang, X.H.; Yang, A.; Qi, C. Propagated Uncertainty Models Arising from Device, Environment, and Target for a Small Laser Spot Airborne LiDAR Bathymetry and its Verification in the South China Sea. IEEE Trans. Geosci. Remote Sens. 2020, 58, 3213–3231. [Google Scholar] [CrossRef]
- Gupta, S.G.; Ghonge, M.M.; Jawandhiya, P.M. Review of Unmanned Aircraft System (UAS). Int. J. Adv. Res. Comput. Sci. Eng. Inf. Technol. 2013, 2, 1646–1658. [Google Scholar] [CrossRef]
- Lewicka, O.; Specht, M.; Specht, C. Assessment of the Steering Precision of a UAV along the Flight Profiles Using a GNSS RTK Receiver. Remote Sens. 2022, 14, 6127. [Google Scholar] [CrossRef]
- Burdziakowski, P. Increasing the Geometrical and Interpretation Quality of Unmanned Aerial Vehicle Photogrammetry Products Using Super-resolution Algorithms. Remote Sens. 2020, 12, 810. [Google Scholar] [CrossRef]
- Gonçalves, J.A.; Henriques, R. UAV Photogrammetry for Topographic Monitoring of Coastal Areas. ISPRS J. Photogramm. Remote Sens. 2015, 104, 101–111. [Google Scholar] [CrossRef]
- Hu, Q.; Li, L.; Duan, J.; Gao, M.; Liu, G.; Wang, Z.; Huang, D. Object Detection Algorithm of UAV Aerial Photography Image Based on Anchor-free Algorithms. Electronics 2023, 12, 1339. [Google Scholar] [CrossRef]
- Koukiou, G.; Anastassopoulos, V. UAV Sensors Autonomous Integrity Monitoring—SAIM. Electronics 2023, 12, 746. [Google Scholar] [CrossRef]
- Nex, F.; Remondino, F. UAV for 3D Mapping Applications: A Review. Appl. Geomat. 2014, 6, 1–15. [Google Scholar] [CrossRef]
- Lewicka, O.; Specht, M.; Stateczny, A.; Specht, C.; Dardanelli, G.; Brčić, D.; Szostak, B.; Halicki, A.; Stateczny, M.; Widźgowski, S. Integration Data Model of the Bathymetric Monitoring System for Shallow Waterbodies Using UAV and USV Platforms. Remote Sens. 2022, 14, 4075. [Google Scholar] [CrossRef]
- Specht, M.; Szostak, B.; Lewicka, O.; Stateczny, A.; Specht, C. Method for Determining of Shallow Water Depths Based on Data Recorded by UAV/USV Vehicles and Processed Using the SVR Algorithm. Measurement 2023, 221, 113437. [Google Scholar] [CrossRef]
- Giordano, F.; Mattei, G.; Parente, C.; Peluso, F.; Santamaria, R. MicroVEGA (Micro Vessel for Geodetics Application): A Marine Drone for the Acquisition of Bathymetric Data for GIS Applications. Int. Arch. Photogramm. Remote Sens. Spat. Inf. Sci. 2015, 40, 123–130. [Google Scholar] [CrossRef]
- Kurowski, M.; Thal, J.; Damerius, R.; Korte, H.; Jeinsch, T. Automated Survey in Very Shallow Water Using an Unmanned Surface Vehicle. IFAC Pap. 2019, 52, 146–151. [Google Scholar] [CrossRef]
- Lemieszewski, Ł.; Radomska-Zalas, A.; Perec, A.; Dobryakova, L.; Ochin, E. GNSS and LNSS Positioning of Unmanned Transport Systems: The Brief Classification of Terrorist Attacks on USVs and UUVs. Electronics 2021, 10, 401. [Google Scholar] [CrossRef]
- Liang, J.; Zhang, J.; Ma, Y.; Zhang, C.-Y. Derivation of Bathymetry from High-resolution Optical Satellite Imagery and USV Sounding Data. Mar. Geod. 2017, 40, 466–479. [Google Scholar] [CrossRef]
- Makar, A. Limitations of Multi-GNSS Positioning of USV in Area with High Harbour Infrastructure. Electronics 2023, 12, 697. [Google Scholar] [CrossRef]
- Stateczny, A.; Gronska-Sledz, D.; Motyl, W. Precise Bathymetry as a Step Towards Producing Bathymetric Electronic Navigational Charts for Comparative (Terrain Reference) Navigation. J. Navig. 2019, 72, 1623–1632. [Google Scholar] [CrossRef]
- Stateczny, A.; Kazimierski, W.; Burdziakowski, P.; Motyl, W.; Wisniewska, M. Shore Construction Detection by Automotive Radar for the Needs of Autonomous Surface Vehicle Navigation. ISPRS Int. J. Geo-Inf. 2019, 8, 80. [Google Scholar] [CrossRef]
- Stateczny, A.; Grońska, D.; Motyl, W. Hydrodron—New Step for Professional Hydrography for Restricted Waters. In Proceedings of the 2018 Baltic Geodetic Congress (BGC Geomatics 2018), Olsztyn, Poland, 21–23 June 2018. [Google Scholar]
- Specht, M.; Specht, C.; Wąż, M.; Naus, K.; Grządziel, A.; Iwen, D. Methodology for Performing Territorial Sea Baseline Measurements in Selected Waterbodies of Poland. Appl. Sci. 2019, 9, 3053. [Google Scholar] [CrossRef]
- Agrafiotis, P.; Skarlatos, D.; Georgopoulos, A.; Karantzalos, K. Shallow Water Bathymetry Mapping from UAV Imagery Based on Machine Learning. Int. Arch. Photogramm. Remote Sens. Spat. Inf. Sci. 2019, XLII-2/W10, 9–16. [Google Scholar] [CrossRef]
- Specht, M.; Wiśniewska, M.; Stateczny, A.; Specht, C.; Szostak, B.; Lewicka, O.; Stateczny, M.; Widźgowski, S.; Halicki, A. Analysis of Methods for Determining Shallow Waterbody Depths Based on Images Taken by Unmanned Aerial Vehicles. Sensors 2022, 22, 1844. [Google Scholar] [CrossRef]
- Bertin, S.; Floc’h, F.; Le Dantec, N.; Jaud, M.; Cancouët, R.; Franzetti, M.; Cuq, V.; Prunier, C.; Ammann, J.; Augereau, E.; et al. A Long-term Dataset of Topography and Nearshore Bathymetry at the Macrotidal Pocket Beach of Porsmilin, France. Sci. Data 2022, 9, 79. [Google Scholar] [CrossRef] [PubMed]
- de MF Rocha, R.; Höskuldsson, Á.; Jónsdóttir, I.; Martinez, F.; Hey, R. Bathymetry and Changes on Seafloor Topography of the Southern Reykjanes Ridge (2013 Multibeam Survey—SOEST/HÍ). In Proceedings of the 2017 IEEE/OES Acoustics in Underwater Geosciences Symposium (RIO Acoustics), Rio de Janeiro, Brazil, 25–27 July 2017. [Google Scholar]
- Reins, N.J. Long Term Bathymetry Changes in the Lower Mississippi River due to Variability in Hydrograph and Variable Diversion Schemes. Ph.D. Thesis, University of New Orleans, New Orleans, LA, USA, 2018. [Google Scholar]
- Sakhaee, F.; Khalili, F. Sediment Pattern & Rate of Bathymetric Changes due to Construction of Breakwater Extension at Nowshahr Port. J. Ocean Eng. Sci. 2021, 6, 70–84. [Google Scholar]
- Schweiger, C.; Koldrack, N.; Kaehler, C.; Schuettrumpf, H. Influence of Nearshore Bathymetry Changes on the Numerical Modelling of Dune Erosion. J. Coast. Res. 2020, 36, 545–558. [Google Scholar] [CrossRef]
- Sawczyński, S.; Kaczmarek, L.M. Modeling Bathymetry Changes in the Coastal Zone—State of Knowledge Analysis. Tech. Sci. 2014, 17, 219–233. [Google Scholar]
- Toodesh, R.; Verhagen, S.; Dagla, A. Prediction of Changes in Seafloor Depths Based on Time Series of Bathymetry Observations: Dutch North Sea Case. J. Mar. Sci. Eng. 2021, 9, 931. [Google Scholar] [CrossRef]
- Zagadański, A.; Suchwałko, A. Time Series Analysis and Forecasting. In Practical Introduction Based on the R Environment; Polish Scientific Publishers PWN: Warsaw, Poland, 2016. [Google Scholar]
- Alqahtani, A.; Ali, M.; Xie, X.; Jones, M.W. Deep Time-series Clustering: A Review. Electronics 2021, 10, 3001. [Google Scholar] [CrossRef]
- de Sousa, L.S.; Raude, J.M.; Wambua, R.M.; Mutua, B.M. Bathymetry Changes Caused by Sedimentation in an Unlined Canal of the Chókwè Irrigation Scheme, Mozambique. Irrig. Drain. 2022, 71, 783–803. [Google Scholar] [CrossRef]
- Kim, M.; Lee, S.; Jeong, T. Time Series Prediction Methodology and Ensemble Model Using Real-world Data. Electronics 2023, 12, 2811. [Google Scholar] [CrossRef]
- Monteys, X.; Harris, P.; Caloca, S.; Cahalane, C. Spatial Prediction of Coastal Bathymetry Based on Multispectral Satellite Imagery and Multibeam Data. Remote Sens. 2015, 7, 13782–13806. [Google Scholar] [CrossRef]
- Xu, S.; Ye, N.; Xu, S. A New Method for Shoreline Extraction from Airborne LiDAR Point Clouds. Remote Sens. Lett. 2019, 10, 496–505. [Google Scholar] [CrossRef]
- Farris, A.S.; Weber, K.M.; Doran, K.S.; List, J.H. Comparing Methods Used by the U.S. Geological Survey Coastal and Marine Geology Program for Deriving Shoreline Position from Lidar Data. Available online: https://pubs.usgs.gov/of/2018/1121/ofr20181121.pdf (accessed on 8 August 2023).
- Dąbrowski, P.S.; Specht, C.; Specht, M.; Burdziakowski, P.; Makar, A.; Lewicka, O. Integration of Multi-source Geospatial Data from GNSS Receivers, Terrestrial Laser Scanners, and Unmanned Aerial Vehicles. Can. J. Remote. Sens. 2021, 47, 621–634. [Google Scholar] [CrossRef]
- DHI. MIKE 21/3. Available online: https://www.mikepoweredbydhi.com/products/mike-21-3 (accessed on 8 August 2023).
- Azhary, W.A.H.W.; Awang, N.A.; Hamid, M.R.A. The Assessment of Rip Current at Kerachut Beach Using Hydrodynamic Modelling. IOP Conf. Ser. Mater. Sci. Eng. 2016, 136, 012087. [Google Scholar] [CrossRef]
- Parsapour-moghaddam, P.; Rennie, C.D.; Slaney, J. Hydrodynamic Simulation of an Irregularly Meandering Gravel-bed River: Comparison of MIKE 21 FM and Delft3D Flow models. E3S Web Conf. 2021, 16, 12–24. [Google Scholar] [CrossRef]
- Yan, J.; Chen, M.; Xu, L.; Liu, Q.; Shi, H.; He, N. Mike 21 Model Based Numerical Simulation of the Operation Optimization Scheme of Sedimentation Basin. Coatings 2018, 40, 02004. [Google Scholar] [CrossRef]


Disclaimer/Publisher’s Note: The statements, opinions and data contained in all publications are solely those of the individual author(s) and contributor(s) and not of MDPI and/or the editor(s). MDPI and/or the editor(s) disclaim responsibility for any injury to people or property resulting from any ideas, methods, instructions or products referred to in the content. |
© 2023 by the authors. Licensee MDPI, Basel, Switzerland. This article is an open access article distributed under the terms and conditions of the Creative Commons Attribution (CC BY) license (https://creativecommons.org/licenses/by/4.0/).
Share and Cite
Specht, O.; Specht, M.; Stateczny, A.; Specht, C. Concept of an Innovative System for Dimensioning and Predicting Changes in the Coastal Zone Topography Using UAVs and USVs (4DBatMap System). Electronics 2023, 12, 4112. https://doi.org/10.3390/electronics12194112
Specht O, Specht M, Stateczny A, Specht C. Concept of an Innovative System for Dimensioning and Predicting Changes in the Coastal Zone Topography Using UAVs and USVs (4DBatMap System). Electronics. 2023; 12(19):4112. https://doi.org/10.3390/electronics12194112
Chicago/Turabian StyleSpecht, Oktawia, Mariusz Specht, Andrzej Stateczny, and Cezary Specht. 2023. "Concept of an Innovative System for Dimensioning and Predicting Changes in the Coastal Zone Topography Using UAVs and USVs (4DBatMap System)" Electronics 12, no. 19: 4112. https://doi.org/10.3390/electronics12194112
APA StyleSpecht, O., Specht, M., Stateczny, A., & Specht, C. (2023). Concept of an Innovative System for Dimensioning and Predicting Changes in the Coastal Zone Topography Using UAVs and USVs (4DBatMap System). Electronics, 12(19), 4112. https://doi.org/10.3390/electronics12194112