Article

Evaluation of Charging Methods for Lithium-Ion Batteries

1
Department of Electronic Engineering, National Chin-Yi University of Technology, Taichung 411030, Taiwan
2
Department of Electrical Engineering, National Taiwan University of Science and Technology, Taipei 106335, Taiwan
*
Author to whom correspondence should be addressed.
Electronics 2023, 12(19), 4095; https://doi.org/10.3390/electronics12194095
Submission received: 9 September 2023 / Revised: 26 September 2023 / Accepted: 28 September 2023 / Published: 29 September 2023
(This article belongs to the Special Issue Energy Storage, Analysis and Battery Usage)

Abstract

:
Lithium-ion batteries, due to their high energy and power density characteristics, are suitable for applications such as portable electronic devices, renewable energy systems, and electric vehicles. Since the charging method can impact the performance and cycle life of lithium-ion batteries, the development of high-quality charging strategies is essential. Efficient charging strategies need to possess advantages such as high charging efficiency, low battery temperature rise, short charging times, and an extended battery lifespan. The challenges of charging algorithms encompass battery performance variation, temperature management, charging rate control, battery state estimation, and consideration of diverse charging requirements. Effective charging algorithms must strike a balance within these challenging conditions to ensure the battery’s longevity, high efficiency, and safety. This paper introduces and investigates five charging methods for implementation. These five charging methods include three different constant current–constant voltage charging methods with different cut-off voltage values, the constant loss–constant voltage charging method, and the constant power–constant voltage charging method. This paper will implement and compare the performance of the aforementioned five charging methods, including charging efficiency, battery temperature rise, charging time, and cycle life count, providing experimental data to enable users to choose a charging method more efficiently.

1. Introduction

Lithium-ion batteries possess advantages such as high energy density, long cycle life, and resistance to high current discharges. These features make them suitable for applications requiring prolonged high-energy output, establishing them as the mainstream battery technology widely employed in the market. Various applications such as smartphones, tablets, electronic devices, electric vehicles, and energy storage systems predominantly rely on lithium-ion batteries. With the increasing use of stationary and portable electronic products powered by lithium-ion batteries, charging technology has become exceedingly significant [1,2,3,4]. However, adopting higher charging currents to reduce charging time may potentially introduce concerns for lithium-ion battery safety.
When discussing the relevant charging characteristics of lithium-ion batteries, factors such as temperature rise during charging, charging efficiency, charging time, and cycle life are commonly considered assessment indicators. The objectives of charging methods are centered around shortening charging time, mitigating temperature rise during charging, enhancing charging efficiency, and extending overall battery lifespan [5,6,7,8,9,10,11,12,13,14,15,16,17,18,19,20,21,22,23,24,25]. Currently, there are three main categories of charging methods for lithium-ion batteries: CC-CV charging, pulse current charging, and multi-stage constant current charging. Among these, the most commonly used charging method for electronic products in the market is the constant current–constant voltage (CC-CV) charging method. In the CC-CV charging method, two modes are employed. Initially, the battery is charged using a constant current mode (e.g., 1.0 C). During this phase, the battery voltage begins to rise. Once the battery voltage reaches a fixed upper limit voltage (e.g., 4.2 V), the charging mode switches to constant voltage mode. During the constant voltage mode, the charging current starts to decrease. When the charging current drops to a predefined minimum current value (e.g., 0.05 C), the charging process concludes, indicating the battery is fully charged (e.g., battery state of charge is 100%). While this method is cost-effective, it leads to a significant temperature rise during the constant current mode and results in extended charging time during the constant voltage mode. Therefore, CC-CV charging exhibits issues such as high overall temperature rise, prolonged charging time, low charging rate, and reduced cycle life. To address these issues, [5] proposed the use of a fuzzy controller, where battery open-circuit voltage and charging current parameters are set as fuzzy input membership functions, and the output membership function represents the charging current. This approach can deliver more energy during the constant voltage mode. [6] applied phase-locked loop control, utilizing phase error as a control command and outputting the corresponding charging current to the current source circuit, achieving a charging profile similar to the CC-CV charging method. [7] introduced current pumping charging during the constant current mode. Although it shares a similar charging time with CC-CV charging, this method significantly improves charging efficiency. [8] utilized a grey-predicted Li-ion battery charge system (GP-LBCS) to enhance charging time. [9] established experimental data on the state of charge (SOC) versus C-rate, employed curve fitting to calculate charging currents at different SOC levels, and combined a fuzzy controller to use temperature rise and its rate of change as inputs and the rate of change of charging current as the output. This approach enhances charging efficiency and reduces temperature rise.
For pulse current (PC) charging, to achieve higher charging currents, pulse duty cycle is adjusted during the charging process [10], and pulse frequency is altered [11]. Various charging waveforms are generated by adjusting the magnitude, width, and rest time of the constant current pulses [12,13]. In [14] introduced an equivalent circuit model of lithium-ion batteries and utilized model predictive control (MPC) to achieve adjustable pulse amplitude and width. In [15] employed AC impedance analysis techniques for lithium-ion batteries, aiming to minimize battery impedance frequency to optimize pulse discharge frequency, resulting in improved discharge temperature rise, capacity, and efficiency. In [16] combined optimization techniques with Taguchi orthogonal arrays to maximize charging capacity and efficiency and to minimize charging time and losses in pulse charging parameters.
The multi-stage constant current (MSCC) charging method involves using multiple constant current levels of varying magnitudes to charge the battery. This approach offers advantages such as increased cycle life, high charging efficiency, and shorter charging times. Several studies [13,14,15,16,17,18,19,20] have proposed the use of soft computing or experimental design techniques to search for an optimal charging profile (OCP) for MSCC charging. Soft computing methods include Taguchi orthogonal arrays [17], the Taguchi method [18,19], optimization algorithms [20,21], etc. However, the aforementioned methods often require significant experimental efforts to identify the OCP and do not guarantee to charge the battery to 100% SOC. To optimize charging time, [22] introduced a formula-based approach to calculate the current values for each stage of the MSCC charging method. To achieve 100% SOC, integer linear programming (ILP) was employed to search for the OCP of MSCC, followed by a constant voltage charging phase. While this method achieves full SOC, it does not significantly improve charging time or efficiency [23]. In [24], by incorporating internal parameters of the battery’s equivalent circuit model, the battery capacity can be charged to over 99% of the traditional CC-CV charging method. This method adopts SOC as a switching criterion for MSCC and utilizes the Taguchi method to determine optimized current values for each stage [25]. It is worth noting that the field of battery charging optimization is complex and involves various trade-offs between factors such as charging time, efficiency, and battery health. The mentioned approaches demonstrate diverse strategies to address these challenges and improve the performance of the charging process for lithium-ion batteries.
The charging methods for lithium-ion batteries must take into account factors such as temperature rise, charging time, and cycle life. The practical applicability of many optimization algorithms for battery charging in real-world scenarios is often limited. Moreover, the pursuit of rapid charging by increasing charging current to shorten charging time has raised safety concerns due to elevated battery surface temperatures during the charging process. This study is based on the battery model proposed in [26] and combines traditional CC-CV charging to determine the transition voltage values during the constant current mode, considering battery charging losses. Since the battery’s equivalent impedance changes with remaining capacity, the study employs AC impedance analysis to establish an equivalent battery model. This allows for adjusting the transition voltage and current during the first stage of charging, reducing temperature rise and charging time. Unlike the sophisticated computational charging methods mentioned earlier, the proposed approach in this study involves simple mathematical calculations. Subsequently, the study compares and analyzes five charging methods: three variations of CC-CV charging with different transition voltage values, constant loss–constant voltage (CL-CV) charging, and constant power–constant voltage (CP-CV) charging. In addition to charging experiments for each method. The study also conducts cycle life tests for each charging method. This provides insights into the strengths of each charging method, their suitability for different applications, and a comparative analysis of their benefits.

2. Lithium-Ion Battery Model

With an accurate lithium-ion battery model, the design process can aid in the development of more effective charging methods. This can lead to improvements in charging time, temperature rise during charging, and overall battery lifespan extension. Battery models can be categorized into three types: physical models, empirical models, and abstract models [26]. The comparative indicators for these three types of models are based on accuracy, complexity, and physical interpretability. Accuracy represents the extent to which a model closely approximates the parameters or variables of battery predictions. Complexity indicates the number of parameters required by the model. Depending on the complexity, computation time can vary, impacting the model’s suitability for real-time applications. Physical interpretability pertains to the insights the model provides, with higher physical interpretability being useful for analyzing the battery’s internal physical characteristics. The following section provides an introduction to lithium-ion battery models.

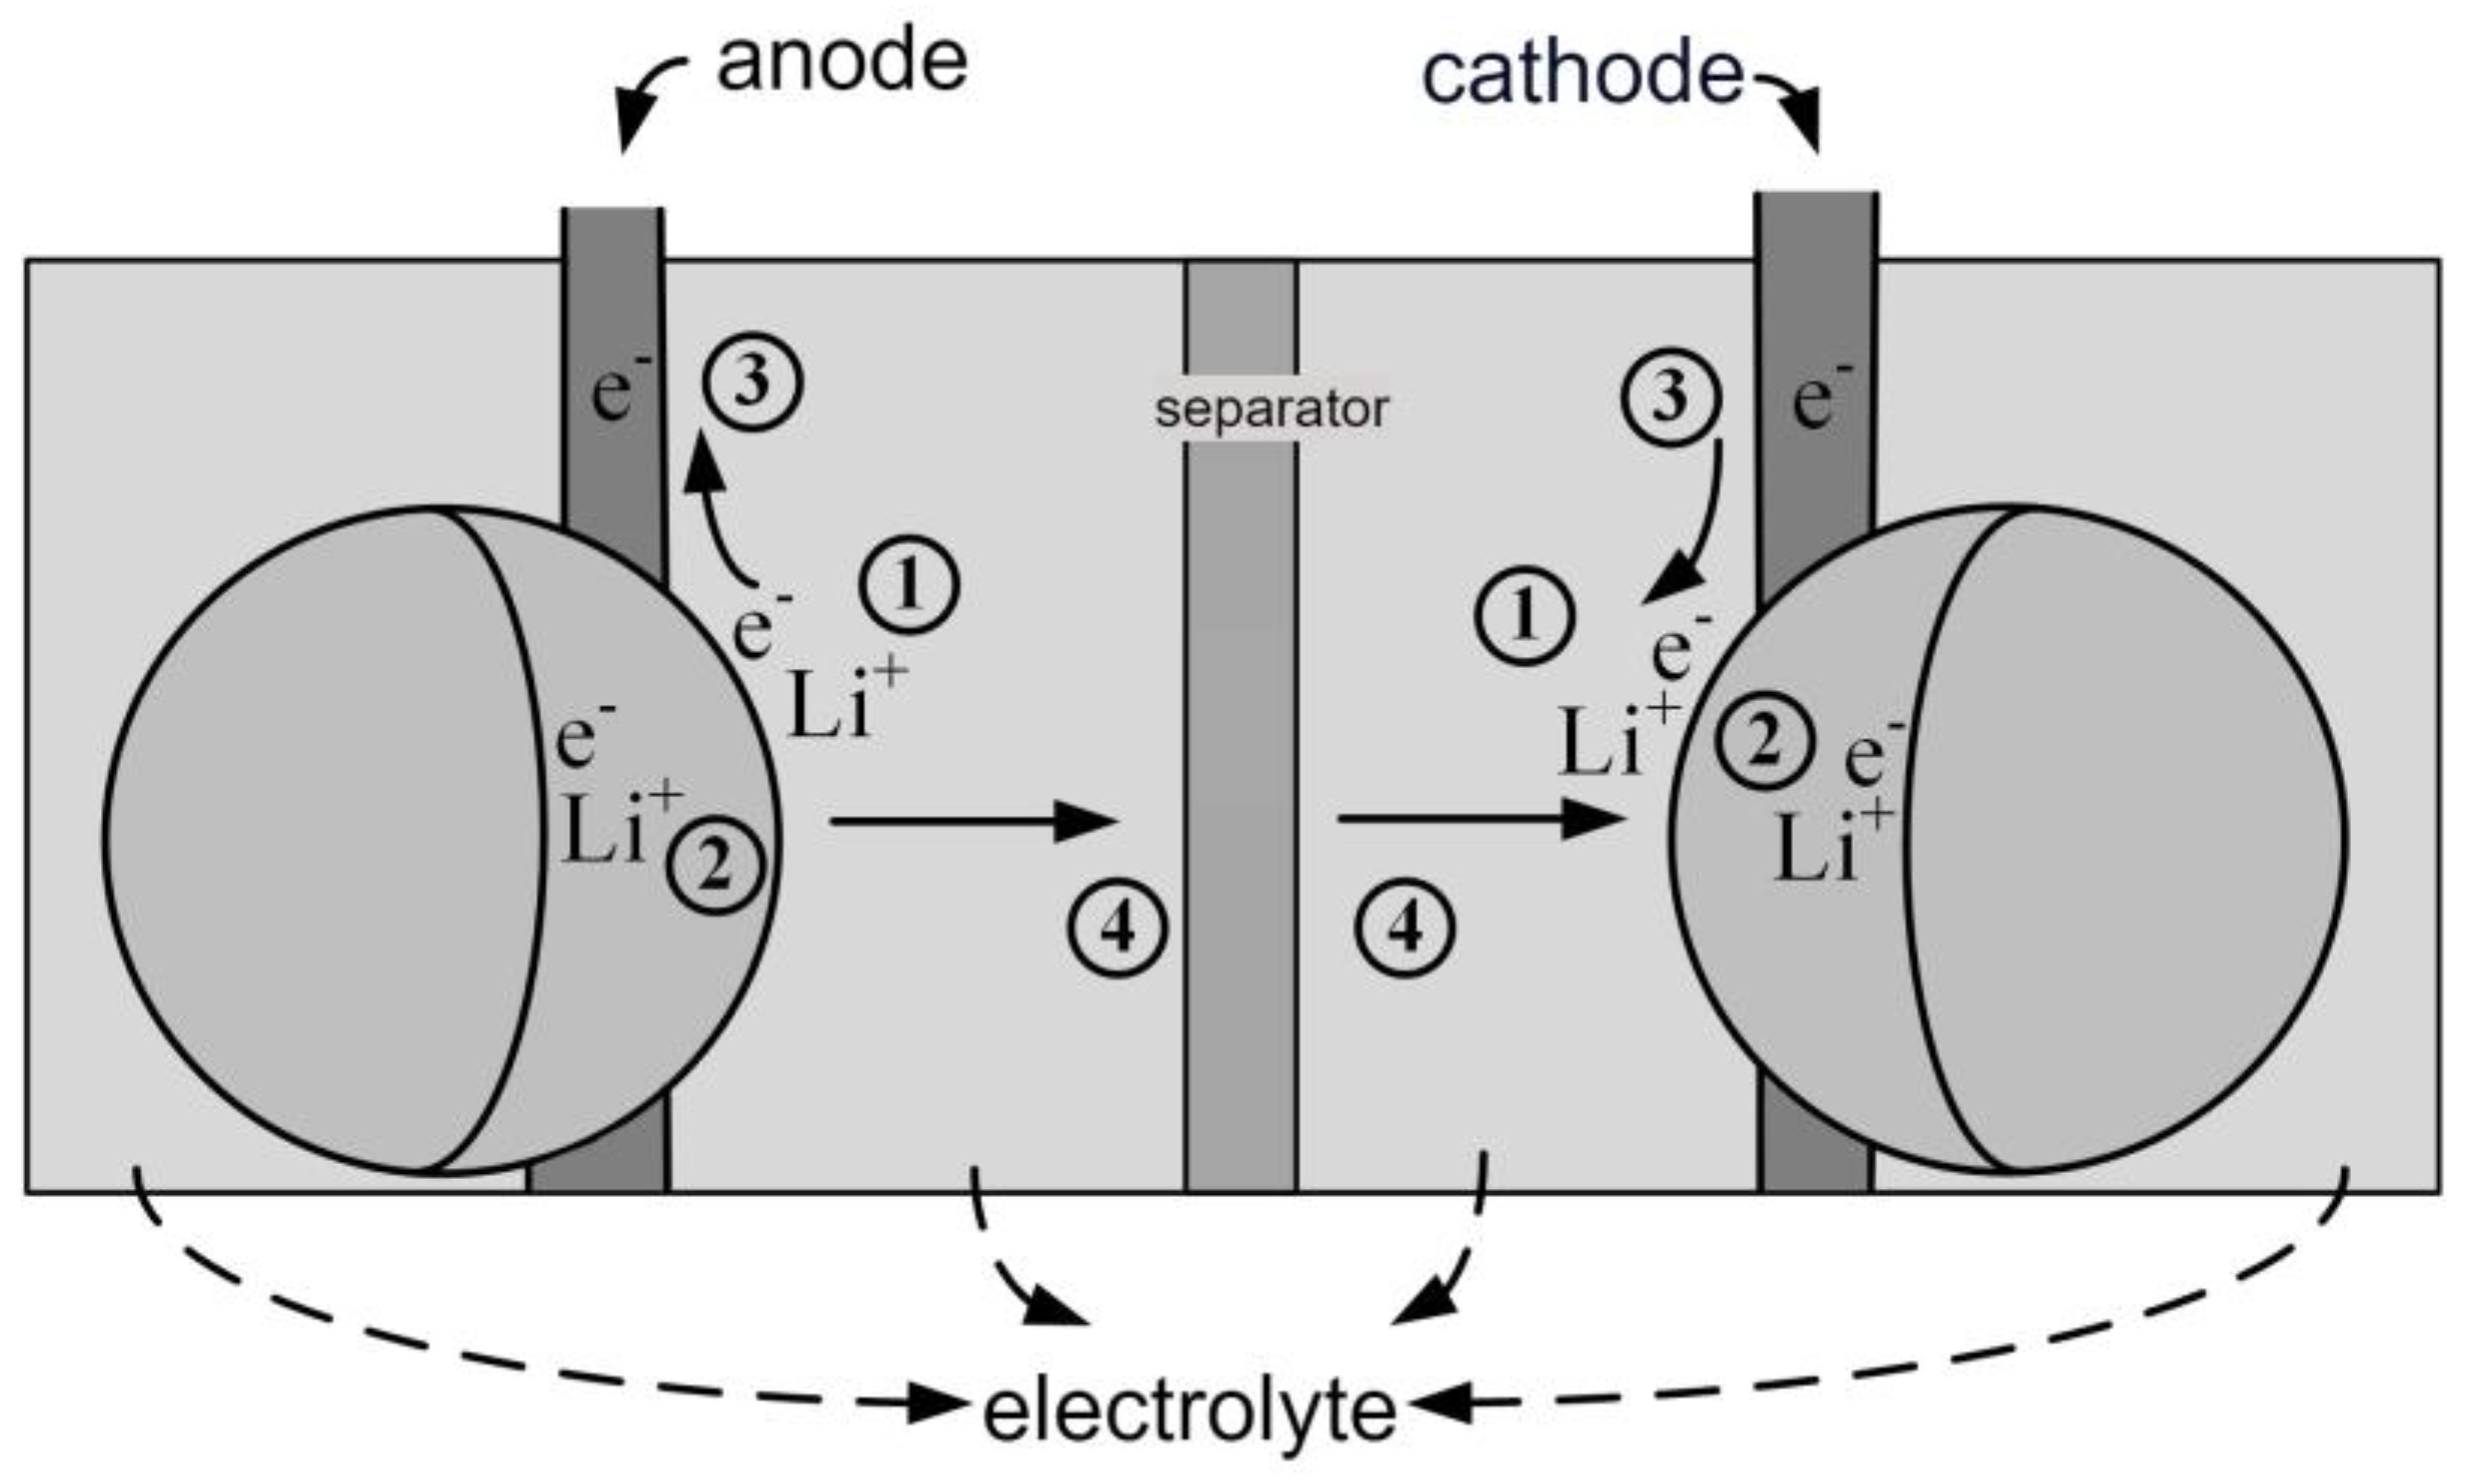
2.1. Physical Models [26]

The physical model, also referred to as a white box model, is characterized by being detailed yet highly accurate. It can describe the material structure, electrochemical phenomena, thermodynamics, material kinetics, and transport phenomena of lithium batteries. Figure 1 illustrates the internal physical processes of a lithium-ion battery, which can be divided into four processes:
The first process (marked as in Figure 1) describes the movement of lithium ions due to charge removal or insertion into the active material. The second process (marked as in Figure 1) involves the solid-state diffusion of lithium ions driven by concentration gradients between the electrode surface and the bulk. The third process (marked as in Figure 1) represents the electronic conduction from one electrode to another through the external circuit. The fourth process (marked as in Figure 1) involves the conduction of ions through the electrolyte due to concentration gradients, facilitated by the separator. This physical model requires a significant number of parameters and has high complexity, contributing to increased time costs.
The single particle model (SPM) focuses on modeling the behavior of a single active particle within the battery, considering diffusion and reaction processes. It offers high-resolution insights into particle-level behavior but is computationally intensive. The psuedo 2D (P2D), or Doyle–Fuller–Newman (FDN) model is a comprehensive electrochemical model that describes battery behavior in detail, accounting for electrochemical reactions, diffusion, and spatial effects. It is highly accurate but computationally demanding. The equivalent circuit model is often preferred for BMS because it offers a good trade-off between simplicity and computational efficiency, allowing for real-time battery state estimation and control. While other models like the SPM or P2D model are valuable for research and development purposes, they are usually not used in real-time BMS systems due to their computational demands.

2.2. Empirical Models

Empirical models, also known as black box models, lack insights into the underlying system. These models sometimes use parameters that lack physical significance. However, they provide transfer functions from input to output that make model configuration easier and lead to faster response and prediction. When models are kept simple, their accuracy can be limited. Combining them with lower-level models can enhance accuracy and provide better physical insights [26]. In Figure 2, the inputs and outputs of both models, as well as the associated coupling, are illustrated. The electrothermal model assesses the state of charge (SOC), voltage (Vcell), and temperature (Tcell) of the battery, utilizing input current (Iinput) and external temperature (Texternal). It subsequently supplies the empirical aging model with SOC and Tcell data, enabling the evaluation of residual capacity, denoted as Cresidual [27].

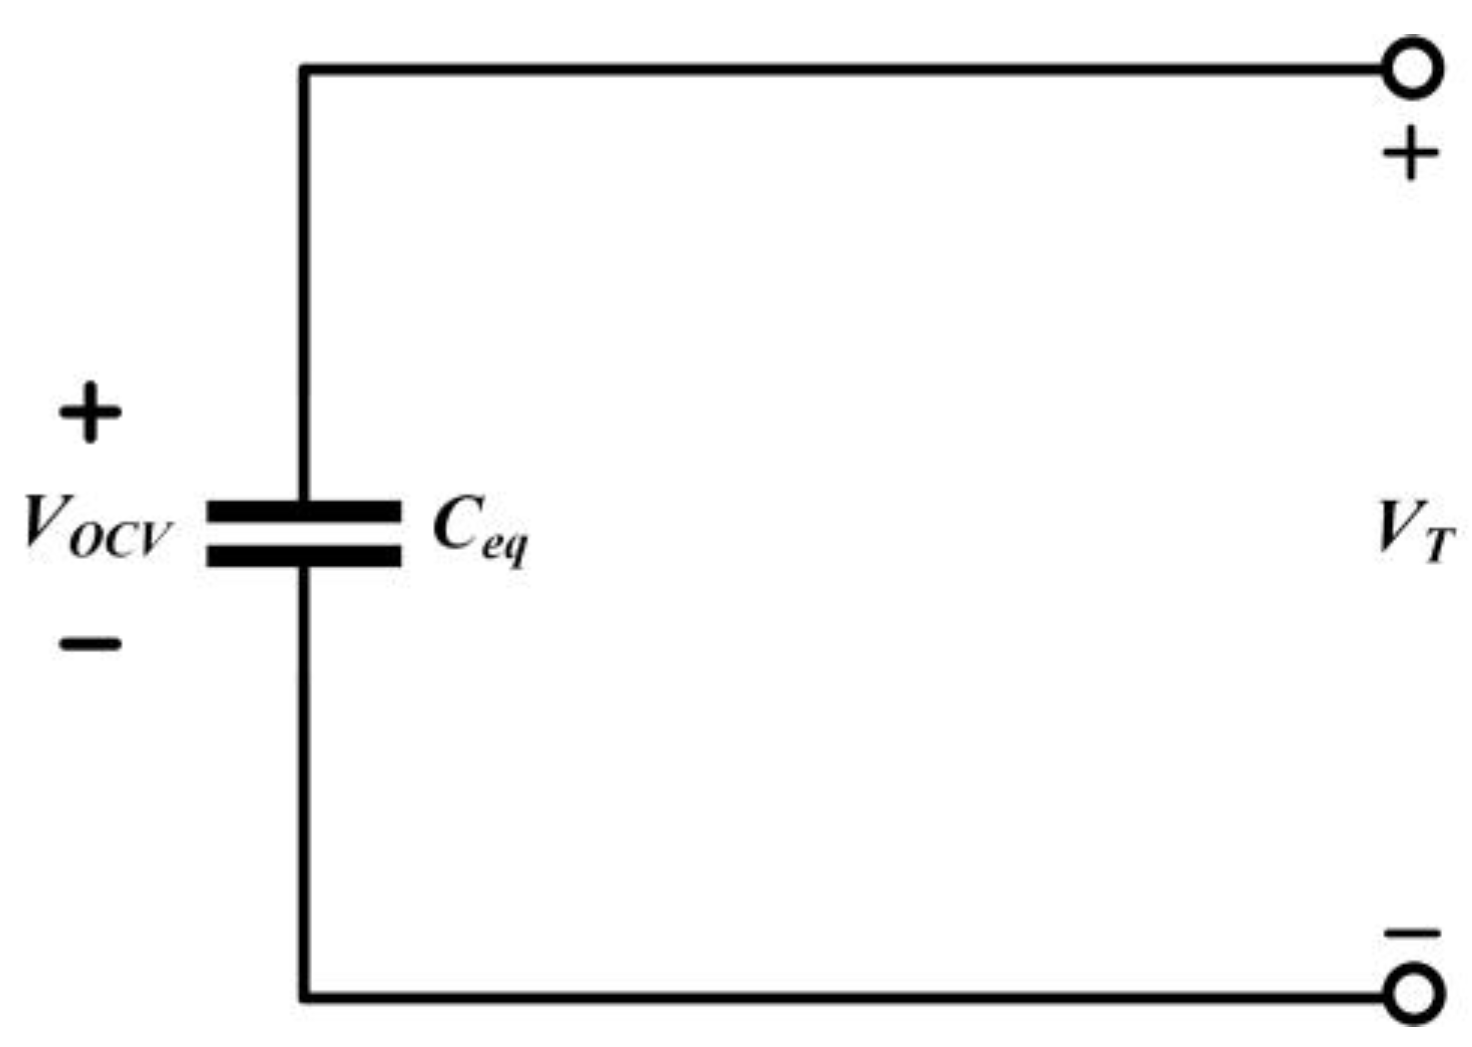
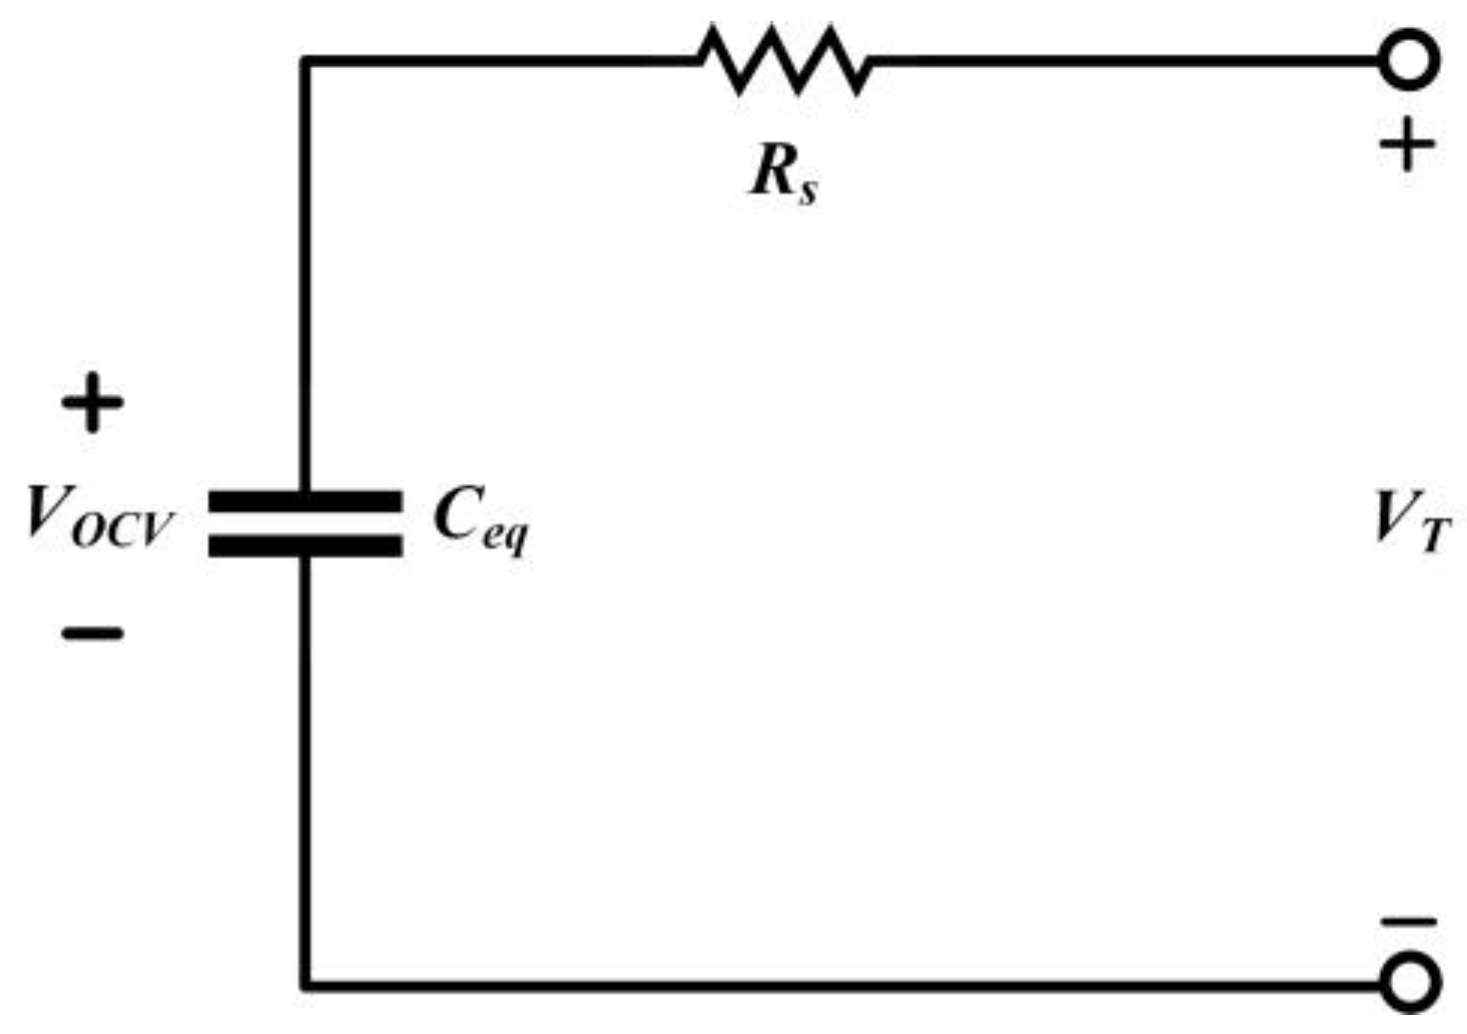
2.3. Abstract Models

Abstract models, also known as grey box models, offer alternative representations that provide physical meaning. For applications involving lithium-ion batteries, the equivalent circuit model is the most popular choice. Circuit-based models are simple and practical because they allow the use of simplified circuits to replace complex electrochemical processes. This retains relevance to battery dynamics without compromising accuracy. Compared to lower-level models, abstract models require lower configuration costs, and their complexity depends on computational units and memory resources. While they are more complex, they can also more accurately consider effects like temperature, aging, and capacity decay. The following section introduces commonly used equivalent circuit models [26]. The ideal equivalent circuit, as shown in Figure 3, considers the battery as a stable voltage source, where VOCV represents the open-circuit voltage of the battery and VT represents the terminal voltage. However, since this model does not account for factors like internal resistance and transient response, it fails to reflect the actual characteristics of the battery.
If not considering the battery’s dynamic response, the linear battery equivalent circuit can represent the static behavior of the battery system, as depicted in Figure 4. In this model, the battery is viewed as a stable voltage source in series with an equivalent resistor. Here, VOCV represents the open-circuit voltage of the battery, VT is the terminal voltage, and Rs is the Ohmic resistance, representing the battery’s internal resistance. Rs accounts for the losses incurred as the current passes through connectors, electrodes, electrolytes, etc. The open-circuit voltage VOCV and the internal resistance Rs are functions of internal electrochemical reaction changes. The internal resistance can be further divided into a constant internal resistance and a functional internal resistance. While the functional internal resistance might be more complex, it offers higher accuracy compared to the constant internal resistance. This is because the actual internal resistance of the battery varies with its internal electrochemical reactions. Therefore, using a functional internal resistance to establish an equivalent circuit model can yield better performance.
When considering the dynamic response of the battery, Thevenin’s battery equivalent circuit is commonly used, as shown in Figure 5. In this model, the battery is represented as a stable voltage source VOCV in series with an Ohmic resistor Rs and parallel with a capacitor Cp and a resistor Rp. Here, VOCV is the open-circuit voltage of the battery, VT is the terminal voltage, Rs is the Ohmic resistance, and Rp and Cp represent the charge transfer and diffusion processes between the electrode and electrolyte. Through Rp and Cp, the dynamic response of the battery is simulated, aiming to make the charging and discharging behavior of the battery approach real-world conditions as closely as possible.
The accuracy and complexity of these models needs to be balanced. Simpler models are less susceptible to uncertain factors, while complex models require more time for evaluation. A comparison of lithium-ion battery models for reference, is shown in Table 1. Due to the extensive parameter requirements of physical models and the limited insights of empirical models, the charging method evaluated in this study adopts the equivalent circuit model from the abstract models as the representation of the lithium-ion battery.

2.4. The Determination of Abstract Model Parameters for Lithium-Ion Batteries

The implemented charging algorithm in this paper utilizes the equivalent circuit model from the abstract models of lithium-ion batteries. As such, this section introduces the AC impedance analysis of lithium-ion batteries. This analysis method allows the battery’s equivalent impedance under different conditions to be obtained.

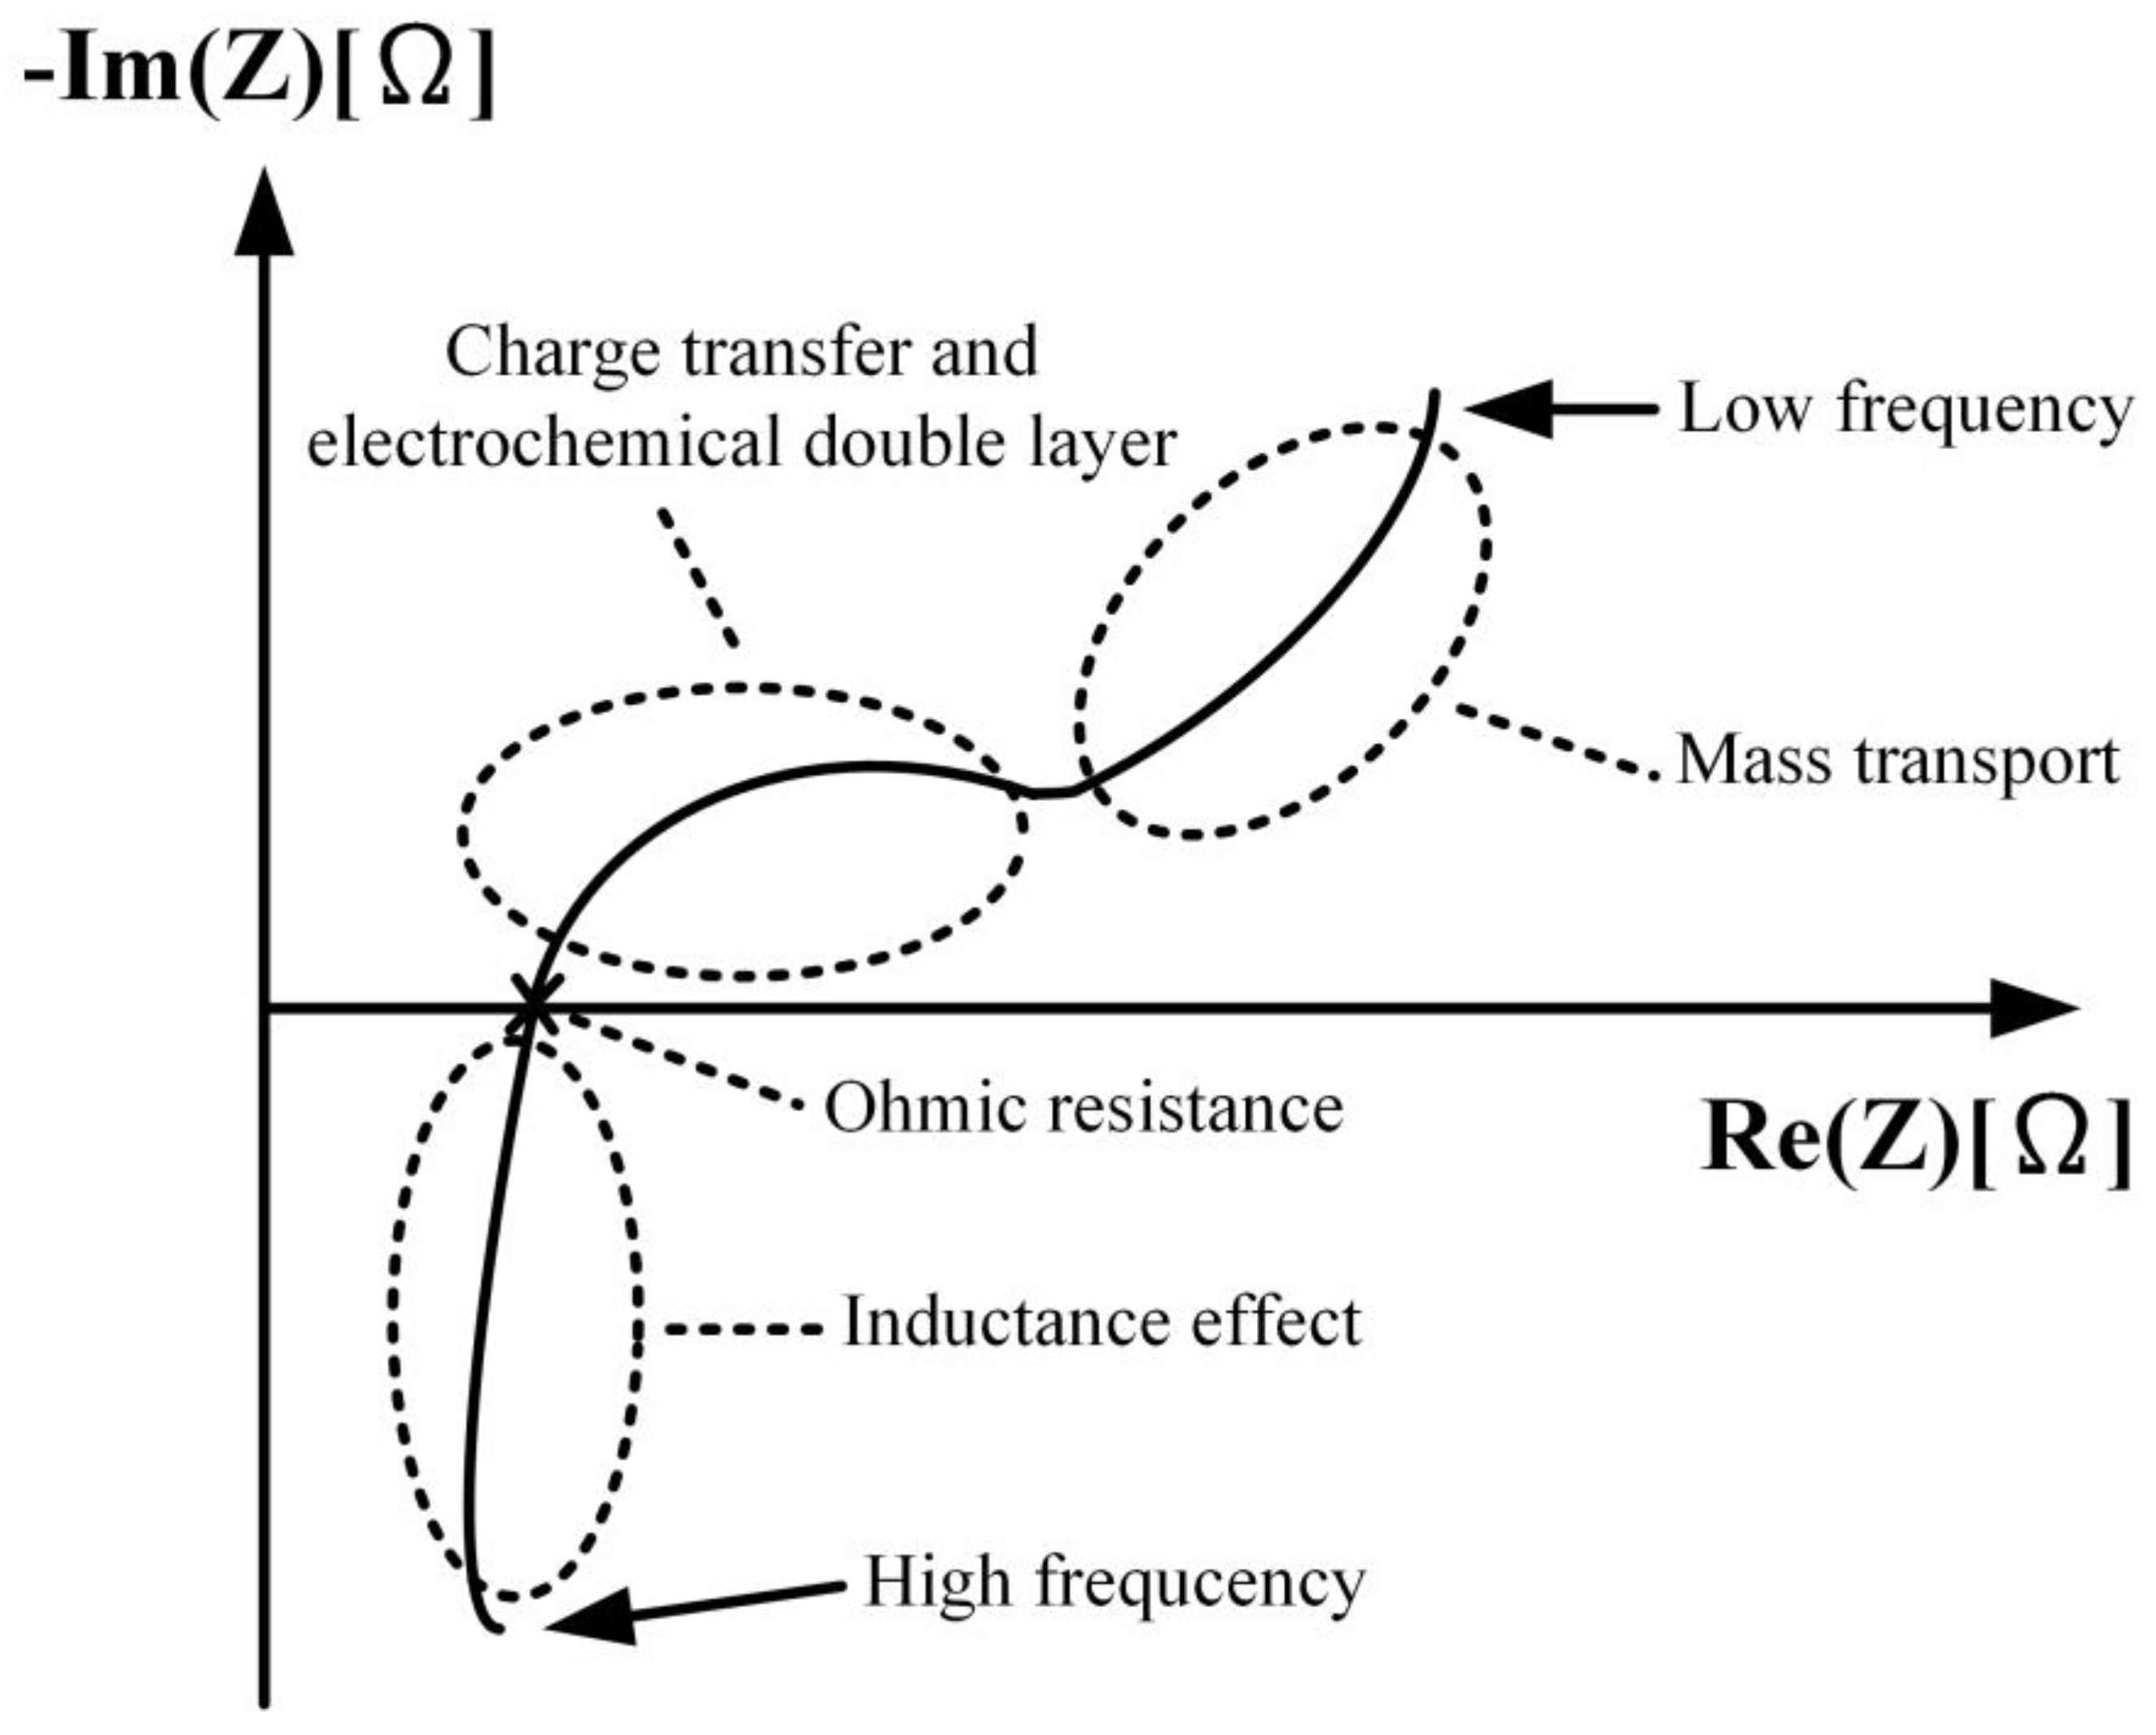
2.4.1. Introduction to AC Impedance Analysis

AC impedance analysis involves applying small-amplitude AC sinusoidal voltage or current perturbations to the positive and negative terminals of a battery. The resulting data, including current, voltage, and frequency, are used to calculate AC impedance values. These values are then used to simulate an equivalent circuit and calculate its corresponding parameters. By varying the input AC frequency, changes in the responses of the real-axis impedance and imaginar y-axis impedance can be obtained, resulting in an electrochemical impedance spectrum (EIS) or Nyquist plot. The internal components of the battery as revealed by the Nyquist plot analysis are similar to response plots composed of the three basic components: resistance, inductance, and capacitance. The system’s response varies according to the perturbation frequency. Figure 6 illustrates a conceptual Nyquist plot depicting the impedance effects within a battery.

2.4.2. AC Impedance Analysis with Open-Circuit Potential Detection

When measuring AC impedance, it is necessary to apply AC sinusoidal voltage or current perturbations to the battery electrodes. Let us discuss potentiostatic electrochemistry impedance spectroscopy (PEIS), which is a method used in AC impedance analysis. In PEIS, a frequency-sweeping AC voltage signal is generated by an AC impedance analyzer and applied to the battery as an active perturbation. This process is repeated for all set perturbation frequencies. During the active potential perturbation, the battery generates a corresponding current variation. By detecting this current, the amplitude and phase angle of the battery current can be determined. Using this current parameter, the signal is adjusted and transformed, and impedance and phase angle differences are calculated. After completing measurements for all frequency responses, the AC impedance parameters are analyzed. The flowchart of the AC impedance analysis process is illustrated in Figure 7.

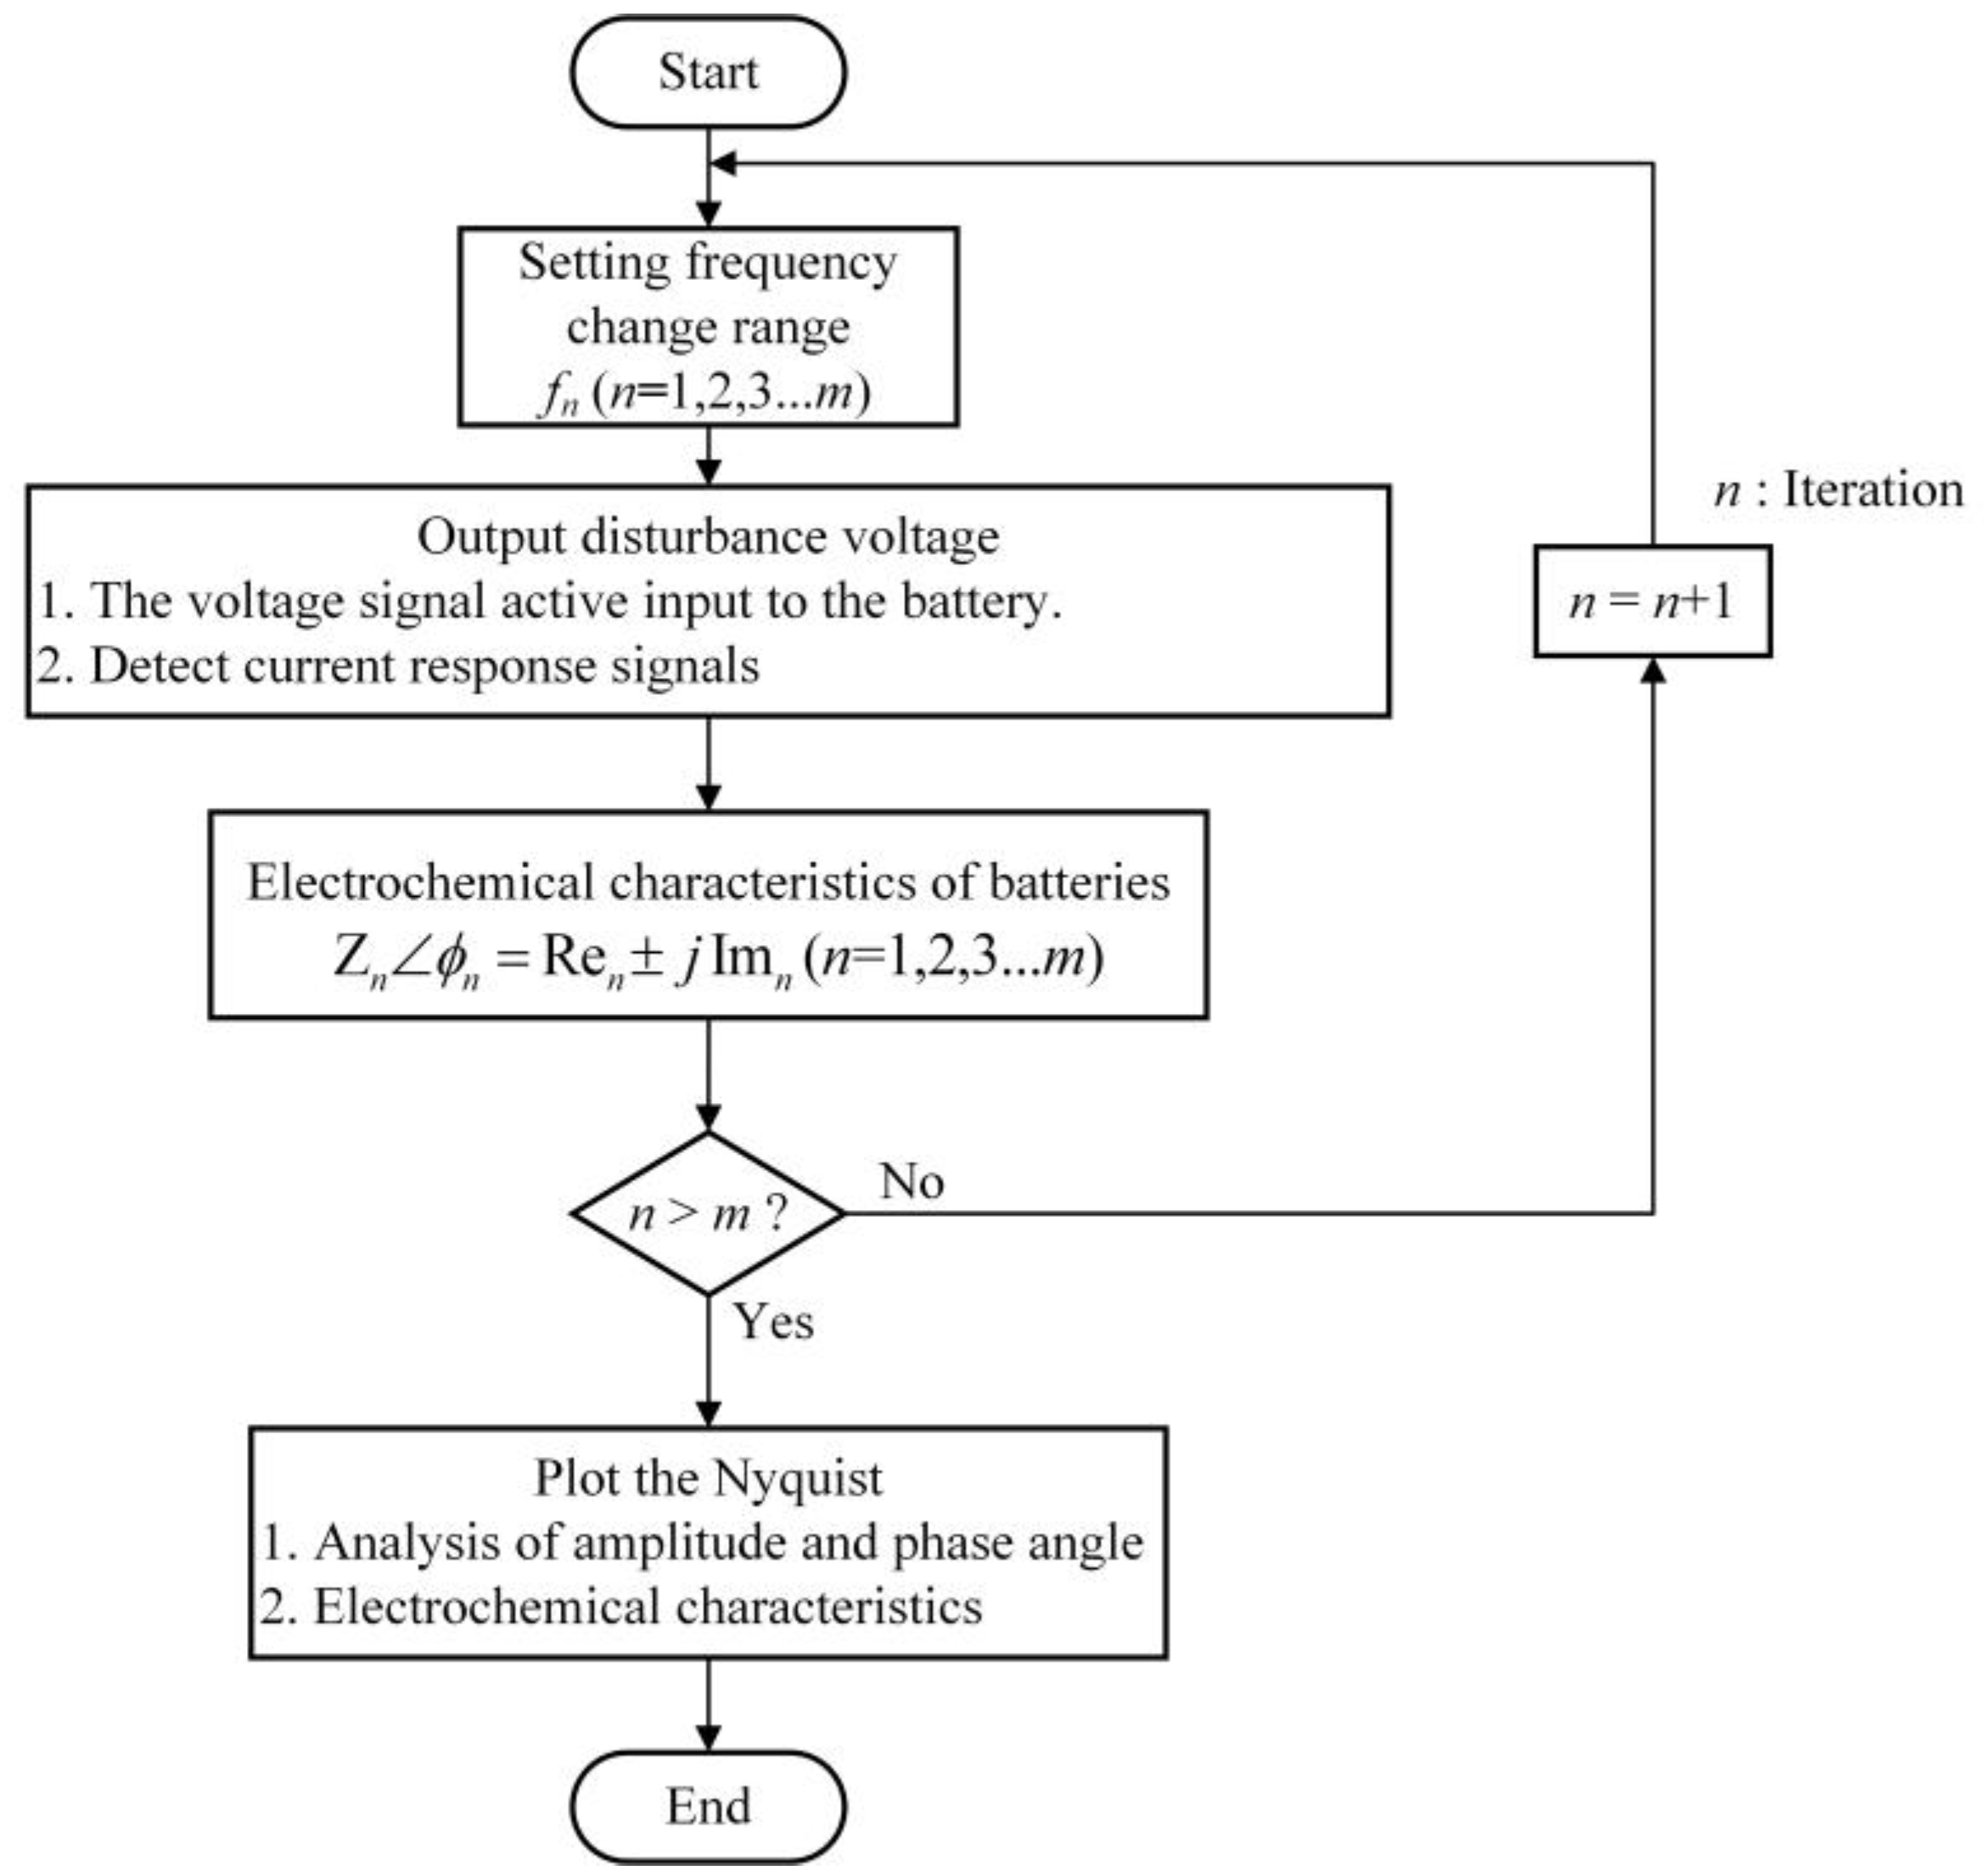
2.4.3. Experimental Design for AC Impedance Analysis

This section introduces the AC impedance analyzer and experimental procedure used in the study. For AC impedance analysis, the Bio-Logic VSP-300 modular potentiostat is selected, along with the EC-Lab software interface, for battery analysis and experimentation. There is a proportional relationship between the battery’s remaining capacity and the magnitude of its AC impedance. During experimentation, a trade-off needs to be made between the accuracy of the battery’s remaining capacity and the time required for the experiment. Thus, the paper chooses to conduct measurements at 1% intervals of the battery’s state of charge. Figure 8 illustrates the flowchart of the AC impedance analysis process.

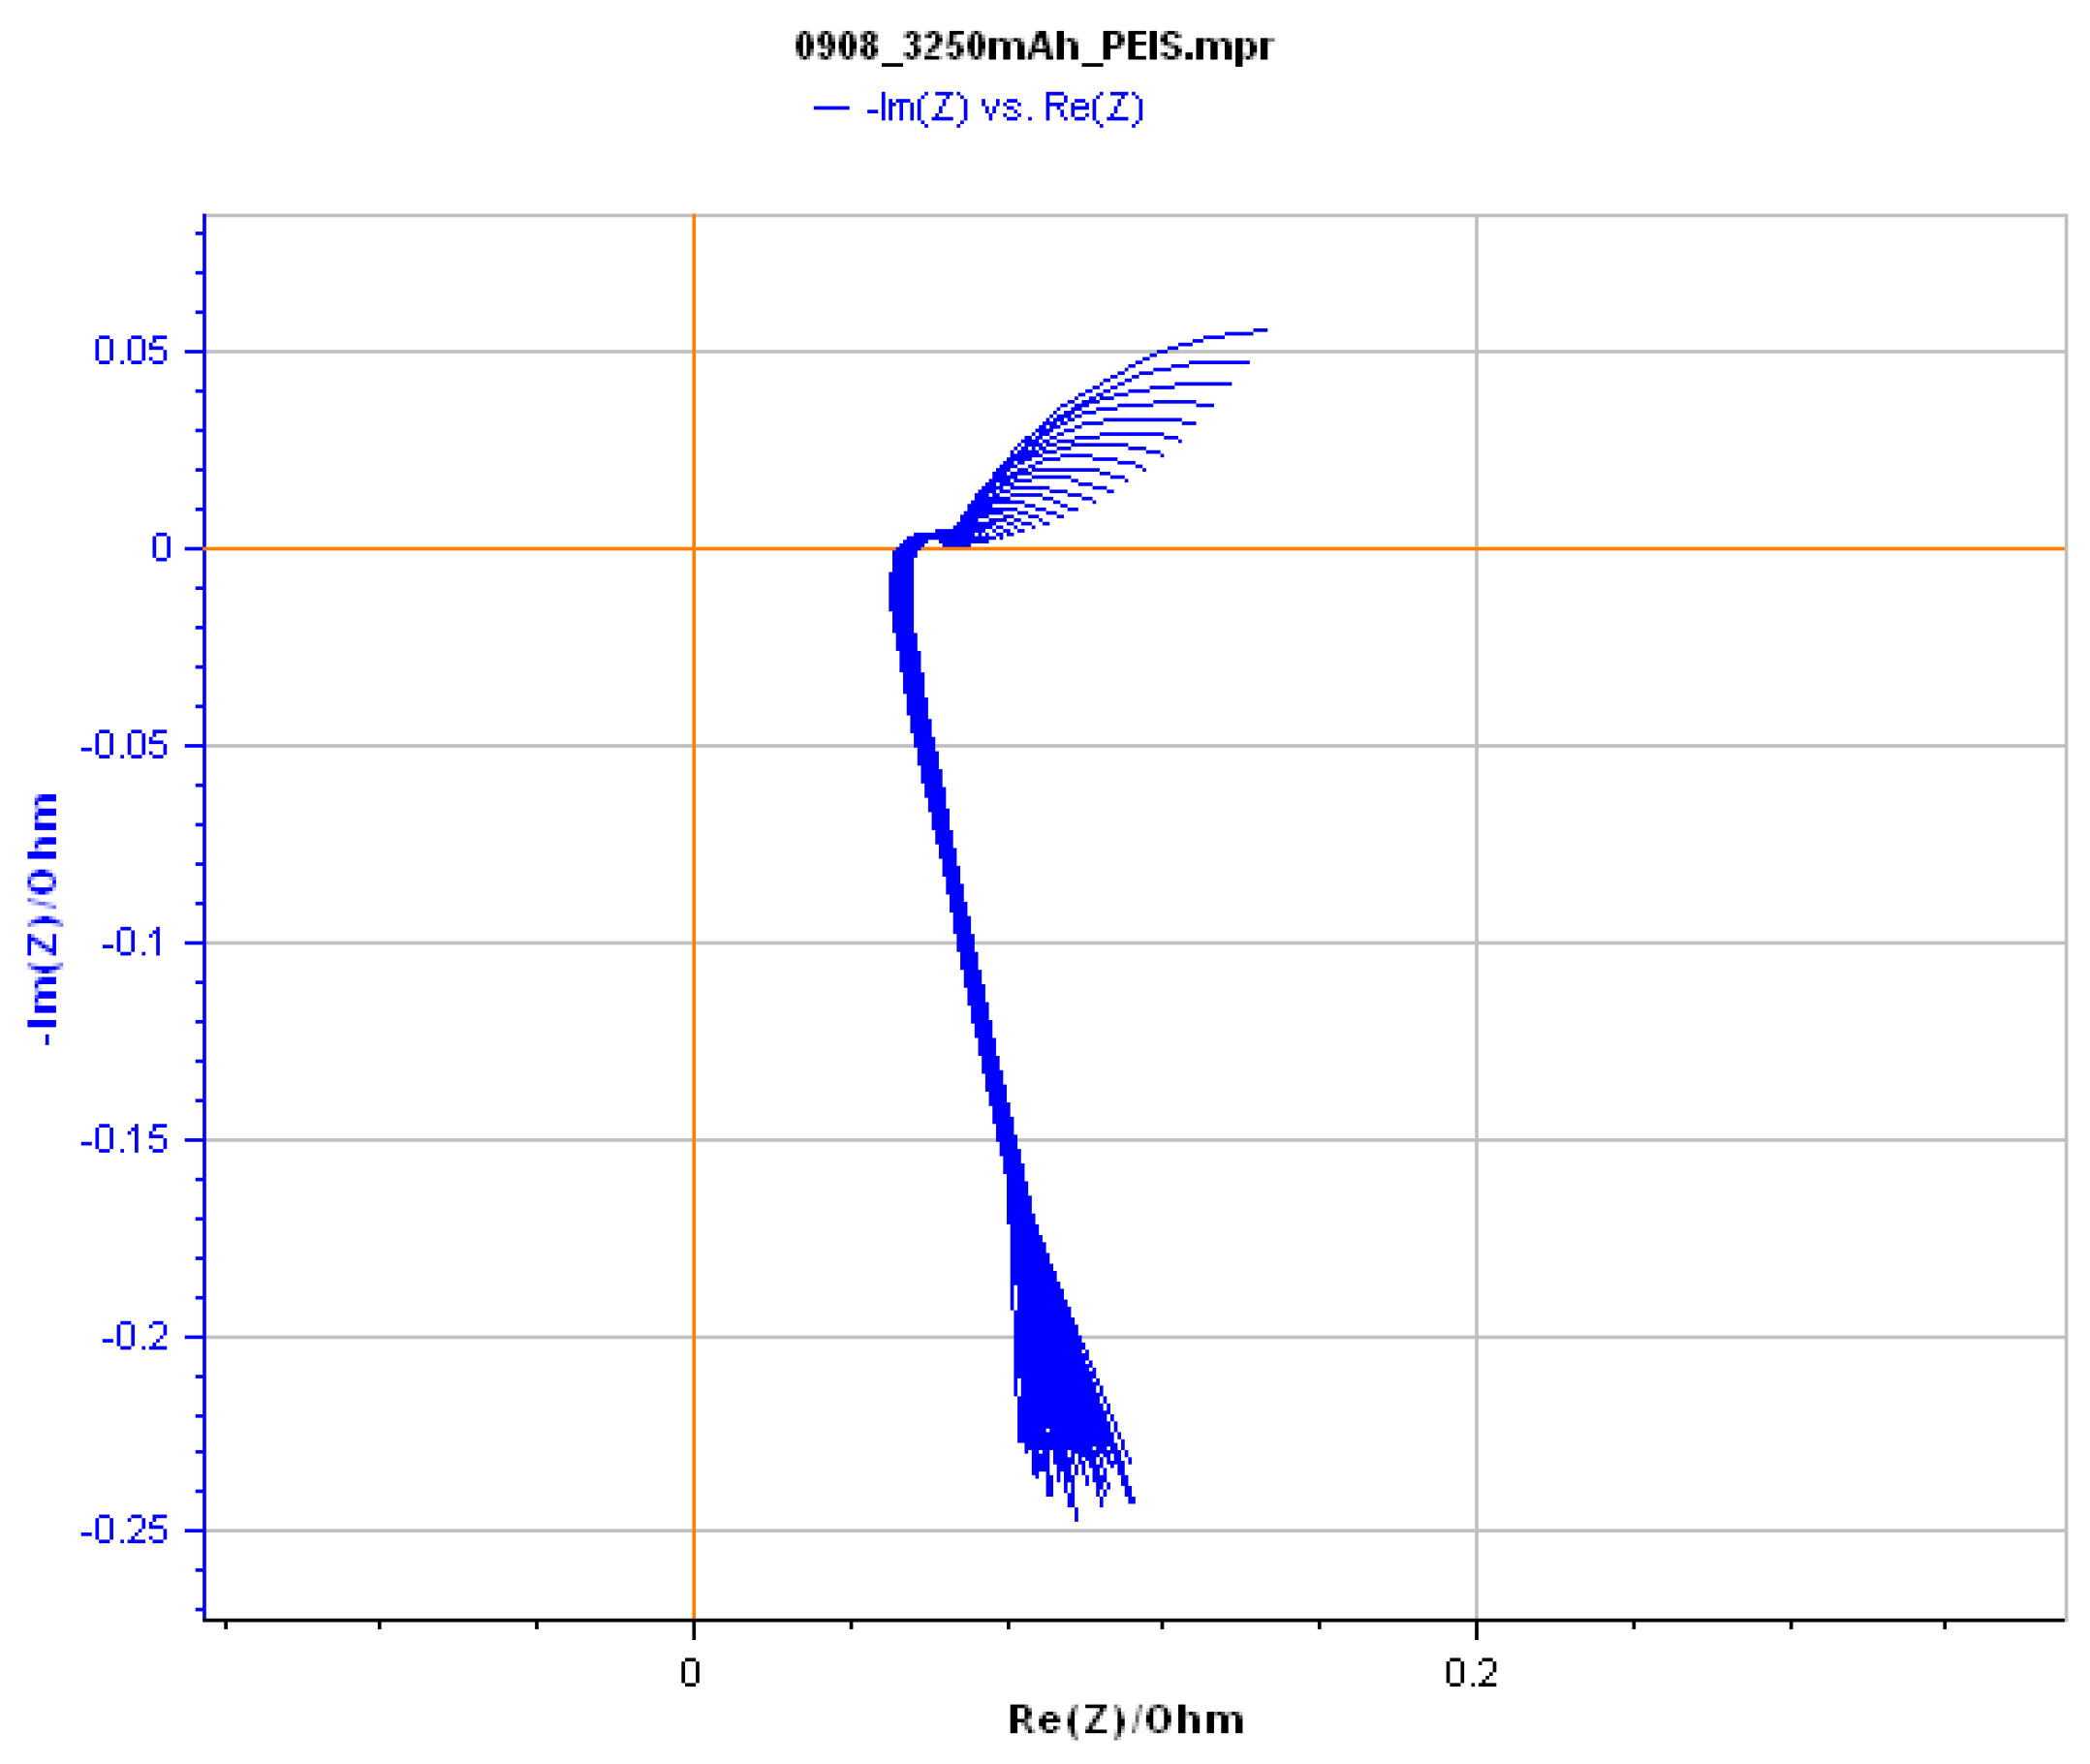
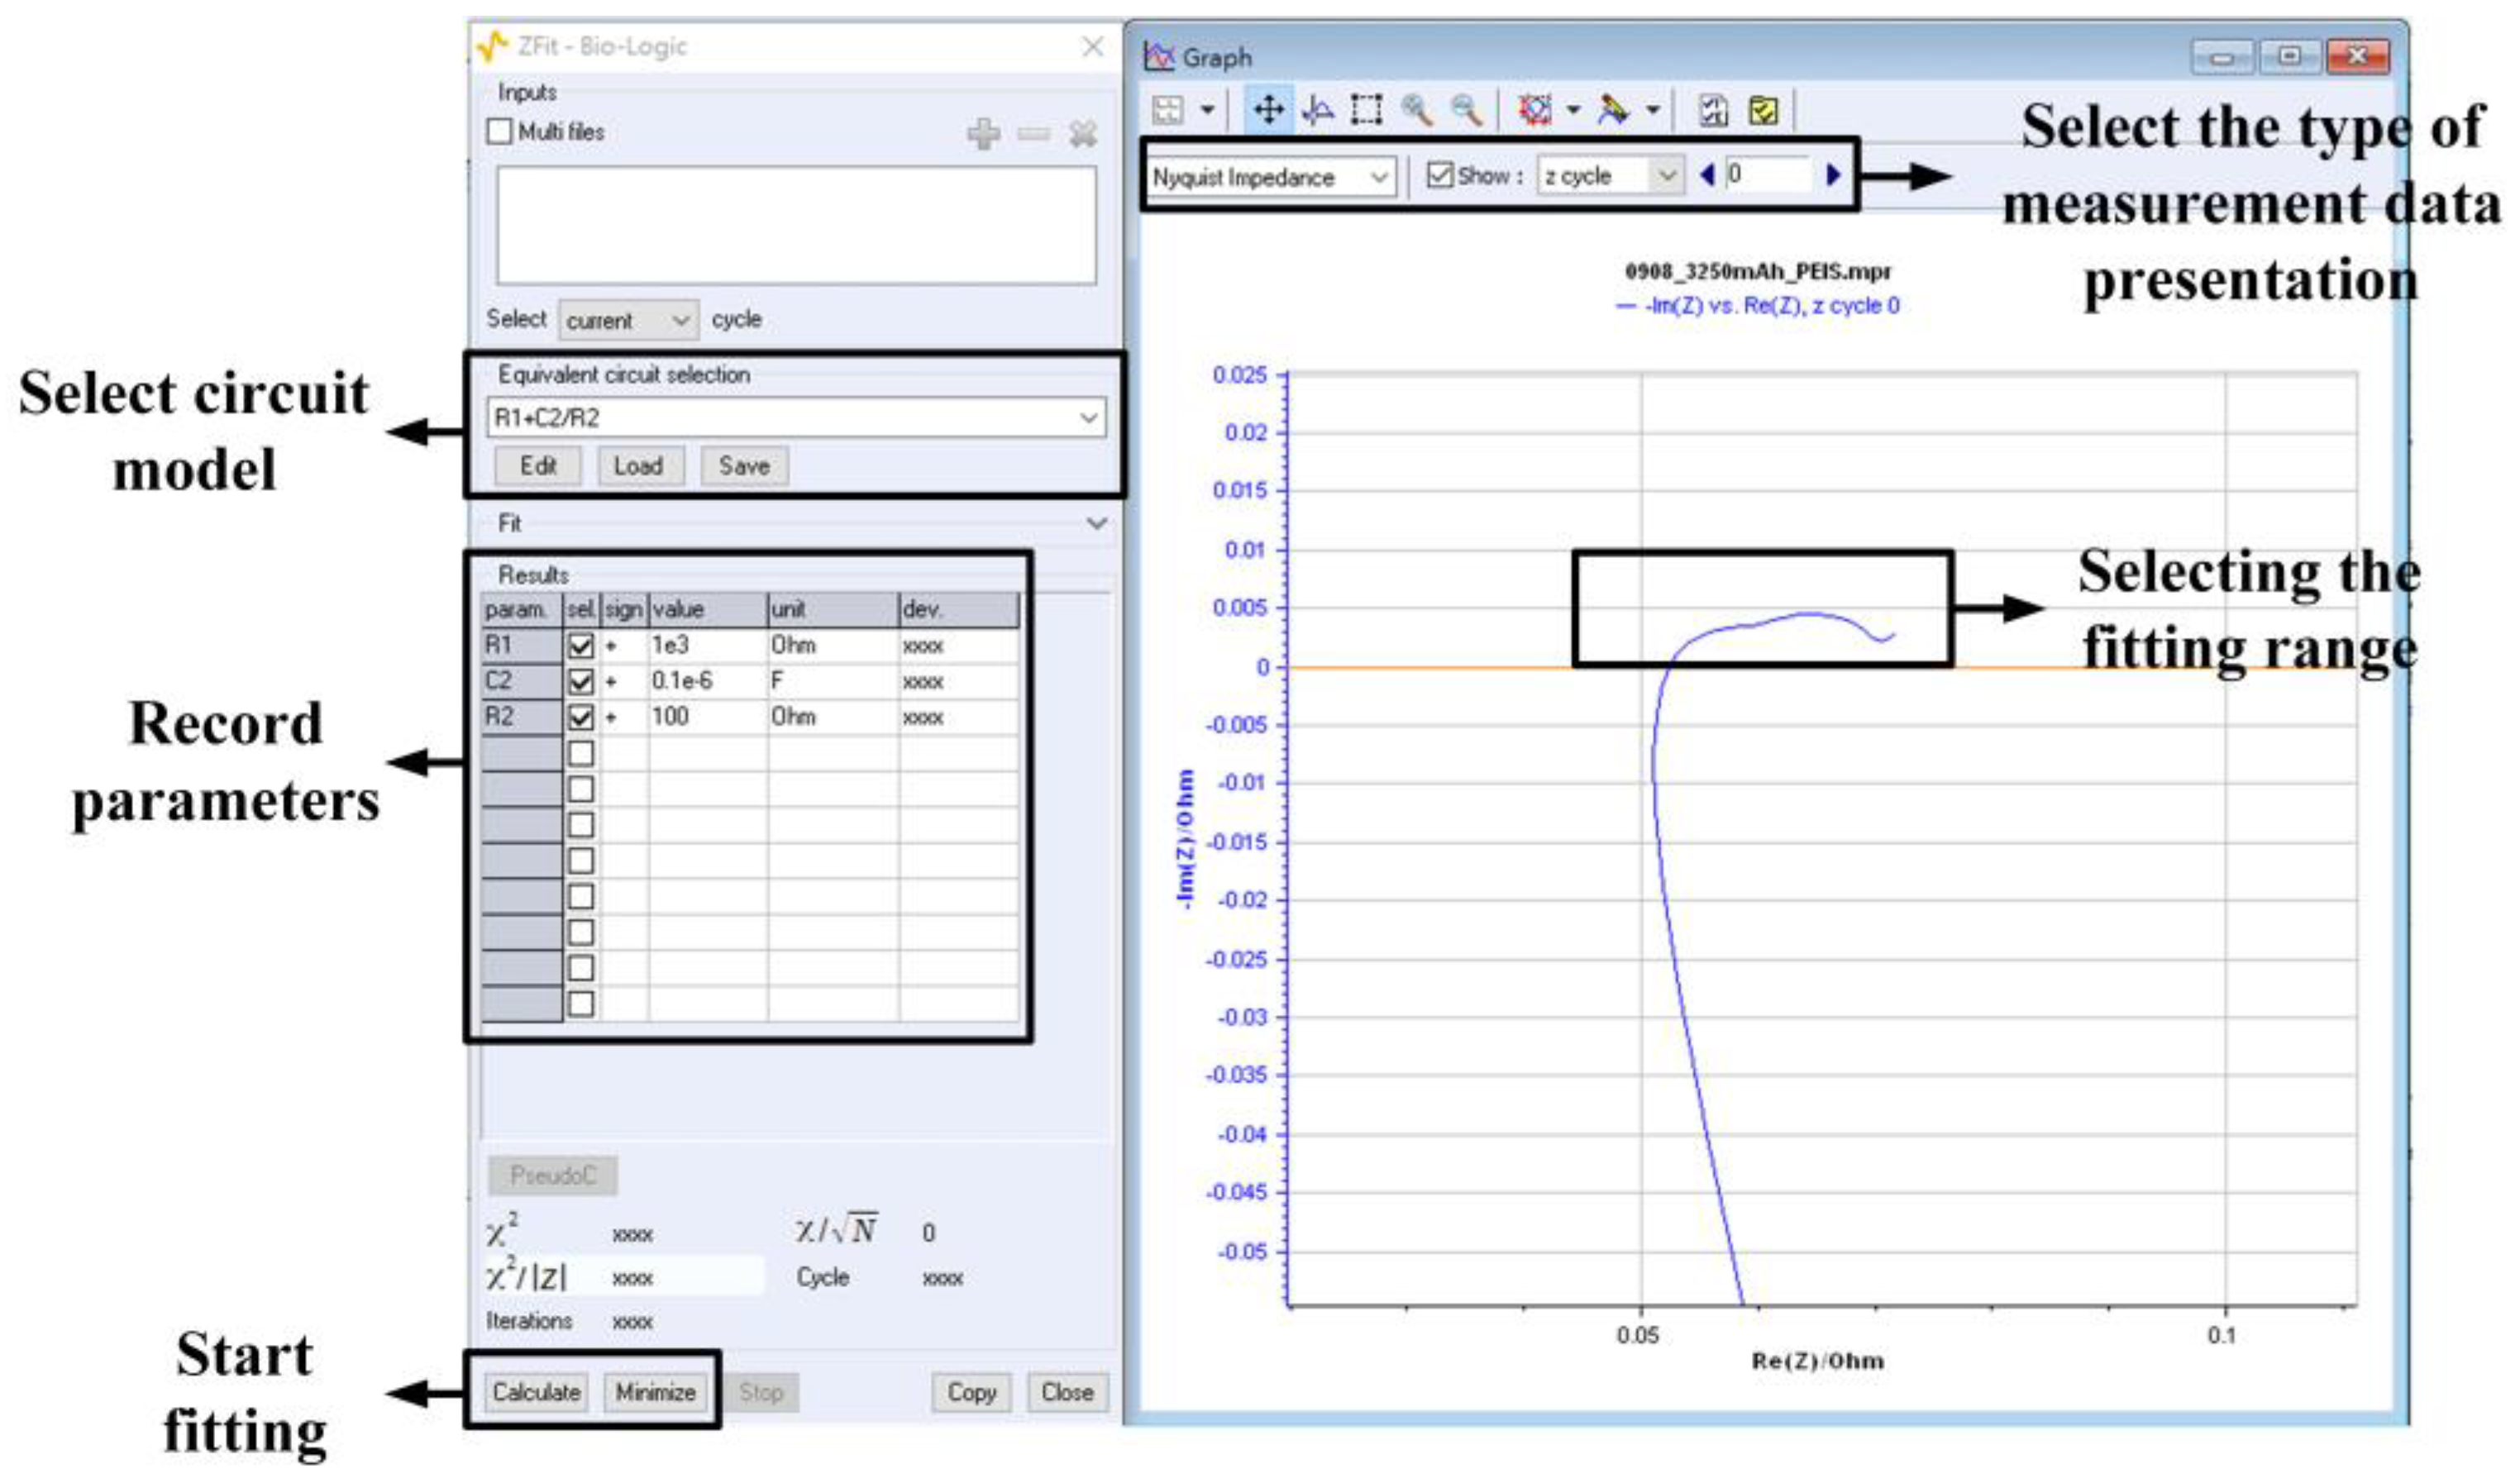
2.4.4. Data Analysis of AC Impedance

Upon completing the AC impedance analysis measurements introduced in the previous section, Nyquist plots for different remaining capacities can be obtained, as shown in Figure 9. Subsequently, the Z-fit functionality in EC-Lab is employed, offering various model choices for Nyquist plot analysis. Figure 10 presents the user interface of the AC impedance analysis in EC-Lab.
Here are the steps for using Z-fit functionality:
  • Select the presentation format of the measured data. For Nyquist plots, choose “Nyquist Impedance,” and select “z cycle” to display Nyquist plots for different remaining capacities.
  • Next, choose the appropriate model. Z fit functionality is located in the “Analysis” menu under “Electrochemical Impedance Spectroscopy.” In this case, using Thevenin’s battery equivalent circuit model. Select a model that consists of two resistors (R1, R2) and one capacitor (C2) for fitting.
  • Since the AC impedance analysis is conducted at every 1% of remaining capacity, first select the Nyquist plot for the desired remaining capacity, then define the range for curve fitting.
  • Perform the curve fitting. Begin by minimizing the curve fitting using “Minimize” and then calculate the parameters using “Calculate” to obtain the curve’s parameters.
  • Once you have the parameters from the fitted curve, record and document them.

3. Introduction to the Charging Methods

In addition to the commonly employed constant current–constant voltage (CC-CV) and constant power–constant voltage (CP-CV) charging methods, the paper also considers the constant current–constant voltage charging method based on the lithium-ion battery’s equivalent circuit model. Furthermore, a constant loss–constant voltage charging method is proposed. All of these charging methods are evaluated and compared in the study.

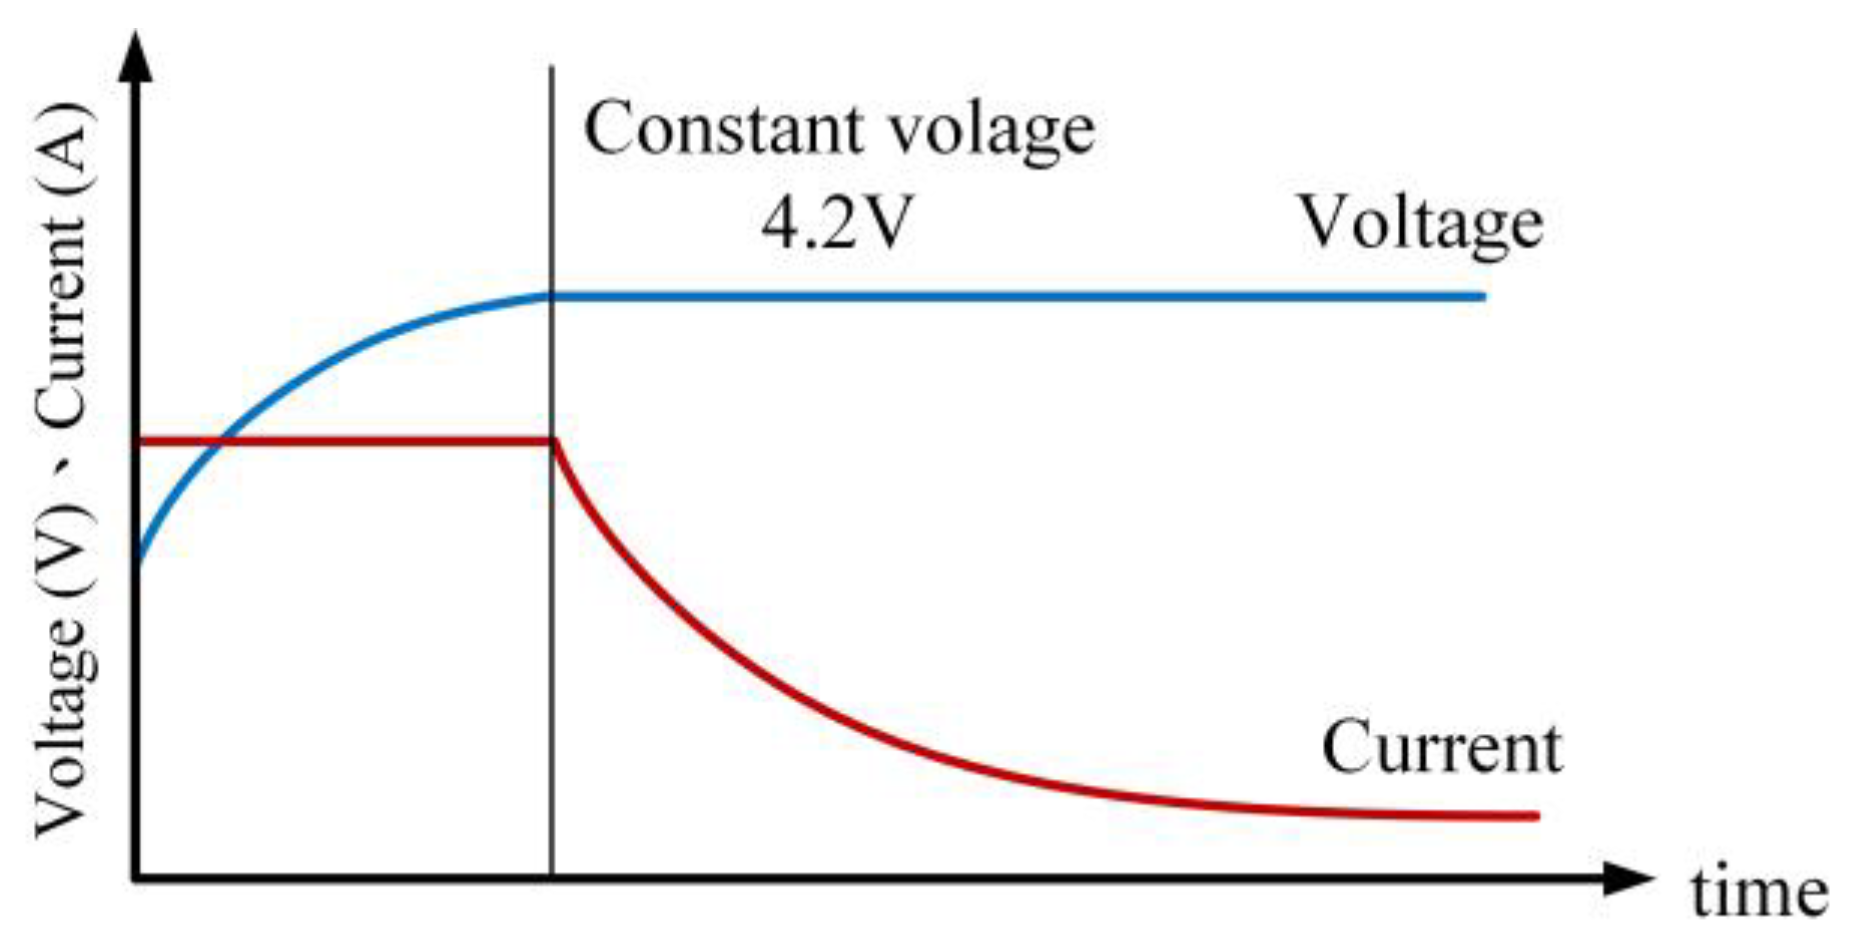
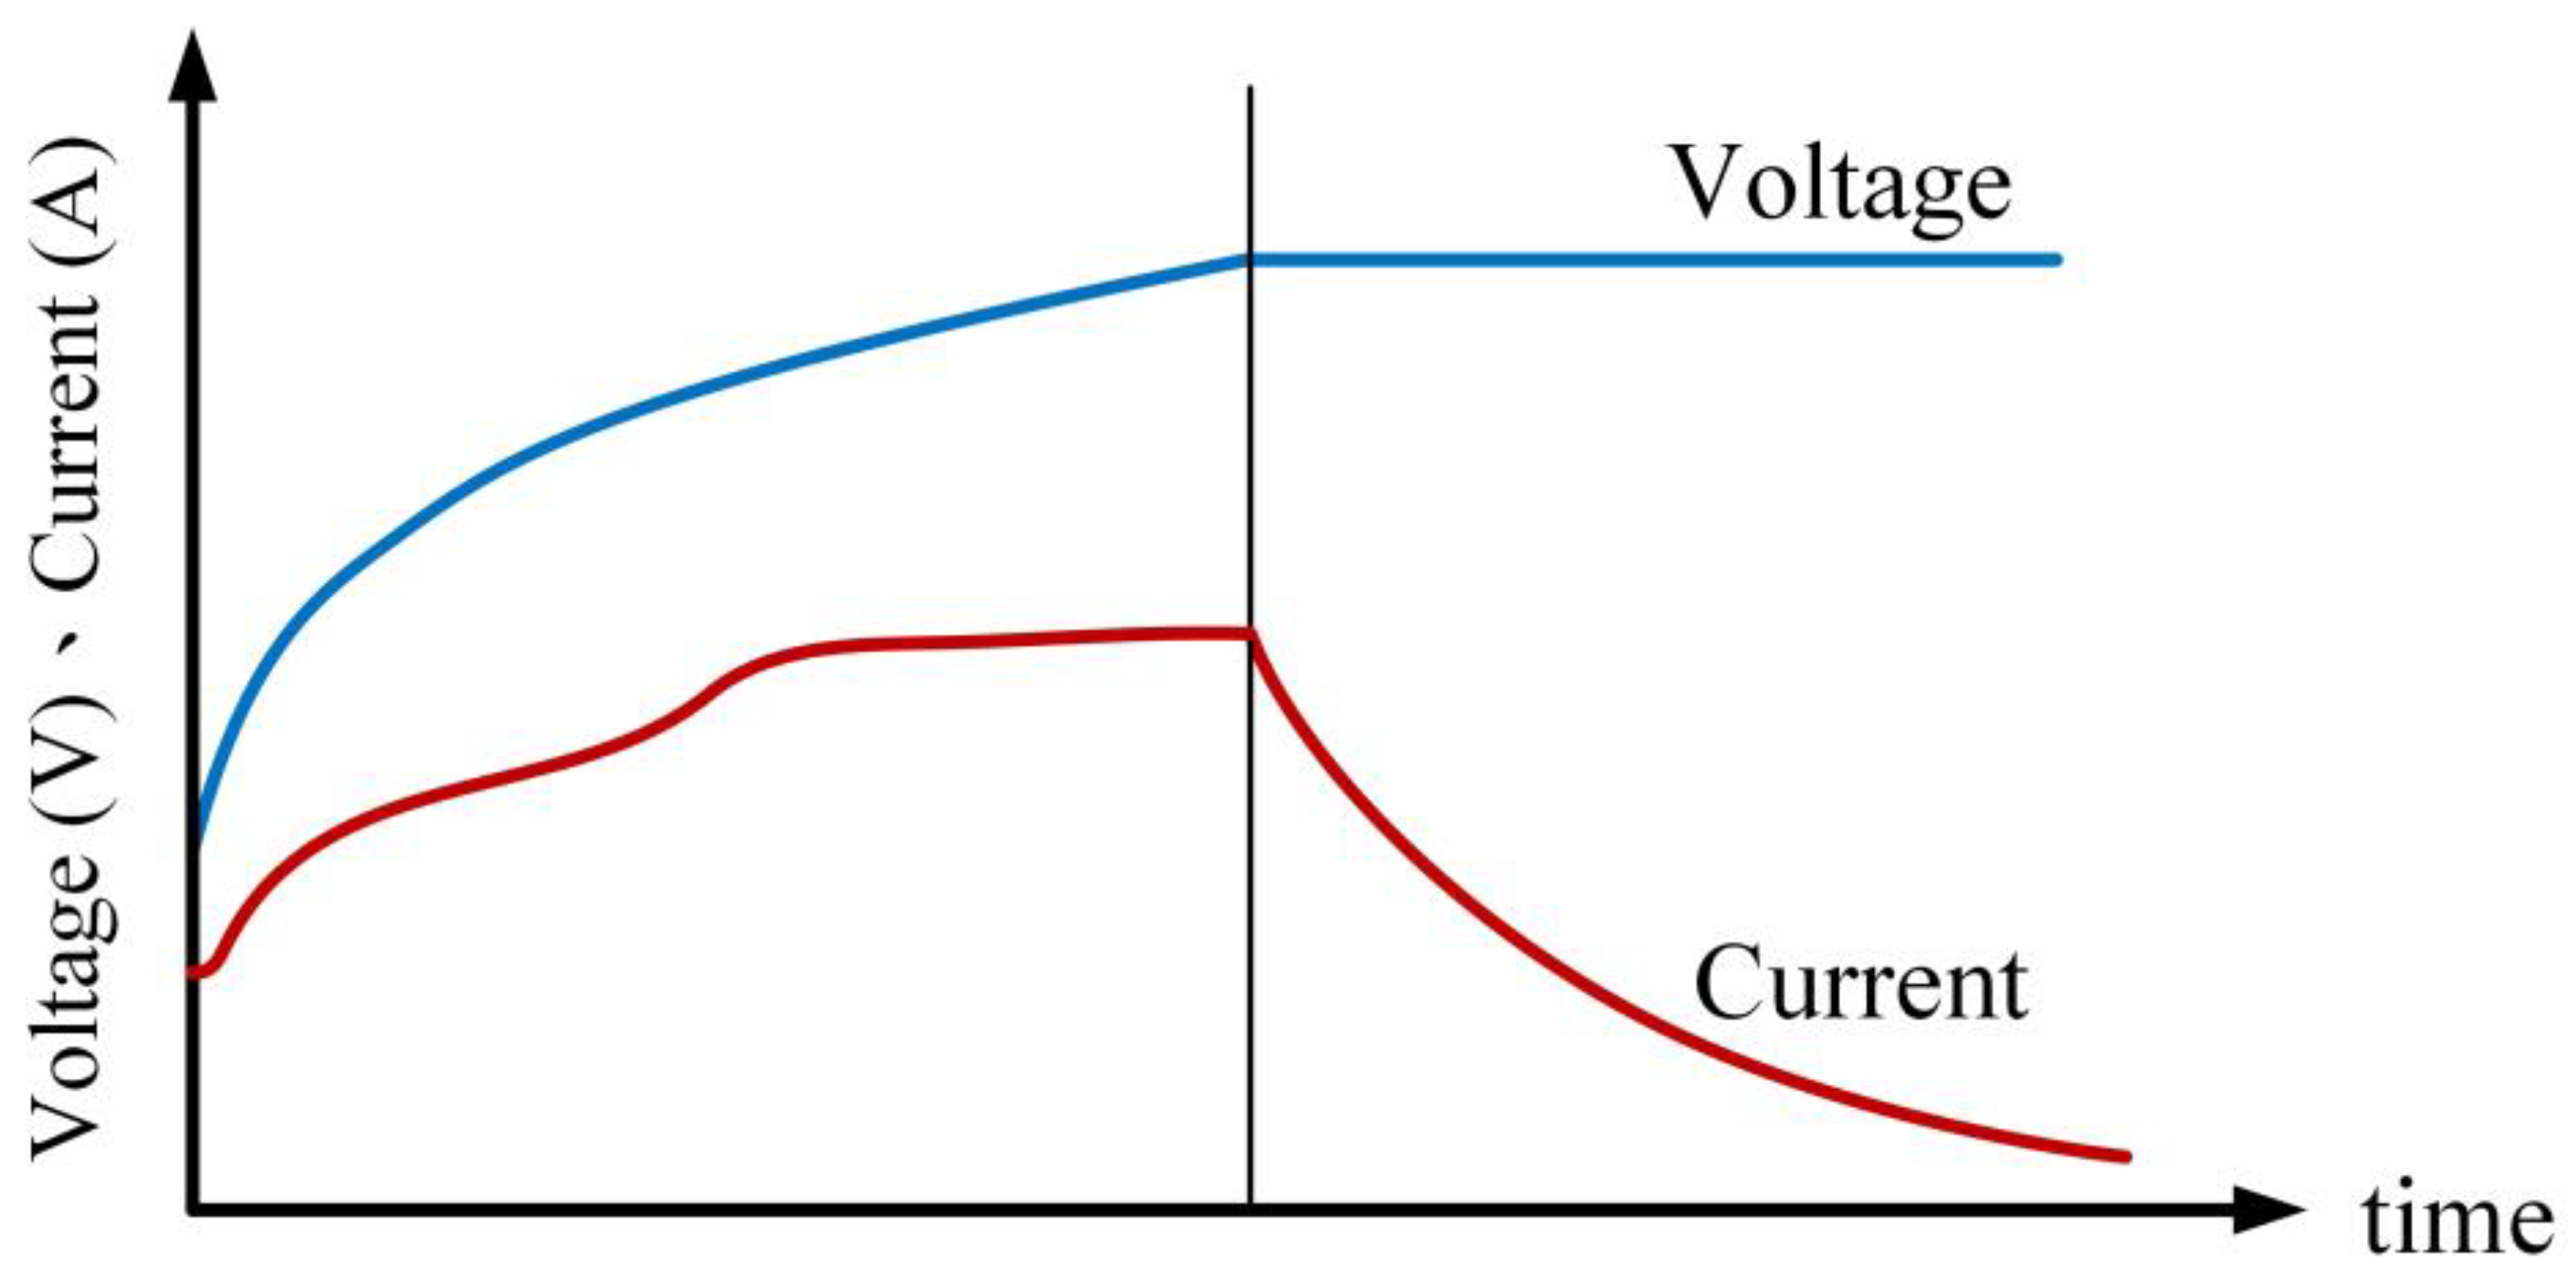
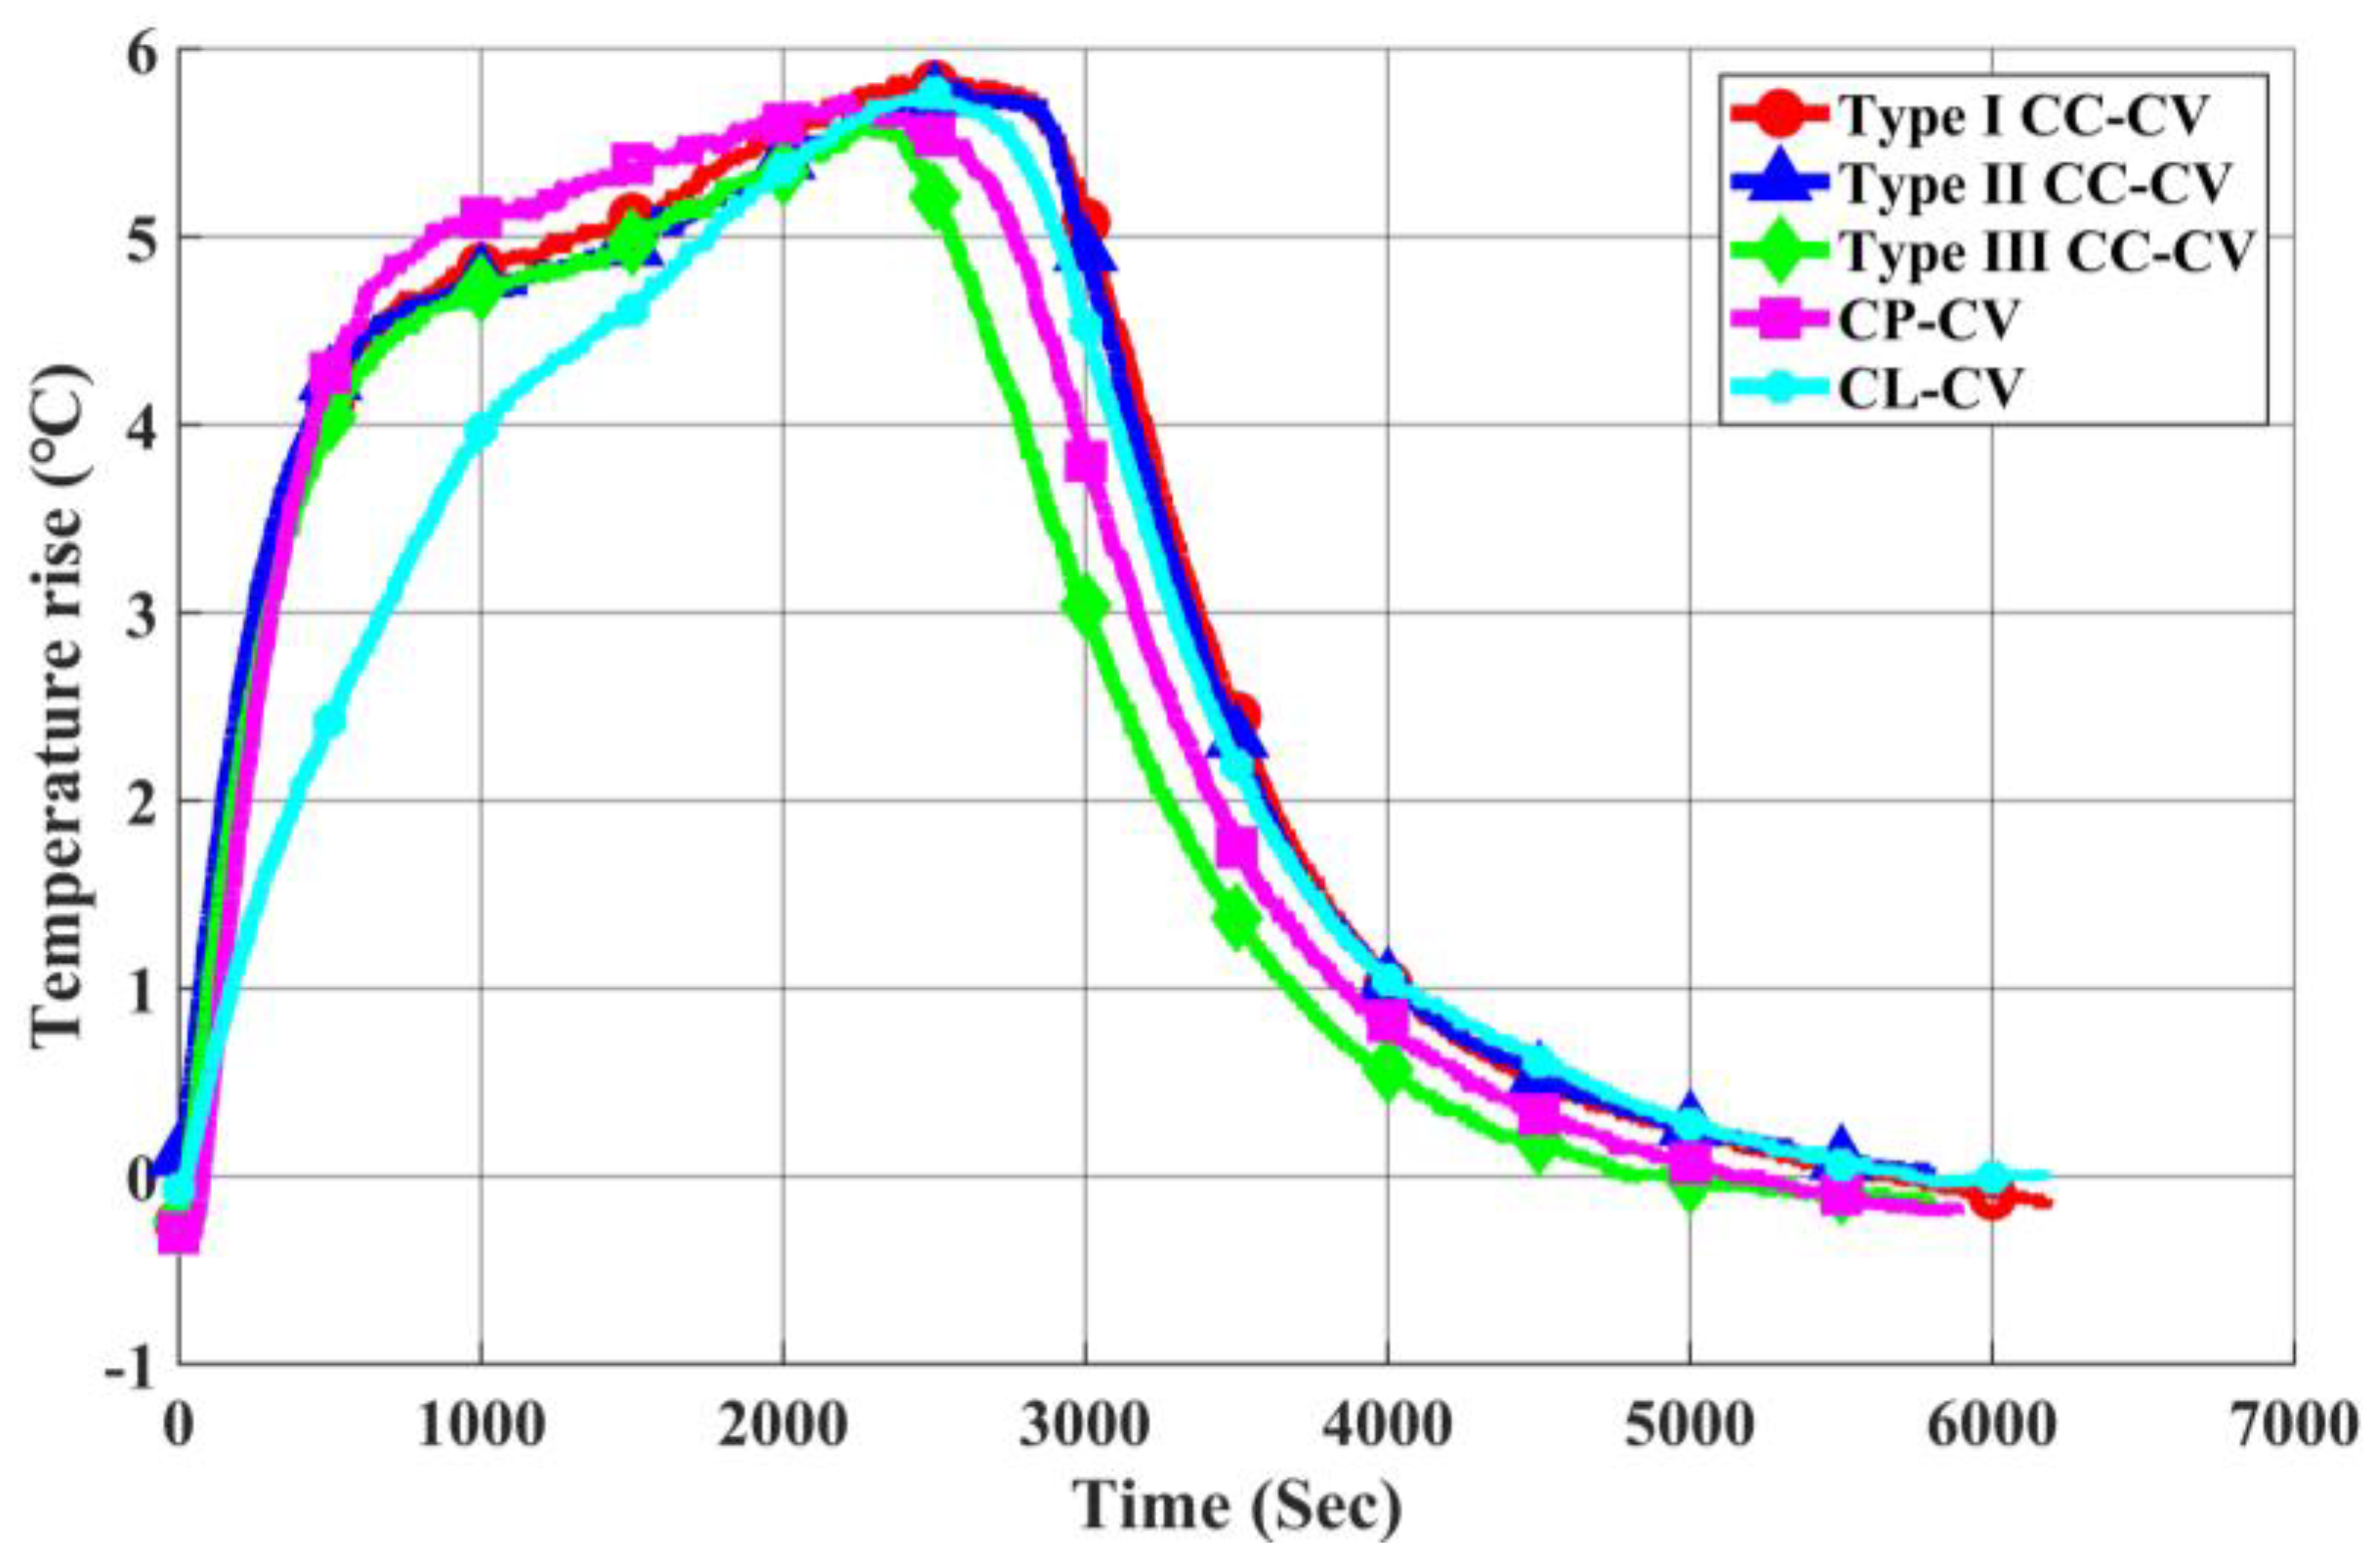
3.1. Constant Current-Constant Voltage (CC-CV) Charging Method

This method is the most common. The charging process is divided into two stages. In the first stage, a constant current charging method is employed to charge the battery in the initial phase until the battery voltage reaches the set terminal voltage. Afterward, the charging mode switches to the second stage using the constant voltage charging method. The first stage allows for faster charging until the set terminal voltage is reached. The second stage, utilizing the constant voltage charging method, helps prevent the battery from experiencing overcharging. This two-stage approach is designed to combine the benefits of rapid initial charging with voltage control to ensure safe and efficient charging. In this paper, the CC-CV charging method is categorized into three types, each evaluated with different terminal voltage values. Here’s an explanation of each type.

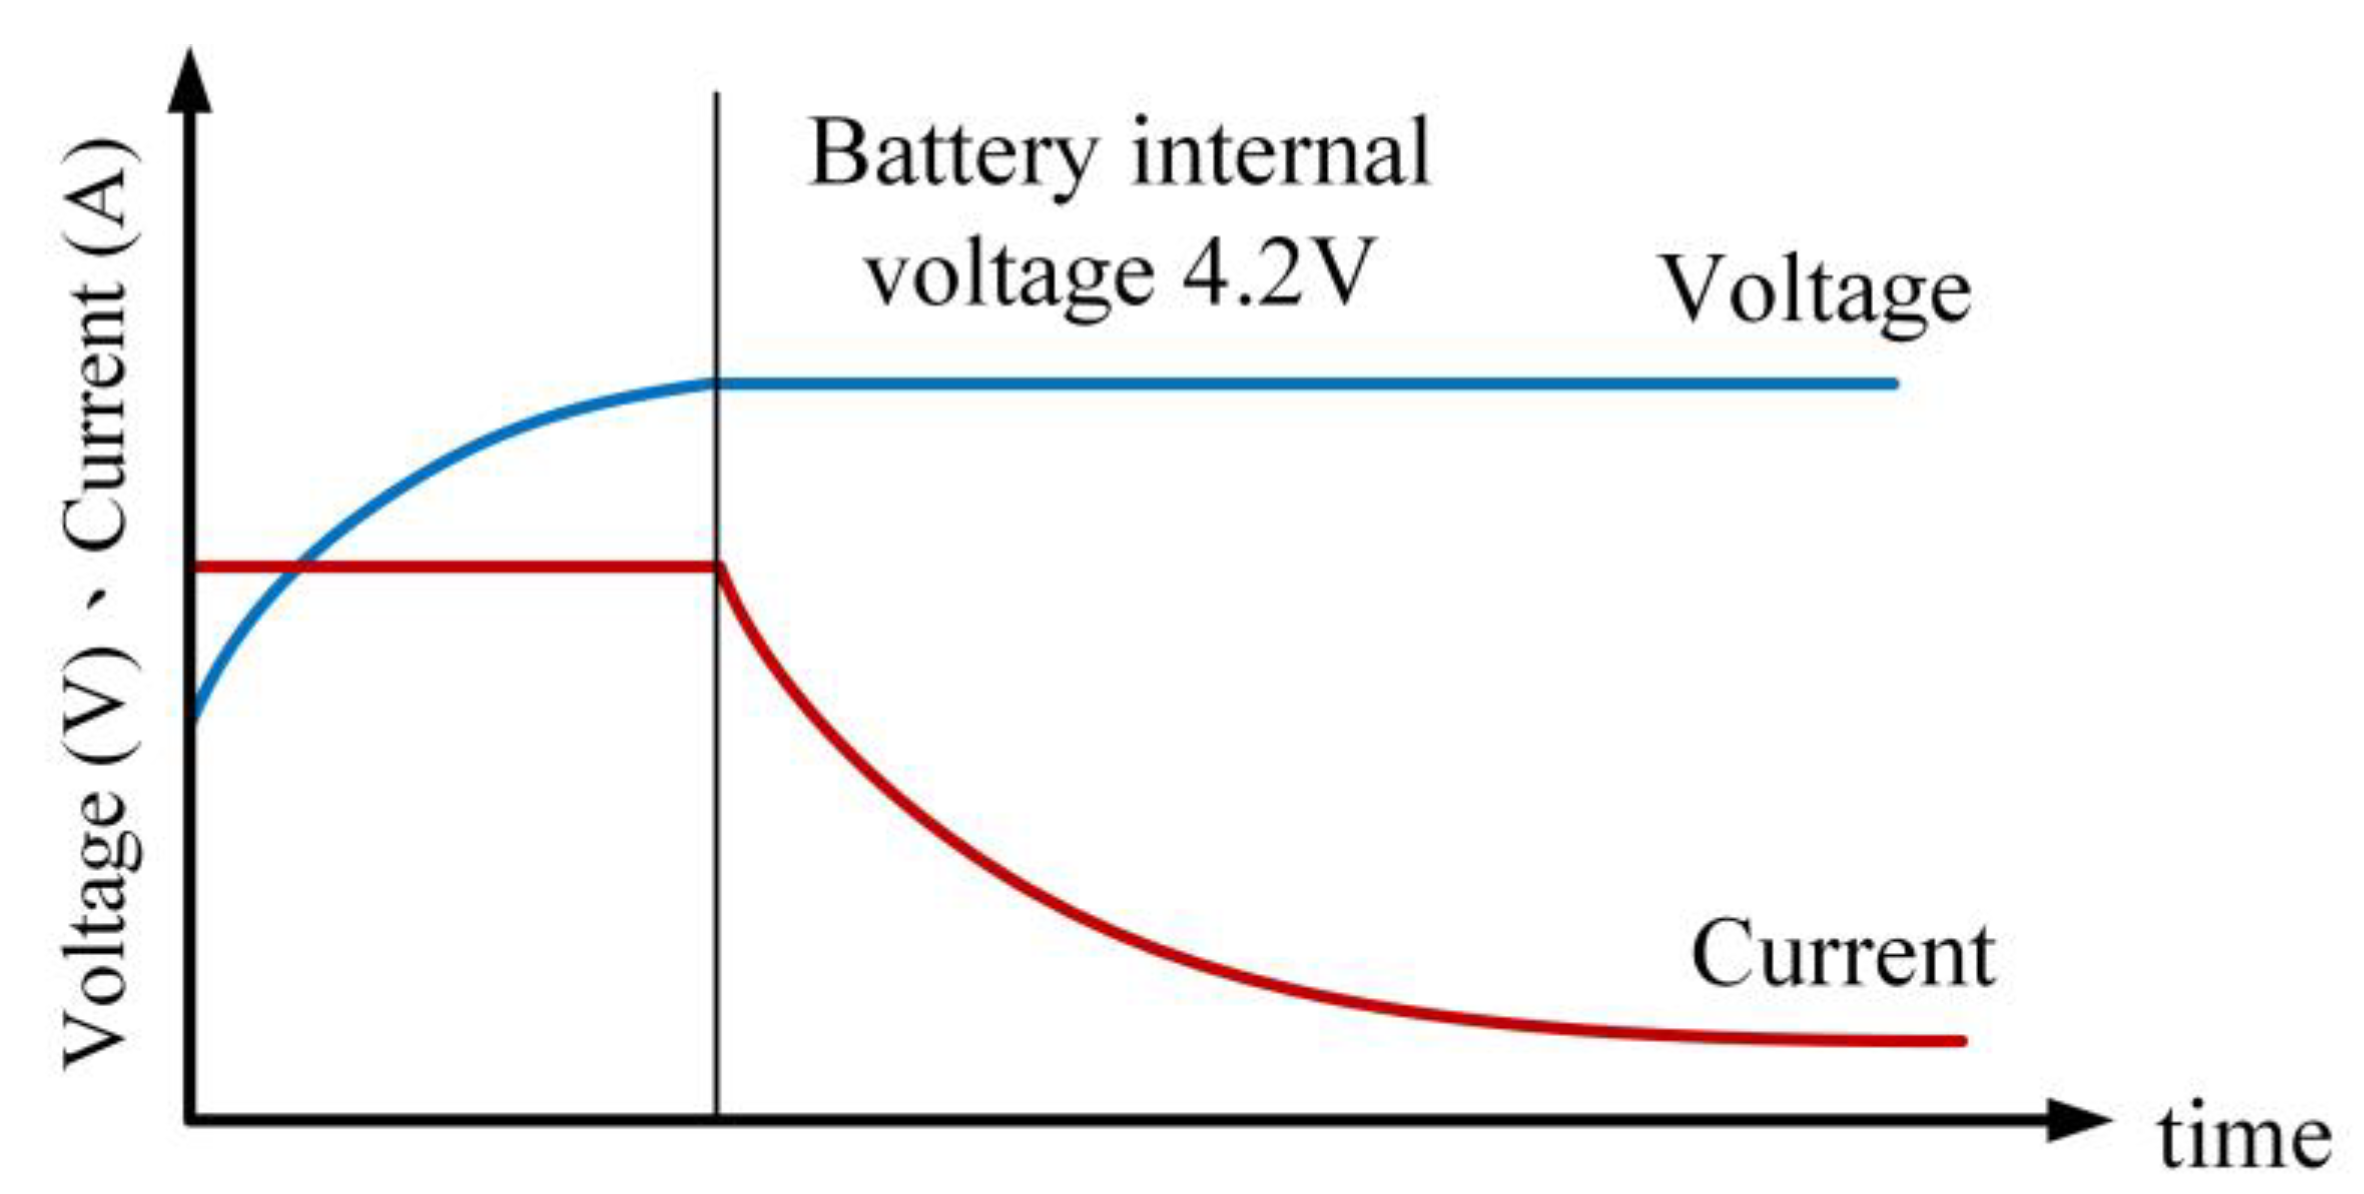
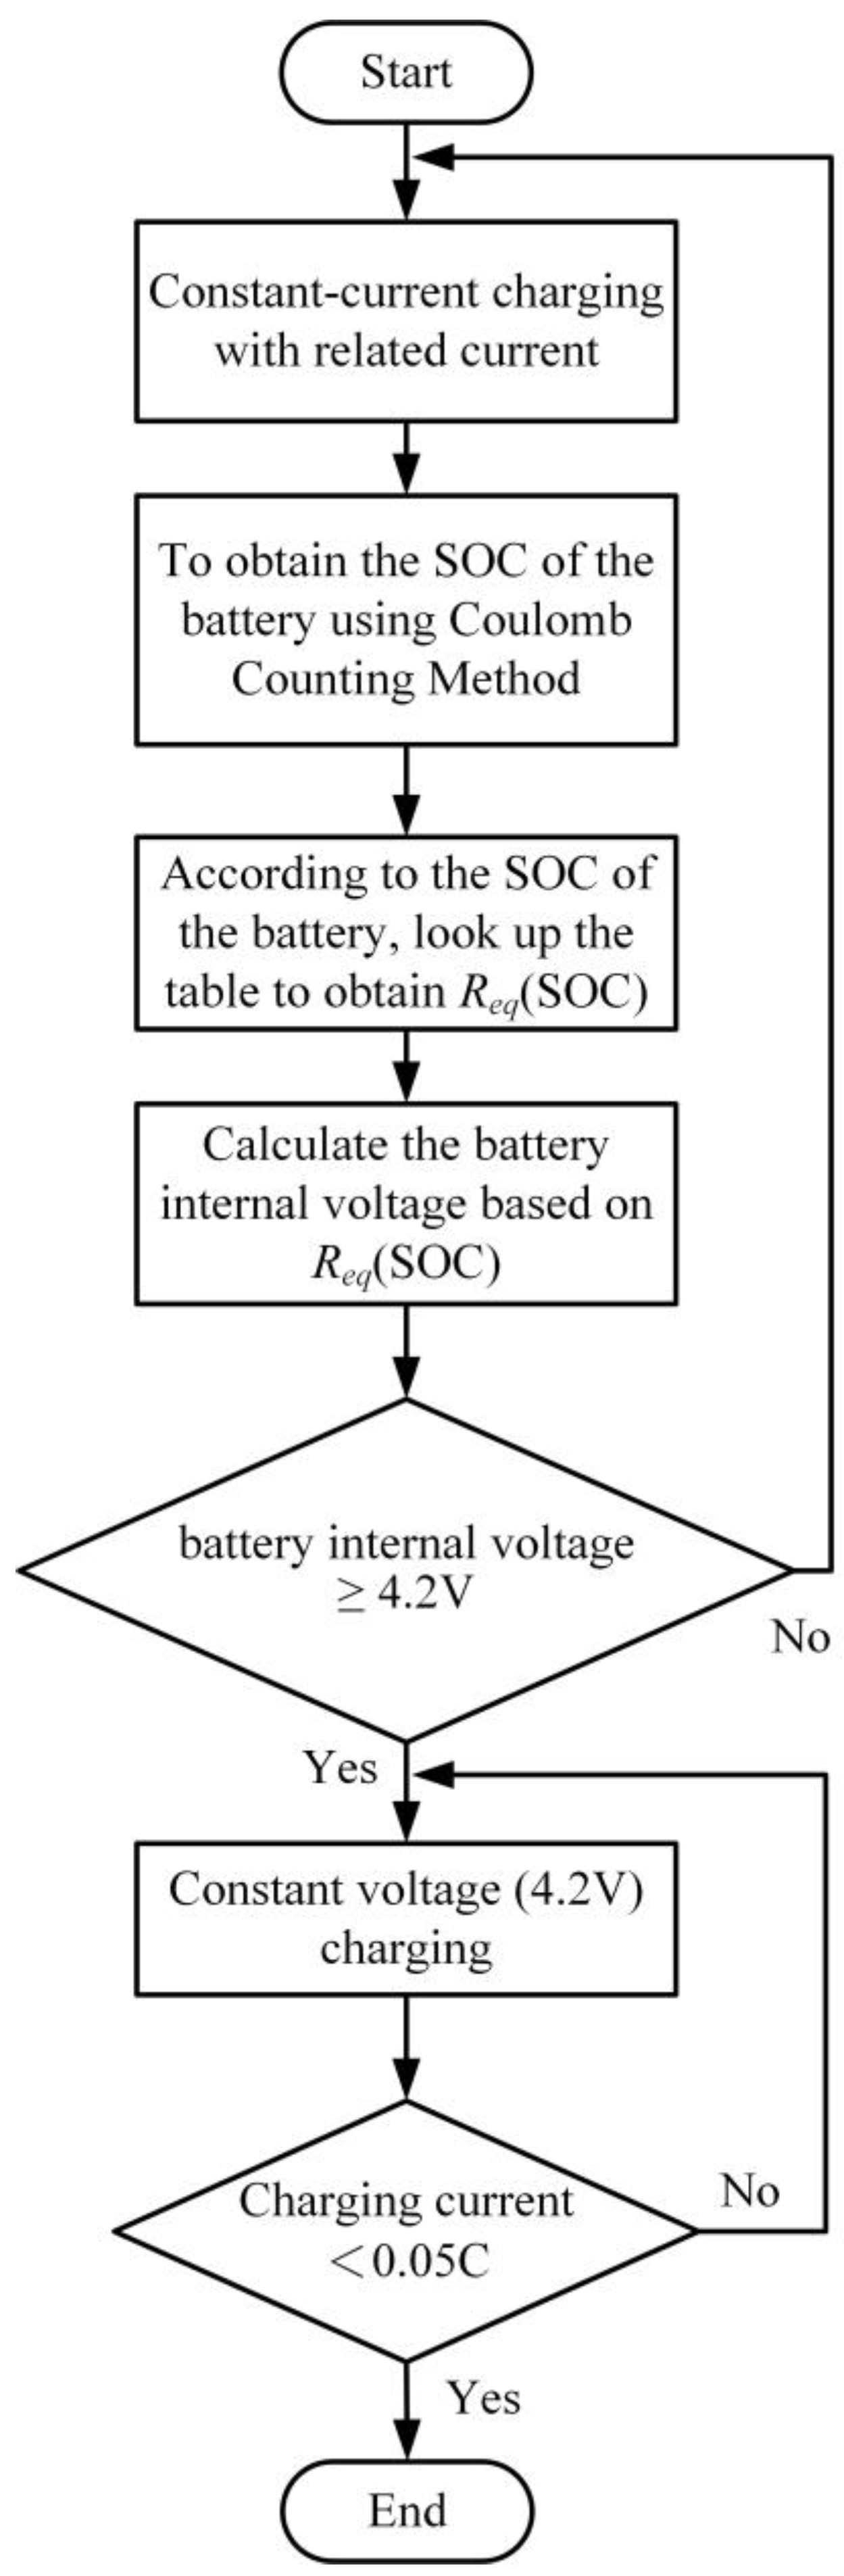
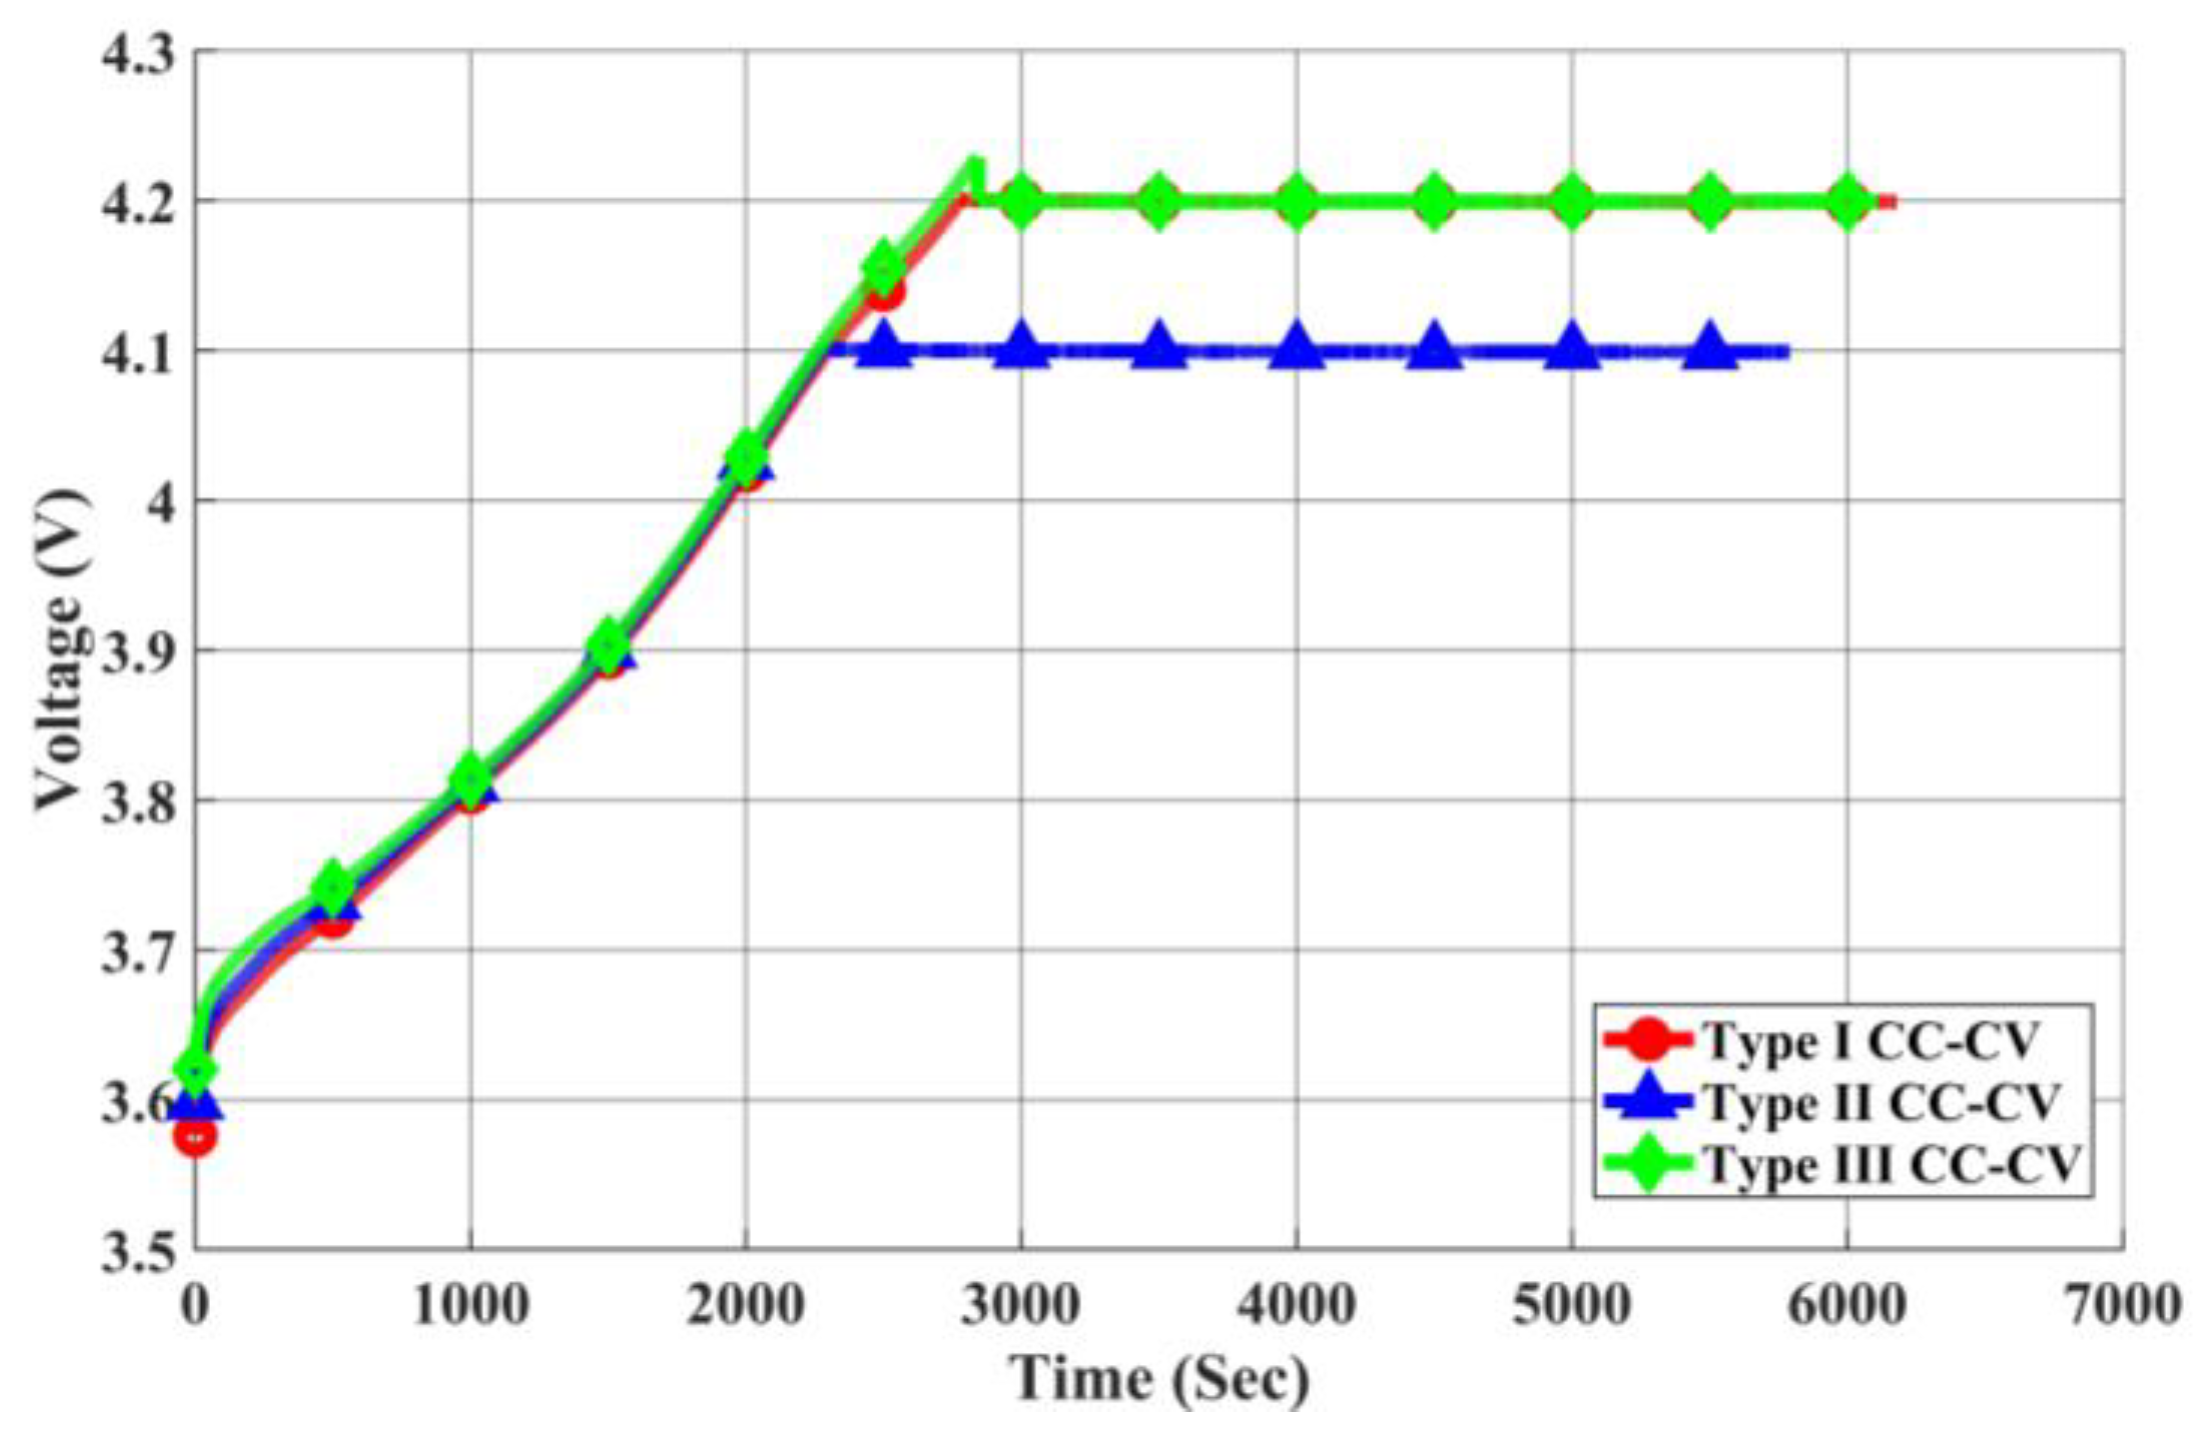
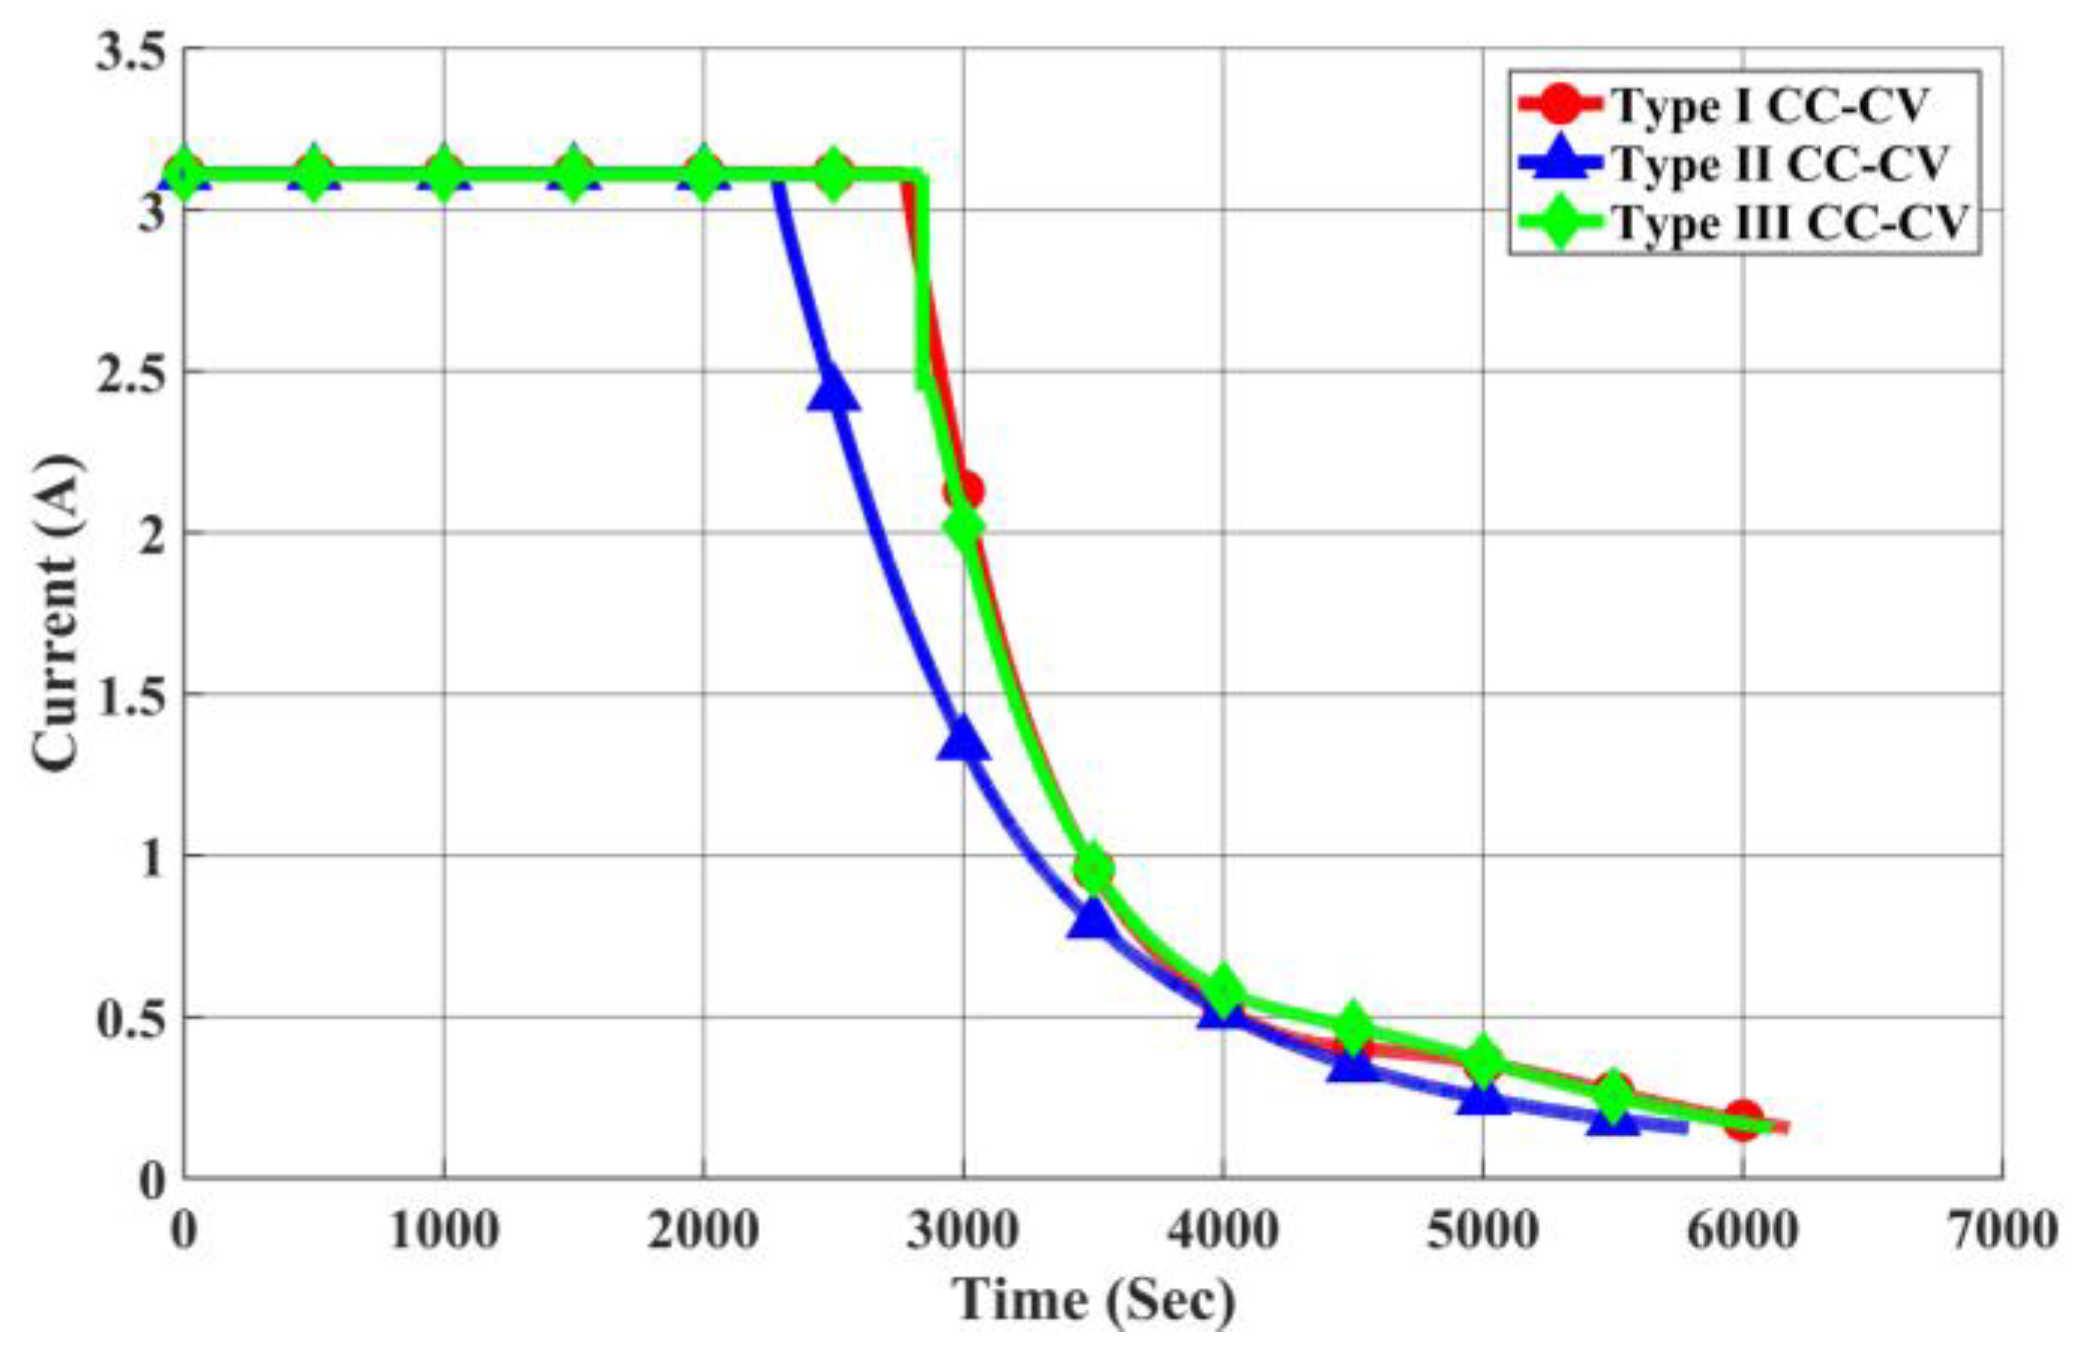
3.1.1. Type I CC-CV Charging Method

This is the standard CC-CV charging method. A constant current is applied to the battery until the battery voltage reaches or exceeds the upper limit voltage set by the manufacturer (e.g., 4.2 V). Subsequently, the charging mode switches to constant voltage using the upper limit voltage, and the charging process is completed when the battery’s charging current drops below 0.05 C. Figure 11 illustrates the charging profile of the Type I CC-CV charging method.

3.1.2. Type II CC-CV Charging Method

Compared to Type I, in this charging approach a lower constant voltage value (e.g., 4.1 V) is employed during the constant voltage charging phase [28]. The charging process starts with constant current charging until the battery voltage reaches or exceeds 4.1 V. Then, the charging mode switches to constant voltage (4.1 V), and the process is completed when the charging current drops below 0.05 C. Figure 12 illustrates the charging profile of the Type II CC-CV charging method.

3.1.3. Type III CC-CV Charging Method

This method involves updating the battery’s internal impedance and voltage in real time during the charging process. Unlike Type I, in Type III CC-CV charging, the transition voltage is set to the battery’s internal voltage reaching the upper limit voltage (e.g., 4.2 V) defined by the manufacturer. This method employs the linear battery equivalent circuit model. Initially, constant current charging is applied, and the remaining capacity is calculated using Coulomb counting. The relationship between the battery’s equivalent impedance (Req) and the remaining capacity is established, allowing the calculation of the battery’s internal voltage (VOC), as shown in Equation (1). The charging switches to constant voltage (4.2 V) when the battery’s internal voltage exceeds or equals 4.2 V. The process concludes when the charging current drops below 0.05 C. Figure 13 and Figure 14 illustrate the charging profile and flowchart of the Type III CC-CV charging method.
V O C = V t - I c h g × R e q ( S O C )
where Vt represents battery terminal voltage, Ichg represents charging current, Req represents battery equivalent impedance.

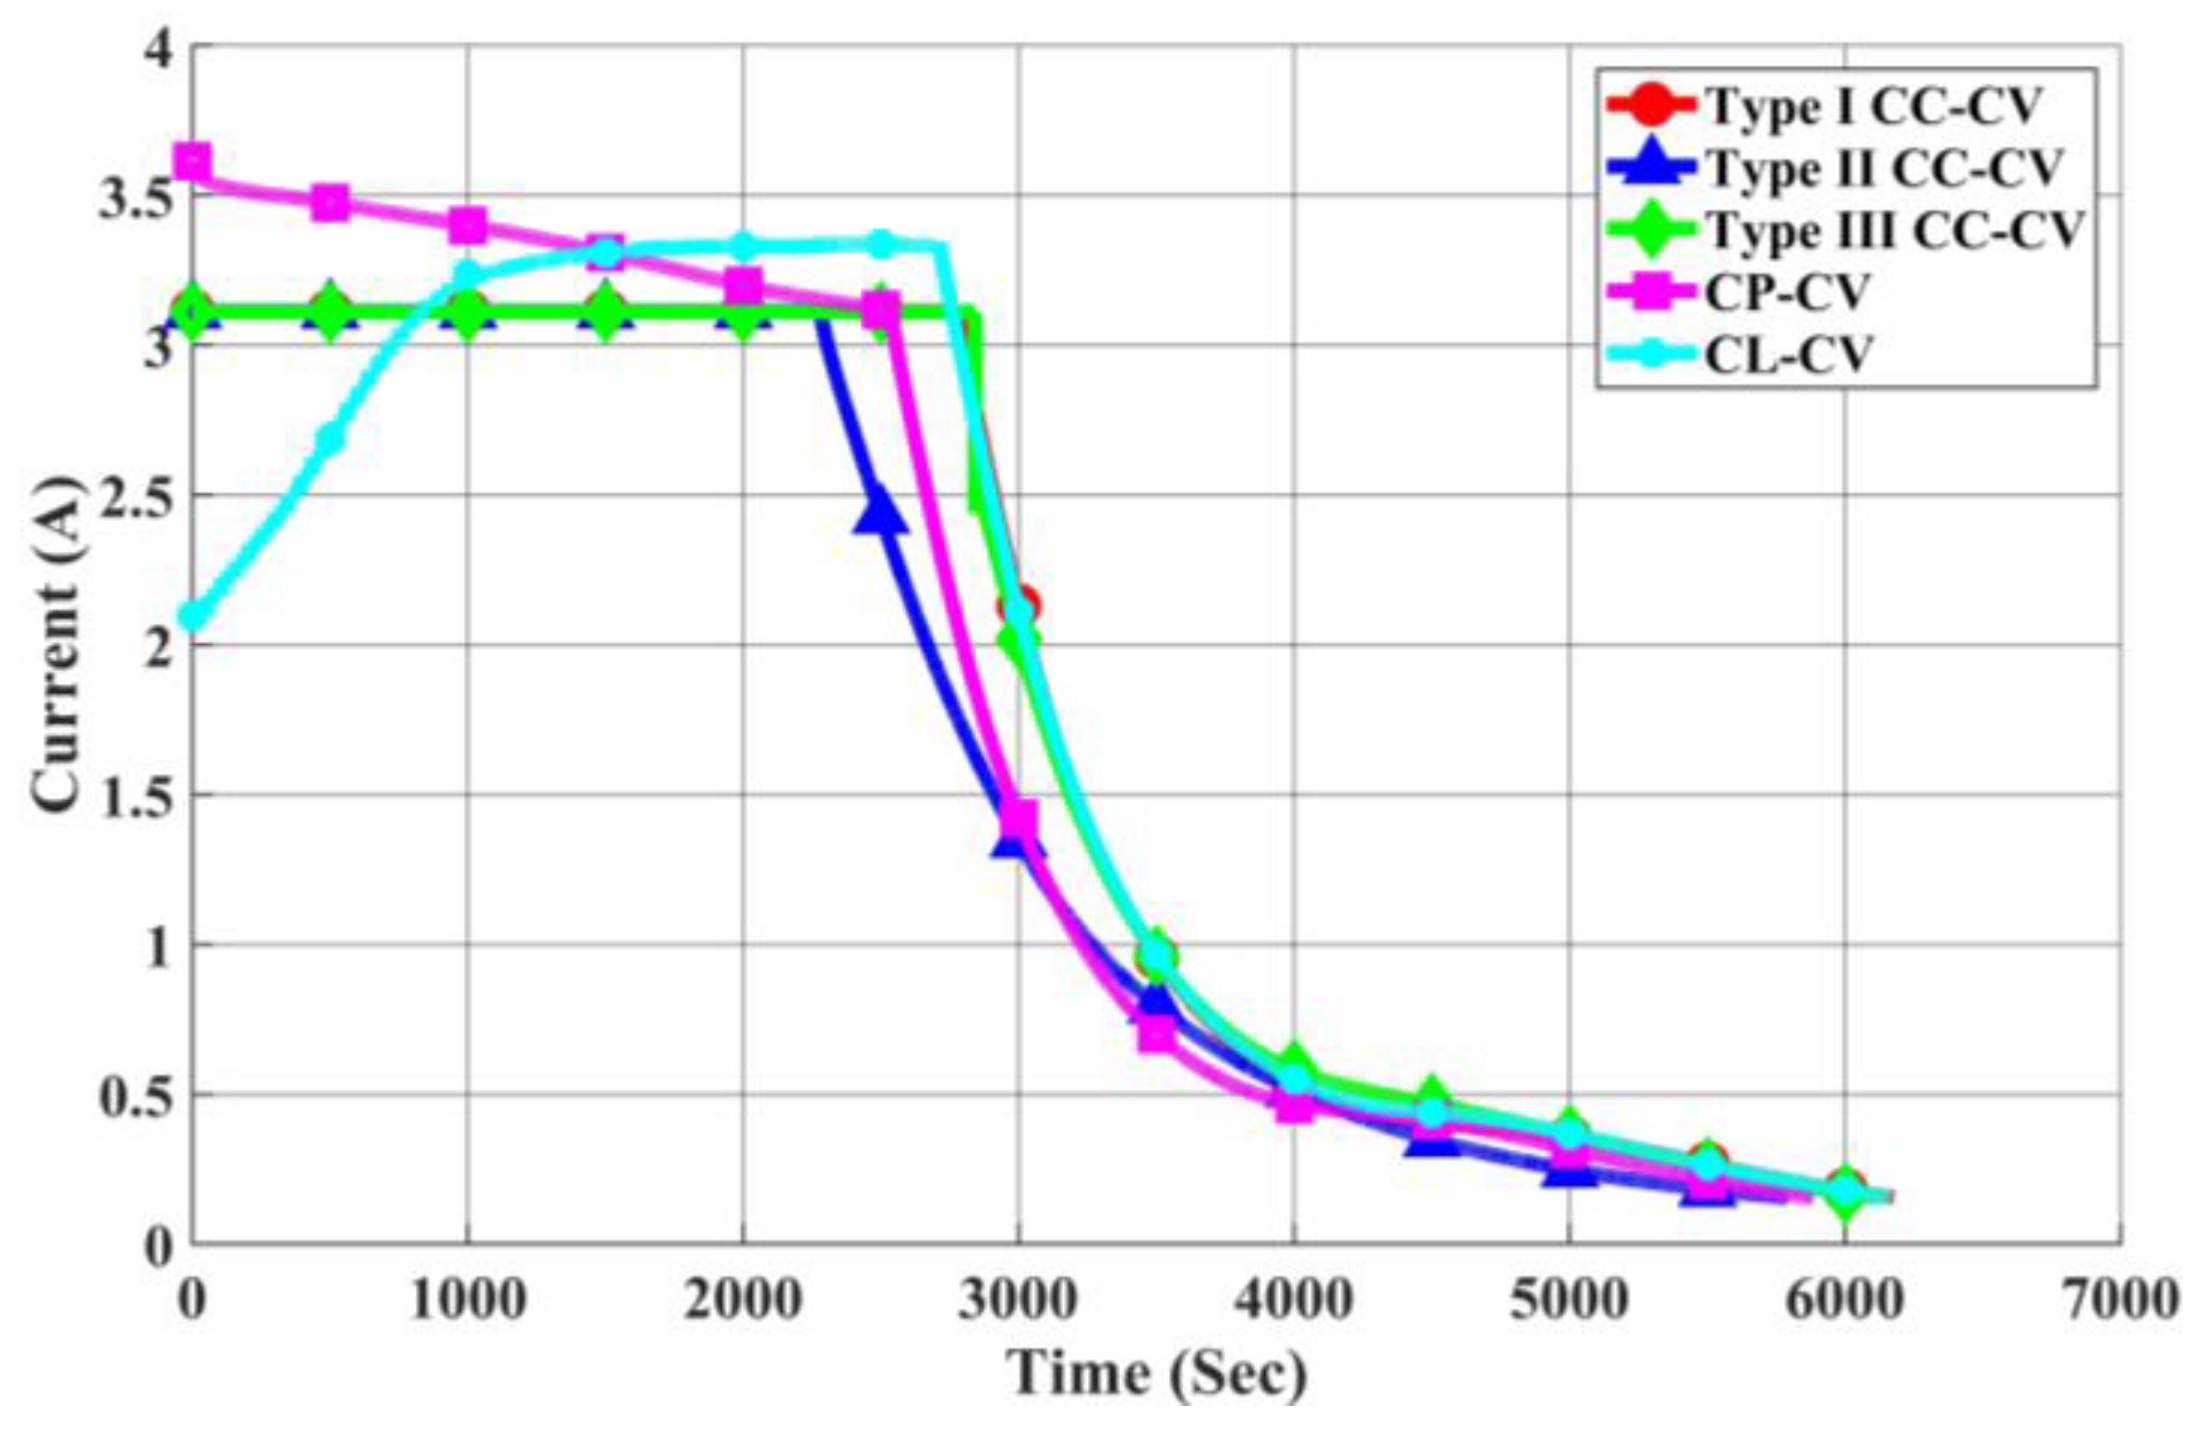
3.2. Constant Loss–Constant Voltage (CL-CV) Charging Method

The proposed charging method employs Thevenin’s equivalent circuit as the battery’s equivalent model. During the initial phase of charging, the method utilizes constant loss charging until the battery terminal voltage reaches the upper limit voltage (4.2 V). The loss is defined as the square of the current multiplied by the battery’s equivalent impedance, which varies with the battery’s remaining capacity. The battery’s equivalent impedance changes with the remaining capacity. Figure 15 depicts the schematic of the constant loss–constant voltage charging method, illustrating two different SOC values and their corresponding I1, R1, I2, and R2 values. The calculation of charging loss (Pchg_Loss) is defined by Equation (2).
P c h g _ L o s s = I 1 2 × R 1 = I 2 2 × R 2
In this study, the predetermined loss setting Pchg_Loss is defined as the square of the battery’s rated current multiplied by the average battery equivalent impedance. Taking a battery with a rated capacity of 3250 mAh and an average battery equivalent impedance of 0.07 Ω as an example, under the condition of the rated charging current, the predetermined loss setting value is determined as Pchg_Loss. The charging process starts with a constant current charge until the battery terminal voltage reaches 4.2 V. Subsequently, it switches to a constant voltage charge at 4.2 V to continue charging the battery until the battery current drops below 0.05 C, indicating the end of the charging process. As depicted in Figure 16, the schematic diagram illustrates the procedure of the constant loss constant voltage charging method. To achieve a consistent charging loss for the battery, the approach begins by employing Coulomb counting to calculate the current battery state of charge. Then, Equation (3) is utilized to compute the charging current value.
I c h g = P c h g _ L o s s R e q ( S O C )
where Ichg represents the charging current, and Req represents the equivalent impedance of the battery.

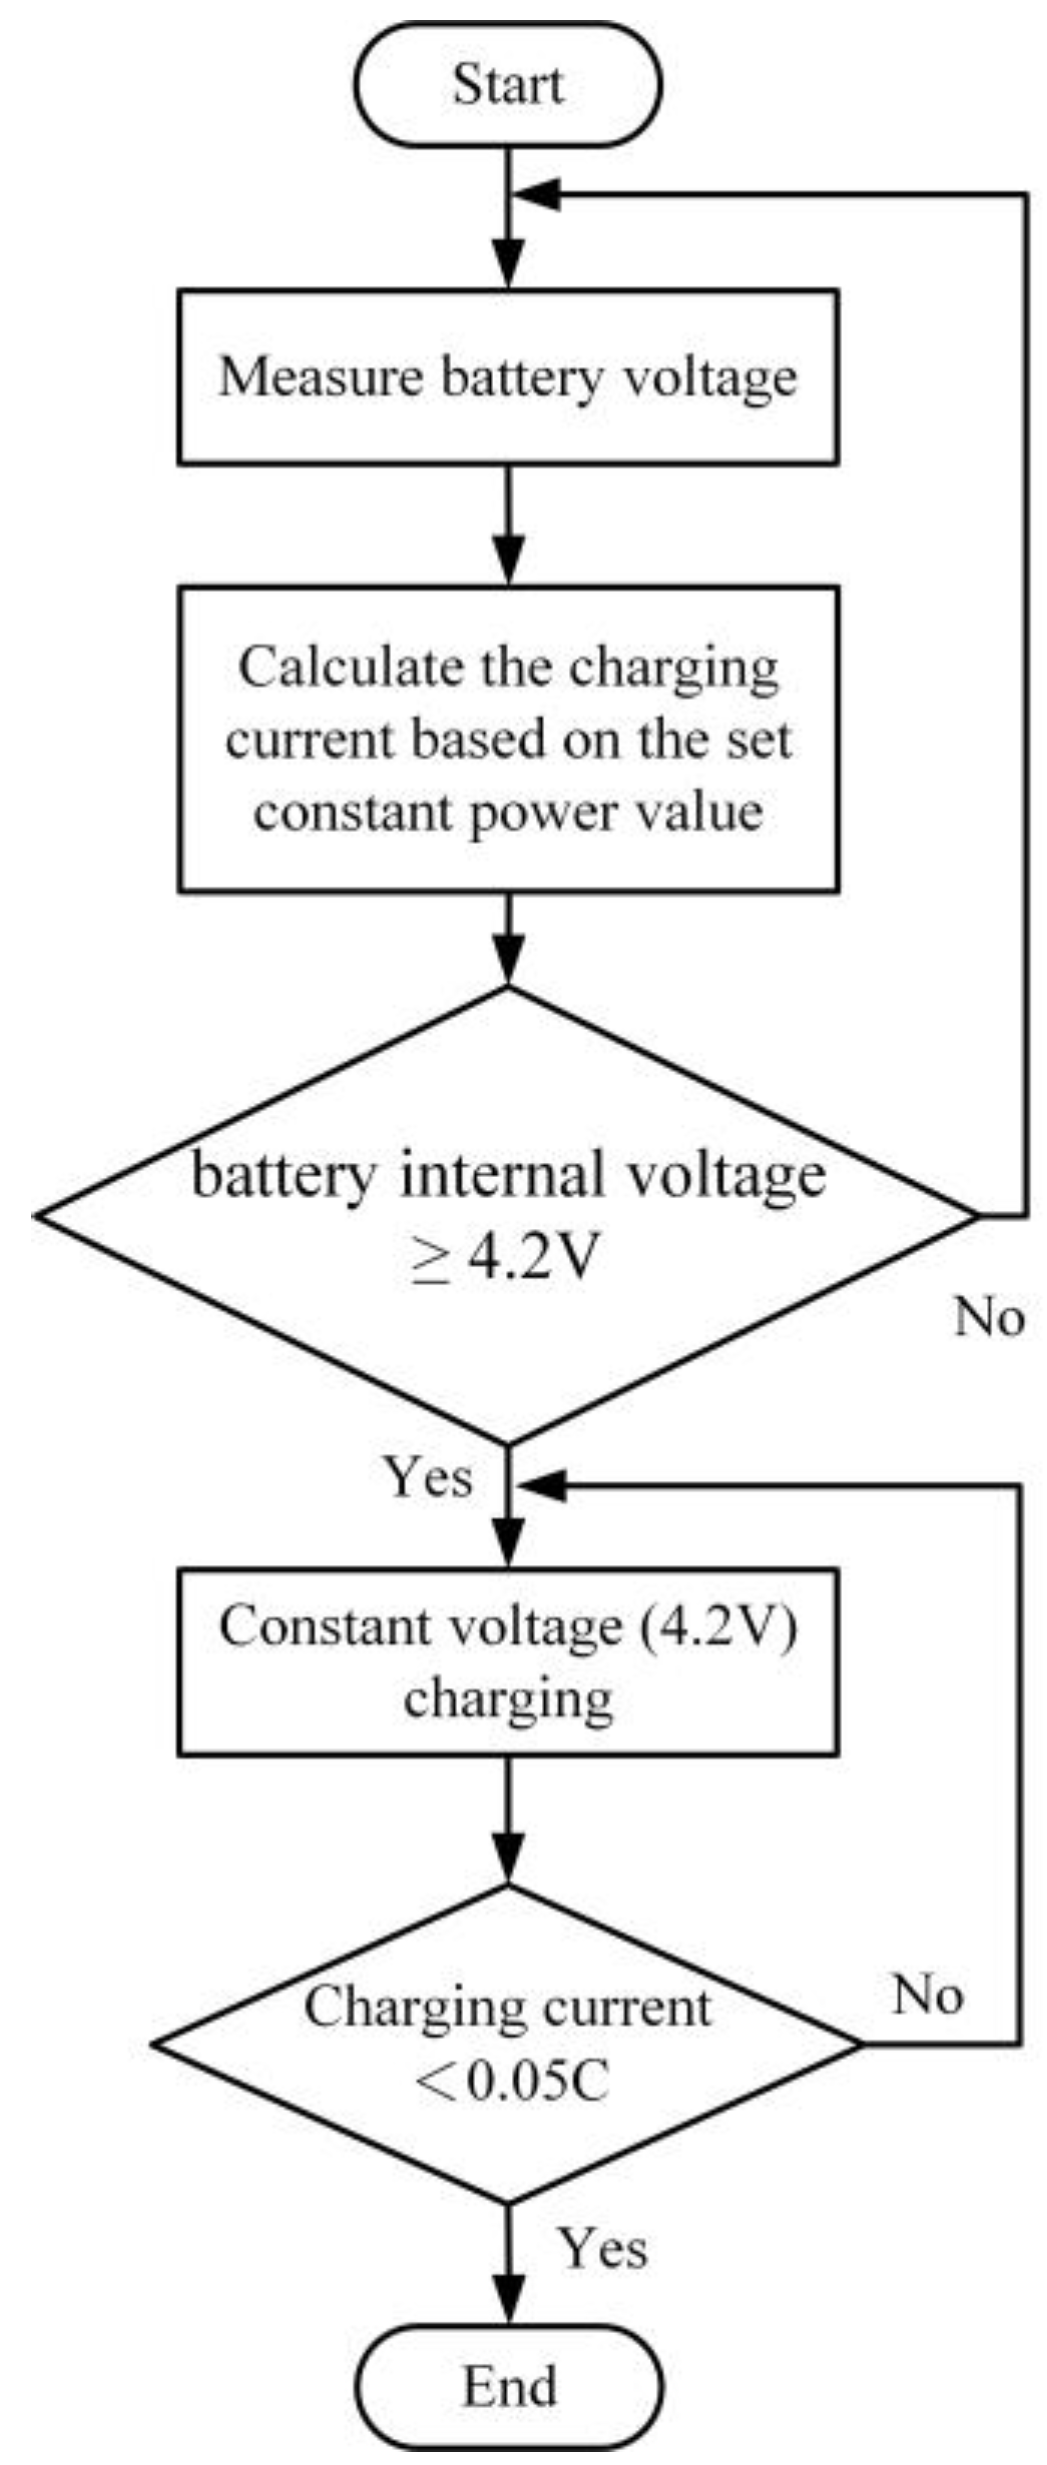
3.3. Constant Power—Constant Voltage (CP-CV) Charging Method

In the initial stage of charging, the battery is charged using a constant power charging method until the battery voltage reaches the upper limit voltage (4.2 V). Subsequently, the charging method is switched to constant voltage charging, as illustrated in Figure 17, which depicts the schematic diagram of the constant power–constant voltage charging method. Power is defined as the product of voltage and current, for instance: by selecting two different charging voltage and current values at distinct time intervals, denoted as V1, I1, and V2, I2, respectively, the power P is calculated using Equation (4).
P = V 1 × I 1 = V 2 × I 2
Taking a battery with a rated capacity of 3250 mAh as an example, under the condition of the rated current, the predetermined power setting value is determined. The charging process begins with a constant power charge until the battery voltage reaches 4.2 V. Subsequently, it switches to a constant voltage charge at 4.2 V until the charging current drops below 0.05 C, indicating the end of the charging process. As depicted in Figure 18, the schematic diagram illustrates the procedure of the constant power constant voltage charging method.

4. Experimental Results

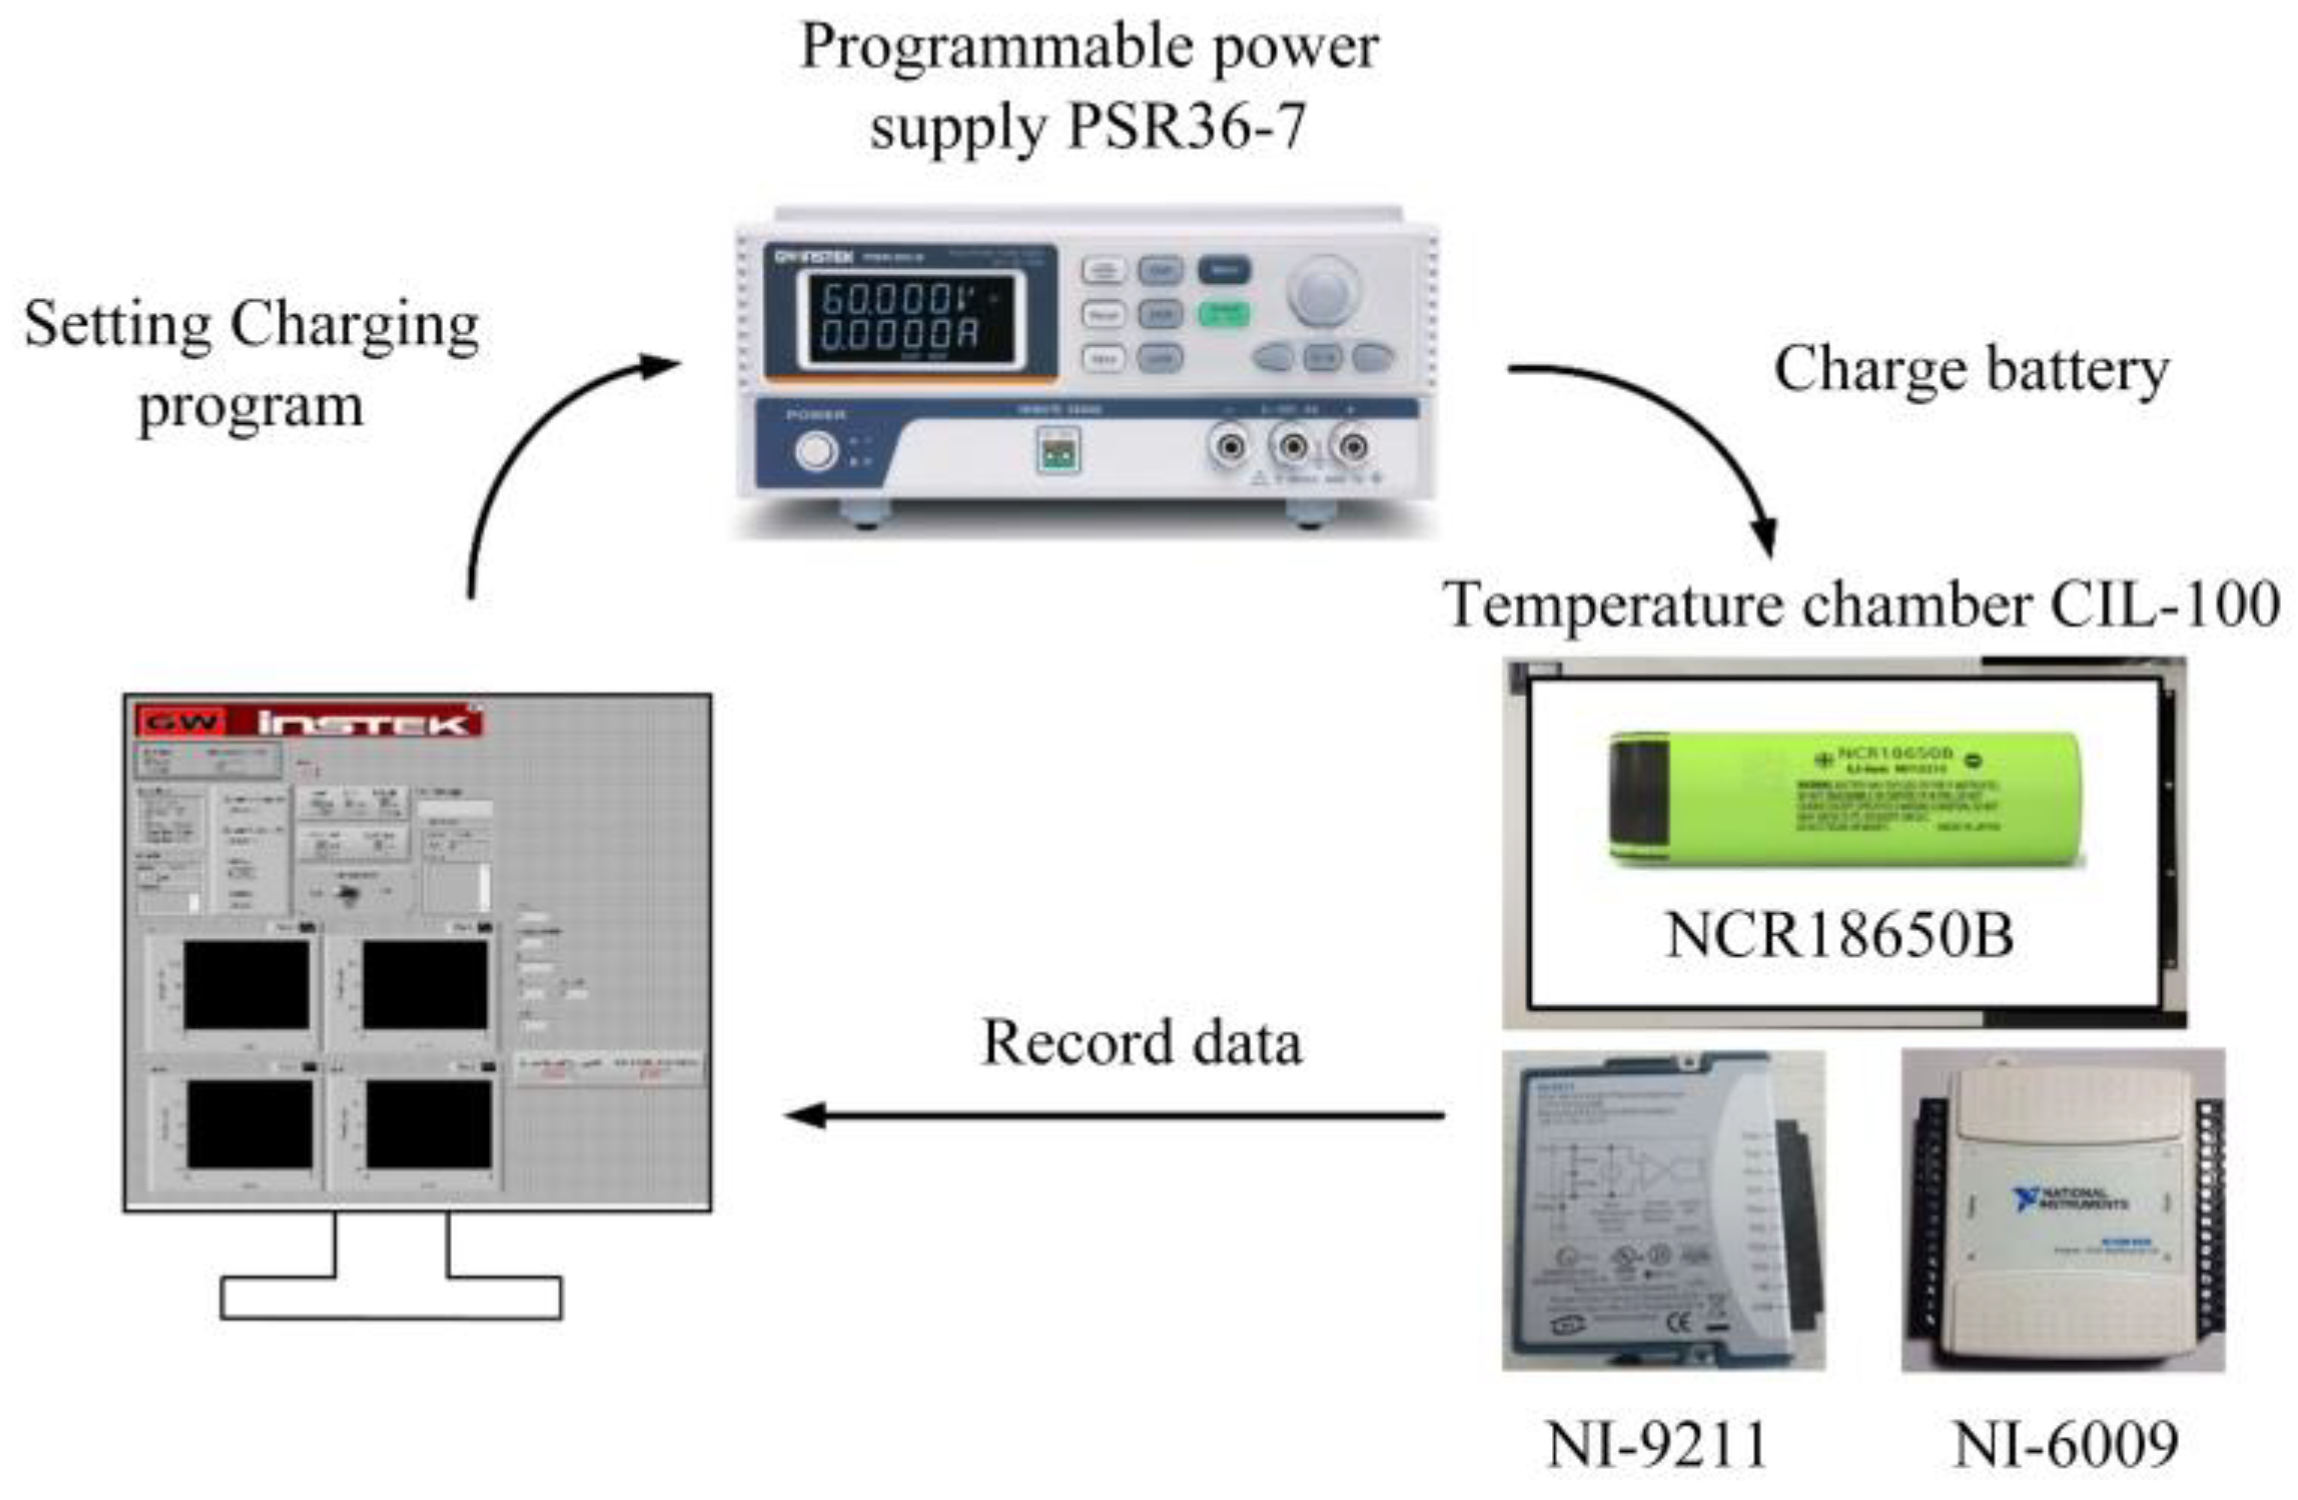
4.1. Test Environment

The experimental setup, as illustrated in Figure 19, utilizes a LabVIEW monitoring interface for control. This interface facilitates the configuration of charging current and voltage settings, offering real-time monitoring of battery voltage, current, and temperature. The charging process is executed using the programmable power supply PSR 36-7, while the battery remains placed within a temperature-controlled chamber, specifically the CIL-100 environmental chamber, maintained at 25 °C. Subsequently, temperature data is recorded using the NI-9211DAQ temperature logger, and voltage data is recorded using the NI-6009DAQ voltage logger. These recorded values are then transmitted back to the LabVIEW monitoring interface for documentation.

4.2. Introduction of the Chosen Battery

Before conducting battery experiments, it is imperative to have a certain level of understanding about the battery itself. This understanding is crucial for operating within safe voltage and current ranges during charge and discharge cycles, thereby preventing excessive charge and discharge that could adversely affect the battery’s lifespan. In this study, the chosen battery is the NCR18650B lithium-ion battery from Panasonic, a globally recognized brand. The battery’s physical appearance is depicted in Figure 20, and its specifications are outlined in Table 2.

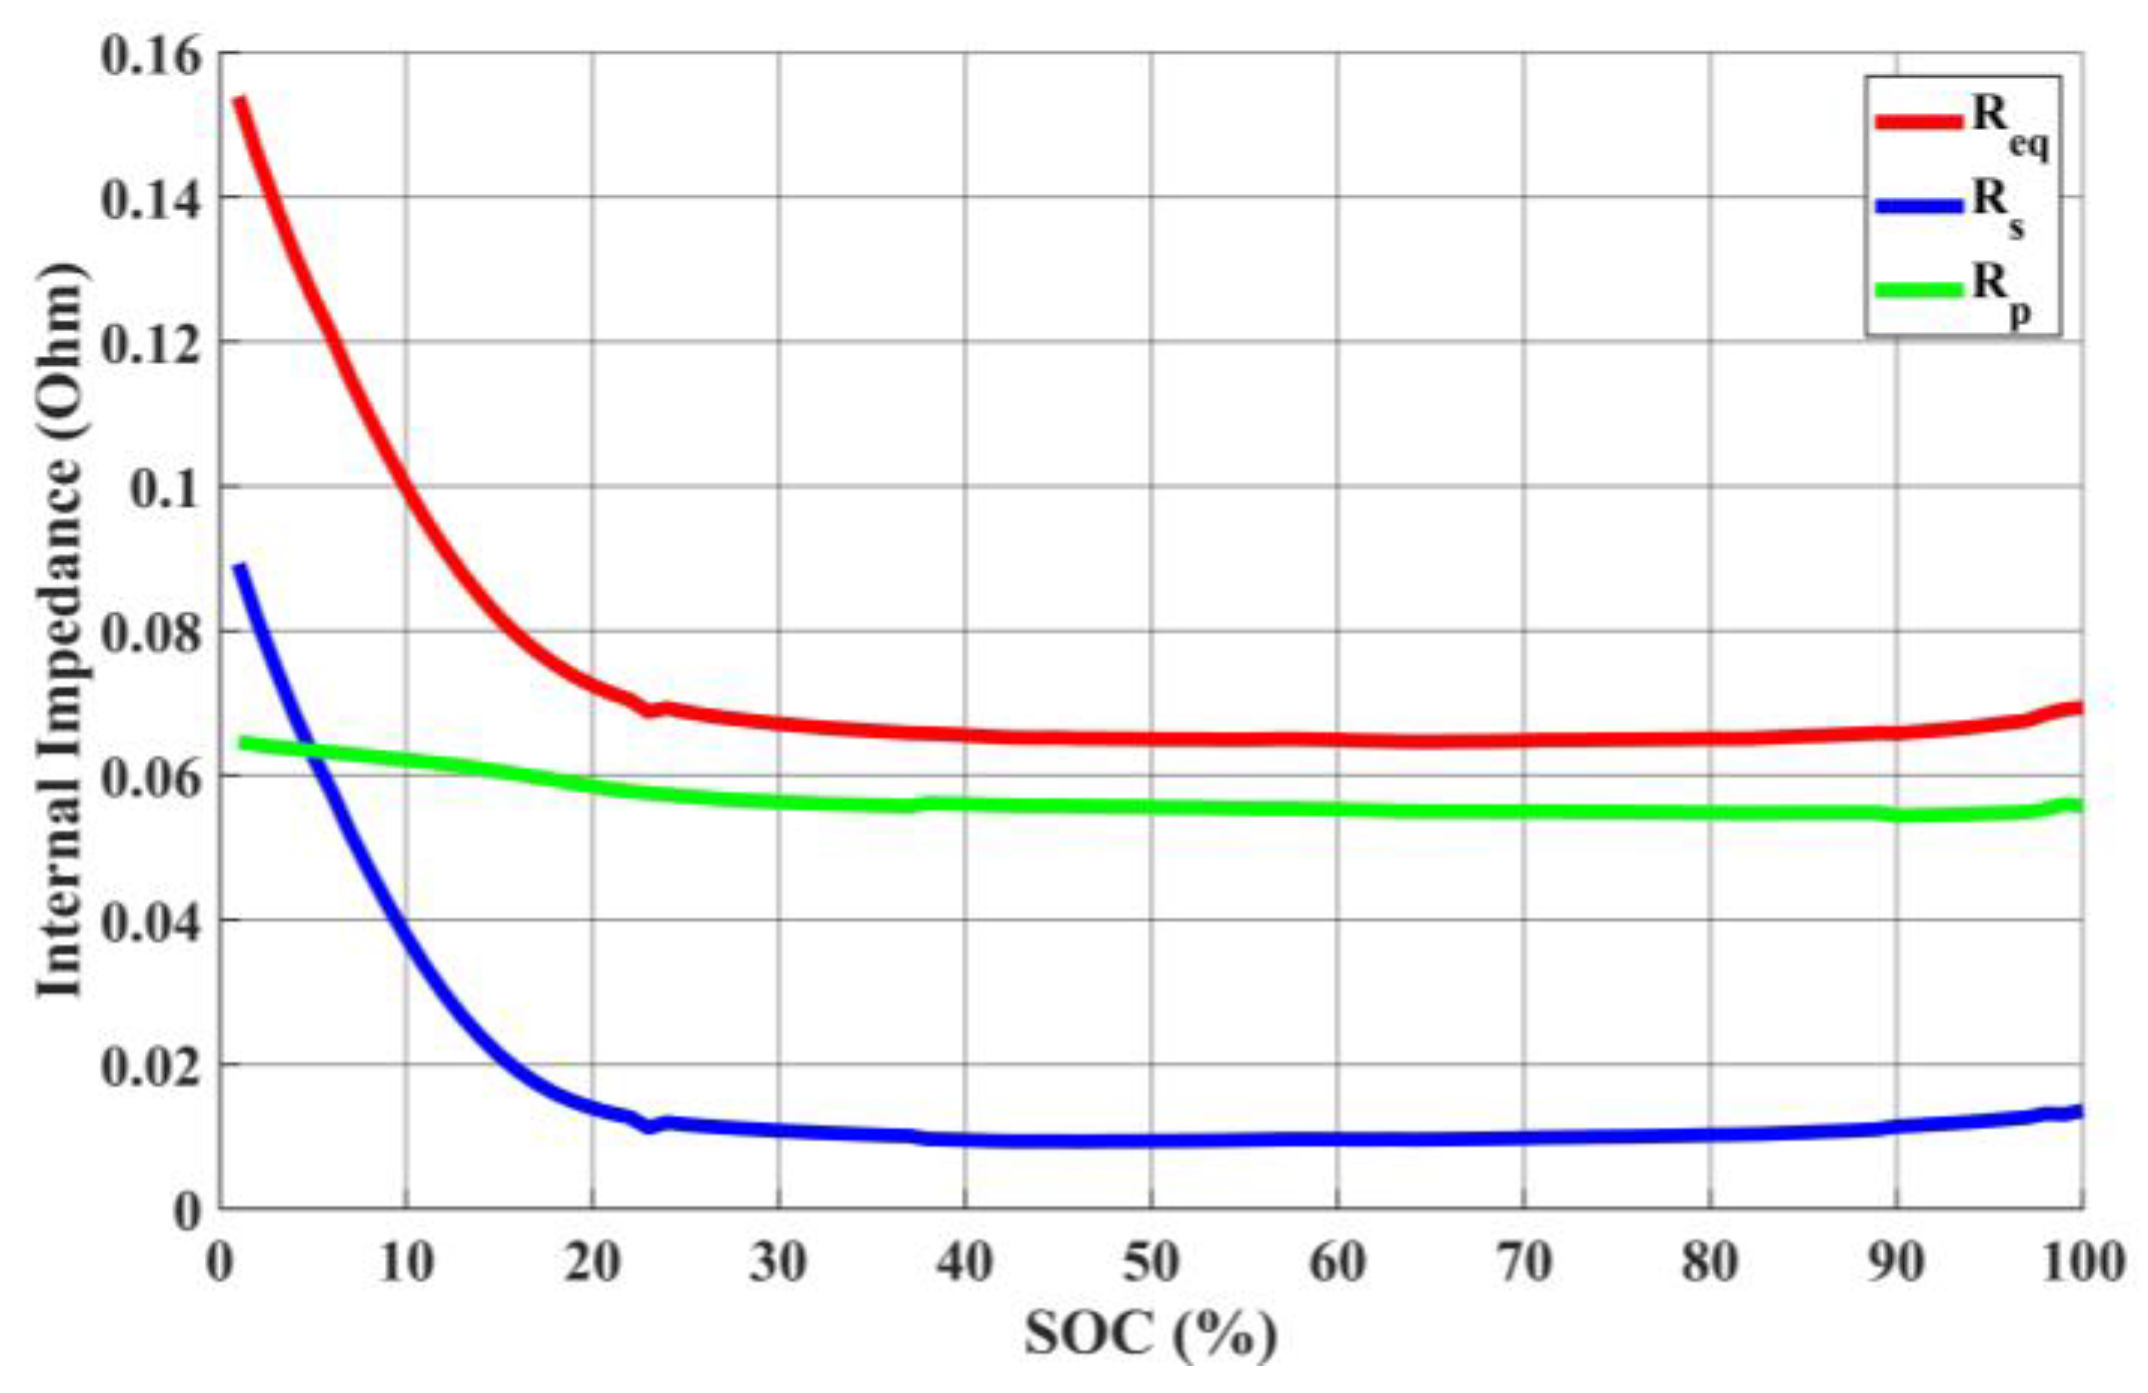
4.3. AC Impedance Parameters

AC impedance serves as a fundamental cornerstone for the equivalent circuit model. During the discharge process, each discharge cycle is set to a 1% discharge increment, starting from the initial full capacity value. As a result, a total of 101 data points are acquired within the range of 100% to 0% state of charge. Figure 21 illustrates the relationship curves among the series resistance (Rs), parallel resistance (Rp), and equivalent impedance (Req) at different remaining capacities. The equivalent impedance (Req) is the sum of the series resistance (Rs) and the parallel resistance (Rp). The relationship curve between the open-circuit voltage (Voc) and different remaining capacities is depicted in Figure 22.

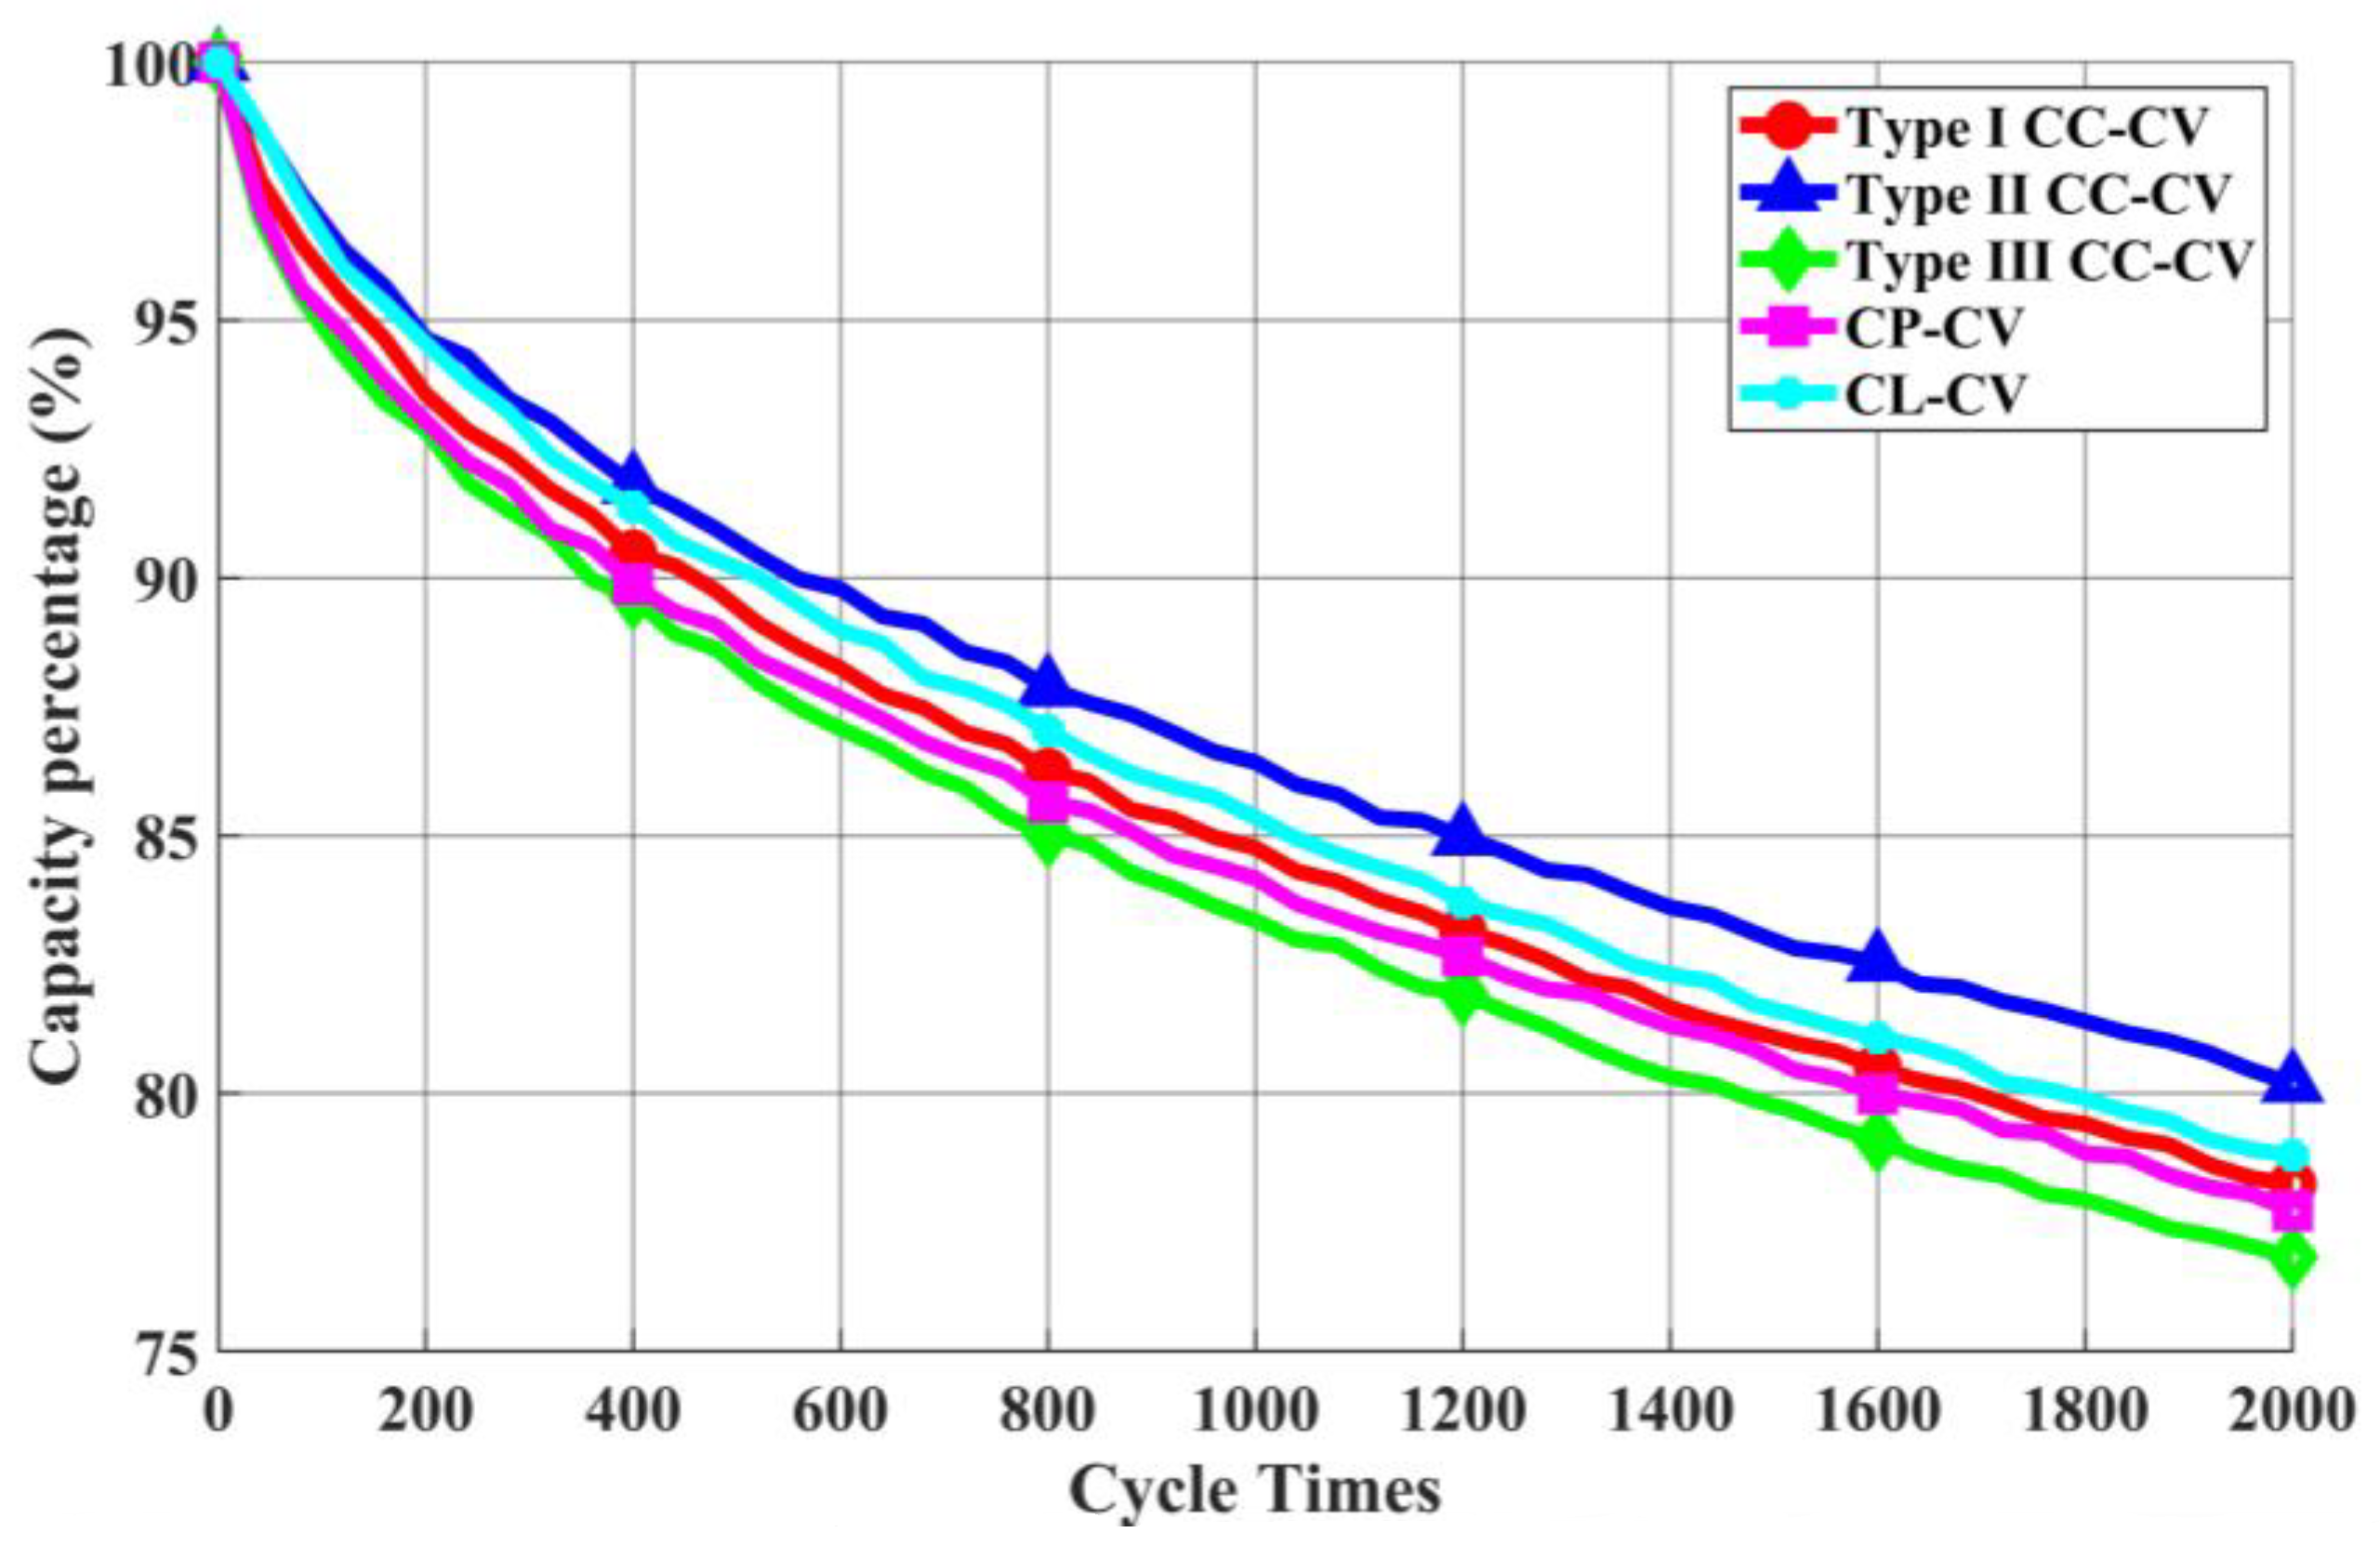
4.4. Comparison of Charging Methods

The preceding sections have provided a comprehensive overview of Type I CC-CV, Type II CC-CV, Type III CC-CV, CP-CV, and CL-CV charging methods. In this section, a comparative analysis will be conducted based on experimental characteristics including charging efficiency, charging duration, and temperature rise. The definition of temperature rise is given by Equation (5).
T e m p e r a t u r e   R i s e = S u r f a c e   t e m p e r a t u r e   o f   b a t t e r y - A m b i e n t   T e m p e r a t u r e
As depicted in Figure 23, Figure 24 and Figure 25, we present the current, temperature rise, and voltage profiles for Type I CC-CV, Type II CC-CV, and Type III CC-CV charging methods, respectively. Notably, Type II CC-CV exhibits the lowest termination voltage during its initial stage compared to Type I CC-CV and Type III CC-CV charging methods. Consequently, it boasts a shorter charging time, along with lower maximum and average temperature rises. Considering that the primary constraint for lithium-ion battery charging is maintaining the internal voltage below 4.2 V, the Type III CC-CV charging method determines the charging process’s internal voltage using the battery’s equivalent circuit model to prevent surpassing this limit. Therefore, the transition voltage during the first stage of charging is higher in Type III CC-CV, leading to a shorter charging time compared to Type I CC-CV. The maximum and average temperature rises are similar to those in the Type I CC-CV charging method.
As illustrated in Figure 26 and Figure 27, a comparison is made by introducing the CP-CV and CL-CV charging methods. The charging profiles of each method, calculated using the rated current and obtained from actual charging, are shown. At the initial stage of charging, the CP-CV charging method exhibits a higher charging current than the Type I CC-CV charging method, resulting in a shorter charging time and a faster increase in battery surface temperature. However, due to the quicker attainment of the transition voltage during the first stage, its maximum temperature rise remains lower than that of the Type I CC-CV charging method.
On the other hand, the CL-CV charging method experiences a higher initial equivalent impedance of the battery, leading to a gradual increase in charging current from low to high. Consequently, the temperature rise is slower, and it takes longer to reach the transition voltage during the first stage. As a result, the overall charging time for the CL-CV charging method is longer than that of the Type I CC-CV method.
As shown in Table 3, a comprehensive comparison of various charging methods is presented. From Table 3, it is evident that in comparison to the Type I CC-CV charging method, the Type II CC-CV method exhibits lower maximum and average temperature rises, higher charging efficiency, and shorter charging time. Similarly, the Type III CC-CV method performs well in terms of maximum temperature rise, charging efficiency, and charging time, even though its average temperature rise is slightly higher. Both the CP-CV and CL-CV charging methods, except for lower charging percentages, demonstrate favorable performance across various metrics including maximum temperature rise, average temperature rise, charging efficiency, and charging time. Here, the charging percentage is defined as indicated in Equation (6), and charging efficiency is defined as per Equation (7). The average temperature rise is calculated by (8) where the charging time is over the whole period of the charging method itself.
Charging   p e r c e n t a g e ( % ) = Charging   C a p a c i t y R a t e d   c a p a c i t y × 100 %
Charging   e f f i c i e n c y ( % ) = D i s c h a r g e C a p a c i t y C h a r g e C a p a c i t y × 100 %
A v e r a g e   t e m p e r a t u r e   r i s e = 0 Charging   t i m e Δ T ( t )   d t Charging   t i m e
The Type II CC-CV charging method exhibits the best performance in terms of maximum temperature rise, while the CL-CV charging method excels in average temperature rise. Except for the Type I CC-CV charging method, the other charging methods proposed in this study show similar charging efficiency performance. The Type I CC-CV method demonstrates the best charging percentage performance. Regarding charging time, the Type II CC-CV method performs the best, though with lower charging capacity. If a higher charging capacity is required, the CP-CV method performs better. Compared to the Type I CC-CV charging method, the Type II CC-CV charging method exhibits a 1.54% higher charging efficiency, a 10.55% lower charging percentage, and improvements of 4.94%, 9.74%, and 6.27% in terms of maximum temperature rise, average temperature rise, and charging time, respectively. For the Type III CC-CV charging method, there is a 0.39% increase in average temperature rise and a 1.1% decrease in charging percentage, but improvements of 1.09%, 1.54%, and 1.08% in maximum temperature rise, charging efficiency, and charging time, respectively. Both the CP-CV and CL-CV charging methods, apart from having slightly lower charging percentages compared to the Type I CC-CV method, demonstrate significant improvements in all indicators. The CP-CV method shows improvements of 2.31%, 2.14%, 1.54%, and 4.74% in maximum temperature rise, average temperature rise, charging efficiency, and charging time, respectively. Similarly, the CL-CV method shows improvements of 2.1%, 11.29%, 1.65%, and 0.21% in maximum temperature rise, average temperature rise, charging efficiency, and charging time, respectively.
Next, this study proceeds with cycle life testing of various charging methods, where the remaining capacity percentage is defined as shown in Equation (9). As depicted in the actual cycle life testing graph in Figure 28, a total of 2000 cycle life tests were conducted. The analysis focuses on scenarios where the remaining capacity percentage drops to 90% and 80% of the rated remaining capacity. When the remaining capacity percentage decreases to 90% of the rated remaining capacity, the Type I CC-CV charging method reaches up to 441 cycles, Type II CC-CV reaches 523 cycles, Type III CC-CV reaches 323 cycles, CP-CV reaches 362 cycles, and CL-CV reaches 520 cycles. When the remaining capacity percentage decreases to 80% of the rated remaining capacity, the Type I CC-CV charging method reaches up to 1888 cycles, Type II CC-CV reaches 2245 cycles, Type III CC-CV reaches 1616 cycles, CP-CV reaches 1749 cycles, and CL-CV reaches 1978 cycles.
Remaining c a p a c i t y p e r c e n t a g e ( % ) = T h i s d i s c h a r g e c a p a c i t y F i r s t d i s c h a r g e c a p a c i t y × 100 %

5. Conclusions

This study presents five charging methods for lithium-ion batteries, including Type I CC-CV, Type II CC-CV, Type III CC-CV, CL-CV, and CP-CV. Type I CC-CV represents the standard CC-CV charging method, serving as the baseline for comparison. Type II CC-CV improves the maximum temperature rise, average temperature rise, charging efficiency, charging speed, and cycle life of lithium-ion batteries by lowering the cutoff voltage in the first stage of charging. Compared to the Type I CC-CV charging method, Type II CC-CV shows improvements of 14.09% in maximum temperature rise, 9.74% in average temperature rise, 1.54% in charging efficiency, 6.27% in charging time, and an increase of 357 charging cycles when the remaining capacity percentage drops to 80% of the rated capacity. Type III CC-CV integrates an equivalent circuit model and considers the battery’s internal voltage to enhance the maximum temperature rise, charging efficiency, and charging time during lithium-ion battery charging. Compared to the Type I CC-CV charging method, Type III CC-CV shows improvements of 1.09% in maximum temperature rise, 1.54% in charging efficiency, and 1.08% in charging time. CP-CV employs a fixed battery power approach to enhance the maximum temperature rise, charging efficiency, and charging time during lithium-ion battery charging. Compared to the Type I CC-CV charging method, CP-CV demonstrates improvements of 2.31% in maximum temperature rise, 2.14% in average temperature rise, 1.54% in charging efficiency, and 4.74% in charging time. CL-CV integrates an equivalent circuit model and fixes the battery’s internal losses to improve the maximum temperature rise, charging efficiency, and charging speed during lithium-ion battery charging. Compared to the Type I CC-CV charging method, CL-CV shows improvements of 2.1% in maximum temperature rise, 11.29% in average temperature rise, 1.65% in charging efficiency, and 0.21% in charging time.
For applications that prioritize the effects of aging on batteries or require operation in higher temperature environments, Type II CC-CV can be selected as the charging algorithm for lithium-ion batteries. Type III CC-CV provides a charging capacity similar to the standard CC-CV charging method but with improved charging time and efficiency. If one is aiming for a similar charging capacity to the standard CC-CV charging method while emphasizing charging speed, CP-CV can be chosen as the charging algorithm for lithium-ion batteries. For applications that emphasize temperature rise and charging efficiency, CL-CV can be chosen as the charging algorithm for lithium-ion batteries.

Author Contributions

Conceptualization, G.-J.C.; methodology, G.-J.C.; software, W.-H.C.; validation, W.-H.C.; formal analysis, W.-H.C.; writing—original draft preparation, G.-J.C.; writing—review and editing, G.-J.C.; supervision, G.-J.C. All authors have read and agreed to the published version of the manuscript.

Funding

This work was supported by the National Science and Technology Council, Taiwan, under grant number of NSTC 111-2222-E-167-004.

Data Availability Statement

No new data were created or analyzed in this study. Data sharing is not applicable to this article.

Acknowledgments

This work was supported by the National Science and Technology Council, Taiwan, under grant number of NSTC 111-2222-E-167-004, we would like to express our appreciation to them.

Conflicts of Interest

The authors declare no conflict of interest.

References

  1. Tian, Y.; Lin, C.; Li, H.; Du, J.; Xiong, R. Detecting undesired lithium plating on anodes for lithium-ion batteries—A review on the in-situ methods. Appl. Energy 2021, 300, 117386. [Google Scholar] [CrossRef]
  2. Tomaszewska, A.; Chu, Z.; Feng, X.; O’Kane, S.; Liu, X.; Chen, J.; Ji, C.; Endler, E.; Li, R.; Liu, L.; et al. Lithium-ion battery fast charging: A review. eTransportation 2019, 1, 100011. [Google Scholar] [CrossRef]
  3. Hemavathi, S.; Shinisha, A. A study on trends and developments in electric vehicle charging technologies. J. Energy Storage 2022, 52, 105013. [Google Scholar] [CrossRef]
  4. Yang, B.; Wang, J.; Cao, P.; Zhu, T.; Shu, H.; Chen, J.; Zhang, J.; Zhu, J. Classification, summarization and perspectives on state-of-charge estimation of lithium-ion batteries used in electric vehicles: A critical comprehensive survey. J. Energy Storage 2021, 39, 102572. [Google Scholar] [CrossRef]
  5. Hsieh, G.-C.; Chen, L.-R. Fuzzy controlled Lithium-Ion Battery Charge System with Active State of Charge Controller. IEEE Trans. Ind. Electron. 2001, 48, 585–593. [Google Scholar] [CrossRef]
  6. Chen, L.-R. PLL-Based Battery Charge Circuit Topology. IEEE Trans. Ind. Electron. 2004, 51, 1344–1346. [Google Scholar] [CrossRef]
  7. Chen, L.-R.; Chen, J.-J.; Chu, N.-Y.; Han, G.-Y. Current pumped battery charger. IEEE Trans. Ind. Electron. 2008, 55, 2483–2488. [Google Scholar]
  8. Chen, L.-R.; Hsu, R.C.; Liu, C.-S. A Design of a Grey-Predicted Lithium-Ion Battery Charge System. IEEE Trans. Ind. Electron. 2004, 51, 3692–3701. [Google Scholar]
  9. Wang, S.-C.; Chen, G.-J.; Liu, Y.-H. Adaptive Charging Strategy with Temperature Rise Mitigation and Cycle Life Extension for Li-ion Batteries. CPSS Trans. Power Electron. Appl. 2018, 3, 202–212. [Google Scholar] [CrossRef]
  10. De Jongh, P.E.; Notten, P.H.L. Effect of Current Pulses on Lithium Intercalation Batteries. Solid State Ion. 2002, 148, 259–268. [Google Scholar] [CrossRef]
  11. Li, J.; Murphy, E.; Winnick, J.; Kohl, P.A. The Effects of Pulse Charging on Cycling Characteristics of Commercial Lithium-Ion Batteries. J. Power Sources 2001, 102, 302–309. [Google Scholar] [CrossRef]
  12. Chen, L.-R. A design of an optimal battery pulse charge system by frequency-varied technique. IEEE Trans. Ind. Electron. 2007, 54, 398–405. [Google Scholar] [CrossRef]
  13. Chen, L.-R. A design of Duty-Varied Voltage Pulse Charger for Improving Lithium-Ion Battery-Charging Response. IEEE Trans. Ind. Electron. 2009, 56, 480–487. [Google Scholar] [CrossRef]
  14. Niroshana, S.M.I.; Sirisukprasert, S. Adaptive Pulse Charger for Li-Ion Batteries. In Proceedings of the 8th International Conference of Information and Communication Technology for Embedded Systems (IC-ICTES), Chonburi, Thailand, 7–9 May 2017. [Google Scholar]
  15. Chen, L.-R.; Chen, J.-J.; Ho, C.-M.; Wu, S.-L.; Shieh, D.-T. Improvement of Li-ion Battery Discharging Performance by Pulse and Sinusoidal Current Strategies. IEEE Trans. Ind. Electron. 2013, 60, 5620–5628. [Google Scholar] [CrossRef]
  16. Amanor-Boadu, J.M.; Guiseppi-Elie, A.; Sánchez-Sinencio, E. Search for Optimal Pulse Charging Parameters for Li-Ion Polymer Batteries Using Taguchi Orthogonal Arrays. IEEE Trans. Ind. Electron. 2018, 65, 8982–8992. [Google Scholar] [CrossRef]
  17. Vo, T.T.; Chen, X.; Shen, W.; Kapoor, A. New charging strategy for Li-ion batteries based on the integration of Taguchi method and state of charge estimation. J. Power Sources 2015, 273, 413–422. [Google Scholar] [CrossRef]
  18. Liu, Y.-H.; Luo, Y.-F. Search for an optimal rapid charging pattern for Li-ion batteries using Taguchi approach. IEEE Trans. Ind. Electron. 2010, 57, 3963–3971. [Google Scholar] [CrossRef]
  19. Liu, Y.-H.; Hsieh, C.-H.; Luo, Y.-F. Search for an Optimal Five-Step Charging Pattern for Li-Ion Batteries Using Consecutive Orthogonal Arrays. IEEE Trans. Energy Convers. 2011, 26, 654–661. [Google Scholar] [CrossRef]
  20. Liu, Y.-H.; Teng, J.-H.; Lin, Y.-C. Search for an optimal rapid charging pattern for Li-ion batteries using ant colony system algorithm. IEEE Trans. Ind. Electron. 2005, 52, 1328–1336. [Google Scholar] [CrossRef]
  21. Wang, S.-C.; Liu, Y.-H. A PSO-based fuzzy-controlled searching for the optimal charge pattern of Li-ion batteries. IEEE Trans. Ind. Electron. 2015, 62, 2983–2993. [Google Scholar] [CrossRef]
  22. Khan, A.B.; Choi, W. Optimal Charge Pattern for the High-Performance Multistage Constant Current Charge Method for the Li-Ion Batteries. IEEE Trans. Energy Convers. 2018, 33, 1132–1140. [Google Scholar] [CrossRef]
  23. Dung, L.-R.; Yen, J.-H. ILP-based algorithm for Lithium-ion battery charging profile. In Proceedings of the 2010 IEEE International Symposium on Industrial Electronics, Bari, Italy, 4–7 July 2010. [Google Scholar]
  24. Chen, G.-J.; Liu, Y.-H.; Wang, S.-C.; Luo, Y.-F.; Yang, Z.-Z. Searching for the optimal current pattern based on grey wolf optimizer and equivalent circuit model of Li-ion batteries. J. Energy Storage 2021, 33, 101933. [Google Scholar] [CrossRef]
  25. Lee, C.-H.; Chen, M.-Y.; Hsu, S.-H.; Jiang, J.-A. Implementation of an SOC-based four-stage constant current charger for Li-ion batteries. J. Power Sources 2018, 18, 528–537. [Google Scholar] [CrossRef]
  26. Saidani, F.; Hutter, F.X.; Scurtu, R.G.; Braunwarth, W.; Burghartz, J.N. Lithium-ion battery models: A comparative study and a model-based powerline communication. Adv. Radio Sci. 2017, 15, 83–91. [Google Scholar] [CrossRef]
  27. Petit, M.; Prada, E.; Sauvant-Moynot, V. Development of an empirical aging model for Li-ion batteries and application to assess the impact of Vehicle-to-Grid strategies on battery lifetime. Appl. Energy 2016, 172, 398–407. [Google Scholar] [CrossRef]
  28. Kurc, B.; Pigłowska, M.; Rymaniak, Ł.; Fuć, P. Modern Nanocomposites and Hybrids as Electrode Materials Used in Energy Carriers. Nanomaterials 2021, 11, 538. [Google Scholar] [CrossRef]
Figure 1. Internal Physical Processes of Lithium-Ion Batteries.
Electronics 12 04095 g001
Figure 2. Empirical electrothermal and empirical aging model.
Electronics 12 04095 g002
Figure 3. Ideal Battery Equivalent Circuit.
Electronics 12 04095 g003
Figure 4. Linear Battery Equivalent Circuit.
Electronics 12 04095 g004
Figure 5. Thevenin Battery Equivalent Circuit.
Electronics 12 04095 g005
Figure 6. Nyquist Plot of Battery Impedance Effect.
Electronics 12 04095 g006
Figure 7. The flow chart of AC impedance analysis.
Electronics 12 04095 g007
Figure 8. Experimental Procedure for AC Impedance Analysis.
Electronics 12 04095 g008
Figure 9. Nyquist plots at different remaining capacities using EC-Lab.
Electronics 12 04095 g009
Figure 10. The operating interface of EC-Lab for AC impedance analysis.
Electronics 12 04095 g010
Figure 11. Current–voltage curve for Type I CC-CV charging profile.
Electronics 12 04095 g011
Figure 12. Current–voltage curve for Type II CC-CV charging profile.
Electronics 12 04095 g012
Figure 13. Current–voltage curve for Type III CC-CV charging profile.
Electronics 12 04095 g013
Figure 14. Type III CC-CV Charging Method Flowchart.
Electronics 12 04095 g014
Figure 15. Current–voltage curve for CL-CV charging profile.
Electronics 12 04095 g015
Figure 16. CL-CV Charging Method Flowchart.
Electronics 12 04095 g016
Figure 17. Current–voltage curve for CP-CV charging profile.
Electronics 12 04095 g017
Figure 18. The Flowchart of the Constant Power–Constant Voltage Charging Method.
Electronics 12 04095 g018
Figure 19. The Schematic of the Experimental Setup.
Electronics 12 04095 g019
Figure 20. NCR18650B Lithium-Ion Battery.
Electronics 12 04095 g020
Figure 21. Relationship between each resistor and SOC.
Electronics 12 04095 g021
Figure 22. Relationship between open circuit voltage Voc and SOC.
Electronics 12 04095 g022
Figure 23. Comparison of Charging Currents in Each CC-CV Charging Method.
Electronics 12 04095 g023
Figure 24. Comparison of Temperature Rise in Each CC-CV Charging Method.
Electronics 12 04095 g024
Figure 25. Comparison of Charging Voltage in Each CC-CV Charging Method.
Electronics 12 04095 g025
Figure 26. Comparison of Charging Currents in Each Charging Method.
Electronics 12 04095 g026
Figure 27. Comparison of Temperature Rise in Each Charging Method.
Electronics 12 04095 g027
Figure 28. Comparison of cycle life in each charging method.
Electronics 12 04095 g028
Table 1. Comparison of lithium-ion battery models [26].
Model TypeAccuracyComplexityPhysical InsightsApplication
Physical ModelHighHigh
(>50 parameters)
YesBattery System Design
Empirical ModelMediumLow
(2–3 parameters)
LimitedPredicting Lifetime and Efficiency
Abstract ModelMediumMedium
(20–30 parameters)
ModerateReal-time monitoring
Table 2. NCR18650B Battery Specifications.
Panasonic NCR18650B
Related Capacity3350 mAh
Minimum Related capacity3250 mAh
Related Voltage3.6 V
Standard Charging ConditionsCC-CV 1625 mA, 4.2 V, 4 h
Weight48.5 g
Temperature During Charging0~45 °C
Temperature During Discharging−20~60 °C
Table 3. Comprehensive Comparison Table of Charging Methods.
Charging MethodType I CC-CVType II
CC-CV
Type III
CC-CV
CP-CVCL-CV
Maximum temperature rise (°C)/IP (%)5.8965.605
(+4.94%)
5.832
(+1.09%)
5.76
(+2.31%)
5.772
(+2.1%)
Average temperature rise (°C)/IP (%)2.8442.567
(+9.74%)
2.855
(−0.39%)
2.783
(+2.14%)
2.523
(+11.29%)
Charging capacity (Ahr)/IP (%)3.0962.771
(−10.55%)
3.062
(1.10%)
3.016
(−2.58%)
3.014
(−2.65%)
Discharge capacity (Ahr)/IP (%)3.0062.732
(−9.12%)
3.021
(+0.5%)
2.972
(−1.13%)
2.975
(−1.03%)
Charging efficiency (%)/IP (%)97.198.6
(+1.54%)
98.6
(+1.54%)
98.6
(+1.54%)
98.7
(+1.65%)
Charging percentage (%)/IP (%)99.589.0
(−10.55%)
98.4
(−1.11%)
96.9
(−2.61%)
96.8
(−2.71%)
Charging time (s)/IP (%)61775790
(+6.27%)
6110
(1.08%)
5884
(+4.74%)
6164
(+0.21%)
IP represents improvement when compare with the Type I CC-CV charging method.
Disclaimer/Publisher’s Note: The statements, opinions and data contained in all publications are solely those of the individual author(s) and contributor(s) and not of MDPI and/or the editor(s). MDPI and/or the editor(s) disclaim responsibility for any injury to people or property resulting from any ideas, methods, instructions or products referred to in the content.

