Article

A Spatio-Temporal Spotting Network with Sliding Windows for Micro-Expression Detection

1
Qingdao Institute of Software, College of Computer Science and Technology, China University of Petroleum (East China), Qingdao 266580, China
2
National Research Center for Information Science and Technology, Tsinghua University, Beijing 100084, China
3
Computer Vision Center, Universitat Autònoma de Barcelona, 08193 Barcelona, Spain
*
Author to whom correspondence should be addressed.
Electronics 2023, 12(18), 3947; https://doi.org/10.3390/electronics12183947
Submission received: 16 August 2023 / Revised: 10 September 2023 / Accepted: 13 September 2023 / Published: 19 September 2023

Abstract

:
Micro-expressions reveal underlying emotions and are widely applied in political psychology, lie detection, law enforcement and medical care. Micro-expression spotting aims to detect the temporal locations of facial expressions from video sequences and is a crucial task in micro-expression recognition. In this study, the problem of micro-expression spotting is formulated as micro-expression classification per frame. We propose an effective spotting model with sliding windows called the spatio-temporal spotting network. The method involves a sliding window detection mechanism, combines the spatial features from the local key frames and the global temporal features and performs micro-expression spotting. The experiments are conducted on the CAS(ME) 2 database and the SAMM Long Videos database, and the results demonstrate that the proposed method outperforms the state-of-the-art method by 30.58 % for the CAS(ME) 2 and 23.98 % for the SAMM Long Videos according to overall F-scores.

1. Introduction

Macro-expressions are observable with the naked eye, albeit they are deceitful [1], while micro-expressions [2,3] are short-lived and unconscious expressions [4,5] that are harder to spot and recognize. Micro-expressions are more reliable measures for psychological states and are more important in understanding people’s real emotions. They are widely applied in political psychology [6], lie detection [7], law enforcement and medical care [8].
Research on micro-expression analysis primarily focuses on two areas: micro-expression spotting, which involves identifying the onset and apex frames of micro-expressions in videos, and micro-expression recognition, which predicts the category of the micro-expression. Deep learning methods have wide and valuable applications in artificial intelligence [9,10,11], and advances in deep models have contributed to the rapid developments of micro-expression recognition technology. However, micro-expression spotting tasks, particularly in unprocessed raw videos, remain challenging. In 2020, the Third Facial Micro-Expression Grand Challenge (MEGC2020) [12] introduced a new challenge to spot both macro- and micro-expressions from Long Videos, drawing the attention of researchers to the spotting task.
Micro-expression spotting aims to automatically detect the start and end frames of micro-expressions in a video, representing the time interval of the micro-expression action. Traditional machine learning methods rely on manually crafted features. Various feature descriptors are employed, including spatial features such as local binary patterns (LBPs) [13], a histogram of oriented gradients (HOG) [14], integral projection [15] and Riesz pyramid features [16], temporal features such as optical stain [17] and optical flow [18,19,20,21] and features extracted in frequency domains such as the frequency domain feature [22]. Temporal features, such as optical flow vectors, have proven to be highly effective for micro-expression spotting. For example, Shreve et al. [23] partitioned the face into multiple regions, including the forehead, eyes, cheeks and mouth. They employed dense optical flow to extract image features and utilized central difference methods to compute the optical strain magnitude within each region. By comparing these magnitudes with predefined thresholds, they achieved micro-expression detection. In 2011, Shreve et al. [24] combined existing macro-expression and micro-expression databases and employed optical flow for detection. However, both of these approaches focused on non-spontaneous micro-expressions, which were elicited through experimental instructions. Such micro-expression data virtually lacked interference, making them relatively straightforward to detect and observe.
These features are further processed by using various machine learning methods, also called shallow learning methods, such as the chi-square distances of LBP features [25] and Euclidean distance ratio variations in facial landmarks [26]. For example, optical flow vectors were extracted and video segments without micro-expressions were removed by using heuristics [18]. Also, not all frames in a video contribute equally to the spotting task. Feature difference (FD)-based methods [13] usually compute feature differences between the first and last frames in the temporal window instead of using the whole sequence. The main idea of using an FD is to search for distinctive variations within temporal windows.
Deep-learning-based methods have become mainstream solutions in many research fields, particularly in computer vision. Researchers have also applied these methods to micro-expression spotting. For instance, a convolutional neural network (CNN) has been proposed to detect apex frames [27]. Neutral frames and apex frames were first classified by a CNN architecture, and feature engineering methods were introduced to merge nearby detection samples.
Combined networks of spatial and temporal deep models have also been utilized. For example, the framework proposed in [28] consisted of two networks: a spatial network and a temporal network. The spatial network generated spatial feature maps of two adjacent frames, based on which a contrasting feature was obtained to enhance micro-expression spotting. The contrasting feature was then fused with the temporal features extracted by the temporal network to perform micro-expression recognition and apex frame detection.
In addition to the deep learning methods mentioned above for short video clips, there have been studies investigating micro-expression spotting in Long Videos, utilizing various deep learning models such as CNN, 3D-CNN and their variations. For instance, CNN models were employed to extract spatial features from image frames, and a multi-head self-attention model was utilized along with the temporal dimension to analyze the weight of each frame and identify macro- and micro-expression intervals [29]. Variant CNN-based models are also employed. For example, a Concat-CNN model consisting of three streams of convolutional networks with different sizes of convolution kernels [30] was proposed to learn feature correlations among facial action units (AUs) of different frames. In addition, a local bilinear convolutional neural network (LBCNN) [31] was proposed to transform the micro-expression spotting task into a fine-grained image recognition problem. Xue et al. [32] proposed a Two-Stage Macro- and Micro-expression spotting network (TSMSNet) containing two sub-networks: the Triplet-Stream Attention Network (TSANet) and the Spatial–Temporal Classification (STCNet). TSANet processed the horizontal and vertical components of optical flow as well as optical strain in three branches, combining attention mechanisms to extract spatiotemporal features. The STCNet utilized the initial expression intervals inferred by the TSANet to predict multi-scale expression segments.
Multiple-stream-based deep learning models are also employed. For example, a two-stream 3D-CNN used frame skipping and contrast enhancement [33] for micro-expression spotting in Long Videos. Liong et al. [34] proposed the Shallow Optical Flow Three-Stream CNN (SOFTNet) model to estimate a confidence score indicating the probability of a frame belonging to an expression interval. They treated micro-expression spotting as a regression problem and introduced a pseudo-label mechanism combined with a sliding window mechanism to achieve macro-expression and micro-expression detection in Long Videos. In 2022, Liong et al. proposed the multi-temporal stream network (MTSN) model based SOFTNet [34]. This approach computed two optical flow features with different time differences, and each optical flow was processed by the top and bottom SOFTNets. Finally, the feature vectors from two streams were concatenated and utilized for micro-expression detection.
The state-of-the-art micro-expression-spotting methods still have much room for improvement. In this study, we aim to design an effective micro-expression-spotting method. Inspired by the idea of video summarization, we extract representative frames from video sequences that may contain crucial information. The micro-expression spotting problem is then formulated as a classification task to determine whether these key frames contain a micro-expression, a macro-expression or no facial expressions at all. The proposed method extracts both spatial and temporal information to select key frames by analyzing the video structure and spatio-temporal redundancies in the content.
The contributions of this study are listed as the following:
  • A spatio-temporal network with sliding windows is proposed for effective micro-expression spotting.
  • A key-frame-extraction method is fused into the spatio-temporal network so that spatial features of the video clip are denoted as a more concise key-frame-based representation.
  • Experiments show that the proposed model achieves F1-scores of 0.6600 on the CAS(ME) 2 and 0.6091 on the SAMM Long Videos for micro-expression spotting and performs better with a large margin compared with the state-of-the-art methods.

2. The Spatio-Temporal Spotting Network with Sliding Windows

The video sequences are initially processed with a spatial feature extraction module by using a sliding window mechanism. Key frames are then extracted from the resulting feature sequences within the temporal windows. These key frames are further analyzed by a temporal-information-extraction module for facial expression classification, which identifies whether the central frame of the temporal window contains a micro-expression, macro-expression or no expression at all. Figure 1 illustrates the overall structure of the proposed micro-expression-spotting method called STSNet_SW. The codes and models of the proposed method are available at https://github.com/ourpubliccodes/STSNet_SW on 12 September 2023.

2.1. Spatial Information Extraction

Given a video sequence S = I 1 , I 2 , , I n , , I N , where N is the number of frames, the sequence is sampled by using temporal sliding windows of size K. At moment t, the window samples a sub-sequence S t , with I n being the middle frame. And, all sample windows of the video clip can be denoted as S = S 1 , S 2 , , S t , , S T , where T denotes the total number of sliding windows. Note that K is set to five in our experiments, and the first two and last two frames of the video sequence are not sampled as the middle frames of the sliding windows.
The spatial information extraction module employs a residual network (ResNet) model [35] as its backbone and is applied on every frame in a video sequence. At time t, we extract a feature sequence, denoted as P t , from the K samples within the sub-sequence S t . This feature sequence is represented as P t = p 1 , p 2 , , p k , , p K , where p k R C × H × W is the spatial features extracted from the k-th image frame and C , H and W denote the number of channels, the height and the width, respectively.
The model is first initialized with the ImageNet dataset [36]. Due to the relatively low intensity and short duration of the micro-expressions and the limited number of micro-expression training samples, the model tends to overfit. To avoid this, the initialized model is pre-trained on a macro-expression dataset AffectNet [37], which adapts the model from a general image domain to the facial expression domain.

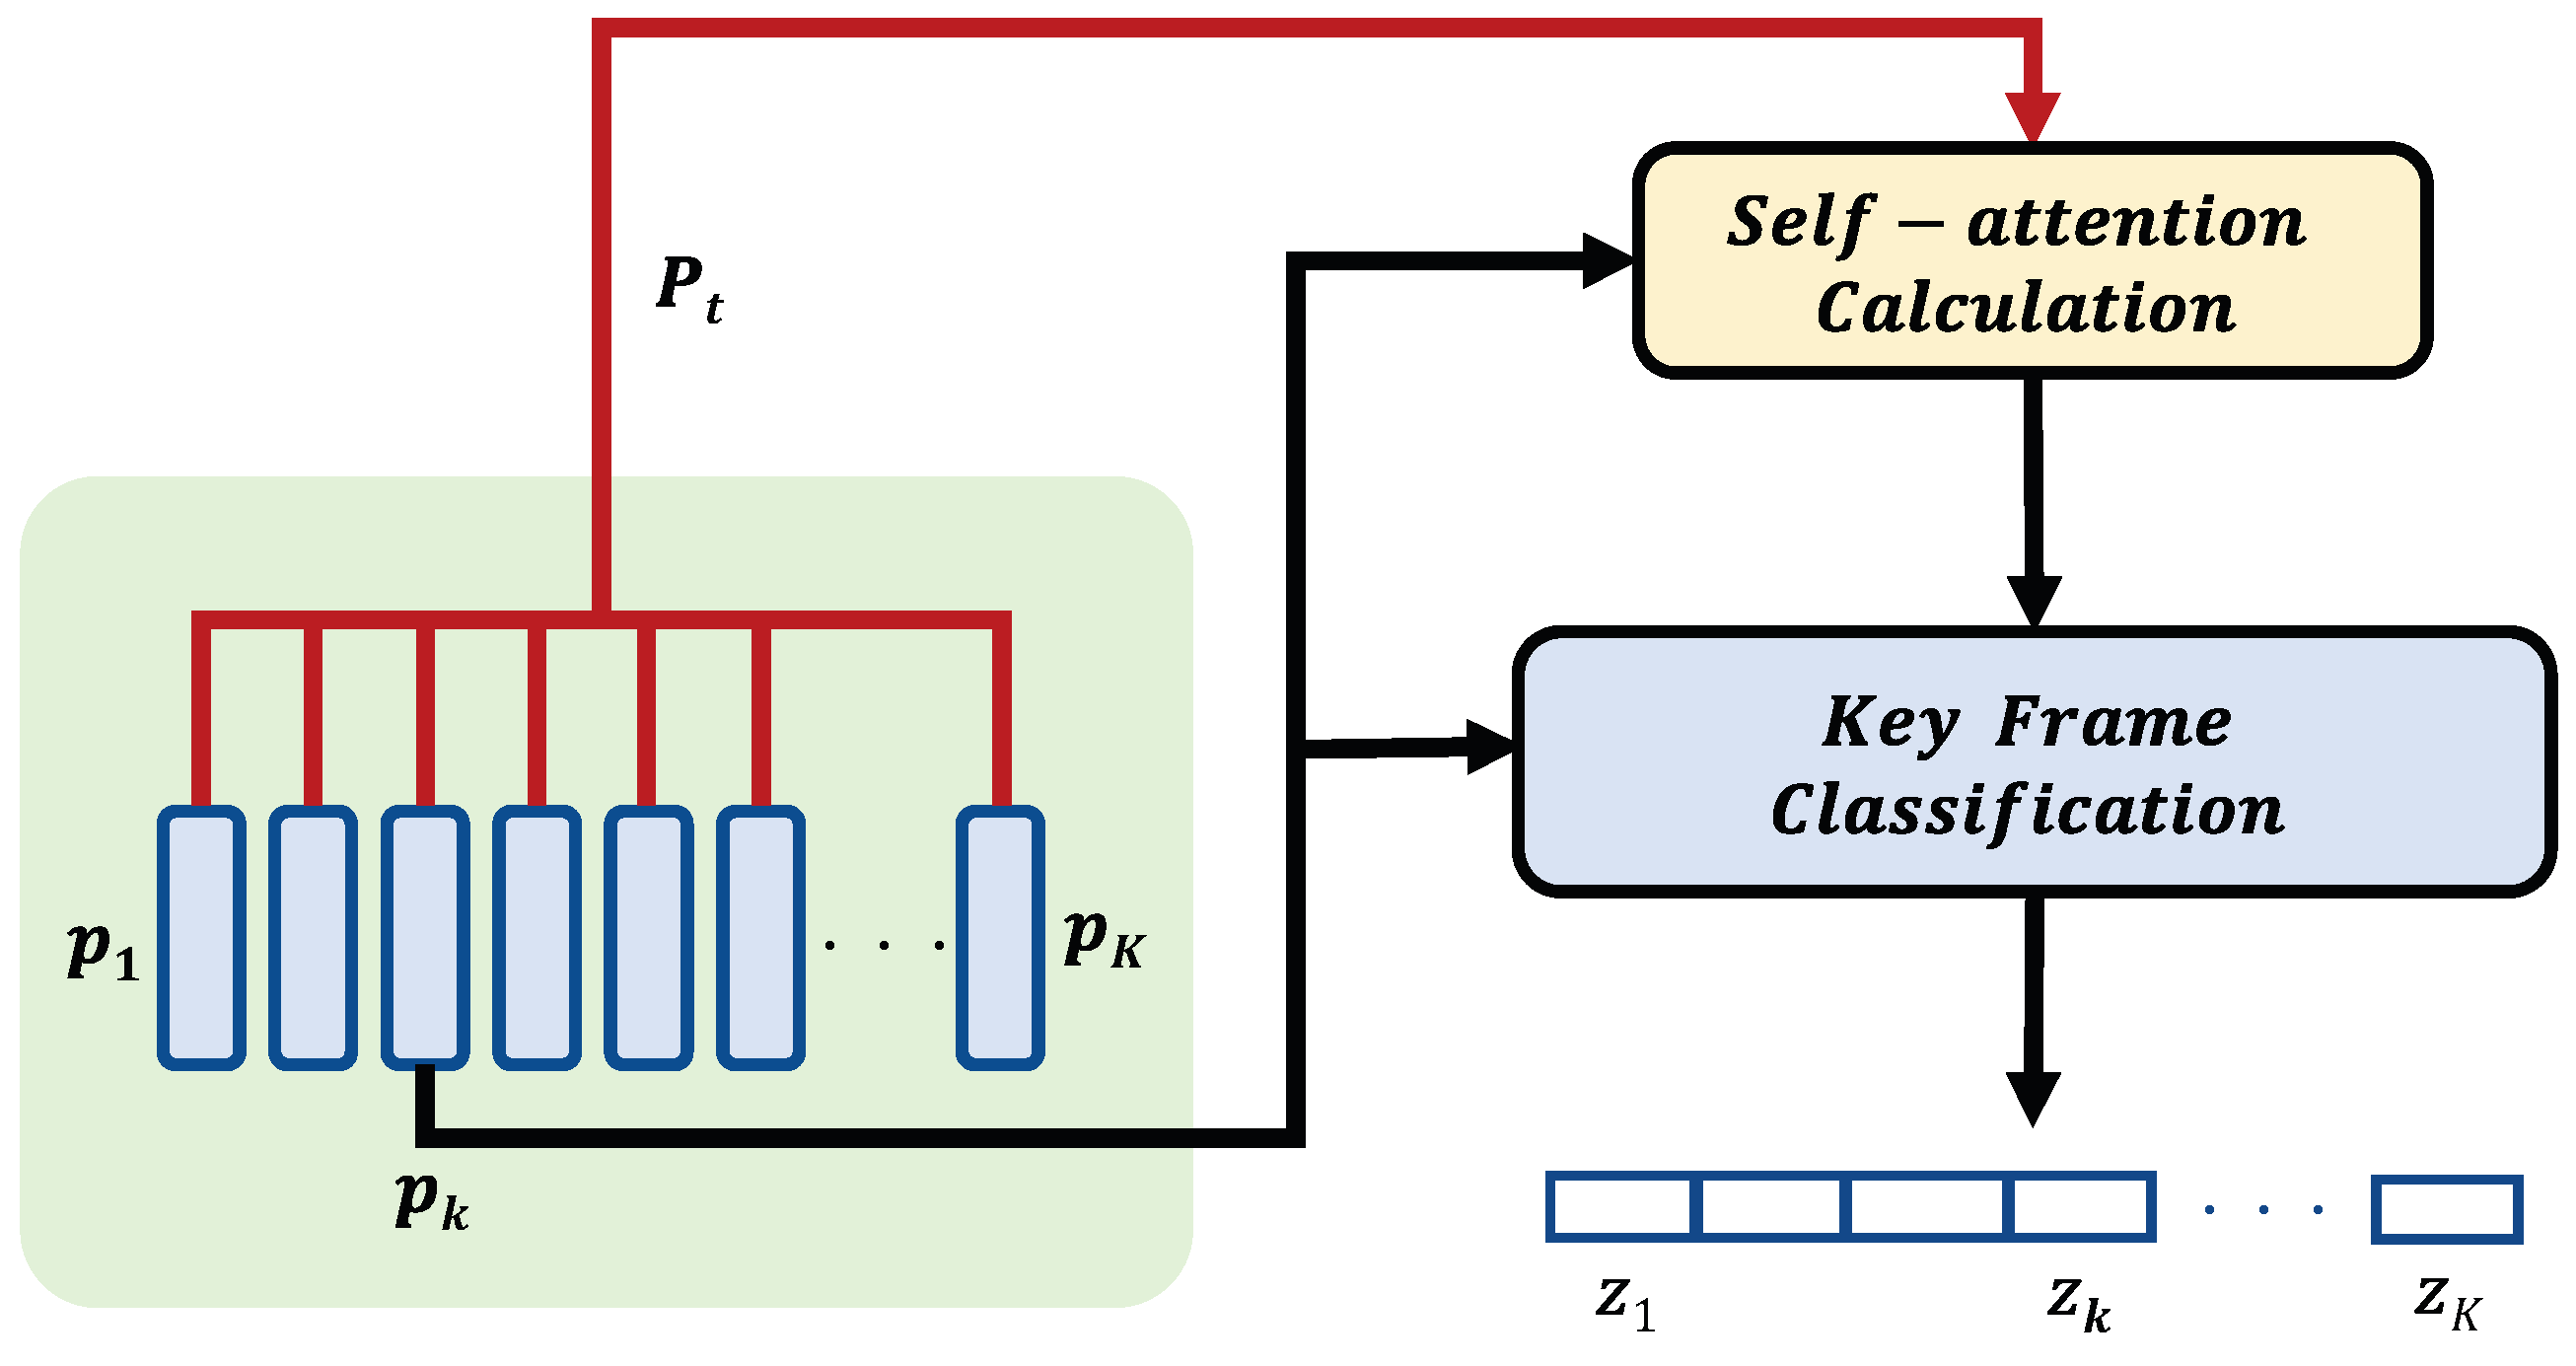
2.2. Key Frames Extraction

Related studies in micro-expression recognition [22,38,39,40] show that the features extracted from the apex frames consist of crucial information and are most effective for facial expression recognition. In a video clip with micro-expressions, most frames are static and contain very few information and are thus redundant, while several frames contain relatively rich information. Motivated by these observations, we introduce a key-frame-extraction module.
The key-frame-extraction module keeps the most representative frames with more distinctive features and abandons invariant frames. The module adopts the idea of video summarization and utilizes a self-attention module and a two-layer fully connected classification network. Figure 2 illustrates the structure of the module.
The self-attention part captures the correlation between the features. The attention vector α ˜ k is computed as the similarity between the extracted feature from the k-th frame and the feature sequence P t . We first calculate the correlation between the spatial feature of the k-th frame and the spatial feature of the i-th frame in the sequence, as formulated in Equation (1):
α k , i = W 1 p i T W 2 p k , i , k 1 , 2 , , K ,
Then, the correlation between the k-th frame and the feature sequence P t is denoted by Equation (2):
α k = W 1 P t T W 2 p k , α k R K × 1 ,
where K denotes the number of frames within a temporal window and W 1 , W 2 are learnable matrices. Then, this correlation vector is normalized by a softmax function to obtain the attention weight vector α ˜ k , calculated as Equation (3):
α ˜ k = S o f t m a x α k .
The attention score α ˜ k , i evaluates the level of attention given to p i by p k . Next, the feature p k is weighted by using the attention vector α ˜ k . Each input feature is first linearly transformed by multiplying with a transformation matrix W 3 . The transformed vector is multiplied by its corresponding attention score, which is followed by a summation to compute the new representation b k , formulated by Equation (4). This vector focuses both on the global and the key information of the whole sequence:
b k = i = 1 K α ˜ k , i W 3 p k .
In the key-frame-classification part, the vector b k is further processed with a linear activation U , a residual sum, a dropout layer D r o p o u t and a normalization layer N o r m , formulated as Equation (5):
g k = N o r m D r o p o u t U b k + p k ,
Two more layers are applied to compute the final scores, as shown in Equation (6). Layer L 1 consists of a ReLU activation layer, a dropout layer and normalization layer, and L 2 contains a single hidden unit with a sigmoid activation:
z k = L 2 L 1 g k .
The output of the key-frame-extraction module is an importance score sequence Z t = z 1 , z 2 , , z k , , z K , z k [ 0 , 1 ) . We rank Z t and take the top M frames as the key frames P k e y , t for the feature sequence P t at time t, where P k e y , t = p k 1 , p k 2 , , p k m , , p k M .

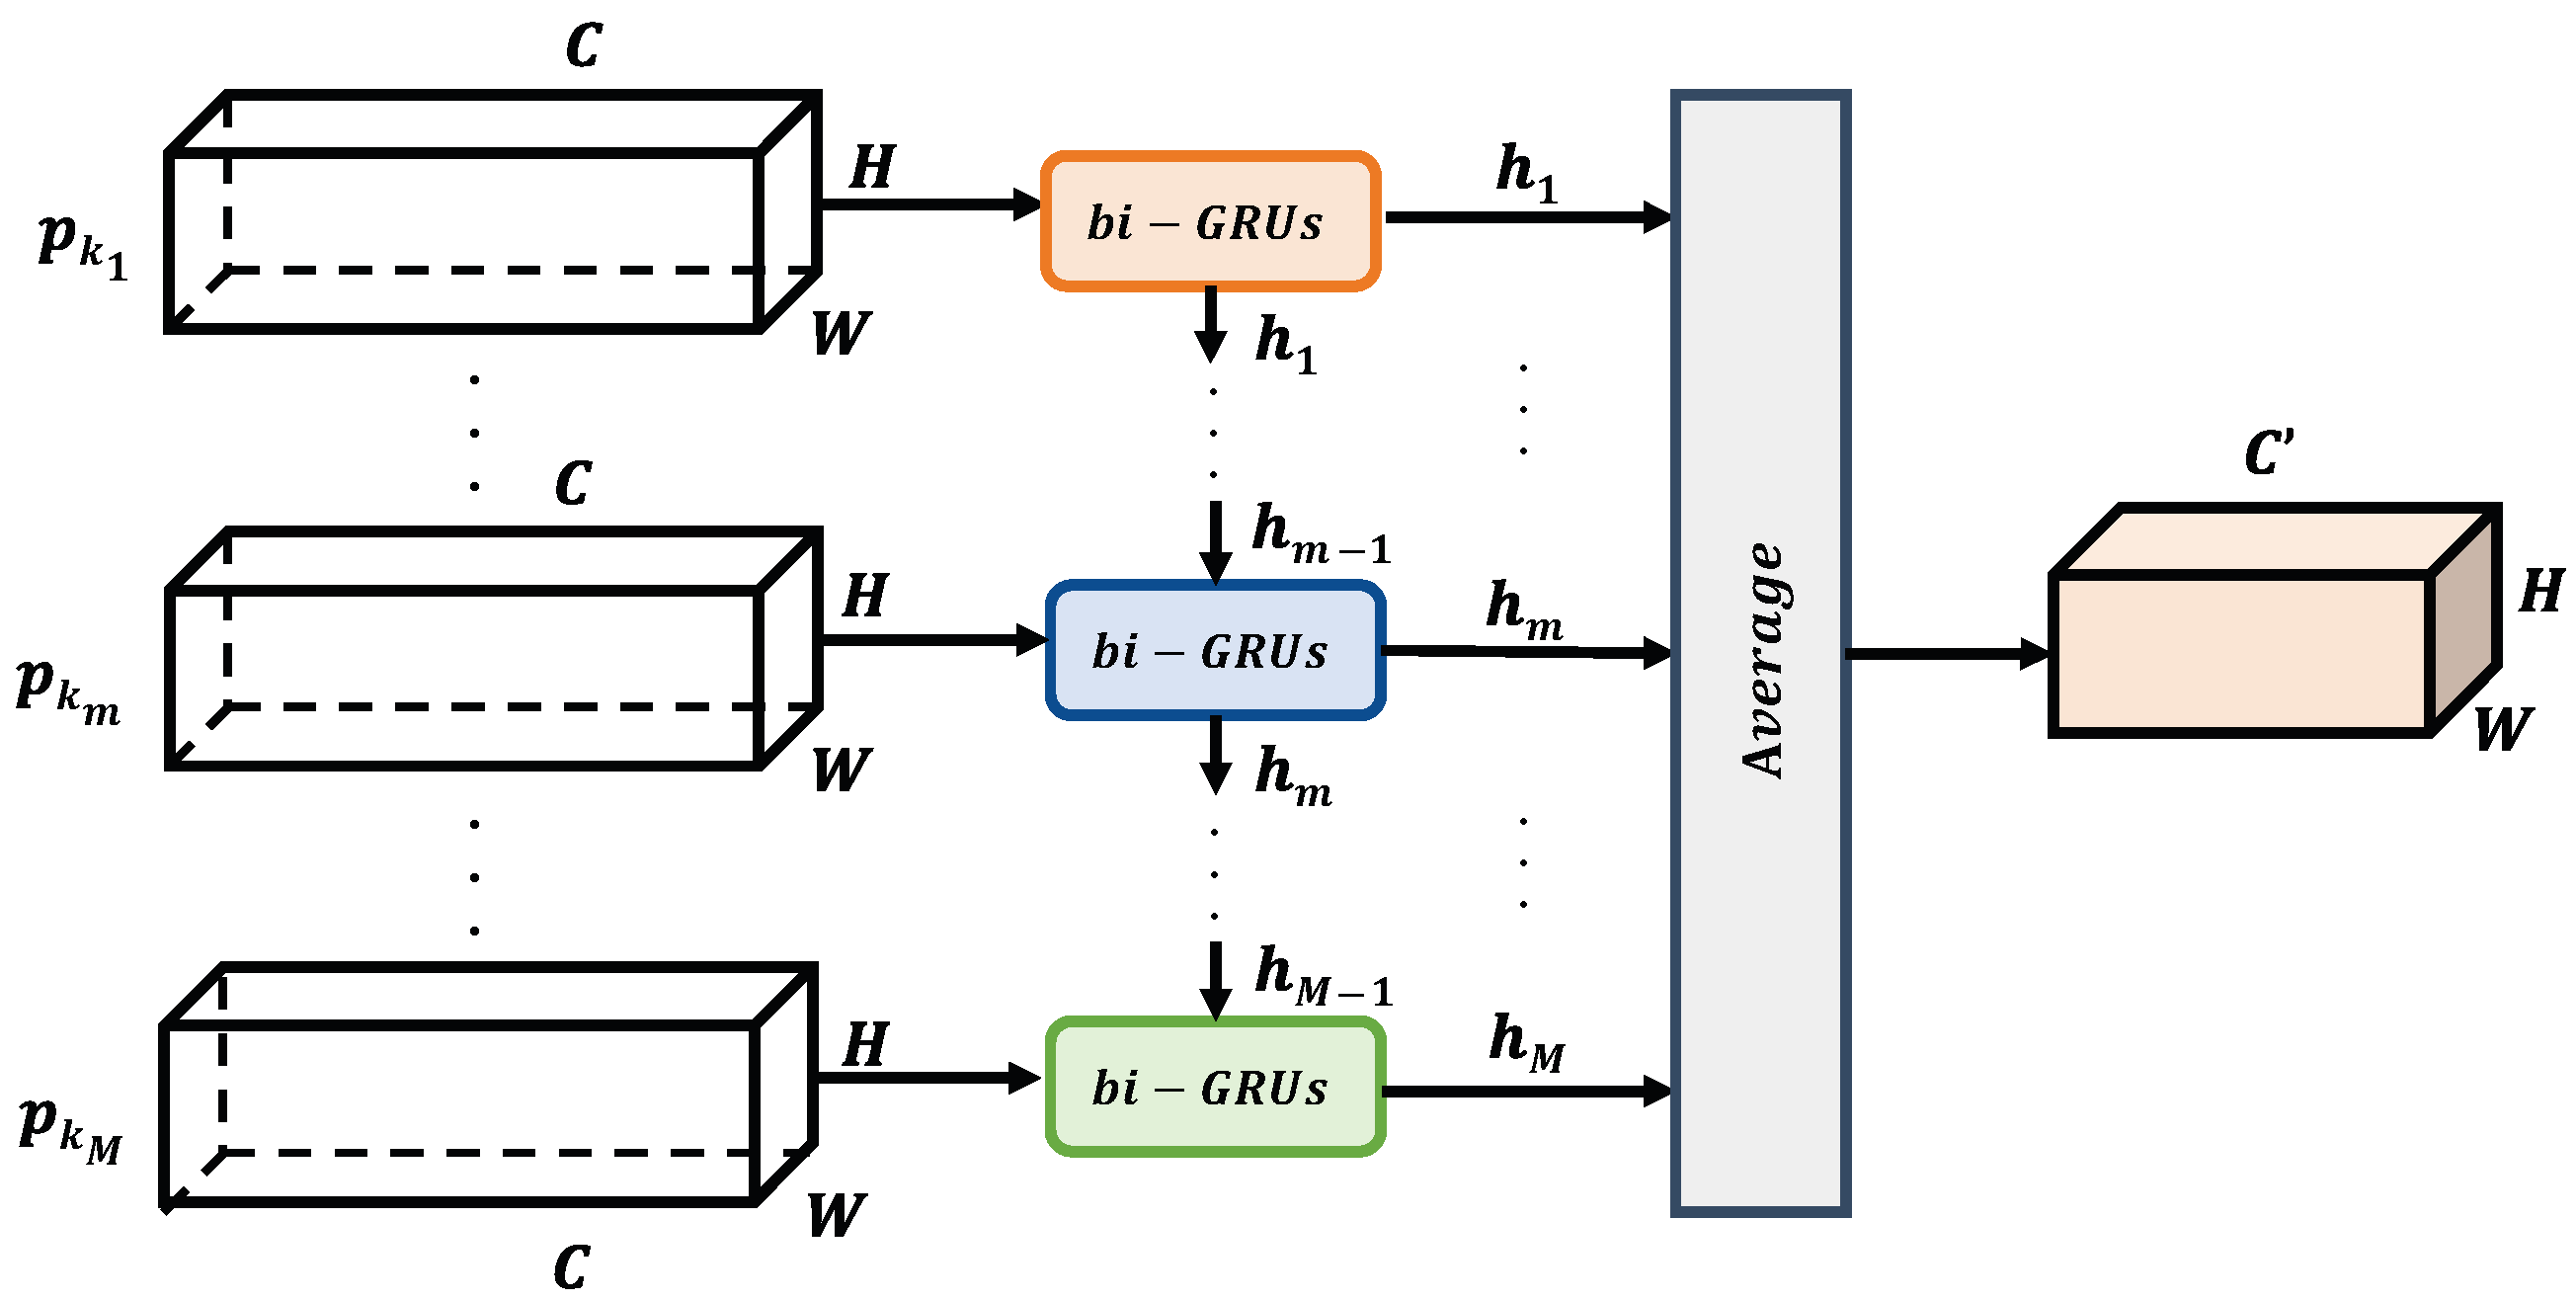
2.3. Temporal Information Extraction

The spatial feature sequences of the key frames are further processed by the temporal-information-extraction module composed of two Gated Recurrent Units (bi-GRUs). Compared with the Long Short-Term Memory Networks (LSTMs), the GRU units not only extract temporal contextual information but also contain fewer trainable parameters, which make them converge faster during the training process and reduce the risk of overfitting. The structure of the module is illustrated in Figure 3.
Each bi-GRU module extracts features from a specific pixel position of all key frames in parallel and obtains a feature pixel sequence of size C × M , where C denotes the total number of channels of the spatial feature and M denotes the total number of key frames. Suppose the dimension of the spatial feature vector for each frame is C × H × W : there are H × W different spatial positions for each feature map. Then, the temporal network consists of H × W bi-GRU modules. All bi-GRU modules share the same set of parameters to reduce the total number of tunable parameters. Suppose the input features at spatial position i , j from all key frames are denoted by P k e y , t i , j = p k 1 i , j , p k 2 i , j , , p k m i , j , , p k M i , j , where p k m i , j denotes the m-th key frame with the hidden state h m 1 from the previous key frame; the GRU unit obtains the hidden state h m of the current key frame. The output of each bi-GRU module is the average of the hidden states of the M key frames. This configuration allows the output to fit with different key-frame lengths. And, the final spatio-temporal feature F t R C × H × W is the concatenation of the output from each bi-GRU module, where C is the number of feature channels after processing by the bi-GRU module.
Finally, a dropout layer with a probability of 0.5 and a fully connected softmax layer are applied to classify expressions for the sub-sequence S t . The classification results denote the expression categories (including micro-expression, macro-expression and no expression) of the middle frame within the t-th temporal sliding window. The loss function is defined in Equation (7):
L o s s = q = 1 Q 1 y ( F t ) = q l o g e V q F t q = 1 Q e V q F t , q [ 1 , Q ] ,
where Q represents the number of categories, y ( F t ) is the predicted label for the feature F t , q is the ground truth label, 1 · denotes an eigenfunction (its value is 1 when y ( F t ) and q are equal and 0 otherwise) and V is the weight vector of a fully connected layer.

2.4. Segment Merging

For the micro-expression detection task, it is common to utilize the Intersection over Union (IoU) between the detected sample and the ground truth to determine whether a segment qualifies as a true positive (TP) sample, as depicted in Equation (8):
W s p o t t e d W g r o u n d T r u t h W s p o t t e d W g r o u n d T r u t h r ,
where W g r o u n d T r u t h is the ground truth interval starting from the onset frame until the offset frame, r is set as 0.5 and the spotted interval W s p o t t e d is considered to be a TP if it meets the condition of Equation (8). We observe that for a video segment containing an expression, if a few frames were wrongly identified, a long and continuous segment of expressive content might be recognized as multiple short segments. In this case, some segments will be filtered out because they do not meet the threshold duration, leading to them being incorrectly identified as false negatives (FNs) and thus diminishing the performance of micro-expression spotting. To address this issue, we carry out post-processing through segment merging to reduce FN short segments. For example, if an image frame is predicted as not containing any expression, but its two adjacent frames are labeled as macro-expressions (or micro-expressions), the label of this frame is adjusted to be consistent with its neighbors. Figure 4 illustrates the process of segment merging. This merging approach enhances the overlap between the spotted samples and ground truth, which mitigates, to some extent, the performance degradation that FN short segments cause.

3. Experiments

We conduct extensive experiments on the spotting benchmark of the Third Facial Micro-Expression Grand Challenge (MEGC 2020) that aims to spot both macro- and micro-expressions (starting from the onset frame until the offset frame) in Long Videos. And, the challenge includes two datasets and several metrics for evaluating the performance of the methods, which are also used in our experiments.

3.1. Datasets and Evaluation Metrics

The proposed method is evaluated on the CAS(ME) 2 database [41] and the SAMM Long Videos dataset [42]. The CAS(ME) 2 database contains a total of 87 videos with a frame rate of 30 frames per second (fps) and an average duration of 86 s. The authors annotated 300 macro-expressions and 57 micro-expressions from 22 subjects, and the emotions are divided into four categories: positive, negative, surprise and others.
The SAMM Long Videos dataset is an extended version of the SAMM dataset. It contains 147 videos with a frame rate of 200 fps and an average duration of 35 s. The dataset contains 343 macro-expressions and 159 micro-expressions from 32 subjects, recorded using a high-speed camera with a resolution of 2040 × 1088 .
The MEGC 2020 spotting task evaluates both macro- and micro-expression spotting. All videos are treated as “one particularly long video”, so the metric represents the overall performance of all videos. We first evaluate the spotting of macro- and micro-expressions separately and then compute the overall performance of the entire dataset. For macro-expressions, the recall and the precision are defined as Equations (9) and (10):
R e c a l l M a E = a 1 m 1 ,
P r e c i s i o n M a E = a 1 n 1 ,
where a 1 denotes TPs, m 1 denotes the total number of macro-expression (MaE) sequences and n 1 denotes the total number of predicted macro-expression intervals. The requirement of being a TP is described in Equation (8).
Likewise, we also use two metrics for micro-expressions, as formulated in Equations (11) and (12):
R e c a l l M i E = a 2 m 2 ,
P r e c i s i o n M i E = a 2 n 2 ,
where a 2 denotes TPs, m 2 denotes the total number of micro-expression (MiE) sequences and n 2 denotes the total number of predicted micro-expression intervals. The overall performance is then computed as Equations (13) and (14):
R e c a l l = a 1 + a 2 m 1 + m 2 ,
P r e c i s i o n = a 1 + a 2 n 1 + n 2 .
Based on the overall recall and precision, we calculate the F1-score with Equation (15). The F1-score is one of the widely used evaluation metrics in micro-expression analysis. It provides a comprehensive assessment by considering both precision and recall. Precision measures the percentage of TP samples among all samples predicted as micro-expressions (including both TPs and false positives (FPs)), while recall measures the percentage of TPs among all micro-expression samples (including both TPs and FNs). Both of these metrics are equally important in assessing the classification accuracy, but they sometimes conflict with each other. Therefore, the F1-score computes the harmonic mean of precision and recall, taking both metrics into account simultaneously. The F1-score ranges from a minimum of 0 to a maximum of 1, where a higher F1-score indicates better model performance.
F 1 - score = 2 × ( R e c a l l × P r e c i s i o n ) R e c a l l + P r e c i s i o n .

3.2. Experiments and Results

We run the experiments by using an I5-9600K [email protected] GHz with a NVIDIA GeForce RTX 2070 (with memory size of 16 GB, manufactured by the Gigabyte Technology located at New Taipei City, Taiwan). In this study, the size of the sliding windows is set as K = 5 and the number of key frames is set as M = 3 . For the temporal-information-extraction module, the input of each temporal module is a feature map with dimensions of M × 512 , 512 is the output dimensions of each frame after the key-frame-extraction module and the number of feature channels C is equal to 64. For training, the number of epochs is set as 30, and the initial learning rate is set as 1 × 10 3 . The learning rate is adjusted by using the cosine annealing learning rate method [43], and the minimum value is set as 1 × 10 8 . For optimization, we use a stochastic gradient descent method [44] with the momentum set as 0.9 and the weight decay set as 5 × 10 4 . And, we use the leave-one-subject-out cross-validation (LOSO) protocol for validation. This validation method allows us to precisely evaluate the generalization of the model across individuals, making it particularly suitable for personalized requirements in practical scenarios.
In this study, we compare the proposed method with the baseline provided by the MEGC 2020 spotting task and other state-of-the-art (SOTA) methods on the F1-score. From the results in Table 1, it is clear that our method outperforms others on both the CAS(ME) 2 and SAMM Long Videos datasets. Specifically, on the CAS(ME) 2 dataset, we achieve an F1-score of 0.6694 for macro-expression detection and 0.6600 for micro-expression detection. On the SAMM Long Videos dataset, the F1-score for macro-expression detection is 0.5539 , while for micro-expression detection, it reaches 0.6091 . Compared to the SOTA, the STSNet_SW approach improves by 43.25 % on the CAS(ME) 2 and 39.11 % on the SAMM Long Videos for micro-expression spotting and outperforms the other methods by 25.93 % and 14.58 % on the two datasets for macro-expression spotting, respectively. It is noteworthy that the compared methods generally exhibit better performance in detecting macro-expressions than micro-expressions on both datasets, with the LSSNet-LSM [45] and MTSN [46] methods particularly excelling in this regard. However, the proposed STSNet_SW method is effective at spotting both micro-expressions and macro-expressions.
Table 2 reports a detailed analysis of the experimental results obtained by using the proposed method across several evaluation metrics. The F1-scores for spotting macro-expressions of the CAS(ME) 2 and the SAMM Long Videos are 0.6694 and 0.5539 , respectively, and the F1-scores for spotting micro-expressions are 0.66 and 0.6091 , respectively. The overall F1-scores are 0.6678 and 0.5697 , respectively. Note that the relatively small values of the FPs indicate that the proposed method has a strong ability to identify no-expression segments, and there are very few cases where no-expression segments are misclassified as macro-expression (or micro-expression) segments.
The experimental results of the proposed method with segment merging is reported in Table 3. The results show that performance on the SAMM Long Videos dataset improved, but the results on the CAS(ME) 2 dataset barely changed. This discrepancy is attributed to the difference in frame rates between the two datasets. In the SAMM Long Videos database with high frame rates, an expression clip contains a greater number of frames within the same time interval compared to the CAS(ME) 2 dataset with low frame rates. Consequently, the proposed model may miss some of the expression frames during spotting, leading to the detection of multiple shorter segments instead of a single complete segment. Therefore, the segment-merging post-processing connects multiple short segments into a longer one, significantly improving the detected TPs for the SAMM Long Videos dataset.
In addition, we also conduct an experiment to distinguish macro- and micro-expressions according to segment duration so as to assess and validate the advantages of segment-merging post-processing in micro-expression spotting. Typically, micro-expressions have shorter durations compared to macro-expressions, which make them prone to be confused with macro-expression segments. With the initial predictions generated by the STSNet_SW method, we re-labeled segments with facial expressions as “with-expression” segments and those without expressions as “no-expression” segments. During the segment-duration post-processing, we set a threshold duration to discriminate whether a “with-expression” segment represents a micro-expression or a macro-expression. Specifically, for segments containing facial expressions, those lasting shorter than or equal to the threshold are considered micro-expressions, while segments lasting longer than the threshold are re-labeled as a macro-expressions. Figure 5 shows an example of a micro-expression segment misclassified as a macro-expression, which is correctly re-labeled by using segment-duration post-processing.
Based on experience, the threshold of the frame numbers is set as 15 for the CAS(ME) 2 dataset and 100 for the SAMM Long Videos dataset. Table 4 shows the experimental results. From the table, we observe that compared with segment-merging post-processing, the performance on the two databases is improved for macro-expression spotting, while the performance is worse for both databases for the micro-expressions. This phenomenon is attributed to the fact that filtering expression segments based on the threshold results in micro-expressions predominantly containing shorter-duration segments. Consequently, these micro-expression segments are scattered throughout the video sequence, causing the overlap region between the spotted samples and ground truth that includes more non-expression segments. From the perspective of Equation (8), this issue decreases the IoU and TPs for micro-expressions, which subsequently affects the final detection. Conversely, macro-expressions, which retain segments with a long duration, show a relatively increased overlap between the detected samples and ground truth. On the other hand, due to individual variations in emotional expression habits, setting a fixed threshold duration for each dataset does not ensure that all micro-expression segments meet the thresholding criteria. As a result, many micro-expression segments may be misclassified as macro-expression segments because their durations are longer than the threshold. The compared methods using segment duration for post-processing are subject to accuracy loss under certain scenarios. In conclusion, segment merging is effective as a post-processing procedure.

4. Conclusions

This study proposes a spatio-temporal spotting network with sliding windows for spotting macro- and micro-expression in long videos. By combining convolutional neural networks and recurrent neural networks, this model comprehensively learns spatial and temporal features, capturing the key characteristics of facial expressions. Furthermore, we innovatively incorporate a video summarization algorithm for key frame extraction to improve the performance of micro-expression spotting. Many existing expression-spotting methods combine traditional feature extraction with deep learning but frequently struggle to capture complex facial expression variations and incur high costs of labor and time. Additionally, given the shorter durations and smaller amplitudes of facial movements in micro-expressions compared to macro-expressions, current methods tend to prioritize macro-expression detection and perform poorly in micro-expression segment detection.
We evaluate the proposed STSNet_SW on two benchmark datasets: CAS(ME) 2 and SAMM Long Videos from the MEGC 2020 challenge. In terms of the F1-score, the proposed method achieves scores of 0.6600 and 0.6091 for micro-expression spotting on the CAS(ME) 2 and SAMM Long Videos datasets, respectively, and scores of 0.6694 and 0.5539 for macro-expression spotting on the CAS(ME) 2 and SAMM Long Videos datasets, respectively. Compared to the state-of-the-art (SOTA) methods, the STSNet_SW approach achieves a superiority margin of 43.25 % and 25.93 % on the CAS(ME) 2 dataset for micro-expression and macro-expression spotting, and this method improves by 14.58 % and 39.11 % on the SAMM Long Videos dataset for micro-expression and macro-expression spotting, respectively. These results demonstrate that the STSNet_SW method outperforms state-of-the-art methods in both macro- and micro-expression detection, with particularly remarkable improvements in micro-expressions. However, regardless of whether segment-merging post-processing or segment-duration post-processing is applied, the performance of this proposed method on the SAMM Long Videos dataset is notably lower than on the CAS(ME) 2 dataset, possibly due to disparities between the datasets. Additionally, there is a significant imbalance between the data used for micro-expressions and macro-expressions, limiting further improvements in spotting performance. We will continue this study in the future and utilize more diverse facial information, such as facial action units (AUs) and optical flow features to solve the problem of insufficient data for micro-expression spotting.

Author Contributions

Conceptualization, W.G.; data curation, Z.A.; funding acquisition, W.G. and J.G.; methodology, Z.A.; project administration, W.G.; resources, W.G. and J.G.; supervision, W.G.; validation, Z.A.; writing—original draft, W.F., Z.A., W.H. and H.S.; writing—review and editing, W.F. All authors have read and agreed to the published version of the manuscript.

Funding

This study received key funding from the National Natural Science Foundation of China under grant 92067206, the Natural Science Foundation of Shandong Province under grant ZR202211180156, and the Spanish Ministry of Economy and Competitiveness (MINECO) and the European Regional Development Fund (ERDF) under grant PID2020-120311RB-I00 funded by MCIN/AEI/10.13039/501100011033.

Institutional Review Board Statement

Ethical review and approval were waived for this study due to the fact that the two datasets used for evaluation in this study were collected by a third party; and the owners of the datasets have approved our usage for research and we abide by their terms of use.

Informed Consent Statement

Patient consent was waived due to the fact that both datasets used in this study were collected by a third party and the owners approved our usage for the purpose of the research.

Data Availability Statement

Not applicable.

Conflicts of Interest

The authors declare no conflict of interest.

References

  1. Ekman, P. Darwin, deception, and facial expression. Ann. N. Y. Acad. Sci. 2003, 1000, 205–221. [Google Scholar] [CrossRef] [PubMed]
  2. Gottschalk, L.A.; Auerbach, A.H.; Haggard, E.A.; Isaacs, K.S. Micromomentary facial expressions as indicators of ego mechanisms in psychotherapy. In Methods of Research in Psychotherapy; Springer: Boston, MA, USA, 1966; pp. 154–165. [Google Scholar] [CrossRef]
  3. Ekman, P.; Friesen, W.V. Nonverbal leakage and clues to deception. Psychiatry 1969, 32, 88–106. [Google Scholar] [CrossRef] [PubMed]
  4. Yan, W.J.; Wu, Q.; Liang, J.; Chen, Y.H.; Fu, X. How fast are the leaked facial expressions: The duration of micro-expressions. J. Nonverbal Behav. 2013, 37, 217–230. [Google Scholar] [CrossRef]
  5. Porter, S.; Ten Brinke, L. Reading between the lies: Identifying concealed and falsified emotions in universal facial expressions. Psychol. Sci. 2008, 19, 508–514. [Google Scholar] [CrossRef] [PubMed]
  6. Stewart, P.A.; Waller, B.M.; Schubert, J.N. Presidential speechmaking style: Emotional response to micro-expressions of facial affect. Motiv. Emot. 2009, 33, 125–135. [Google Scholar] [CrossRef]
  7. O’sullivan, M.; Frank, M.G.; Hurley, C.M.; Tiwana, J. Police lie detection accuracy: The effect of lie scenario. Law Hum. Behav. 2009, 33, 530–538. [Google Scholar] [CrossRef]
  8. Endres, J.; Laidlaw, A. Micro-expression recognition training in medical students: A pilot study. BMC Med. Educ. 2009, 9, 47. [Google Scholar] [CrossRef] [PubMed]
  9. Lin, W.; Zhu, M.; Zhou, X.; Zhang, R.; Zhao, X.; Shen, S.; Sun, L. A Deep Neural Collaborative Filtering based Service Recommendation Method with Multi-Source Data for Smart Cloud-Edge Collaboration Applications. Tsinghua Sci. Technol. 2023. [Google Scholar]
  10. Zhang, P.; Chen, N.; Shen, S.; Yu, S.; Kumar, N.; Hsu, C.H. AI-Enabled Space-Air-Ground Integrated Networks: Management and Optimization. IEEE Netw. 2023, 23, 6792. [Google Scholar] [CrossRef]
  11. Feng, S.; Zhao, L.; Shi, H.; Wang, M.; Shen, S.; Wang, W. One-dimensional VGGNet for high-dimensional data. Appl. Soft Comput. 2023, 135, 110035. [Google Scholar] [CrossRef]
  12. Jingting, L.; Wang, S.J.; Yap, M.H.; See, J.; Hong, X.; Li, X. MEGC2020-the third facial micro-expression grand challenge. In Proceedings of the 2020 15th IEEE International Conference on Automatic Face and Gesture Recognition (FG 2020), Buenos Aires, Argentina, 16–20 November 2020; pp. 777–780. [Google Scholar] [CrossRef]
  13. Li, X.; Hong, X.; Moilanen, A.; Huang, X.; Pfister, T.; Zhao, G.; Pietikäinen, M. Towards reading hidden emotions: A comparative study of spontaneous micro-expression spotting and recognition methods. IEEE Trans. Affect. Comput. 2017, 9, 563–577. [Google Scholar] [CrossRef]
  14. Davison, A.; Merghani, W.; Lansley, C.; Ng, C.C.; Yap, M.H. Objective micro-facial movement detection using facs-based regions and baseline evaluation. In Proceedings of the 2018 13th IEEE International Conference on Automatic Face & Gesture Recognition (FG 2018), Xi’an, China, 15–19 May 2018; pp. 642–649. [Google Scholar] [CrossRef]
  15. Lu, H.; Kpalma, K.; Ronsin, J. Micro-expression detection using integral projections. J. WSCG 2017, 25, 87–96. [Google Scholar]
  16. Duque, C.A.; Alata, O.; Emonet, R.; Legrand, A.C.; Konik, H. Micro-expression spotting using the riesz pyramid. In Proceedings of the 2018 IEEE Winter Conference on Applications of Computer Vision (WACV), Lake Tahoe, NV, USA, 12–15 March 2018; pp. 66–74. [Google Scholar] [CrossRef]
  17. Liong, S.T.; See, J.; Phan, R.C.W.; Oh, Y.H.; Le Ngo, A.C.; Wong, K.; Tan, S.W. Spontaneous subtle expression detection and recognition based on facial strain. Signal Process. Image Commun. 2016, 47, 170–182. [Google Scholar] [CrossRef]
  18. Patel, D.; Zhao, G.; Pietikäinen, M. Spatiotemporal integration of optical flow vectors for micro-expression detection. In Proceedings of the International Conference on Advanced Concepts for Intelligent Vision Systems, Catania, Italy, 26–29 October 2015; Springer: Cham, Swizerland, 2015; pp. 369–380. [Google Scholar] [CrossRef]
  19. Li, X.; Yu, J.; Zhan, S. Spontaneous facial micro-expression detection based on deep learning. In Proceedings of the 2016 IEEE 13th International Conference on Signal Processing (ICSP), Chengdu, China, 6–10 November 2016; pp. 1130–1134. [Google Scholar] [CrossRef]
  20. Wang, S.J.; Wu, S.; Fu, X. A main directional maximal difference analysis for spotting micro-expressions. In Proceedings of the Asian Conference on Computer Vision, Taipei, Taiwan, 20–24 November 2016; Springer: Cham, Swizerland, 2016; pp. 449–461. [Google Scholar] [CrossRef]
  21. Han, Y.; Li, B.; Lai, Y.K.; Liu, Y.J. CFD: A collaborative feature difference method for spontaneous micro-expression spotting. In Proceedings of the 2018 25th IEEE International Conference on Image Processing (ICIP), Athens, Greece, 7–10 October 2018; pp. 1942–1946. [Google Scholar] [CrossRef]
  22. Li, Y.; Huang, X.; Zhao, G. Can micro-expression be recognized based on single apex frame? In Proceedings of the 2018 25th IEEE International Conference on Image Processing (ICIP), Athens, Greece, 7–10 October 2018; pp. 3094–3098. [Google Scholar] [CrossRef]
  23. Shreve, M.; Godavarthy, S.; Manohar, V.; Goldgof, D.; Sarkar, S. Towards macro-and micro-expression spotting in video using strain patterns. In Proceedings of the 2009 Workshop on Applications of Computer Vision (WACV), Snowbird, UT, USA, 7–8 December 2009; pp. 1–6. [Google Scholar] [CrossRef]
  24. Shreve, M.; Godavarthy, S.; Goldgof, D.; Sarkar, S. Macro-and micro-expression spotting in long videos using spatio-temporal strain. In Proceedings of the 2011 IEEE International Conference on Automatic Face & Gesture Recognition (FG), Santa Barbara, CA, USA, 21–23 March 2011; pp. 51–56. [Google Scholar] [CrossRef]
  25. Moilanen, A.; Zhao, G.; Pietikäinen, M. Spotting rapid facial movements from videos using appearance-based feature difference analysis. In Proceedings of the 2014 22nd International Conference on Pattern Recognition, Stockholm, Sweden, 24–28 August 2014; pp. 1722–1727. [Google Scholar] [CrossRef]
  26. Beh, K.X.; Goh, K.M. Micro-expression spotting using facial landmarks. In Proceedings of the 2019 IEEE 15th International Colloquium on Signal Processing & Its Applications (CSPA), Penang, Malaysia, 8–9 March 2019; pp. 192–197. [Google Scholar] [CrossRef]
  27. Zhang, Z.; Chen, T.; Meng, H.; Liu, G.; Fu, X. SMEConvNet: A convolutional neural network for spotting spontaneous facial micro-expression from long videos. IEEE Access 2018, 6, 71143–71151. [Google Scholar] [CrossRef]
  28. Nag, S.; Bhunia, A.K.; Konwer, A.; Roy, P.P. Facial micro-expression spotting and recognition using time contrasted feature with visual memory. In Proceedings of the ICASSP 2019–2019 IEEE International Conference on Acoustics, Speech and Signal Processing (ICASSP), Brighton, UK, 12–17 May 2019; pp. 2022–2026. [Google Scholar] [CrossRef]
  29. Pan, H.; Xie, L.; Wang, Z. Spatio-temporal Convolutional Attention Network for Spotting Macro-and Micro-expression Intervals. In Proceedings of the 1st Workshop on Facial Micro-Expression: Advanced Techniques for Facial Expressions Generation and Spotting, Virtual Event China, 24 October 2021; pp. 25–30. [Google Scholar] [CrossRef]
  30. Yang, B.; Wu, J.; Zhou, Z.; Komiya, M.; Kishimoto, K.; Xu, J.; Nonaka, K.; Horiuchi, T.; Komorita, S.; Hattori, G.; et al. Facial Action Unit-based Deep Learning Framework for Spotting Macro-and Micro-expressions in Long Video Sequences. In Proceedings of the 29th ACM International Conference on Multimedia, Virtual Event China, 20–24 October 2021; pp. 4794–4798. [Google Scholar] [CrossRef]
  31. Pan, H.; Xie, L.; Wang, Z. Local bilinear convolutional neural network for spotting macro-and micro-expression intervals in long video sequences. In Proceedings of the 2020 15th IEEE International Conference on Automatic Face and Gesture Recognition (FG 2020), Buenos Aires, Argentina, 16–20 November 2020; pp. 749–753. [Google Scholar] [CrossRef]
  32. Xue, L.; Zhu, T.; Hao, J. A Two-stage Deep Neural Network for Macro-and Micro-Expression Spotting from Long-term Videos. In Proceedings of the 2021 14th International Symposium on Computational Intelligence and Design (ISCID), Hangzhou, China, 11–12 December 2021; pp. 282–286. [Google Scholar] [CrossRef]
  33. Yap, C.H.; Yap, M.H.; Davison, A.K.; Cunningham, R. Efficient lightweight 3d-cnn using frame skipping and contrast enhancement for facial macro-and micro-expression spotting. arXiv 2021, arXiv:2105.06340. [Google Scholar] [CrossRef]
  34. Liong, G.B.; See, J.; Wong, L.K. Shallow optical flow three-stream CNN for macro-and micro-expression spotting from long videos. In Proceedings of the 2021 IEEE International Conference on Image Processing (ICIP), Anchorage, AK, USA, 19–22 September 2021; pp. 2643–2647. [Google Scholar] [CrossRef]
  35. He, K.; Zhang, X.; Ren, S.; Sun, J. Deep residual learning for image recognition. In Proceedings of the IEEE Conference on Computer Vision and Pattern Recognition, Las Vegas, NV, USA, 27–30 June 2016; pp. 770–778. [Google Scholar] [CrossRef]
  36. Deng, J.; Dong, W.; Socher, R.; Li, L.J.; Li, K.; Li, F. Imagenet: A large-scale hierarchical image database. In Proceedings of the 2009 IEEE Conference on Computer Vision and Pattern Recognition, Miami, FL, USA, 20–25 June 2009; pp. 248–255. [Google Scholar] [CrossRef]
  37. Mollahosseini, A.; Hasani, B.; Mahoor, M.H. Affectnet: A database for facial expression, valence, and arousal computing in the wild. IEEE Trans. Affect. Comput. 2017, 10, 18–31. [Google Scholar] [CrossRef]
  38. Liong, S.T.; See, J.; Wong, K.; Phan, R.C.W. Less is more: Micro-expression recognition from video using apex frame. Signal Process. Image Commun. 2018, 62, 82–92. [Google Scholar] [CrossRef]
  39. Peng, M.; Wang, C.; Bi, T.; Shi, Y.; Zhou, X.; Chen, T. A novel apex-time network for cross-dataset micro-expression recognition. In Proceedings of the 2019 8th International Conference on Affective Computing and Intelligent Interaction (ACII), Cambridge, UK, 3–6 September 2019; pp. 1–6. [Google Scholar] [CrossRef]
  40. Zhou, L.; Mao, Q.; Xue, L. Cross-database micro-expression recognition: A style aggregated and attention transfer approach. In Proceedings of the 2019 IEEE International Conference on Multimedia & Expo Workshops (ICMEW), Shanghai, China, 8–12 July 2019; pp. 102–107. [Google Scholar] [CrossRef]
  41. Qu, F.; Wang, S.J.; Yan, W.J.; Li, H.; Wu, S.; Fu, X. CAS(ME)2: A database for spontaneous macro-expression and micro-expression spotting and recognition. IEEE Trans. Affect. Comput. 2017, 9, 424–436. [Google Scholar] [CrossRef]
  42. Davison, A.K.; Lansley, C.; Costen, N.; Tan, K.; Yap, M.H. Samm: A spontaneous micro-facial movement dataset. IEEE Trans. Affect. Comput. 2016, 9, 116–129. [Google Scholar] [CrossRef]
  43. Loshchilov, I.; Hutter, F. Sgdr: Stochastic gradient descent with warm restarts. arXiv 2016, arXiv:1608.03983. [Google Scholar]
  44. Williams, R.J. Simple statistical gradient-following algorithms for connectionist reinforcement learning. Mach. Learn. 1992, 8, 229–256. [Google Scholar] [CrossRef]
  45. Yu, W.W.; Jiang, J.; Li, Y.J. LSSNet: A two-stream convolutional neural network for spotting macro-and micro-expression in long videos. In Proceedings of the 29th ACM International Conference on Multimedia, Virtual Event China, 20–24 October 2021; pp. 4745–4749. [Google Scholar] [CrossRef]
  46. Liong, G.B.; Liong, S.T.; See, J.; Chan, C.S. MTSN: A Multi-Temporal Stream Network for Spotting Facial Macro-and Micro-Expression with Hard and Soft Pseudo-labels. In Proceedings of the 2nd Workshop on Facial Micro-Expression: Advanced Techniques for Multi-Modal Facial Expression Analysis, Lisboa, Portugal, 14 October 2022; pp. 3–10. [Google Scholar] [CrossRef]
  47. Yap, C.H.; Yap, M.H.; Davison, A.; Kendrick, C.; Li, J.; Wang, S.J.; Cunningham, R. 3d-cnn for facial micro-and macro-expression spotting on long video sequences using temporal oriented reference frame. In Proceedings of the 30th ACM International Conference on Multimedia, Lisboa, Portugal, 10–14 October 2022; pp. 7016–7020. [Google Scholar] [CrossRef]
  48. Yap, C.H.; Kendrick, C.; Yap, M.H. Samm long videos: A spontaneous facial micro-and macro-expressions dataset. In Proceedings of the 2020 15th IEEE International Conference on Automatic Face and Gesture Recognition (FG 2020), Buenos Aires, Argentina, 16–20 November 2020; pp. 771–776. [Google Scholar] [CrossRef]
Figure 1. Overview of the proposed spatio-temporal micro-expression-spotting method with sliding windows.
Electronics 12 03947 g001
Figure 2. The structure of the key-frame-extraction module. This module takes P t = p 1 , p 2 , , p k , p K as input, where P t is the spatial feature sequence extracted from the sub-sequence S t sampled by the t-th sliding window. This input is processed through the self-attention calculation part and the key-frame-classification part, resulting in a set of scores Z t = z 1 , z 2 , , z k , , z K . Finally, we select these frames corresponding to the top M scores in Z t as the M key frames.
Electronics 12 03947 g002
Figure 3. The structure of the temporal-information-extraction module. This module takes the spatial feature sequence P k e y , t from M key frames as input, where P k e y , t = p k 1 , p k 2 , , p k m , , p k M and p k m R C × H × W . The temporal-information-extraction module is composed of H × W bi-GRU modules, each of which process pixel-wise features within the sequence P k e y , t . For each bi-GRU module containing M bi-GRUs units, h m is the output of the m-th bi-GRUs unit applied to p k m i , j , where p k m i , j denotes the feature at spatial position ( i , j ) in the m-th key frame. The concatenation of outputs from these H × W bi-GRU modules forms the spatio-temporal feature F t .
Electronics 12 03947 g003
Figure 4. Illustration of segment merging. The images framed inside the green box in the first row represent micro-expressions according to ground truth annotations. The results of expression detection for these images are displayed in the second row, where “0” signifies the absence of expression and “1” denotes a micro-expression. Notably, the images encased within the green box are incorrectly predicted as two separate expression segments, delineated by the red boxes in the second row. Subsequent to applying segment-merging post-processing, these segments are consolidated into a single micro-expression segment, indicated by the blue box in the third row, which aligns consistently with the ground truth.
Electronics 12 03947 g004
Figure 5. Illustration of the segment duration. The first row displays the video clip to be detected. The second row shows the prediction results for this video clip, including no-expression segments denoted by “0”, a micro-expression segment indicated by “1” (i.e., the images framed within the red box) and a macro-expression segment identified as “2” (i.e., the images framed within the yellow box). Subsequently, these segments are re-labeled as either “no-expression” segments or “with-expression” segments (depicted by the blue boxes in the third row). The “with-expression” segments are further re-classified as micro-expressions (indicated by the red boxes in the fourth row) by comparing their durations with the predefined threshold.
Electronics 12 03947 g005
Table 1. Comparison of the proposed method with the state-of-the-art methods according to F1-scores.
DatasetCAS(ME) 2 SAMM Long Videos
MethodMacro-ExpressionMicro-ExpressionOverallMacro-ExpressionMicro-ExpressionOverall
EL-FACE [33]0.08410.01840.06200.19730.04260.1261
SOFTNet(w/o) [34]0.16150.13790.15510.14630.10630.1293
3D-CNN [47]0.21580.02530.14170.19210.04250.1066
SOFTNet [34]0.24100.11730.20220.21690.15200.1881
TSMSNet(w/o) [32]0.24400.22750.24070.23420.18990.2144
TSMSNet [32]0.25150.22750.24660.23950.19690.2213
Yang et al. [30]0.25990.03390.21180.35530.11550.2736
Yap et al. [48]---0.40810.05080.3299
LSSNet-LSM [45]0.38000.06300.32700.33600.21800.2900
MTSN [46]0.41010.08080.36200.34590.08780.2867
STSNet_SW0.66940.66000.66780.55390.60910.5697
Table 2. Detailed performance of the proposed method using several evaluation metrics.
DatasetCAS(ME) 2 SAMM Long Videos
ExpressionMacro-ExpressionMicro-ExpressionOverallMacro-ExpressionMicro-ExpressionOverall
Total30057357343159502
TP1663319916774241
FP3010409310103
FN1342415817685261
Precision0.84690.76740.83260.64230.88100.7006
Recall0.55330.57890.55740.48690.46540.4801
F1-score0.66940.66000.66780.55390.60910.5697
Table 3. Detailed performance of the proposed method with segment-merging post-processing.
DatasetCAS(ME) 2 SAMM Long Videos
ExpressionMacro-ExpressionMicro-ExpressionOverallMacro-ExpressionMicro-ExpressionOverall
Total30057357343159502
TP1653319817580255
FP301040871198
FN1352415916879247
Precision0.84620.76740.83190.66790.87910.7224
Recall0.55000.57890.55460.51020.50310.5080
F1-score0.66670.66000.66550.57850.64000.5965
Table 4. Detailed performance of the proposed method with segment-duration post-processing.
DatasetCAS(ME) 2 SAMM Long Videos
ExpressionMacro-ExpressionMicro-ExpressionOverallMacro-ExpressionMicro-ExpressionOverall
Total30057357343159502
TP1672218917949228
FP3242748776163
FN13335168164110274
Precision0.83920.34380.71860.67290.39200.5831
Recall0.55670.38600.52940.52190.30820.4542
F1-score0.66930.36360.60970.58780.34510.5106
Disclaimer/Publisher’s Note: The statements, opinions and data contained in all publications are solely those of the individual author(s) and contributor(s) and not of MDPI and/or the editor(s). MDPI and/or the editor(s) disclaim responsibility for any injury to people or property resulting from any ideas, methods, instructions or products referred to in the content.

