


A Knowledge-Graph-Driven Method for Intelligent Decision Making on Power Communication Equipment Faults

Abstract
:1. Introduction
1.1. Background
1.2. Challenges
1.3. The Role of Knowledge Graphs
1.4. Contributions
- The paper proposes a knowledge extraction method that enables joint extraction of erroneous entity relationships to obtain structured fault knowledge.
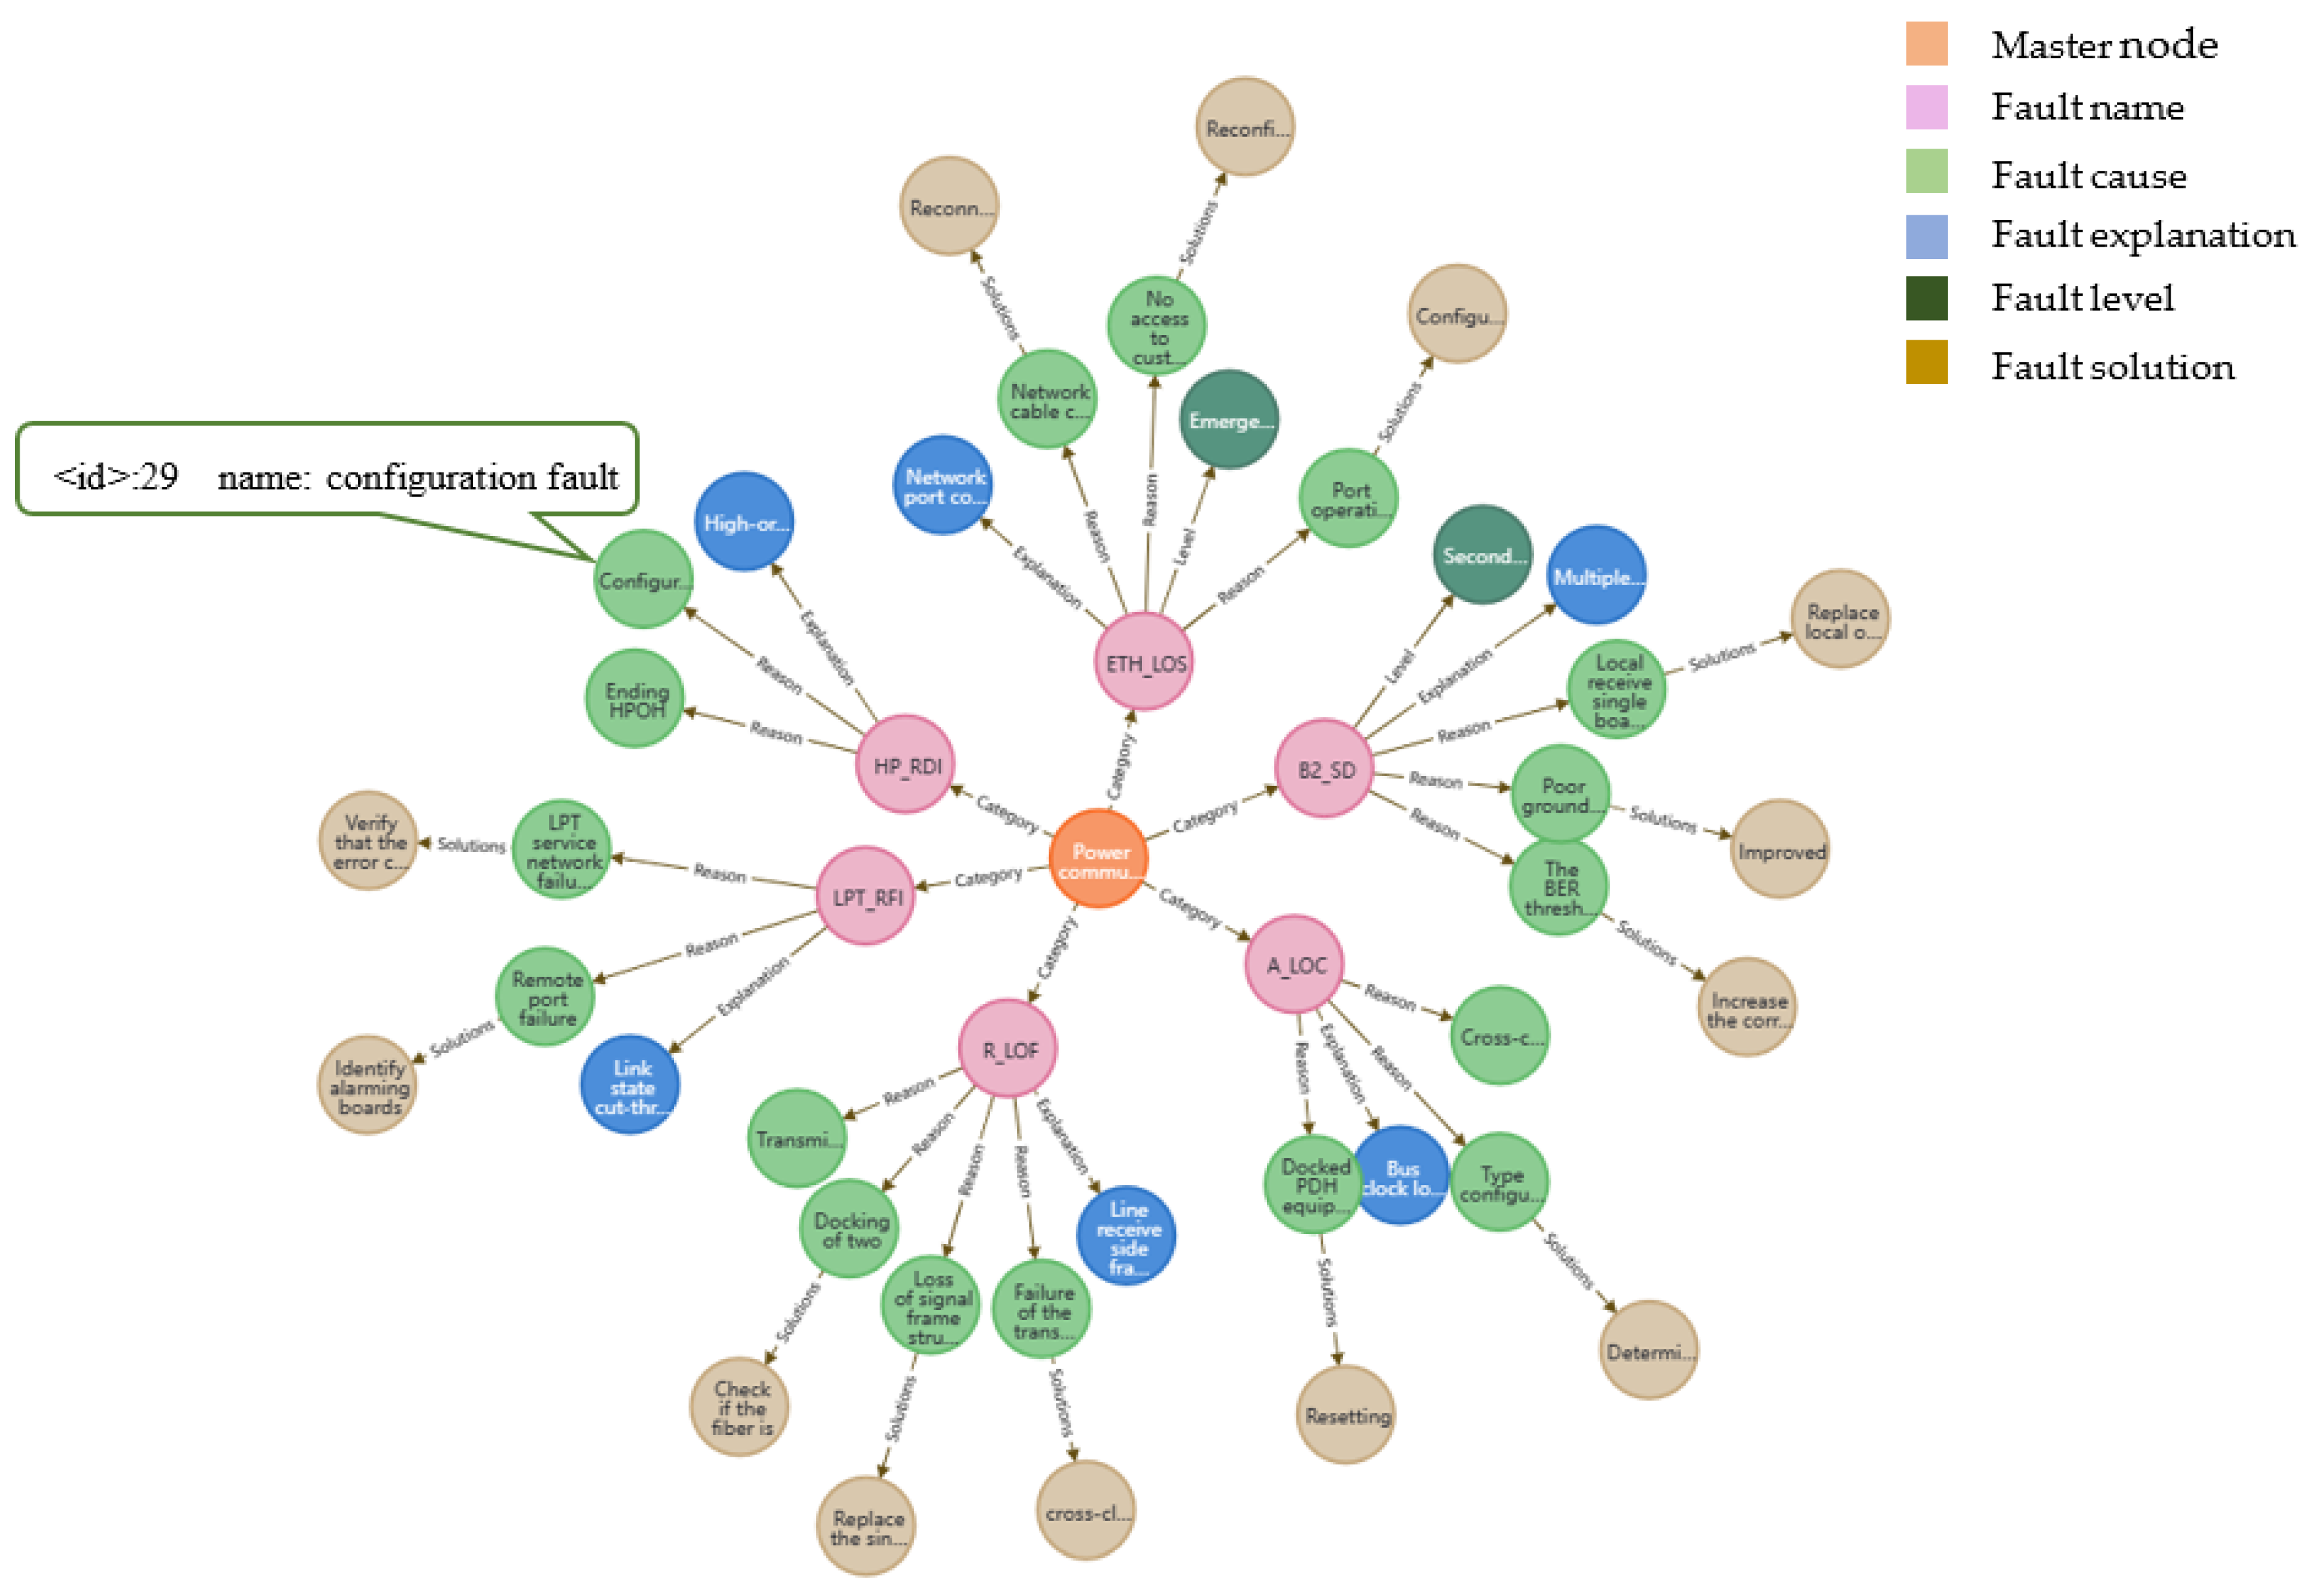
- The paper reconstructs the knowledge ontology layer of power communication equipment faults and relies on fault knowledge, which enables the visual display of fault data.
- The paper designs a user intent multi-feature recommendation method, which realizes accurate prediction and personalized recommendation for user intent fault retrieval.
2. Related Work
2.1. Knowledge Extraction
2.2. Graph Recommendation
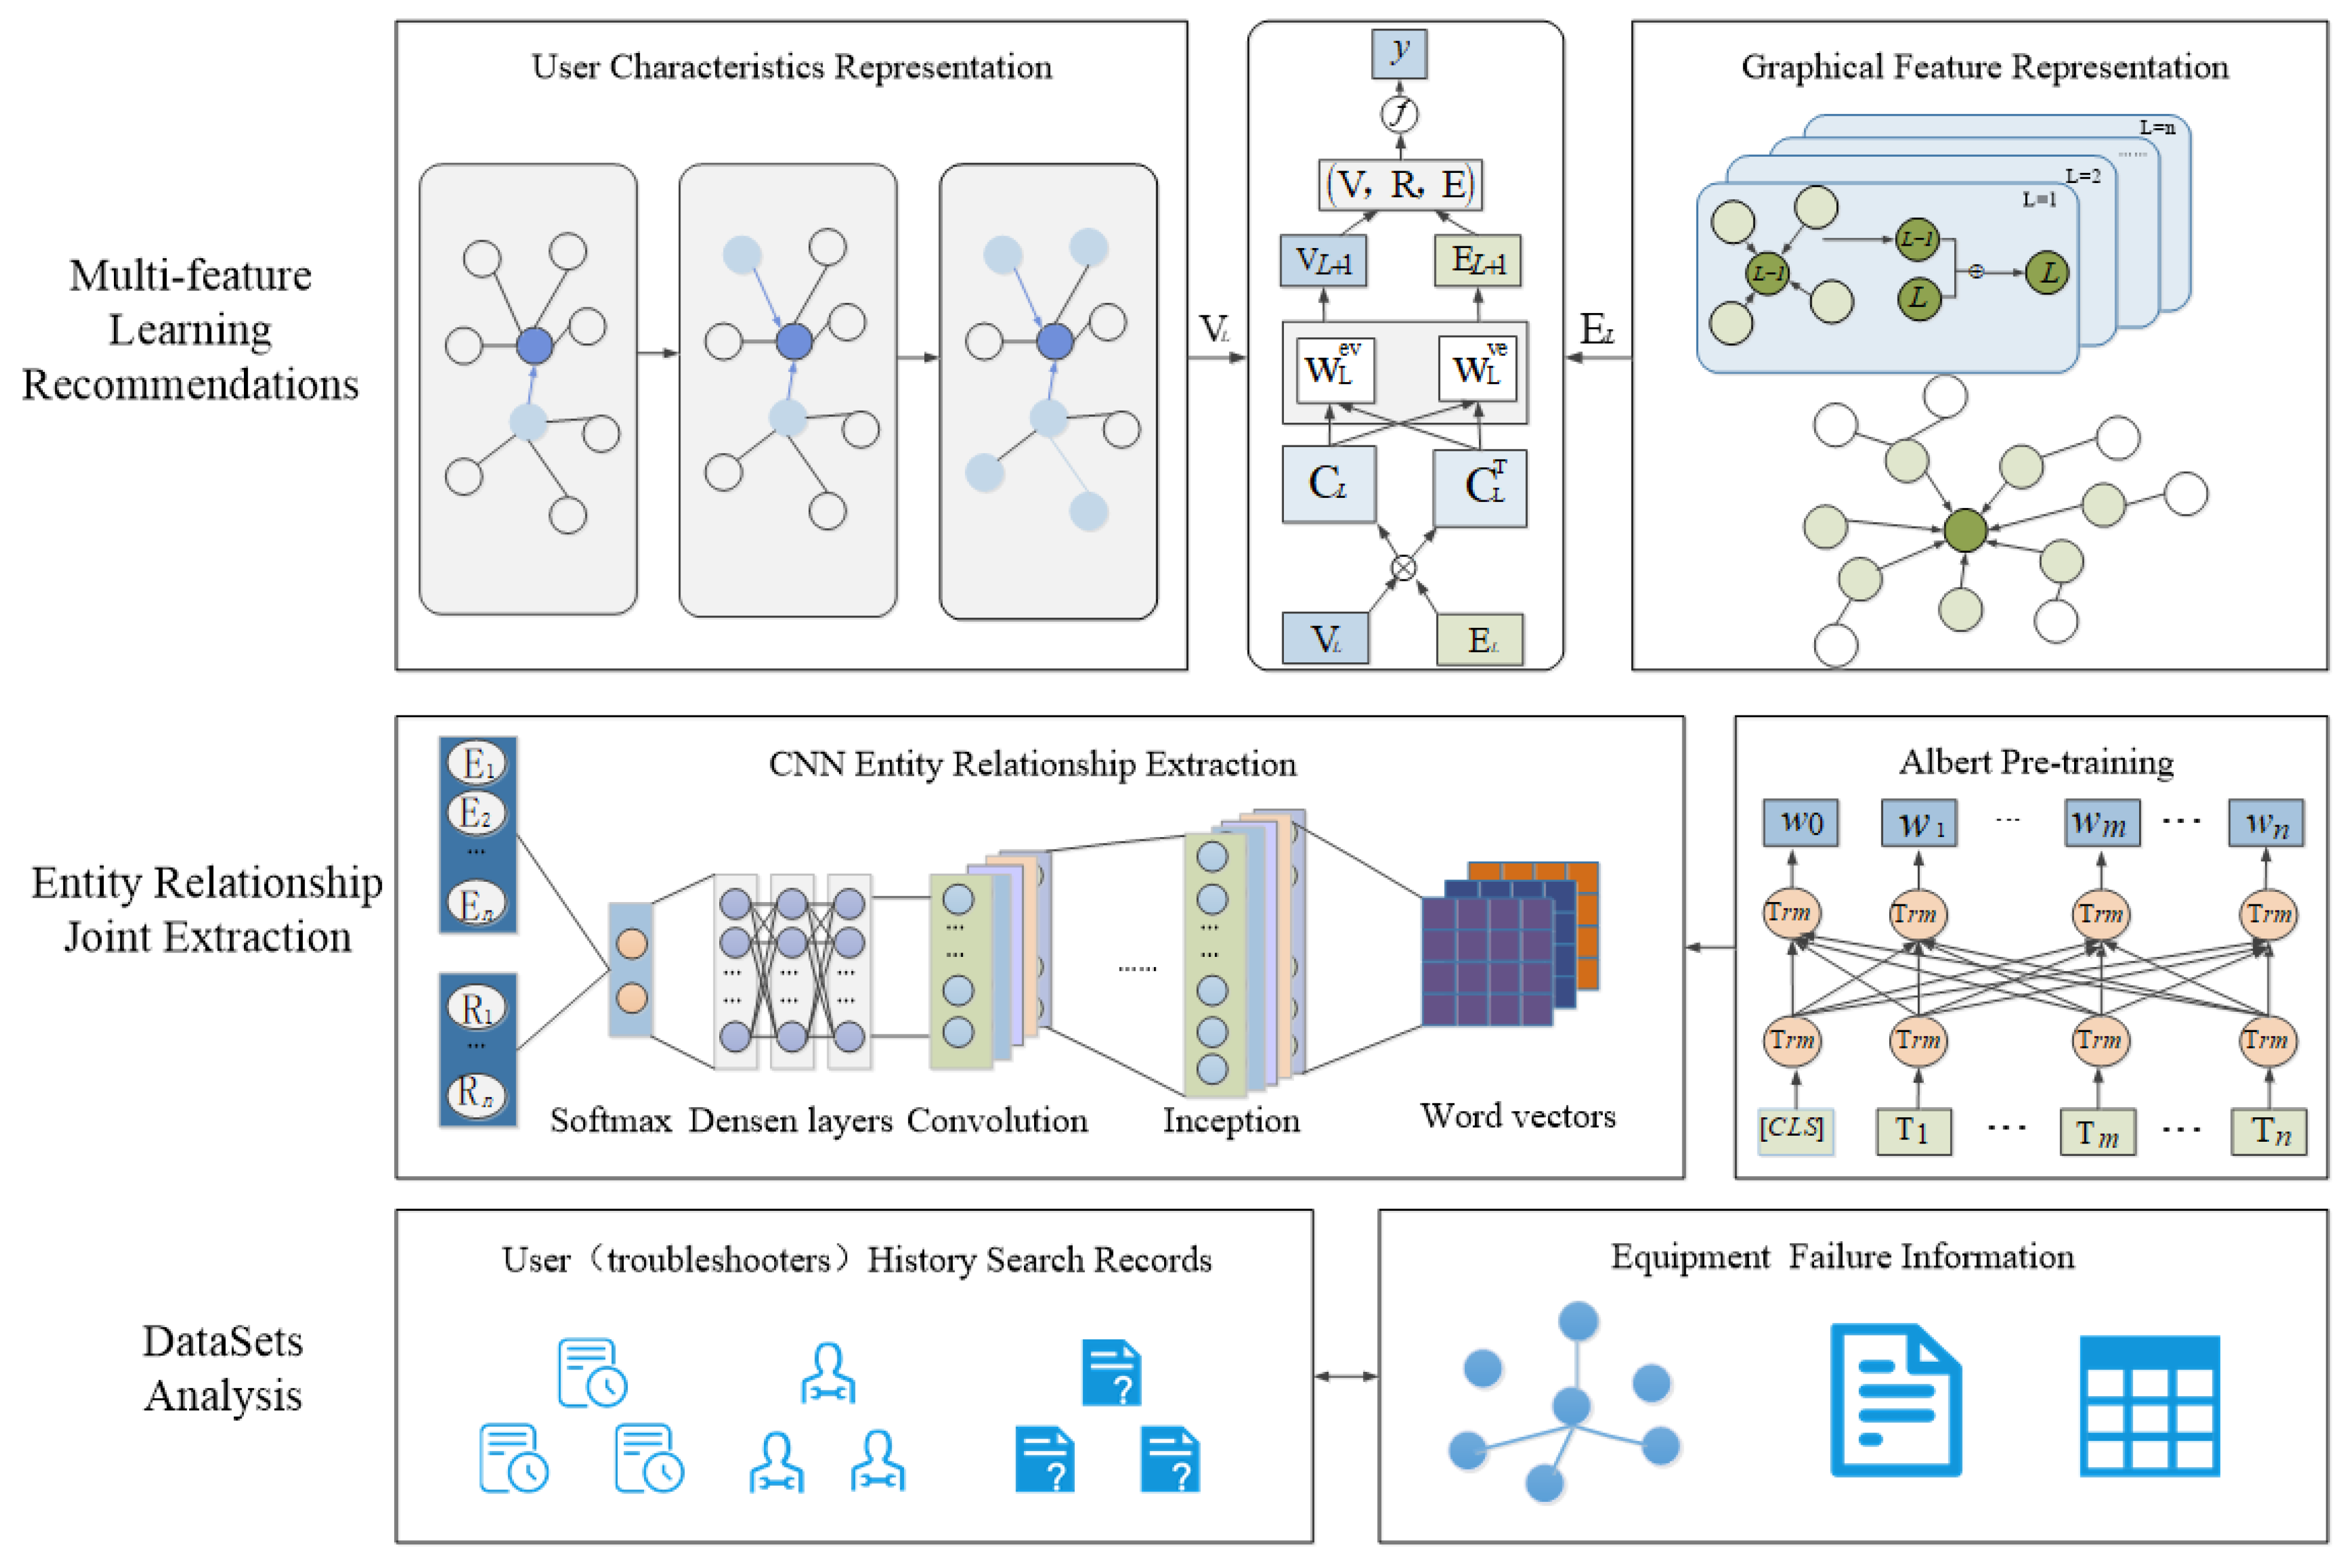
3. Methodology
3.1. Preliminaries
3.1.1. Equipment Failure Knowledge Graph
3.1.2. Predictive Function
3.1.3. Task Description
3.1.4. Data Pre-Processing
3.2. Electricity Knowledge Extraction
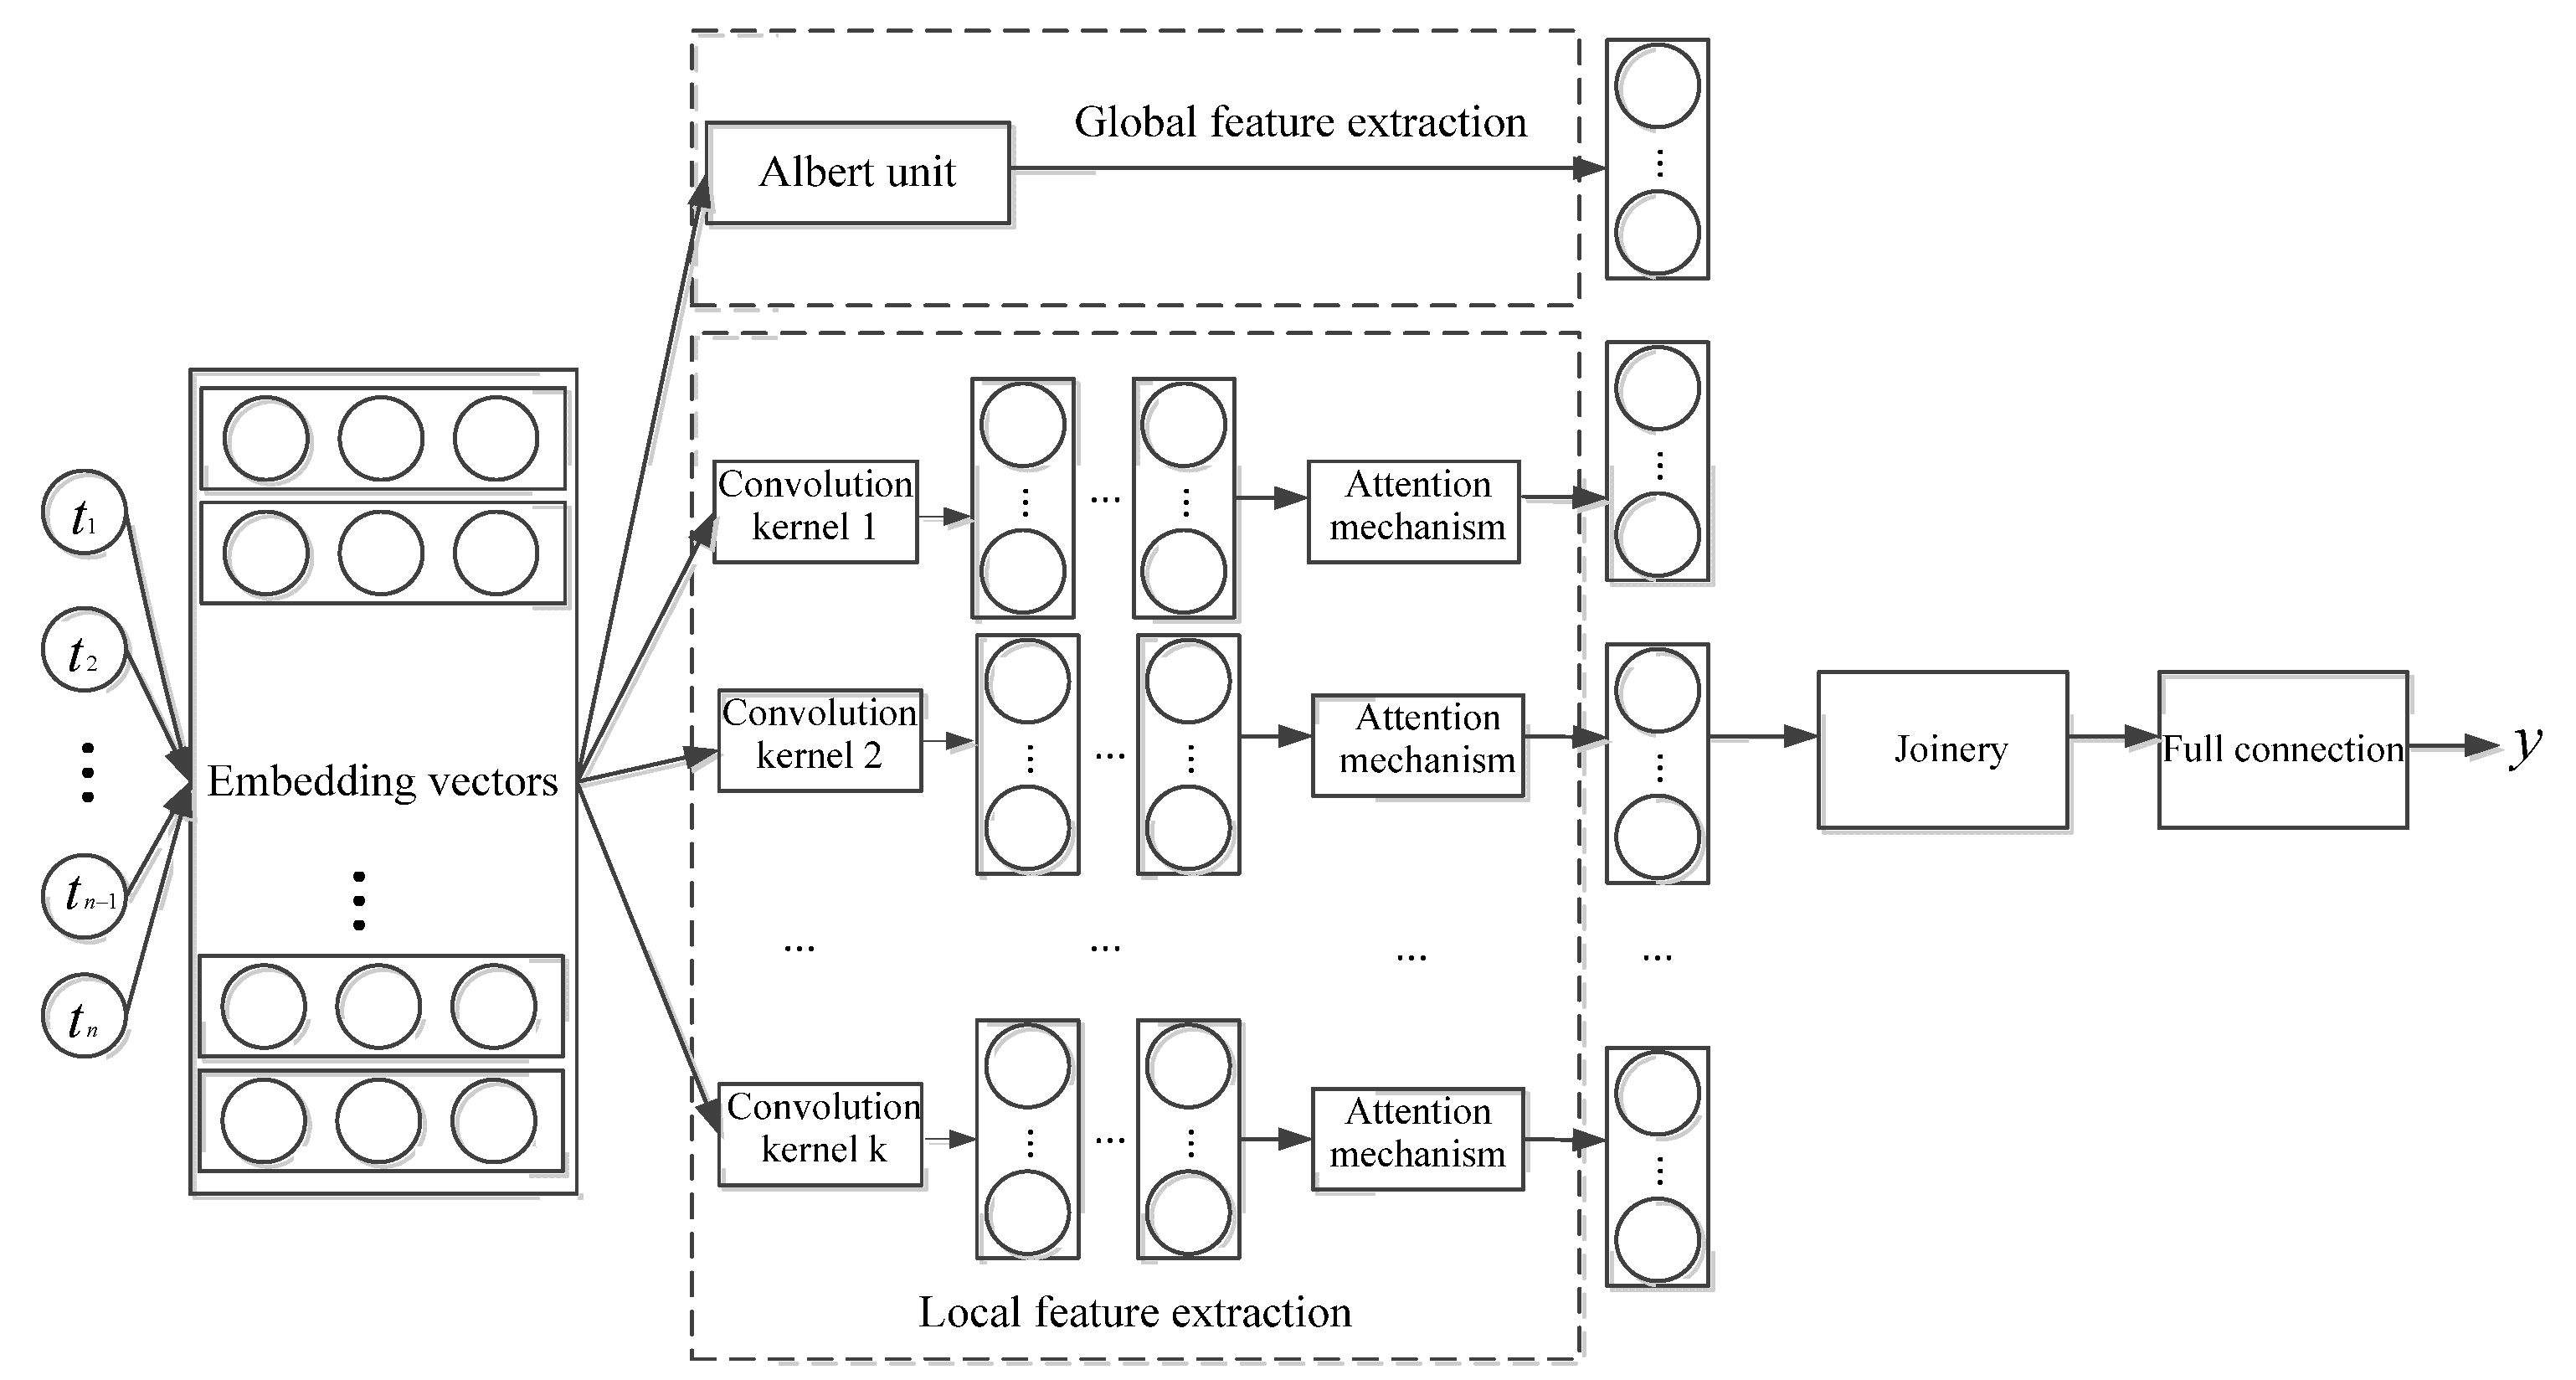
3.2.1. Input Layer
3.2.2. Global Feature Extraction Layer
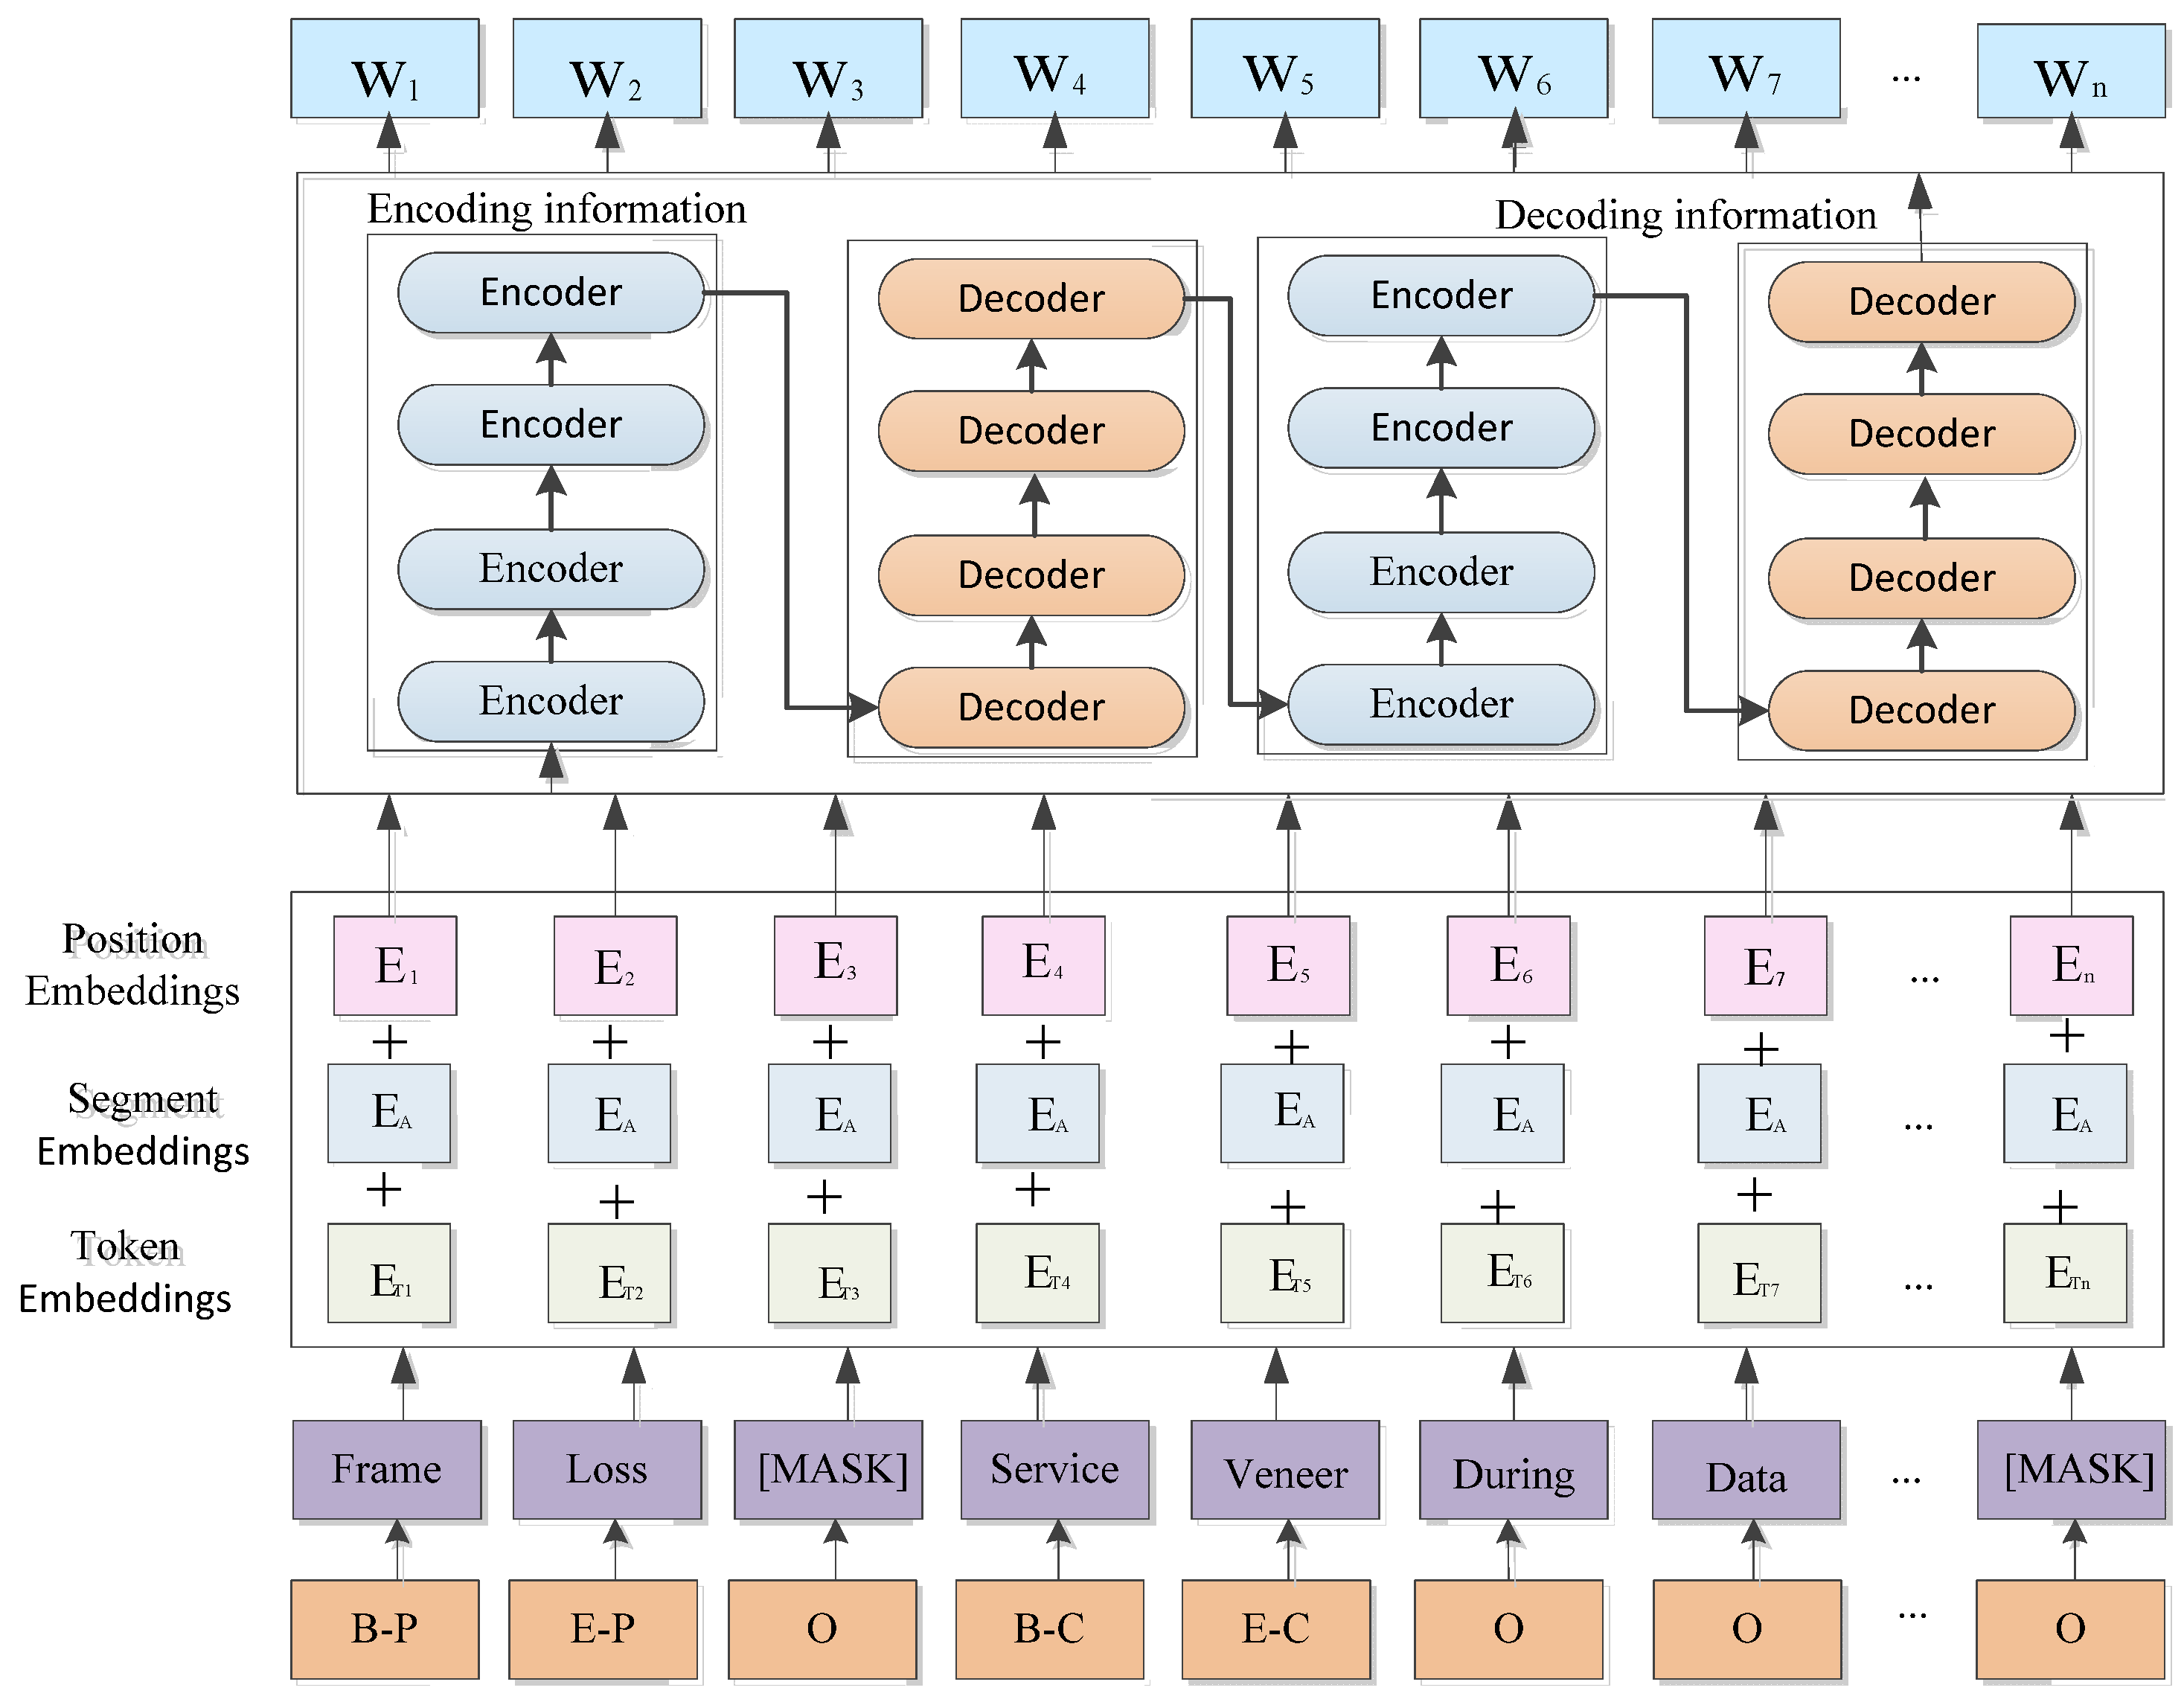
3.2.3. Local Feature Extraction Layer
| Algorithm 1: Entity relationship extraction algorithm |
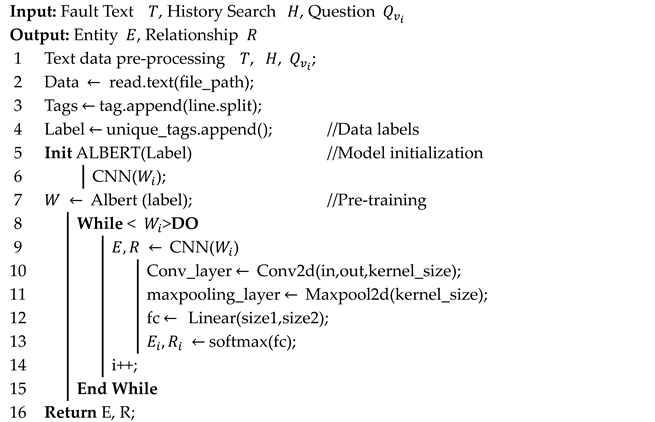 |
3.3. Multi-Feature Learning Recommendations
3.3.1. User Preference Representation
3.3.2. Graph Neighborhood Representation
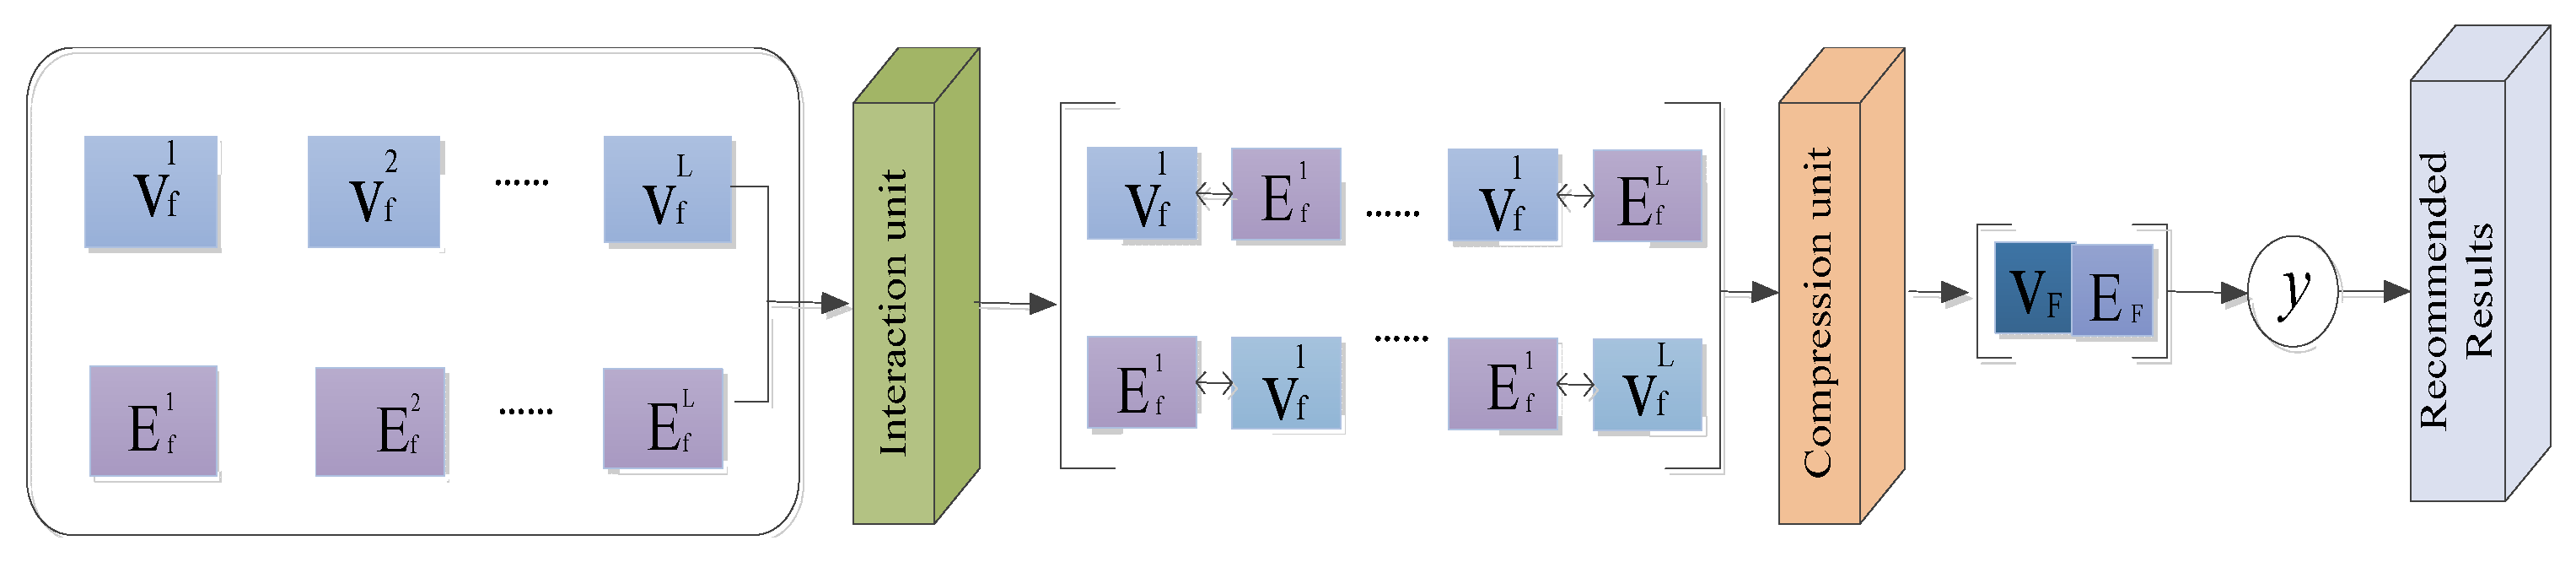
3.3.3. Multi-Feature Interaction
| Algorithm 2: Multi-feature interaction learning algorithm |
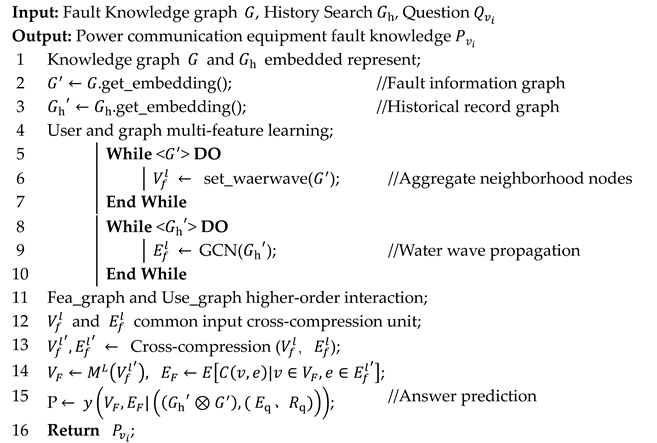 |
4. Experimental Results and Analysis
4.1. Experimental Setting and Data
4.2. Experimental Analysis for Electricity Knowledge Extraction
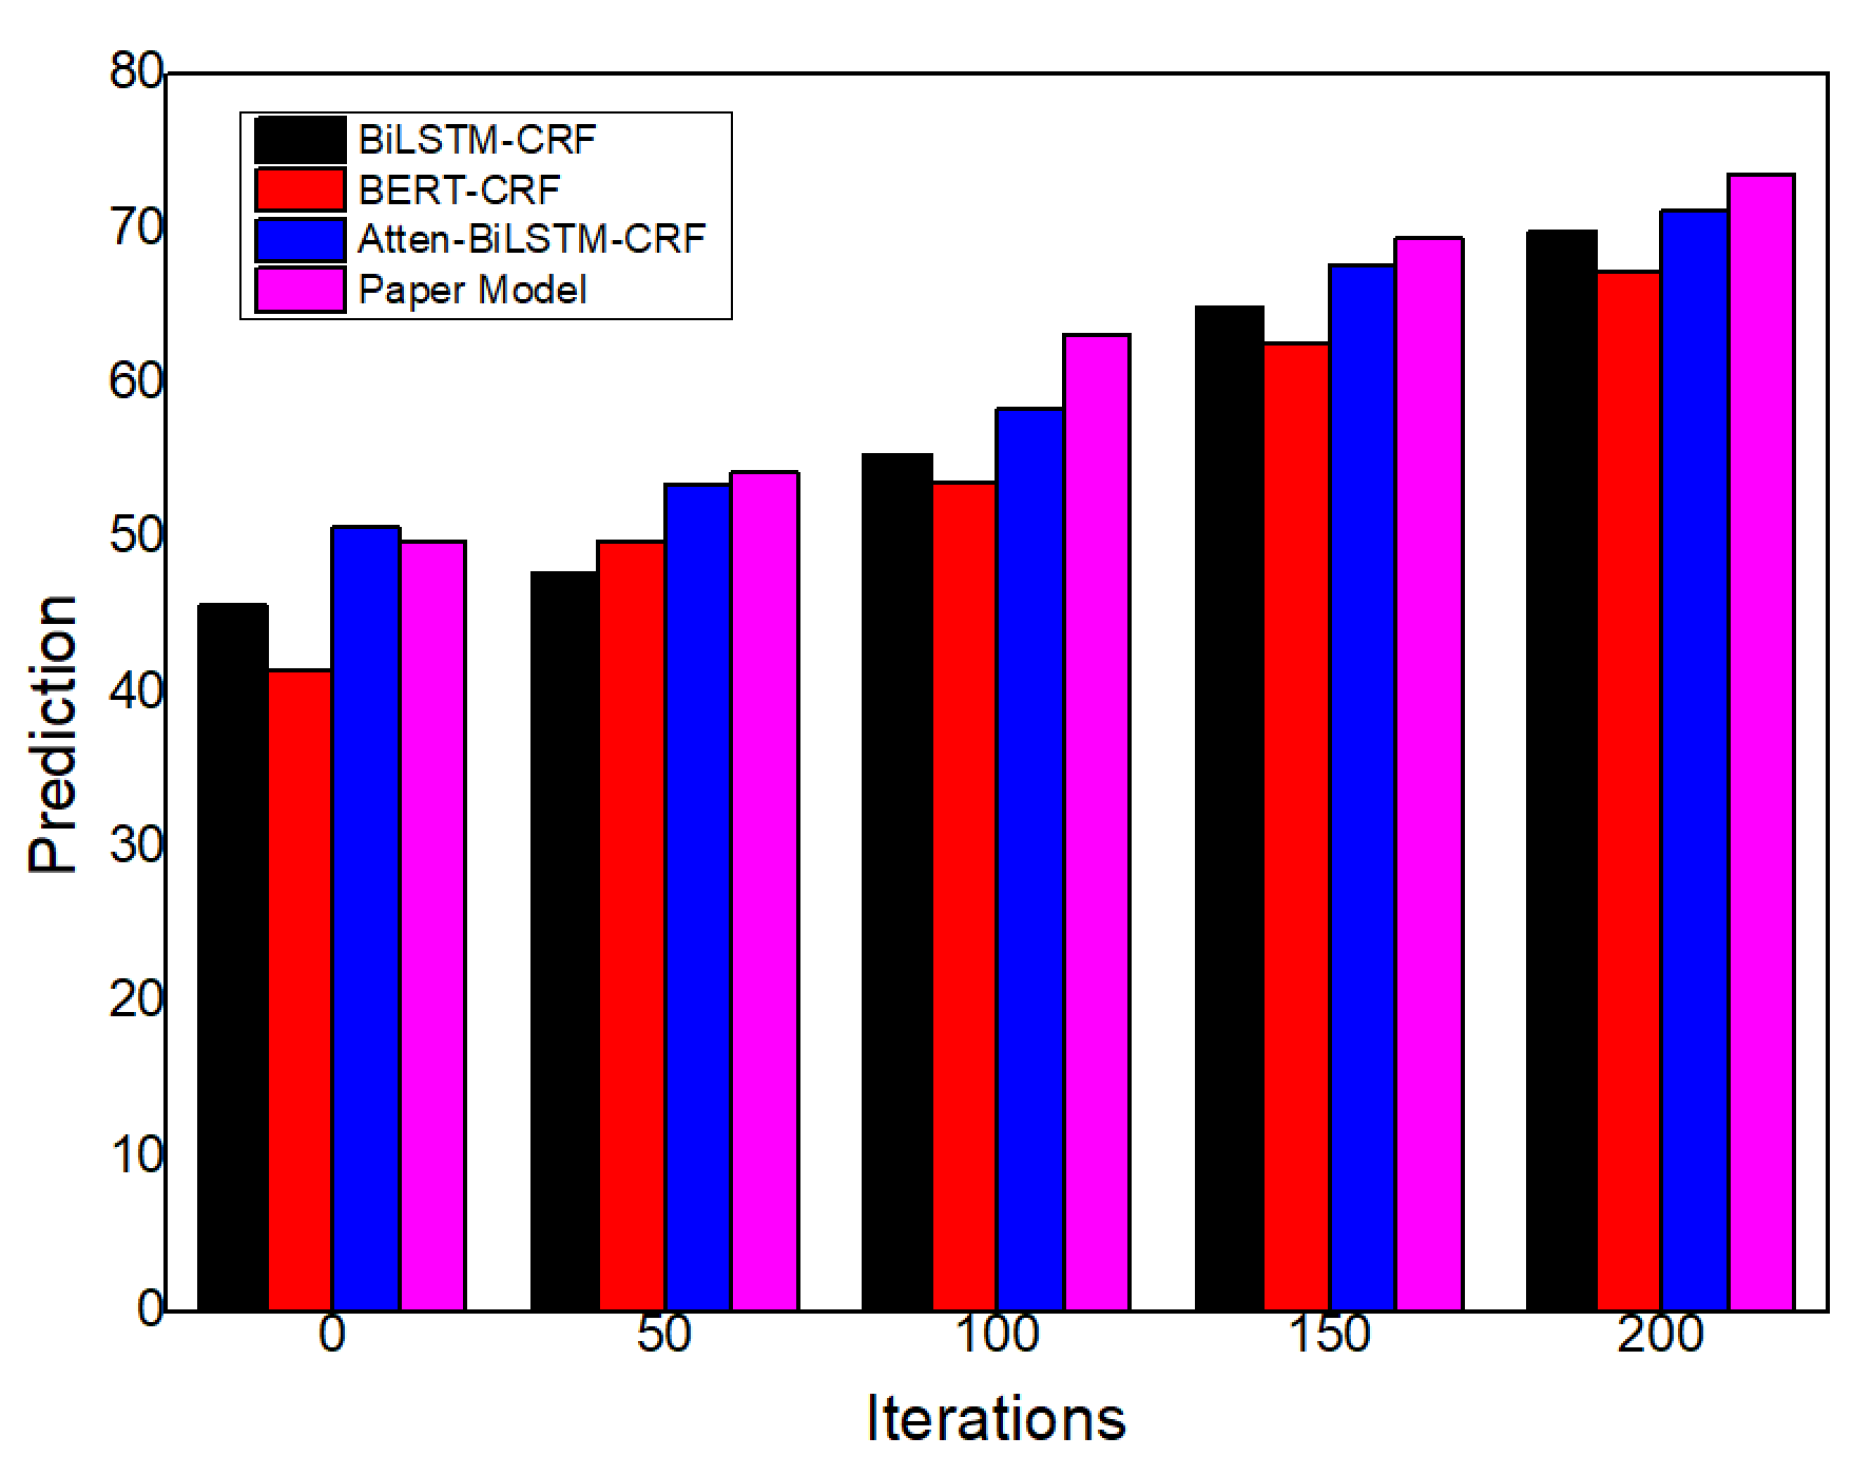
4.2.1. Performance Comparison
4.2.2. Parameter Analysis
4.2.3. Sample of Electricity Knowledge Extraction
4.3. Data Storage Structure of Atlas
4.4. Experimental Analysis of Multi-Feature Recommendation
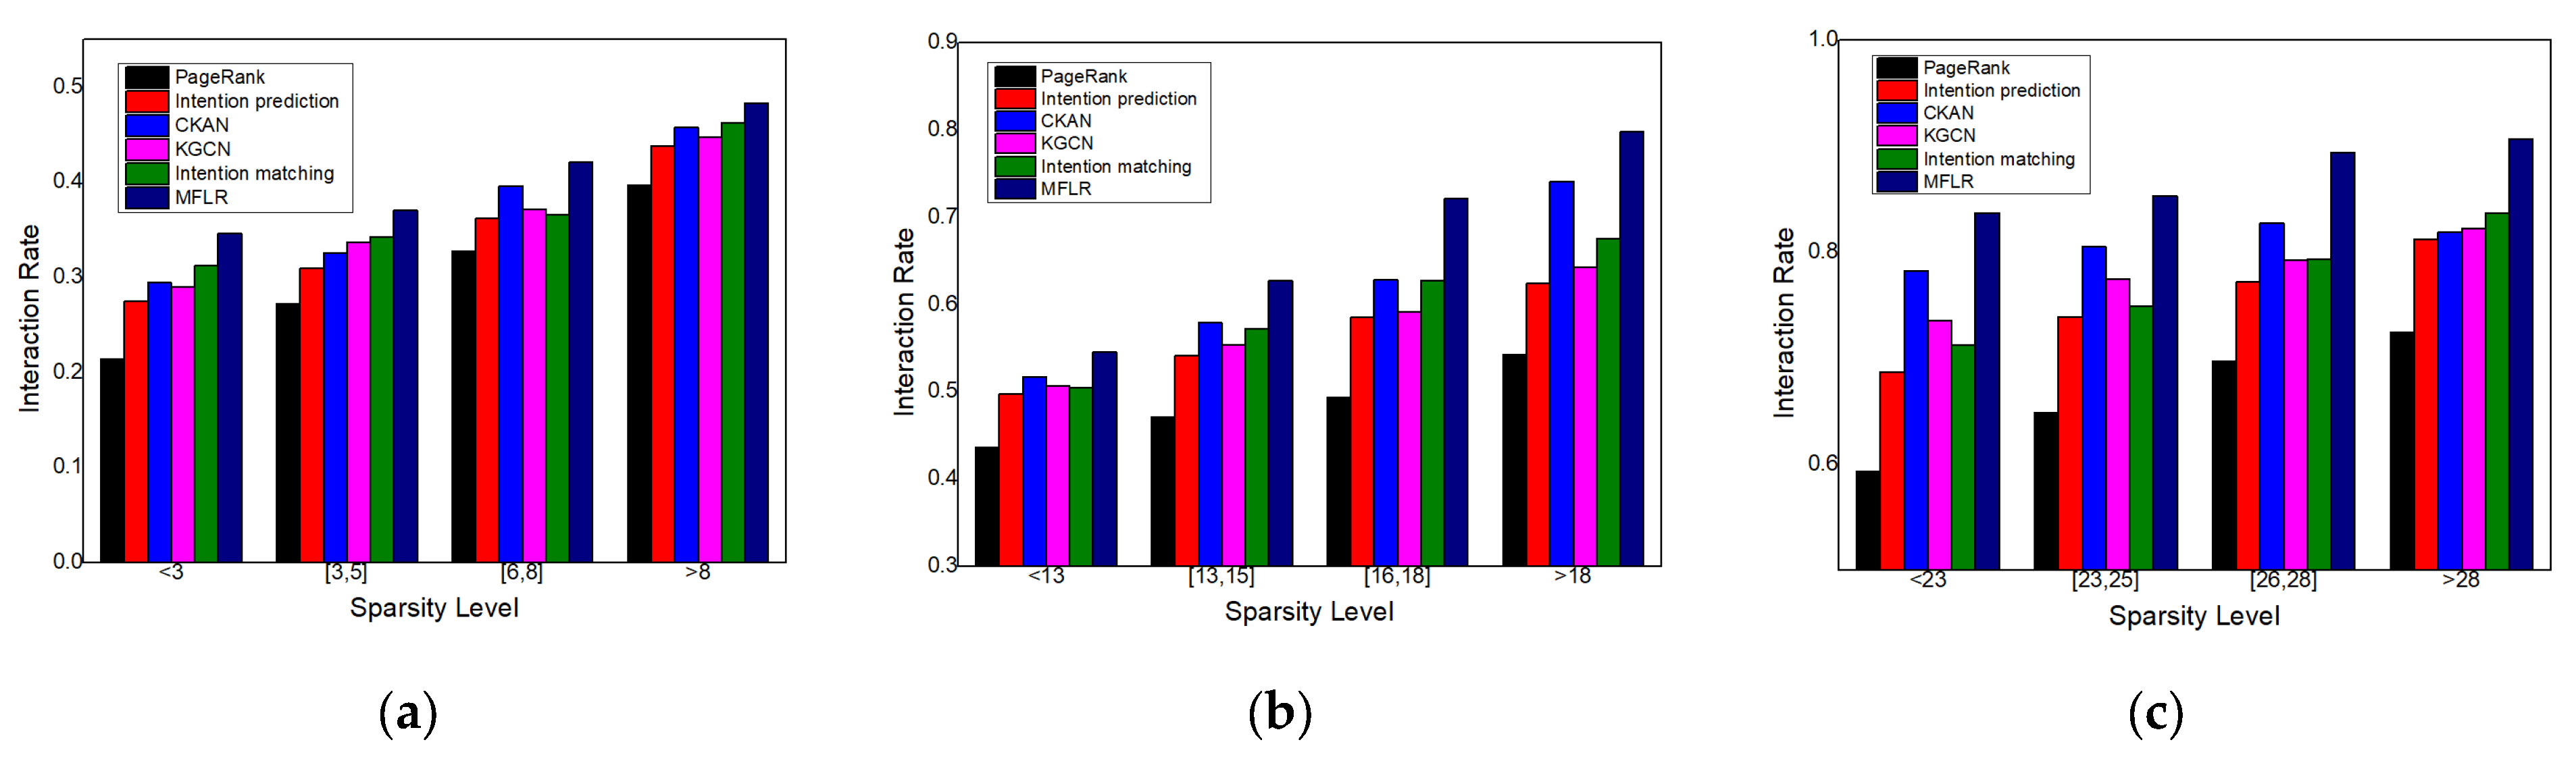
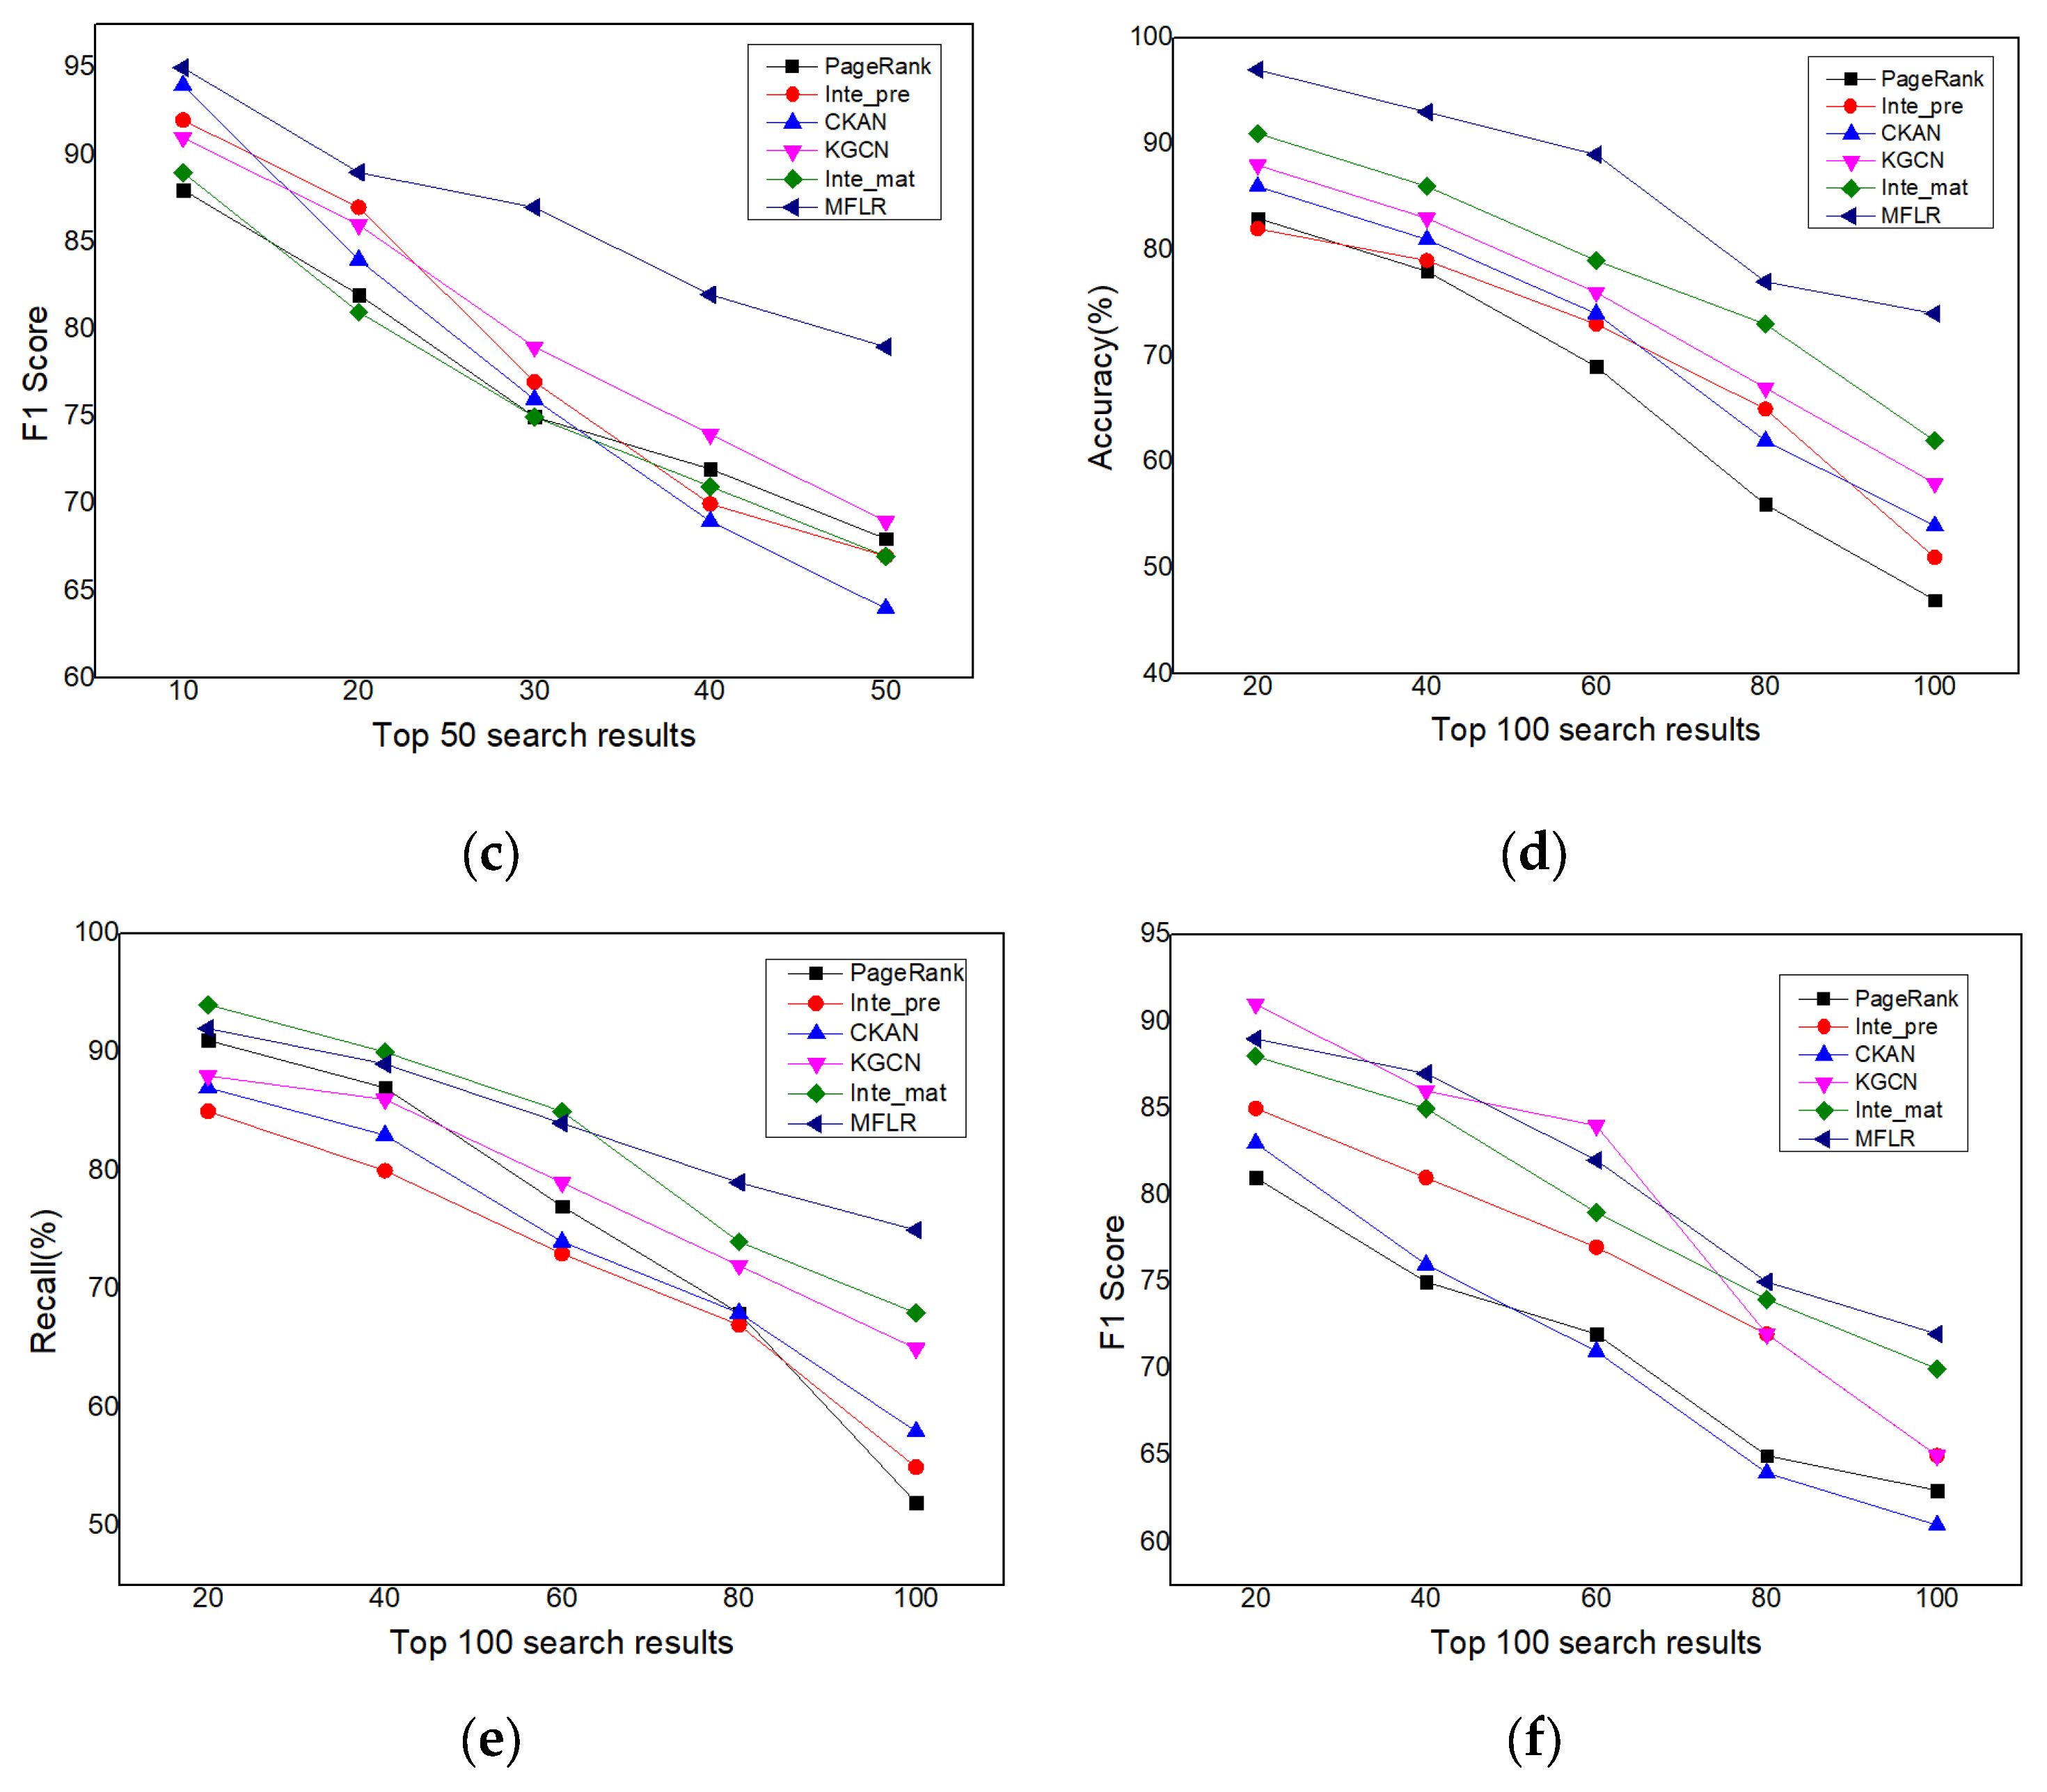
4.4.1. Performance of MFLR
- (1)
- Hit Forecast
- (2)
- Top-K Recommendation
4.4.2. Hyperparametric Analysis
- (1)
- Cross-compression Unit Analysis
- (2)
- Sampling Neighborhood Number N Analysis
- (3)
- Graph Convolutional Network Layer L Analysis
5. Conclusions
Author Contributions
Funding
Data Availability Statement
Conflicts of Interest
References
- Bakkar, M.; Bogarra, S.; Córcoles, F. Artificial Intelligence-Based Protection for Smart Grids. Energies 2022, 15, 4933. [Google Scholar] [CrossRef]
- De, L.; Cruz, J.; Gómez-Luna, E.; Ali, M. Fault location for distribution smart grids: Literature overview, challenges, solutions, and future trends. Energies 2023, 16, 2280. [Google Scholar]
- Liang, K.; Zhou, B.; Zhang, Y.; He, Y.; Guo, X.; Zhang, B. A Multi-Entity Knowledge Joint Extraction Method of Communication Equipment Faults for Industrial IoT. Electronics 2022, 11, 979. [Google Scholar] [CrossRef]
- Junior, R.; Almeida, F.; Gomes, F. Fault classification in three-phase motors based on vibration signal analysis and artificial neural networks. Neural Comput. Appl. 2020, 32, 5–6. [Google Scholar]
- Do, P.; Phamp, W. KG2Vec: A weighted text-enhanced meta-path-based knowledge graph embedding for similarity search. Neural Comput. Appl. 2021, 33, 16533–16555. [Google Scholar] [CrossRef]
- Zamini, M.; Hassan, R.; Rabiei, M. A review of knowledge graph completion. Artif. Intell. 2022, 8, 396. [Google Scholar] [CrossRef]
- Liu, J.; Huang, W.; Li, T. Cross-domain knowledge graph chiasmal embedding for multi-domain item-item recommendation. IEEE Trans. Knowl. Data Eng. 2022, 35, 4621–4633. [Google Scholar] [CrossRef]
- Chen, J.; Yu, W.; Lu, Y.; Qian, P.; Li, P. An Interpretive Rules-guided Recommendation over Knowledge Graph. Inf. Sci. 2021, 563, 326–341. [Google Scholar] [CrossRef]
- Nguyen, D.P.; Ho, T.B. Drug-drug interaction extraction from biomedical texts via relation BERT. In Proceeding of the 19th ACM International Conference Computer Communication Technology, Ho Chi Minh City, Vietnam, 14–15 October 2020; pp. 1–7. [Google Scholar]
- Bekoulisg, D.; Demeestert, E. Joint entity recognition and relation extraction as a multi-head selection problem. Expert Syst. Appl. 2018, 114, 34–45. [Google Scholar] [CrossRef]
- Wei, Z.P.; Su, J.L. A novel hierarchical binary tagging framework for joint extraction of entities and relations. In Proceedings of the 58th Annual Meeting of the Association for Computational Linguistics, Online, 5–10 July 2020. [Google Scholar]
- Liang, Y.; Qian, T.; Li, Q. Enhancing domain-level and user-level adaptivity in diversified recommendation. In Proceedings of the 44th International ACM SIGIR Conference on Research and Development in Information Retrieval, Online, 11–15 July 2021; pp. 747–756. [Google Scholar]
- Jin, H.; Zhao, X.; Dou, H. Improving Sequential Recommendation with Knowledge-Enhanced Memory Networks. In Proceedings of the 41st International ACM SIGIR Conference, Ann Arbor, MI, USA, 8–12 July 2018; pp. 505–514. [Google Scholar]
- Xie, F.; Zheng, A.; Chen, Z. Attentive Meta-graph Embedding for item Recommendation in heterogeneous information networks. Knowl. Based Syst. 2020, 45, 106. [Google Scholar] [CrossRef]
- Singer, U.; Roitman, H.; Eshel, Y. Sequential Modeling with Multiple Attributes for Watchlist Recommendation in E-Commerce. arXiv 2021, arXiv:2110.11072. [Google Scholar]
- Lv, K.; Yi, W.; Zhou, M. A review of the knowledge extraction technology in knowledge graph. In Proceedings of the 41st Chinese Control Conference, Hefei, China, 25–27 July 2022; pp. 4211–4218. [Google Scholar]
- Khaing, M.; Thein, M. Stock Trend Extraction using Rule-based and Syntactic Feature-based Relationships between Named Entities. In Proceedings of the 2019 International Conference on Advanced Information Technologies, Yangon, Myanmar, 6–7 November 2019; pp. 78–83. [Google Scholar]
- Xu, C.; Li, S. Research on the construction of tourism knowledge graph by integrating BERT-WWM and pointer network. Comput. Eng. Appl. 2022, 58, 280–288. [Google Scholar]
- Jiang, C.; Wang, Y.; Chen, M. Transformer fault recognition based on kbert text clustering model. High Volt. Eng. 2022, 48, 2991–3000. [Google Scholar]
- Song, Y.; Yu, Y.; Liang, X.; Wang, Y.; Hou, T. Calibration method of line transformer relationship in distribution network based on data analysis of electric energy metering management system. High Volt. Eng. 2021, 47, 4461–4470. [Google Scholar]
- Srivastava, S.; Bej, K.; Schultz, K.; Wolkenhauer, O. Attention Retrieval Model for Entity Relation Extraction from Biological Literature. IEEE Access. 2022, 10, 1109. [Google Scholar] [CrossRef]
- Al-Sabri, J.; Gao, J.; Chen, B.; Oloulade, M.; Lyu, T. Multi-View Graph Neural Architecture Search for Biomedical Entity and Relation Extraction. IEEE/ACM Trans. Comput. Biol. Bioinform. 2023, 26, 1221–1233. [Google Scholar] [CrossRef] [PubMed]
- Zhang, R.; Meng, F.; Zhou, Y. Relation classification via recurrent neural network with attention and tensor layers. Big Data Min. Anal. 2018, 1, 234–244. [Google Scholar]
- Christou, D.; Tsoumakas, G. Improving Distantly-Supervised Relation Extraction through BERT-Based Label and Instance Embeddings. IEEE Access 2021, 10, 1109. [Google Scholar] [CrossRef]
- Erekhinskaya, T.; Balakrishna, M.; Tatu, M.; Werner, S.; Moldovan, D. Knowledge extraction for literature review. In Proceedings of the 2016 IEEE/ACM Joint Conference on Digital Libraries, Newark, NJ, USA, 19–23 June 2016; pp. 221–222. [Google Scholar]
- Eberts, M.; Ulges, A. Span-based joint entity and relation extraction with transformer pre-training. arXiv 2019, arXiv:1909.07755. [Google Scholar]
- Hillebrand, L.; Deußer, T. KPI-BERT: A Joint Named Entity Recognition and Relation Extraction Model for Financial Reports. In Proceedings of the 26th International Conference on Pattern Recognition, Montreal, QC, Canada, 21–25 August 2022; pp. 606–612. [Google Scholar]
- Lai, T.; Ji, H.; Zhai, C.X. Joint biomedical entity and relation extraction with knowledge-enhanced. In Proceedings of the 59th Annual Meeting of the Association for Computational Linguistics and the 11th International Joint Conference on Natural Language Processing, Virtual, 1–6 August 2021; pp. 6248–6260. [Google Scholar]
- Carbonell, M.; Riba, P.; Villegas, M.; Fornés, A.; Lladós, J. Named Entity Recognition and Relation Extraction with Graph Neural Networks in Semi Structured Documents. In Proceedings of the 25th International Conference on Pattern Recognition, Milan, Italy, 10–15 January 2021; pp. 9622–9627. [Google Scholar]
- Zhao, C.; Cao, H.; Lv, P.; Chu, Y.; Wang, F.; Liao, T. Adaptive Context-Embedded Hypergraph Convolutional Network for Session-based Recommendation. Inf. Technol. Control. 2023, 52, 111–127. [Google Scholar] [CrossRef]
- Li, Y. A graph convolution network based on improved density clustering for recommendation system. Inf. Technol. Control. 2022, 51, 18–31. [Google Scholar] [CrossRef]
- Sun, W.; Chen, P.; Xiong, J.; Shen, J. Graph attention recommendation model based on two-terminal knowledge graph. Comput. Eng. Appl. 2021, 58, 141–147. [Google Scholar]
- Gunasekar, M.; Thilagamani, S. Improved Feature Representation Using Collaborative Network for Cross-Domain Sentiment Analysis. Inf. Technol. Control. 2023, 52, 100–110. [Google Scholar] [CrossRef]
- Shambour, Q.Y.; Abu-Shareha, A.A.; Abualhaj, M.M. A Hotel Recommender System Based on Multi-Criteria Collaborative Filtering. Inf. Technol. Control. 2022, 51, 390–402. [Google Scholar] [CrossRef]
- Sangeetha, M.; Thiagarajan, M. An Enhanced Neural Graph based Collaborative Filtering with Item Knowledge Graph. Int. J. Comput. Commun. Control. 2022, 17, 4. [Google Scholar]
- Sun, Z.; Yang, J. Recurrent knowledge graph embedding for effective recommendation. In Proceedings of the 12th ACM Conference on Recommender Systems, Vancouver, BC, Canada, 2–7 October 2018; pp. 297–305. [Google Scholar]
- Lyu, Z.; Wu, Y.; Lai, J.; Yang, M. Knowledge Enhanced Graph Neural Networks for Explainable Recommendation. IEEE Trans. Knowl. Data Eng. 2023, 3, 5. [Google Scholar] [CrossRef]
- Gao, J.; Liu, Q.; Huang, W. Research on automatic generation of learning paths based on knowledge graphping. Mod. Educ. Technol. 2021, 57, 1–23. [Google Scholar]
- Kartheek, M.; Sajeev, P. Building Semantic Based Recommender System Using Knowledge Graph Embedding. In Proceedings of the Sixth International Conference on Image Information Processing, Shimla, India, 26–28 November 2021; pp. 25–29. [Google Scholar]
- Jiao, J.; Wang, S.; Zhang, X.; Wang, L.; Wang, J. gMatch: Knowledge base question answering via semantic matching. Knowl.-Based Syst. 2021, 43, 2–5. [Google Scholar] [CrossRef]
- Hu, B.; Shi, B. Leveraging meta-path based context for top-n recommendation with a neural co-attention model. In Proceedings of the 24th ACM SIGKDD International Conference on Knowledge Discovery & Data Mining, London, UK, 19–23 August 2018; pp. 1531–1540. [Google Scholar]
- Zhao, H.; Yao, Q. Meta-graph based recommendation fusion over heterogeneous information networks. In Proceedings of the 23rd ACM SIGKDD International Conference on Knowledge Discovery and Data Mining, Halifax, NS, Canada, 13–17 August 2017; pp. 635–644. [Google Scholar]
- Suzuki, T.; Oyama, S.; Kurihara, M. A Framework for Recommendation Algorithms Using Knowledge Graph and Random Walk Methods. In Proceedings of the 2020 IEEE International Conference on Big Data, Atlanta, GA, USA, 10–13 December 2020; pp. 3085–3087. [Google Scholar]
- Wang, H.W.; Zhang, F.Z. RippleNet: Propagating user preferences on the knowledge graph for recommender systems. In Proceedings of the 27th ACM International Conference on Information and Knowledge Management, Torino, Italy, 22–26 October 2018; pp. 417–426. [Google Scholar]
- Mezni, H.; Benslimane, D.; Bellatreche, L. Context-Aware Service Recommendation Based on Knowledge Graph Embedding. IEEE Trans. Knowl. Data Eng. 2022, 34, 11. [Google Scholar] [CrossRef]
- Wang, X.; He, X.N.; Cao, Y.X. KGAT: Knowledge graph attention network for recommendation. In Proceedings of the 25th ACM SIGKDD International Conference on Knowledge Discovery & Data Mining, Anchorage, AK, USA, 4–8 August 2019; pp. 950–958. [Google Scholar]
- Ferguson, N.; Mu, D.; Gong, R. Gated Knowledge Graph Neural Networks for Top-N Recommendation System. In Proceedings of the 24th International Conference on Computer Supported Cooperative Work in Design, Dalian, China, 5–7 May 2021; pp. 1111–1116. [Google Scholar]
- Wang, P.F.; Li, M.C.; Li, S. Chinese medical named entity recognition based on data augmentation. J. Beijing Univ. Posts Telecommun. 2020, 32, 57. [Google Scholar]
- Cui, Y.; Sun, H.; Zhao, Y. Sequential-Knowledge-Aware Next POI Recommendation: A Meta-Learning Approach. ACM Trans. Inf. Syst. 2022, 40, 1–22. [Google Scholar] [CrossRef]
- Maskeliūnas, R.; Pomarnacki, R.; Khang Huynh, V.; Damaševičius, R.; Plonis, D. Power Line Monitoring through Data Integrity Analysis with Q-Learning Based Data Analysis Network. Remote Sens. 2023, 15, 194. [Google Scholar] [CrossRef]
- Sedghi, H.; Jonckheere, E. Statistical Structure Learning to Ensure Data Integrity in Smart Grid. IEEE Trans. Smart Grid. 2015, 6, 4. [Google Scholar] [CrossRef]
- Anwar, A.; Mahmood, N.; Tari, Z. Ensuring Data Integrity of OPF Module and Energy Database by Detecting Changes in Power Flow Patterns in Smart Grids. IEEE Trans. Ind. Inform. 2017, 13, 6. [Google Scholar] [CrossRef]


| Classification | Paper | Approach Summary | Advantages | Limitations |
|---|---|---|---|---|
| Pipeline extraction | Srivastava et al. [21] | self-attention entity relationships with directionality | directional entity relationship | (1) Accumulation of misinformation. (2) Lack of relevance. (3) Difficulty in uncovering hidden relationships. |
| Al-Sabri et al. [22] | multi-view graph neural network automated modeling | multi-view entity relationships | ||
| Zhang et al. [23] | RNN-based relationship extraction | remote multi-order relationships | ||
| Christou et al. [24] | relationship extraction based on remote supervised transformers | potential relationship | ||
| Joint extraction | Ebert et al. [26] | segment alignment at the output | multi-order implicit relationships | (1) Inability to address overlapping entity relationships. (2) Generates redundant information. |
| Hillebrand et al. [27] | recursive neural networks combined with conditional label masks | simplifies the extraction task | ||
| Lai et al. [28] | collective reasoning to achieve joint extraction | |||
| Carbonell et al. [29] | supervised messaging joint extraction of entity relationships | semi-structured document extraction |
| Classification | Paper | Approach Summary | Advantages | Limitations |
|---|---|---|---|---|
| Semantic-embedding-based | Huang et al. [36] | TransE algorithm + preference semantics | Obtaining user preference information | (1) Inability to mine the implicit relationships that exist between entities (2) Lack of mining the textual meaning of the knowledge graph entities themselves |
| Lyu et al. [37] | User behavior learning and reasoning | Improved interpretability of recommendation results | ||
| Gao et al. [38] | Query intent modeling based on semantic matching | |||
| Kartheek et al. [39] | Semantic-based graph-embedded interpretable recommenders | Improved recommendation time performance | ||
| Graph-path-based | Jiao et al. [40] | Proposed the concept of multi-step relational paths | Multi-relational paths in explorable semantic relations | (1) Lack of entity relationship feature semantics (2) Lack of universality in routing |
| Hu et al. [41] | Vector representation of users and projects | Highly interactive for users and projects | ||
| Zhao et al. [42] | Introducing meta-graphs into path recommendations | Fast aggregation of neighborhood information | ||
| Suzuki et al. [43] | Combination of meta-paths and random wandering | Avoids falling into optimality | ||
| The hybrid approach | Wang et al. [44] | Utilizes the latent preferences of the user to obtain the hierarchical interests of the user | Enables personalized recommendations | (1) Insufficient utilization of information on the structure of the knowledge graph (2) Higher-order interactions are difficult to model |
| Mezni et al. [45] | Emotion knowledge graph embedding | Scoring based on user sentiment | ||
| Wang et al. [46] | Aggregate entity neighborhood information | Links to higher-order relationships | ||
| Ferguson et al. [47] | Sorting recommendations based on knowledge graph neural networks | Selective and memorized information |
| Label Type | Label Content | Label Meaning |
|---|---|---|
| Entity Category | NAM | equipment name |
| FT | fault type | |
| FL | fault location | |
| FP | fault phenomenon | |
| FS | fault cause | |
| PF | prescription | |
| Relationship Category | BI | inclusion/affiliation |
| SL | settlement/processing | |
| FC | causality | |
| OL | overlapping |
| Character Sequence | The | Source | Link | Fails | , | Which |
|---|---|---|---|---|---|---|
| Label Sequence | O | B-NAM | I-NAM | B-FS | O | O |
| Character Sequence | leads | to | the | loss | of | service |
| Label Sequence | B-FC | I-FC | O | B-FP | O | B-NAM |
| Character Sequence | packages | . | The | solution | of | failure |
| Label Sequence | I-NAM | O | O | B-SL | O | O |
| Character Sequence | is | to | replace | source | side | veneer |
| Label Sequence | O | O | B-PF | I-PF | I-PF | I-PF |
| Faulty Text Dataset | Cluener | |
|---|---|---|
| sample volume | 25,430 | 12,091 |
| training set | 15,258 | 7255 |
| test set | 5086 | 2418 |
| parameter optimization | 5086 | 2418 |
| Dataset | d | N | L | η | ||
|---|---|---|---|---|---|---|
| Faulty text dataset | 128 | 8 | 1 | 0.01 | 0.0005 |
| Algorithm | Faulty Text Dataset | Cluener | ||||
|---|---|---|---|---|---|---|
| Accuracy | Recall | F1-Score | Accuracy | Recall | F1-Score | |
| BiLSTM-CRF | 0.684 | 0.713 | 0.740 | 0.724 | 0.749 | 0.775 |
| BERT-CRF | 0.696 | 0.709 | 0.778 | 0.719 | 0.726 | 0.757 |
| Atten-BiLSTM-CRF | 0.702 | 0.721 | 0.769 | 0.742 | 0.803 | 0.825 |
| Paper Model | 0.749 | 0.774 | 0.817 | 0.798 | 0.821 | 0.857 |
| Dataset | |||||
|---|---|---|---|---|---|
| Faulty text dataset | 0.674 | 0.742 | 0.839 | 0.791 | 0.827 |
| Cluener | 0.528 | 0.649 | 0.753 | 0.720 | 0.732 |
| No. | Input Corpus | Prediction Result |
|---|---|---|
| 1 | An A_LOC alarm appears on the optical template. The corresponding cause may be an error in the interface module. The solution is to replace the corresponding board at the source or check whether the interface module at the source is working properly. | {‘Equipment name’: [N1: ‘Optical template’], ‘Fault name’: [F1: ‘A_LOC’], ‘Issue cause’: [C1: ‘Interface failure’], ‘Programmatic’: [P1: ‘Replacement of veneer’, P2: ‘Check interfaces’], ‘Belong’: [R1: (F1, N1)], ‘Causality’: [R2: (C1, F1)], ‘Solution’: [R3: (P1, C1), (P2, C1)]} |
| 2 | A B2_SD alarm appears in the configuration field; the fault phenomenon may be a loss of information; the cause may be a configuration error; the corresponding solution is to reconfigure. | {‘Equipment name’: [N1: ‘Configuration segment’], ‘Fault name’: [F1: ‘B2_SD’], ‘Fault phenomenon’: [P1: ‘Missing information’], ‘Issue cause’: [C1: ‘Misconfiguration’], ‘Belong’: [R1: (F1, N1)], ‘Phenomenon’: [R2: (P1, F1)], ‘Causality’: [R3: (C1, F1)]} |
| 3 | HP_RDI alarm occurs in the transmission optical path; the fault phenomenon may be a BER alarm; the cause may be performance degradation or board failure; the corresponding solution is to deal with the BER or replace the board. | {‘Equipment name’: [N1: ‘Transport optical path’], ‘Fault name’: [F1: ‘HP_RDI’], ‘Fault phenomenon’: [P1: ‘Error code alarm’], ‘Issue cause’: [C1: ‘Performance deterioration, ‘C2′: Single-board failure’], ‘Programmatic’: [P1: ‘BER handling’, P2: ‘Replacement of veneer’], ‘Belong’: [R1: (F1, N1)], ‘Phenomenon’: [R2: (P1, F1)], ‘Causality’: [R3: (C1, F1), (C2, F1)], ‘Solution’: [R4: (P1, C1), (P2, C2)]} |
| Algorithm | AUC | ACC |
|---|---|---|
| PageRank | 0.729 | 0.813 |
| Intention prediction | 0.714 | 0.824 |
| CKAN | 0.762 | 0.844 |
| KGCN | 0.771 | 0.853 |
| Intention matching | 0.815 | 0.871 |
| MFLR | 0.879 | 0.923 |
| Algorithm | Accuracy | Recall | F1-Score |
|---|---|---|---|
| PageRank | 0.813 | 0.857 | 0.752 |
| Intention prediction | 0.824 | 0.801 | 0.816 |
| CKAN | 0.844 | 0.833 | 0.760 |
| KGCN | 0.853 | 0.862 | 0.866 |
| Intention matching | 0.871 | 0.905 | 0.852 |
| MFLR | 0.923 | 0.898 | 0.874 |
| Model | AUC | Accuracy | Recall | F1-Score |
|---|---|---|---|---|
| MFLR with cross-compression unit | 0.879 | 0.923 | 0.898 | 0.874 |
| MFLR without cross-compression units | 0.846 | 0.874 | 0.872 | 0.869 |
| Model | N = 1 | N = 3 | N = 5 | N = 7 | N = 9 |
|---|---|---|---|---|---|
| MFLR | 0.864 | 0.871 | 0.853 | 0.836 | 0.817 |
| Model | L = 1 | L = 2 | L = 3 | L = 4 | L = 5 |
|---|---|---|---|---|---|
| MFLR | 0.881 | 0.873 | 0.867 | 0.849 | 0.835 |
Disclaimer/Publisher’s Note: The statements, opinions and data contained in all publications are solely those of the individual author(s) and contributor(s) and not of MDPI and/or the editor(s). MDPI and/or the editor(s) disclaim responsibility for any injury to people or property resulting from any ideas, methods, instructions or products referred to in the content. |
© 2023 by the authors. Licensee MDPI, Basel, Switzerland. This article is an open access article distributed under the terms and conditions of the Creative Commons Attribution (CC BY) license (https://creativecommons.org/licenses/by/4.0/).
Share and Cite
Qu, H.; Zhang, Y.; Liang, K.; Li, S.; Huo, X. A Knowledge-Graph-Driven Method for Intelligent Decision Making on Power Communication Equipment Faults. Electronics 2023, 12, 3939. https://doi.org/10.3390/electronics12183939
Qu H, Zhang Y, Liang K, Li S, Huo X. A Knowledge-Graph-Driven Method for Intelligent Decision Making on Power Communication Equipment Faults. Electronics. 2023; 12(18):3939. https://doi.org/10.3390/electronics12183939
Chicago/Turabian StyleQu, Huiying, Yiying Zhang, Kun Liang, Siwei Li, and Xianxu Huo. 2023. "A Knowledge-Graph-Driven Method for Intelligent Decision Making on Power Communication Equipment Faults" Electronics 12, no. 18: 3939. https://doi.org/10.3390/electronics12183939
APA StyleQu, H., Zhang, Y., Liang, K., Li, S., & Huo, X. (2023). A Knowledge-Graph-Driven Method for Intelligent Decision Making on Power Communication Equipment Faults. Electronics, 12(18), 3939. https://doi.org/10.3390/electronics12183939