Abstract
The CAN (Controller Area Network) protocol is widely adopted for in-vehicle networks due to its cost efficiency and reliable transmission. However, despite its popularity, the protocol lacks built-in security mechanisms, making it vulnerable to attacks such as flooding, fuzzing, and DoS. These attacks can exploit vulnerabilities and disrupt the expected behavior of the in-vehicle network. One of the main reasons for these security concerns is that the protocol relies on broadcast frames for communication between ECUs (Electronic Control Units) within the network. To tackle this issue, we present an intrusion detection system that leverages multiple LSTM-Autoencoders. The proposed system utilizes diverse features, including transmission interval and payload value changes, to capture various characteristics of normal network behavior. The system effectively detects anomalies by analyzing different types of features separately using the LSTM-Autoencoder model. In our evaluation, we conducted experiments using real vehicle network traffic, and the results demonstrated the system’s high precision with a 99% detection rate in identifying anomalies.
1. Introduction
As automotive information technology rapidly advances in modern society, vehicles have evolved beyond mechanical devices and now encompass numerous sensors and Electronic Control Units (ECUs). The emergence of connected cars and autonomous vehicles, consisting of many complex systems, has led to the rapid development of in-vehicle networks [1,2]. Many communication protocols exist, such as the Controller Area Network (CAN), FlexRay, and Local Interconnect Network (LIN). The CAN protocol is the most widely used in-vehicle network protocol among these protocols. As of 2020, the CAN protocol holds around 40% market share in the automotive communication protocol market, while FlexRay has about 10%, LIN 30%, Media Oriented Systems Transport (MOST) 5%, and Ethernet 15% [3]. Security for other protocols such as LIN and Flexray is also important, but considering its widespread utilization, there is a significant demand for security in CAN.
The CAN protocol is a serial bus communication system used in the internal network of vehicles. Unlike the traditional point-to-point (P2P) communication, the CAN protocol utilizes a broadcasting method where multiple ECUs within the vehicle transmit frames through a central CAN bus. This enables fast and efficient communication, reducing costs and improving performance in the vehicle’s internal network. The CAN protocol was standardized by ISO (International Standardization Organization) in 1993 under the ISO 11898 standard [4]. However, the CAN protocol for automotive use was initially designed with something other than security considerations in mind. As a result, several security vulnerabilities exist, such as the transmission of frames in plain text and the absence of proper node authentication [5]. Over the years, researchers have demonstrated various attacks exploiting these security vulnerabilities in the CAN protocol for automotive use [6,7,8,9]. These attacks include seizing control of vehicle functions remotely, injecting abnormal frames into the CAN bus to disrupt the regular operation of ECUs, and emphasizing the need for security enhancements in the CAN protocol for automotive use. To enhance the security of the widely used CAN bus and address its vulnerabilities, we propose an intrusion detection system that utilizes LSTM (Long Short-Term Memory)-Autoencoders. This system aims to detect abnormal frames transmitted within the in-vehicle network.
Unlike the previous approaches [10,11,12,13,14,15,16,17,18,19,20,21,22,23,24,25,26,27,28], we devised a method combining two network behavior features, transmission interval and data changes, to detect anomalies. This is in response to the realization that various attacks exist. If we were to create a detection model that heavily relies on specific features, attackers could potentially evade it by mimicking the characteristics of regular traffic. Therefore, we propose a detection approach that leverages multiple network feature information to address this issue.
Additionally, the stream’s quantity of event-based frames increases compared to when the detection model was trained. In that case, there is a higher likelihood of encountering many event-based frames in the overall stream. Even though these frames represent normal network behavior, their presence may lead to substantial differences in network characteristics compared to the past data, resulting in a higher risk of generating false positives. Our proposed method uses the input data for each type of feature that comprises individual ID-based frame streams. The ID-based frame stream is a continuous sequence of frames sharing the same Arbitration identifier, and the original frame sequence is reorganized to incorporate the normalcy of network behaviors for different frame types into the LSTM-Autoencoder model.
The primary contributions of this paper can be summarized as follows:
- -
- We propose a novel anomaly detection method using multiple LSTM-Autoencoders to analyze diverse characteristics’ features while enabling quick examination of CAN frames with minimal input timesteps.
- -
- For evaluation, we collected various public datasets with four types of vehicle data, achieving an impressive 0.97 accuracy in anomaly detection. We also assessed inference time and memory overheads, quickly examining network features in 1.6 ms with 1.3 MiB usage even in the worst-case scenario.
The paper is organized as follows: Section 2 provides an overview of the CAN protocol used in in-vehicle communication networks, highlighting the security threats arising from its vulnerabilities. Section 3 summarizes the existing research on in-vehicle CAN Intrusion Detection Systems (IDS). Section 4 describes the proposed LSTM-Autoencoder-based CAN IDS’s overall structure, outlining each component’s roles. Detailed experiments and performance evaluations of the intrusion detection models based on the characteristic features are presented in Section 5. Finally, Section 6 highlights our contribution and concludes the paper by summarizing the research and discussing future directions.
2. Preliminaries
2.1. CAN Protocol Basics
The CAN protocol facilitates efficient bidirectional communication among ECUs. It operates as a serial bus communication channel within the vehicle’s internal network, where frames are broadcast through a central bus. This enables all connected nodes to transmit and receive frames without relying on source or destination addresses. Instead, each frame includes unique identifiers that indicate the priority and functionality for medium access control. The structure of a CAN data frame is illustrated in Figure 1. Among the frame types in the CAN protocol, including data frame, remote frame, overload frame, and error frame, this explanation will primarily focus on the data frame commonly used for data exchange between ECUs. As shown in the figure, a CAN data frame comprises five main fields: an arbitration field, a control field, a data field, a check field, and an ACK field. The control field, check field, and ACK field serve to interpret the frame format and verify transmission integrity accurately. In contrast, the arbitration field contains the identifier, uniquely identifying the frame and determining its priority. The data field carries the payload or actual data of the frame, supporting up to 8 bytes of data.
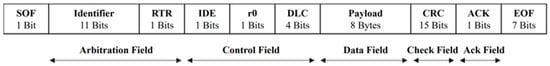
Figure 1.
CAN data frame fields.
2.2. Threats on CAN Protocol
The CAN frames are transmitted in a broadcast way, so it is not necessary for frames to have source and destination addresses. In addition, the CAN protocol has the problem of its frames not including authentication data. Therefore, it is impossible to identify an illegitimate node using any information the frame contains. Additionally, due to the lack of encryption, even legitimate nodes transmit frames in plain text, exposing them to various security threats. Since all nodes connected to a bus can receive broadcasted frames, it is possible to access and inspect all unencrypted frames. There are typical threats, and each threat is explained in turn. Our proposed method is designed to prevent threats by capturing abnormal behaviors.
- -
- Spoofing Attack: Unauthorized attackers can disguise malicious nodes as legitimate nodes and transmit malicious frames.
- -
- Fuzzing Attack: Unauthorized malicious nodes can randomly insert invalid data into the vehicle network, confusing the functionality of legitimate ECUs.
- -
- Sniffing Attack: When a legitimate node transmits frames on the CAN bus without encryption, malicious attackers can eavesdrop on the frames.
- -
- Replay Attack: Malicious attackers can capture frames transmitted in plaintext from an ECU responsible for specific critical functions and resend the same frame to a node with a higher priority CAN ID during vehicle operation.
3. Related Work
Due to the lack of security considerations in its design of CAN protocol, inherent vulnerabilities expose it to various security threats. As a result, several research efforts have been proposed to protect the CAN bus. In this section, the previous studies relating to CAN security are introduced in turn.
There are many existing methods that use shallow learning models or their own algorithms. The authors of [10] proposed G-IDCS, a graph-based intrusion detection and classification system that combines threshold-based IDS with a machine-learning-based classifier to overcome computation limitations. Derhab et al. [11] proposed H-IDFS, a Histogram-based Intrusion Detection and Filtering framework. It uses histograms of CAN packets organized into windows and a multi-class IDS classifier to identify malicious traffic windows. Wang et al. [12] proposed an entropy-based CAN IDS (Intrusion Detection System) that detects attacks by analyzing the probability and entropy of each CAN ID, detecting significant deviations from expected entropy. Olufowbi et al. [13] developed a timing-based CAN IDS by analyzing transmission intervals and response times of CAN frames, considering frames abnormal if arrival times exceed threshold ranges. Stabili et al. [14] introduced DAGA, an anomaly detection algorithm that leverages n-gram analysis. DAGA solely relies on sequences of CAN message IDs to define the n-grams used in the detection process, without utilizing the content of the payload or other CAN message fields. Stabili et al. [15] also proposed a low-complexity intrusion detection algorithm for identifying malicious CAN messages in vehicles’ CAN buses. The proposed algorithm examines payload sequences using the hamming distance measure. P.S. Murvery et al. [16] focus on authenticating nodes on the bus by analyzing the physical characteristics of frames. They achieve accurate identification through voltage measurements and careful choices of transceivers and frame IDs. K.T. Cho et al. [17] introduced clock-based IDS (CIDS) for anomaly detection, using periodic message intervals to fingerprint ECUs. CIDS detects abnormal shifts in identification errors using Cumulative Sum (CUSUM) based on a baseline of ECUs’ clock behaviors. Researchers also suggest verifying message contents and frequency. S.U. Sagong et al. [18] proposed three voltage-based attacks: overcurrent, denial-of-service, and forced retransmission. They introduced a hardware-based Intrusion Response System (IRS) to defend against these attacks by disconnecting the Voltage-based IDS (VIDS) from the CAN bus. In [19], the authors evaluated entropy-based method for anomaly detection in in-vehicle networks. Their experimental results demonstrate the effectiveness of entropy-based detection in detecting attacks including the forged frame injection. Lee et al. [20] introduced CAN signal extinction-based DoS attack (CEDA), which erases the CAN signal by inducing a voltage drop. They also suggested the countermeasures for protecting the in-vehicle network.
These previous approaches [10,11,12,13,14,15,16,17,18,19,20] use specific features for anomaly detection and extract information from the entire frame sequence of the CAN bus. However, this may lead to false positives when encountering event frames that do not present during training. In contrast, our method divides the frame sequence into ID-based stream units and analyzes two valuable features of the streams.
There are several approaches [21,22,23,24] that utilize pure sequential deep-learning algorithms for anomaly detection, including LSTM, Gated Recurrent Unit (GRU), and Recurrent Neural Network (RNN). Although our proposed method shares similarities with these approaches, it differs as it is not based on autoencoders or unsupervised anomaly detection. Based on a literature review, we anticipate that our method will outperform others in terms of real-time responsiveness and accuracy, achieving a balanced intrusion detection. More comprehensive details on this will be presented in Section 5.5.
Various other deep-learning-based approaches exist as follows. Wei et al. [25] introduced the Attention Mechanism and Autoencoder for Intrusion Detection (AMAEID) method. Their approach involves utilizing a multi-layer denoising autoencoder to analyze the normality of payload values in the frames. Additionally, it employs an attention mechanism and a fully connected layer network to make the final decision. Lin et al. [26] proposed a detection model that utilizes the VGG16 classifier to learn attack behavior characteristics and classify threats. In their approach, the defined feature set is extracted from groups of frames and then transformed into an image format to serve as input for the VGG16 classifier. The authors of [27] proposed a hybrid deep-learning-based intrusion detection system (HyDL-IDS) based on CNN and LSTM. This system analyzes the sequence of images formed from payload data. Similarly, Yang et al. [28] proposed a ConvLSTM-based detection method that applies the federated learning (FL) framework with client selection for training the ConvLSTM model. The authors of [29] explored ten representative advanced deep-learning-based intrusion detection methods, highlighting the characteristics and benefits of each approach. These approaches [25,26,27,28] lack real-time responsiveness as they collect packets over a certain period and then perform detection. In contrast, our sliding window approach enables us to analyze small-sized sequences promptly as they are collected.
4. LSTM-Autoencoder Based CAN IDS
The overall structure of the LSTM-Autoencoder-based intrusion detection system is illustrated in Figure 2. The proposed system comprises a feature sequence extractor, LSTM-Autoencoder model, and anomaly detector. The feature sequence extractor begins by separating the entire sequence of frames arranged in chronological order into streams based on their IDs. It then extracts the sequence of time intervals and the sequence of hamming distances for each stream. The LSTM-Autoencoder models accept the extracted feature sequences and analyze them for generating the reconstructed sequences. After the models generate the reconstructed time interval sequence and the hamming distance sequence, the anomaly detector calculates the dissimilarity between the original sequences of time intervals and hamming distances and the corresponding reconstructed sequences. The anomaly detector utilizes dissimilarity to determine whether the given frame sequence is normal or abnormal. Detailed explanations about each component are included in the following subsections.
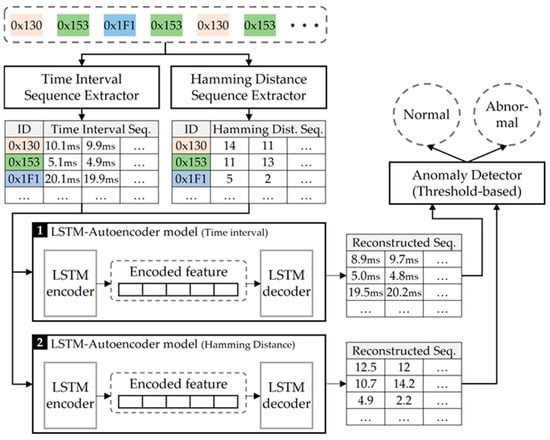
Figure 2.
Overall architecture of the proposed system.
4.1. Time Interval Sequence Extractor
Among many types of CAN frames transmitted in in-vehicle networks, many periodically transmitted frames are used to poll any sensor data or to command some functions, and event-based frames often exhibit a consistent periodicity as well. Therefore, if attacks such as Denial of Service (DoS) and Fuzzing are performed by injecting malicious frames, there is a high possibility that the predefined periodicity for each CAN frame may be disrupted. Figure 3 shows an example of the counts per time interval measured from the dataset provided by [30]. Comparing the transmission time intervals of a dataset consisting only of normal data without any attacks, and a dataset containing attacks on frames with CAN ID, 0 x 316 with an average transmission period of 0.01 s, it is observed that the dataset with attacks exhibits transmission time intervals that deviate significantly from the average transmission period. These deviating data points indicate the presence of attack types that insert frames, causing an impact on the normal frame transmission period. In this point of view, we consider transmission time intervals of consecutive frames with the same ID as an essential feature that defines normal network behavior, and the time interval sequence is used as a feature for the LSTM-Autoencoder model.
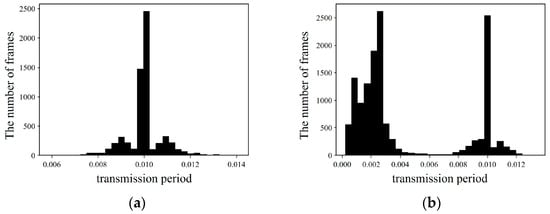
Figure 3.
An example of the histograms contain frame counts both normal situation and attack situation. (a): Histogram generated from the dataset that includes only normal frames with 0 x 316; (b): histogram generated from the dataset that includes normal and malicious frames with 0 x 316.
The time interval sequence extractor first obtains all time intervals by subtracting the timestamps of each pair of consecutive frames with the same ID. It generates a sequence for each ID by listing the time intervals chronologically.
4.2. Hamming Distance Sequence Extractor
The hamming distance sequence extractor is responsible for computing hamming distances of pairs of consecutive frames’ payloads in each ID-based stream. The hamming distance, which determines the number of differing bits between two bit sequences of equal length, is calculated as presented in (1). In (1), and are the bit sequences, and their length is .
If the lengths of the two bit sequences differ, the shorter sequence is padded with zeros at the end to ensure equal length. The computed hamming distances for each ID-based stream are organized chronologically to form a sequence.
The purpose and necessity of defining the hamming distance of data payloads for each ID are as follows: Many normal frames being transmitted for regular functions have characteristics where the frame’s data payload remains unchanged or certain byte values of the data payload remain fixed and unchanged during transmission. This can be attributed to the fact that ECUs responsible for various functions in the in-vehicle network transmit frame data commanding specific functions with unique IDs. In addition, there are frames in which the payload value consistently increases or decreases by a fixed delta. For instance, the CAN protocol utilizes an alive counter value or sequence number to offer End-to-End (E2E) protection. The alive counter value alternates between zero and one, or vice versa, while the sequence number consistently increments by one, except when transitioning from the maximum value back to zero.
Due to the property of payload values remaining unchanged or exhibiting a consistent variation in usual situations, we utilize the hamming distance as a crucial feature. When attackers perform reverse engineering for functionality analysis through fuzzing, there are cases where we are compelled to inject arbitrary values into the payload. In such instances, the variation in the payload values often deviates significantly from that observed in normal cases.
Table 1 and Table 2 show the changes in payload values caused by a fuzzing attack. The ID, DLC, and payload of each table refer to the Arbitration ID, Data Length Code, and the value of the data field of each frame, respectively. The tables present the frame sequences of CAN ID 316, which is utilized for fuzzing attacks in normal and attack situations. These examples are extracted from the dataset obtained from [30]. In Table 1, it can be observed that five out of eight bytes in the data payload, excluding the second, third, and fifth bytes, consistently transmit the same data, while in the case of abnormal data containing attack frames in Table 2, completely different data or changed data in fixed bytes are transmitted, which is distinct from the normal data.

Table 1.
CAN frames in normal situation.
Table 2.
CAN frames in fuzz attack situation.
4.3. LSTM-Autoencoder
The feature extractor is responsible for extracting time interval sequences and hamming distance sequences from ID-based streams within the original frame sequence. To accommodate the fixed size of input sequences required by our LSTM-Autoencoder model, our method divides each time interval sequence and hamming distance sequence into smaller subsequences. It is important to note that analyzing the same sequence length in real-time detection with that of model training usually performs better than the other cases. However, gathering a large number of frames within a short time for real-time detection can be challenging, potentially leading to reduced responsiveness. Furthermore, network attacks tend to occur rapidly. Consequently, the feature sequences are segmented into arbitrary time steps for effective utilization.
Our LSTM-Autoencoder model accepts three-dimensional data in the format of timestep, the number of features (IDs), and batch size. In our model, the number of features corresponds to the number of IDs, while the time steps represent the sequence length, which aligns with the number of cells in the input layer of the LSTM-Autoencoder. Lastly, batch size refers to the number of data inputs into the LSTM network. Figure 4 shows the LSTM-Autoencoder models’ overall architecture for analyzing time-interval sequences and hamming distance sequences. Each LSTM-Autoencoder consists of an encoder, repeat vector layer, decoder, and fully connected layer. The first part of the LSTM-Autoencoder is the encoder. It takes an input sequence and encodes it into a lower-dimensional representation. In the case of the LSTM-Autoencoder, the encoder is typically composed of LSTM layers. Our encoder consists of two LSTMs, and each LSTM layer captures temporal dependencies and encodes its input into an encoded feature.
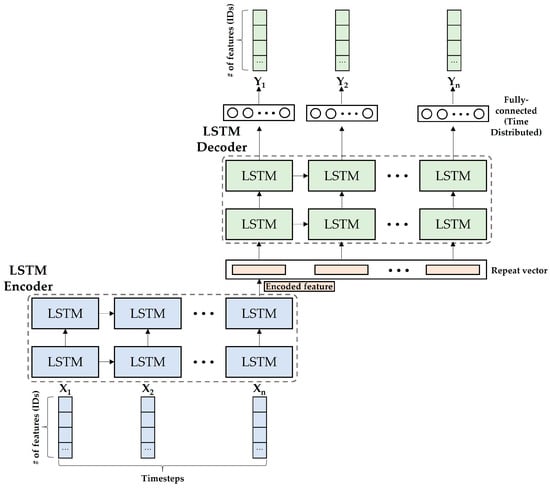
Figure 4.
The architecture of the LSTM-Autoencoder model.
After the encoder compresses the input into the encoded feature, the repeat vector layer takes the encoded feature and repeats the feature timestep times. Then, the decoder takes the repeat vector that contains the same data of the encoded feature and aims to reconstruct the original input sequence. The decoder is composed of two LSTM layers, as does the encoder. The detailed information for the hyperparameter setting is included in Table 3.
Table 3.
The hyperparameters of our LSTM-Autoencoder (timestep and # of IDs are variable).
As shown in Table 3, it can be observed that the number of features decreases from 128 to 64 in the encoder and increases from 64 back to 128 in the decoder. To ensure that the shape of the reconstructed data, which is the model’s output, matches the original data, the repeat vector and fully connected layers restore the timestep and feature size to their original values. The model’s optimizer is set to Adaptive Moment Estimation (Adam), enabling automatic adjustment of the learning rate and momentum-based optimization. For calculating the reconstruction error between the reconstructed data and the original data, Mean Squared Error (MSE) is utilized, which quantifies the quality of a model’s predictions by calculating the average of the squared differences between the predicted values and the actual values.
4.4. Anomaly Detector
The anomaly detector performs the role of deciding whether the given CAN frame sequence is normal or not. The anomaly detector accepts the reconstructed time interval and hamming distance sequences from the LSTM-Autoencoders. Then, the MSE is utilized to compare the original and reconstructed sequences. After calculating the MSE values for each feature type, these values are compared against a predefined threshold. Only if all the MSE values do not exceed their respective thresholds, can it be concluded that no abnormal behavior is detected.
5. Evaluation
This section describes the CAN dataset utilized in this study and the experimental setup. Additionally, we present the experimental results and performance evaluation of two detection methods based on time interval feature and hamming distance changes in the payload.
5.1. Dataset Description and Experimental Environment
The experiments were conducted on the Ubuntu 20.04 operating system, using TensorFlow version 2.4.0 for training and testing the detection model. We collected CAN network traffic datasets from [30,31,32] to evaluate the model’s performance. These datasets were used in data challenge competitions held in 2019 [30,31] and 2020 [32], and we made use of all accurately labeled preliminary data in our experiments. According to our investigation, it was found that the preliminary data from [31] includes some of the data from [30], and additional attack frames have been added. The configuration details for the experimental datasets are summarized in Table 4. The table shows that the datasets include traffic from four vehicles: Hyundai YF Sonata, Kia Soul, Chevrolet Spark, and Hyundai Avante CN7.
Table 4.
Experimental dataset configuration. Avante(D) refers to datasets collected while driving, whereas Avante(S) refers to datasets collected when the car is stationary.
A simple ID filtering mechanism within the framework effortlessly filtered out frames containing attacks with invalid IDs. Thus, to accurately assess the LSTM-Autoencoder-based model’s performance, we included only attacks targeting valid IDs in the experimental set. Additionally, we addressed the imbalance between normal and abnormal datasets by performing oversampling using the Synthetic Minority Oversampling Technique (SMOTE) method [33] and undersampling using the Random sampling method. This allowed us to adjust the composition ratio of normal and abnormal datasets to 1:1:1 in both the training and testing sets, respectively.
5.2. Performance Metrics for Evaluation
Our detection model’s performance was evaluated using key metrics: Accuracy, Precision, Recall, and F1-score. These metrics assess how effectively the model detects anomalies, and they are calculated based on detected anomalies and ground-truth labels, providing a quantitative assessment. The calculations for the metrics are outlined in (2)–(5). In Equations (2)–(5), TP represents True Positives, TN represents True Negatives, FP represents False Positives, and FN represents False Negatives.
5.3. Anomaly Detection Accuracy
The performance of our proposed method is presented in Figure 5, Figure 6, Figure 7 and Figure 8. As discussed in Section 5.1, we conducted experiments to evaluate our method using the original and resampled datasets. Figure 5 and Figure 6 depict the experimental results measured with the original datasets, while Figure 7 and Figure 8 show the results from the resampled datasets. In the graphs, when we used datasets without sampling, the average accuracy and F-measure values were 0.97 and 0.98, respectively. On the other hand, when employing resampled datasets, the average values for both metrics were approximately 0.95. Comparing the cases with the lowest accuracy, we observed that the original dataset still demonstrated satisfactory performance, even in the worst scenario, with an accuracy of 0.93. However, the resampled dataset exhibited a slightly lower value of 0.85. This can be attributed to the fact that this dataset’s abnormal data (Sonata2 [31]) is very limited, leading to approximately 91% of the test data being augmented through oversampling.
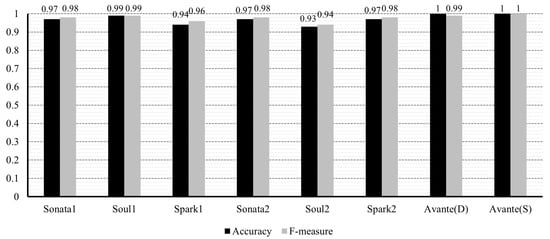
Figure 5.
Accuracy and F-measure for the original sets (Sonata1, Soul1, and Spark1 are from [30]; Sonata2, Soul2, and Spark2 are from [31]; and Avante(D) and (S) are from [32]).
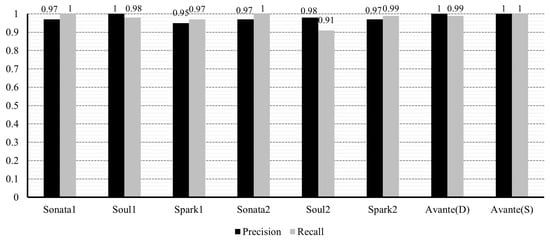
Figure 6.
Precision and recall for the original sets (Sonata1, Soul1, and Spark1 are from [30]; Sonata2, Soul2, and Spark2 are from [31]; and Avante(D) and (S) are from [32]).
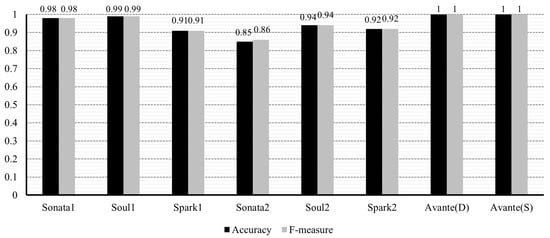
Figure 7.
Accuracy and F-measure for the re-sampled sets (Sonata1, Soul1, and Spark1 are from [30]; Sonata2, Soul2, and Spark2 are from [31]; and Avante(D) and (S) are from [32]).
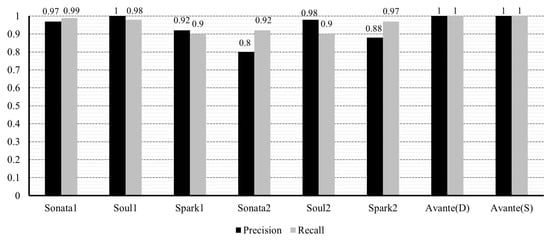
Figure 8.
Precision and recall for the re-sampled sets (Sonata1, Soul1, and Spark1 are from [30]; Sonata2, Soul2, and Spark2 are from [31]; and Avante(D) and (S) are from [32]).
Regarding precision and recall, the average values in the original dataset were 0.98, while in the resampled dataset, they were 0.94 and 0.96, respectively. A critical factor in anomaly detection is the false positive rate. The average of the false positive rate was measured as 0.01 for the original set, and in the case of the resampled dataset, the average of the false positive rate was 0.06. As a consequence of oversampling the abnormal data, relatively noisy data were introduced into the experimental dataset. Interestingly, despite 42% of the total data being generated through oversampling, the false positive rate did not significantly increase. Excluding the Sonata [31] dataset, where the abnormal set is very limited, the corresponding values were approximately 0.01 and 0.035, respectively.
Our detection method employs two LSTM-Autoencoders for anomaly detection, one analyzing transmission timing and the other analyzing data changes using hamming distance. To compare the performance of the two detection models, we calculated the Receiver Operating Characteristic (ROC) curve and its Area Under the Curve (AUC). The results are illustrated in Figure 9. The figures show that the time-interval-based method’s curve is closer to the left and upper corner than the hamming distance-based method. When the original dataset was used, the AUC for the time-interval method was higher at 0.97, compared to the hamming distance method’s AUC of 0.92, and the AUCs for the time-interval based method and the hamming distance-based method measured using the resampled set were 0.96 and 0.90, respectively.

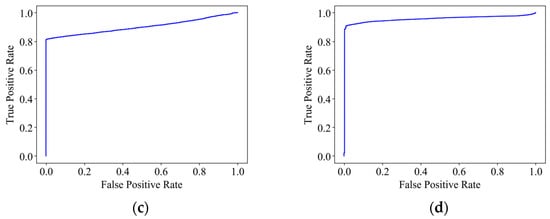
Figure 9.
Receiver Operator Characteristic Curve measurements for Sonata [30]: (a) measurement using the time interval-based method without sampling, (b) measurement using the hamming distance-based method without sampling, (c) measurement of the re-sampled set using the time interval-based method, and (d) measurement of the re-sampled set using the time interval-based method.
5.4. Inference Time for LSTM-Autoencoder-Based Detection
The proposed framework is designed to detect anomalies that may infiltrate the in-vehicle network. Installing and utilizing this framework within an ECU connected to the bus network is crucial. The Central Gateway (CGW) stands out among numerous ECUs, being the ideal candidate due to its ability to monitor all frame interactions from segmented bus networks. Figure 10 shows how anomaly detection can be deployed systematically using the CGW unit in the in-vehicle network. Moreover, the hardware engineered for the CGW exhibits superior performance regarding memory capacity and CPU frequency. For instance, the NXP-manufactured S32G2, equipped with multi-core Arm Cortex-A53 application processors (2.3 GHz), also boasts Cortex-M7 real-time microcontrollers (300 MHz) [34]. It also supports LPDDR4/DDR3L interfaces, thus enabling the use of high-performance DRAM. Furthermore, the S32G3 series, the most sophisticated version, has been recently launched [35]. If it is not possible to install IDS on the CGW, an alternative device can be set up to receive frames from the lines directly connected to the CGW. If this is also not feasible, the safety-critical frames can be periodically sent to an external server, where the detection can be performed.
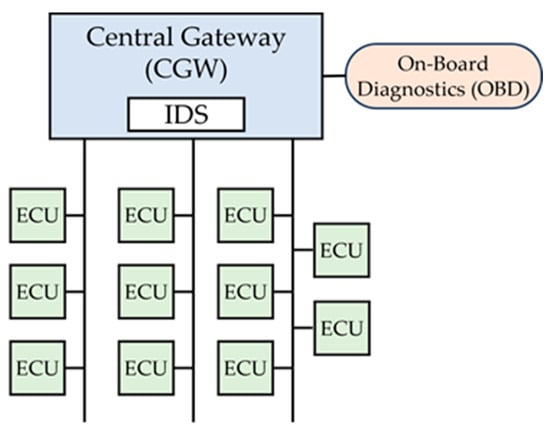
Figure 10.
CAN IDS in Central Gateway (CGW).
We conducted experiments on memory overheads and inference times, which are crucial for determining the implementation and deployment of CAN IDS. We set up an Ubuntu 20.04-based virtual environment using Virtualbox [36], capable of controlling CPU and memory. In addition, we utilized the TensorLite library [37], which was developed to create models for edge device deployment, to apply quantization to our model and proceed with the evaluation. The inference time and memory usage of LSTM-Autoencoder-based detection models were computed while changing the CPU clock from 550 MHz to 2.2 GHz. Additionally, as the total number of weight parameters in the neural network changes depending on the number of hidden units in each LSTM layer that make up the LSTM-Autoencoder’s encoder and decoder, performance was measured while varying the number of hidden units. The experimental results are presented in Table 5, Table 6, Table 7 and Table 8. When utilizing a CPU with the lowest performance at 550 MHz, the memory usage for the two LSTM-Autoencoder models was measured as 1.2 MiB, 1.2 MiB, and 1.4 MiB, respectively, based on size, and the inference time was recorded as 1.8 ms, 1.7 ms, 1.6 ms. Despite varying the number of hidden units that make up the model, there was no linear difference in memory usage due to many non-activated units. The memory usage when utilizing the highest-performing CPU at 2.2 GHz was measured as 1 MiB, 1.3 MiB, and 1.4 MiB by size, and the inference time was noted as 0.4 ms, 0.4 ms, 0.5 ms. These results confirm that the proposed method can operate within a sufficiently fast time frame while consuming a small amount of memory.
Table 5.
Inference time and memory increase when CPU clock is set to 550 MHz (T.I. refers to the time-interval-based model, and H.D refers to the hamming distance-based model).
Table 6.
Inference time and memory increase when CPU clock is set to 1.1 GHz (T.I. refers to the time-interval-based model, and H.D refers to the hamming distance-based model).
Table 7.
Inference time and memory increase when CPU clock is set to 1.65 GHz (T.I. refers to the time-interval-based model, and H.D refers to the hamming distance-based model).
Table 8.
Inference time and memory increase when CPU clock is set to 2.2 GHz (T.I. refers to the time-interval-based model, and H.D refers to the hamming distance-based model).
5.5. Comparison with Other Methodologies
In order to show the effectiveness of our method, we investigated many research papers [10,11,21,22,23,24] to understand the performance of the existing methods. In detail, we gathered and organized benchmark test information from [10,21]. The approaches in Table 9, CLAM [21], LSTM-P [22], DeepConvGRU [23], and Rnet [24], use deep-learning-based sequential models such as LSTM, GRU, and RNN. G-IDCS [10] uses the graph-based intrusion detection method, and H-IDS [11] uses a histogram of bytes in payloads in a frame sequence. It was possible to obtain their experimental results measured using the dataset of [32]. Table 9 shows that our proposed method outperforms the deep-learning-based models [21,22,23,24] regarding inference time. It demonstrates fast processing even in less favorable experimental conditions. While the method of [24] shows better time overhead result than ours, its F-measure is significantly lower, indicating limited practicality. Compared to non-deep-learning methods [10,11], our approach may have a slightly lower time performance, but the difference is not significantly pronounced, and it exhibits outperformed accuracy.
Table 9.
Performance comparison with the other methods [10,11,21,22,23,24].
6. Discussion
Through this research, we have discovered that utilizing an unsupervised learning model called LSTM-Autoencoder allows us to define normalcy based solely on the vehicle’s internal network traffic and perform anomaly detection effectively. This approach proves to be an efficient method in our experiments. The study introduces a method for processing input data, preserving sequential information. Based on the inherent characteristics of the protocol where each CAN frame is assigned an Arbitration Identifier (ID), we propose a method for decomposing the entire frame sequence into streams consisting of frames with the same ID. For each stream, we extract features and arrange them in chronological order. This approach allows us to preserve the frames’ structural properties while analyzing each stream’s behavior.
There is an issue that still needs to be solved in our research. The issue is the existence of various and numerous feature information beyond the characteristics of the transmission timing and payload data rate. For sequential information, it seems possible to apply them to the LSTM-Autoencoder approach we propose. For example, the variance or entropy representing the dispersion or uncertainty of frame IDs within a specific period, or the correlation between data, can be defined. Therefore, we plan to continue our research by devising methods to extract multiple features useful in capturing abnormal network behavior in vehicle internal communication and applying them to existing detection models.
Lastly, when frequent updates to the IDS model and continuous online training are required after integrating CAN IDS, using a more significant number of actual vehicles, Federated Learning (FL) provides a highly useful approach. Through processes such as local training, parameter aggregation, and central model improvement, Federated Learning safely generates a global model that incorporates diverse information. Hence, we plan to explore methods for applying FL in future research.
Author Contributions
Conceptualization, T.K. and I.Y.; methodology, T.K. and I.Y.; validation, I.Y.; investigation, T.K. and J.K.; writing—original draft preparation, T.K.; writing—review and editing, T.K. and I.Y.; visualization, J.K.; and supervision, I.Y. All authors have read and agreed to the published version of the manuscript.
Funding
This research received no external funding.
Data Availability Statement
Restrictions apply to the availability of these data. Data was obtained from HCRL and are available at https://ocslab.hksecurity.net/Datasets with the permission of HCRL.
Acknowledgments
This work was supported by the Soonchunhyang University Research Fund.
Conflicts of Interest
The authors declare no conflict of interest.
References
- Leen, G.; Heffernan, D. Expanding automotive electronic systems. Computer 2002, 35, 88–93. [Google Scholar] [CrossRef]
- Huang, S.C.; Chen, B.H.; Chou, S.K.; Hwang, J.N.; Lee, K.H. Smart car [application notes]. IEEE Comput. Intell. Mag. 2016, 11, 46–58. [Google Scholar] [CrossRef]
- Global Automotive Communication Protocols Market 2020–2024. Available online: https://www.businesswire.com/news/home/20201013005930/en/Global-Automotive-Communication-Protocols-Market-2020-2024-Focus-on-LIN-CAN-FlexRay-MOST-Ethernet---ResearchAndMarkets.com (accessed on 1 August 2023).
- ISO 11898—Controller Area Network. Available online: https://www.iso.org/standard/63648.html (accessed on 21 August 2023).
- Carsten, P.; Andel, T.R.; Yampolskiy, M.; McDonald, J.T. In-vehicle networks: Attacks, vulnerabilities, and proposed solutions. In Proceedings of the 10th Annual Cyber and Information Security Research Conference, Oak Ridge, TN, USA, 7–9 April 2015; pp. 1–8. [Google Scholar]
- Koscher, K.; Czeskis, A.; Roesner, F.; Patel, S.; Kohno, T.; Checkoway, S.; Savage, S. Experimental security analysis of a modern automobile. In Proceedings of the 2010 IEEE Symposium on Security and Privacy, Oakland, CA, USA, 16–19 May 2010; pp. 447–462. [Google Scholar]
- Hoppe, T.; Dittman, J. Sniffing/Replay Attacks on CAN Buses: A simulated attack on the electric window lift classified using an adapted CERT taxonomy. In Proceedings of the 2nd Workshop on Embedded Systems Security (WESS), Amsterdam, The Netherlands, 4–9 October 2015; pp. 1–6. [Google Scholar]
- Checkoway, S.; McCoy, D.; Kantor, B.; Anderson, D.; Shacham, H.; Savage, S.; Kohno, T. Comprehensive experimental analyses of automotive attack surfaces. In Proceedings of the 2011 USENIX Security Symposium, San Francisco, CA, USA, 8–12 August 2021; pp. 447–462. [Google Scholar]
- Miller, C.; Valasek, C. Remote exploitation of an unaltered passenger vehicle. In Black Hat USA; Academic Press: Cambridge, MA, USA, 2015; pp. 1–91. [Google Scholar]
- Park, S.B.; Jo, H.J.; Lee, D.H. G-IDCS: Graph-Based Intrusion Detection and Classification System for CAN Protocol. IEEE Access 2023, 11, 39213–39227. [Google Scholar] [CrossRef]
- Derhab, A.; Belaoued, M.; Mohiuddin, I.; Kurniawan, F.; Khan, M.K. Histogram-based intrusion detection and filtering framework for secure and safe in-vehicle networks. IEEE Trans. Intell. Transp. Syst. 2021, 3, 2366–2379. [Google Scholar] [CrossRef]
- Wang, Q.; Lu, Z.; Qu, G. An entropy analysis based intrusion detection system for controller area network in vehicles. In Proceedings of the 31st IEEE International System-on-Chip Conference (SOCC), Arlington, VA, USA, 4–7 September 2018; pp. 90–95. [Google Scholar]
- Olufowobi, H.; Young, C.; Zambreno, J.; Bloom, G. SAIDuCANT: Specification-based automotive intrusion detection using controller area network (CAN) timing. IEEE Trans. Veh. Technol. 2019, 2, 1484–1494. [Google Scholar] [CrossRef]
- Stabili, D.; Ferretti, L.; Andreolini, M.; Marchetti, M. DAGA: Detecting attacks to in-vehicle networks via n-Gram analysis. IEEE Trans. Veh. Technol. 2022, 71, 11540–11554. [Google Scholar] [CrossRef]
- Stabili, D.; Marchetti, M.; Colajanni, M. Detecting attacks to internal vehicle networks through Hamming distance. In Proceedings of the 2017 AEIT International Annual Conference, Cagliari, Italy, 20–22 September 2017; pp. 1–6. [Google Scholar]
- Murvay, P.S.; Groza, B. Source identification using signal characteristics in controller area networks. IEEE Signal Process. Lett. 2014, 4, 395–399. [Google Scholar] [CrossRef]
- Cho, K.T.; Shin, K.G. Fingerprinting electronic control units for vehicle intrusion detection. In Proceedings of the 2016 USENIX Security Symposium, Austin, TX, USA, 10–12 August 2016; Volume 40, pp. 911–927. [Google Scholar]
- Sagong, S.U.; Ying, X.; Poovendran, R.; Bushnell, L. Exploring attack surfaces of voltage-based intrusion detection systems in controller area networks. In Proceedings of the 2018 ESCAR Conference, Tokyo, Japan, 3–4 October 2018; pp. 1–13. [Google Scholar]
- Müter, M.; Asaj, N. Entropy-based anomaly detection for in-vehicle networks. In Proceedings of the 2011 IEEE Intelligent Vehicles Symposium, Baden, Germany, 5–9 June 2011; pp. 1110–1115. [Google Scholar]
- Lee, Y.; Woo, S. CAN Signal Extinction-based DoS Attack on In-Vehicle Network. Secur. Commun. Netw. 2022, 9569703, 1–10. [Google Scholar] [CrossRef]
- Sun, H.; Chen, M.M.; Weng, J.; Liu, Z.Q.; Geng, G.G. Anomaly detection for in-vehicle network using CNN-LSTM with attention mechanism. IEEE Trans. Veh. Technol. 2021, 70, 10880–10893. [Google Scholar] [CrossRef]
- Taylor, A.; Leblanc, S.V.; Japkowicz, N.T. Anomaly detection in automobile control network data with long short-term memory networks. In Proceedings of the 2016 IEEE International Conference on Data Science and Advanced Analytics, Montreal, QC, Canada, 17–19 October 2016; pp. 130–139. [Google Scholar]
- Wu, Z.C.; Li, F.; Xie, C.J.; Ren, T.T.; Chen, J.; Liu, L. A deep learning framework for driving behavior identification on in-vehicle CAN-BUS sensor data. Sensors 2019, 19, 1356. [Google Scholar]
- Weber, M.; Pistorius, F.; Sax, E.; Maas, J.; Zimmer, B. A hybrid anomaly detection system for electronic control units featuring replicator neural networks. In Proceedings of the 2019 Future of Information and Communication Conference, San Francisco, CA, USA, 14–15 March 2019; Springer International Publishing: Cham, Switzerland, 2019; Volume 887, pp. 43–62. [Google Scholar]
- Wei, P.; Wang, B.; Dai, X.; Li, L.; He, F. A novel intrusion detection model for the CAN bus packet of in-vehicle network based on attention mechanism and autoencoder. Digit. Commun. Netw. 2023, 9, 14–21. [Google Scholar] [CrossRef]
- Lin, H.C.; Wang, P.; Chao, K.M.; Lin, W.H.; Chen, J.H. Using deep learning networks to identify cyber attacks on intrusion detection for in-vehicle networks. Electronics 2022, 11, 2180. [Google Scholar] [CrossRef]
- Lo, W.; Alqahtani, H.; Thakur, K.; Almadhor, A.; Chander, S.; Kumar, G. A hybrid deep learning based intrusion detection system using spatial-temporal representation of in-vehicle network traffic. Veh. Commun. 2022, 35, 100471. [Google Scholar] [CrossRef]
- Yang, J.; Hu, J.; Yu, T. Federated AI-enabled in-vehicle network intrusion detection for internet of vehicles. Electronics 2022, 11, 3658. [Google Scholar] [CrossRef]
- Wang, K.; Zhang, A.; Sun, H.; Wang, B. Analysis of recent deep-learning-based intrusion detection methods for in-vehicle network. IEEE Trans. Intell. Transp. Syst. 2022, 24, 1843–1854. [Google Scholar] [CrossRef]
- Han, M.L.; Kwak, B.I.; Kim, H.K. Anomaly intrusion detection method for vehicular networks based on survival analysis. Veh. Commun. 2018, 14, 52–63. [Google Scholar] [CrossRef]
- Car-Hacking Dataset for the Intrusion Detection. Available online: https://ocslab.hksecurity.net/Datasets/datachallenge2019/car (accessed on 1 August 2023).
- Kang, H.J.; Kwak, B.I.; Lee, Y.H.; Lee, H.E.; Lee, H.J.; Kim, H.K. Car Hacking and Defense Competition on In-Vehicle Network. In Proceedings of the 2021 International Workshop on Automotive and Autonomous Vehicle Security, Online, 25 February 2021; p. 25. [Google Scholar]
- Azhar, N.A.; Pozi, M.S.M.; Din, A.M.; Jatowt, A. An Investigation of SMOTE Based Methods for Imbalanced Datasets with Data Complexity Analysis. IEEE Trans. Knowl. Data Eng. 2023, 35, 6651–6672. [Google Scholar] [CrossRef]
- S32G2 Processors for Vehicle Networking. Available online: https://www.nxp.com/products/processors-and-microcontrollers/s32-automotive-platform/s32g-vehicle-network-processors/s32g2-processors-for-vehicle-networking:S32G2 (accessed on 1 August 2023).
- S32G3 Processors for Vehicle Networking. Available online: https://www.nxp.com/products/processors-and-microcontrollers/s32-automotive-platform/s32g-vehicle-network-processors/s32g3-processors-for-vehicle-networking:S32G3 (accessed on 1 August 2023).
- VirtualBox. Available online: https://www.virtualbox.org/ (accessed on 1 August 2023).
- Tensorlite. Available online: https://www.tensorflow.org/lite?hl=ko (accessed on 1 August 2023).
- CAN Signal Extraction and Translation Dataset. Available online: https://ocslab.hksecurity.net/Datasets/can-signal-extraction-and-translation-dataset (accessed on 1 August 2023).
Disclaimer/Publisher’s Note: The statements, opinions and data contained in all publications are solely those of the individual author(s) and contributor(s) and not of MDPI and/or the editor(s). MDPI and/or the editor(s) disclaim responsibility for any injury to people or property resulting from any ideas, methods, instructions or products referred to in the content. |
© 2023 by the authors. Licensee MDPI, Basel, Switzerland. This article is an open access article distributed under the terms and conditions of the Creative Commons Attribution (CC BY) license (https://creativecommons.org/licenses/by/4.0/).