
Influence Factors on User Manual Engagement in the Context of Smart Wearable Devices

 , ,
, , 
Abstract
1. Introduction
2. Related Work
3. Methodology
3.1. Research Alpha
3.2. Research Beta
3.3. Research Gamma
3.4. Research Delta
4. Results
4.1. Research Alpha
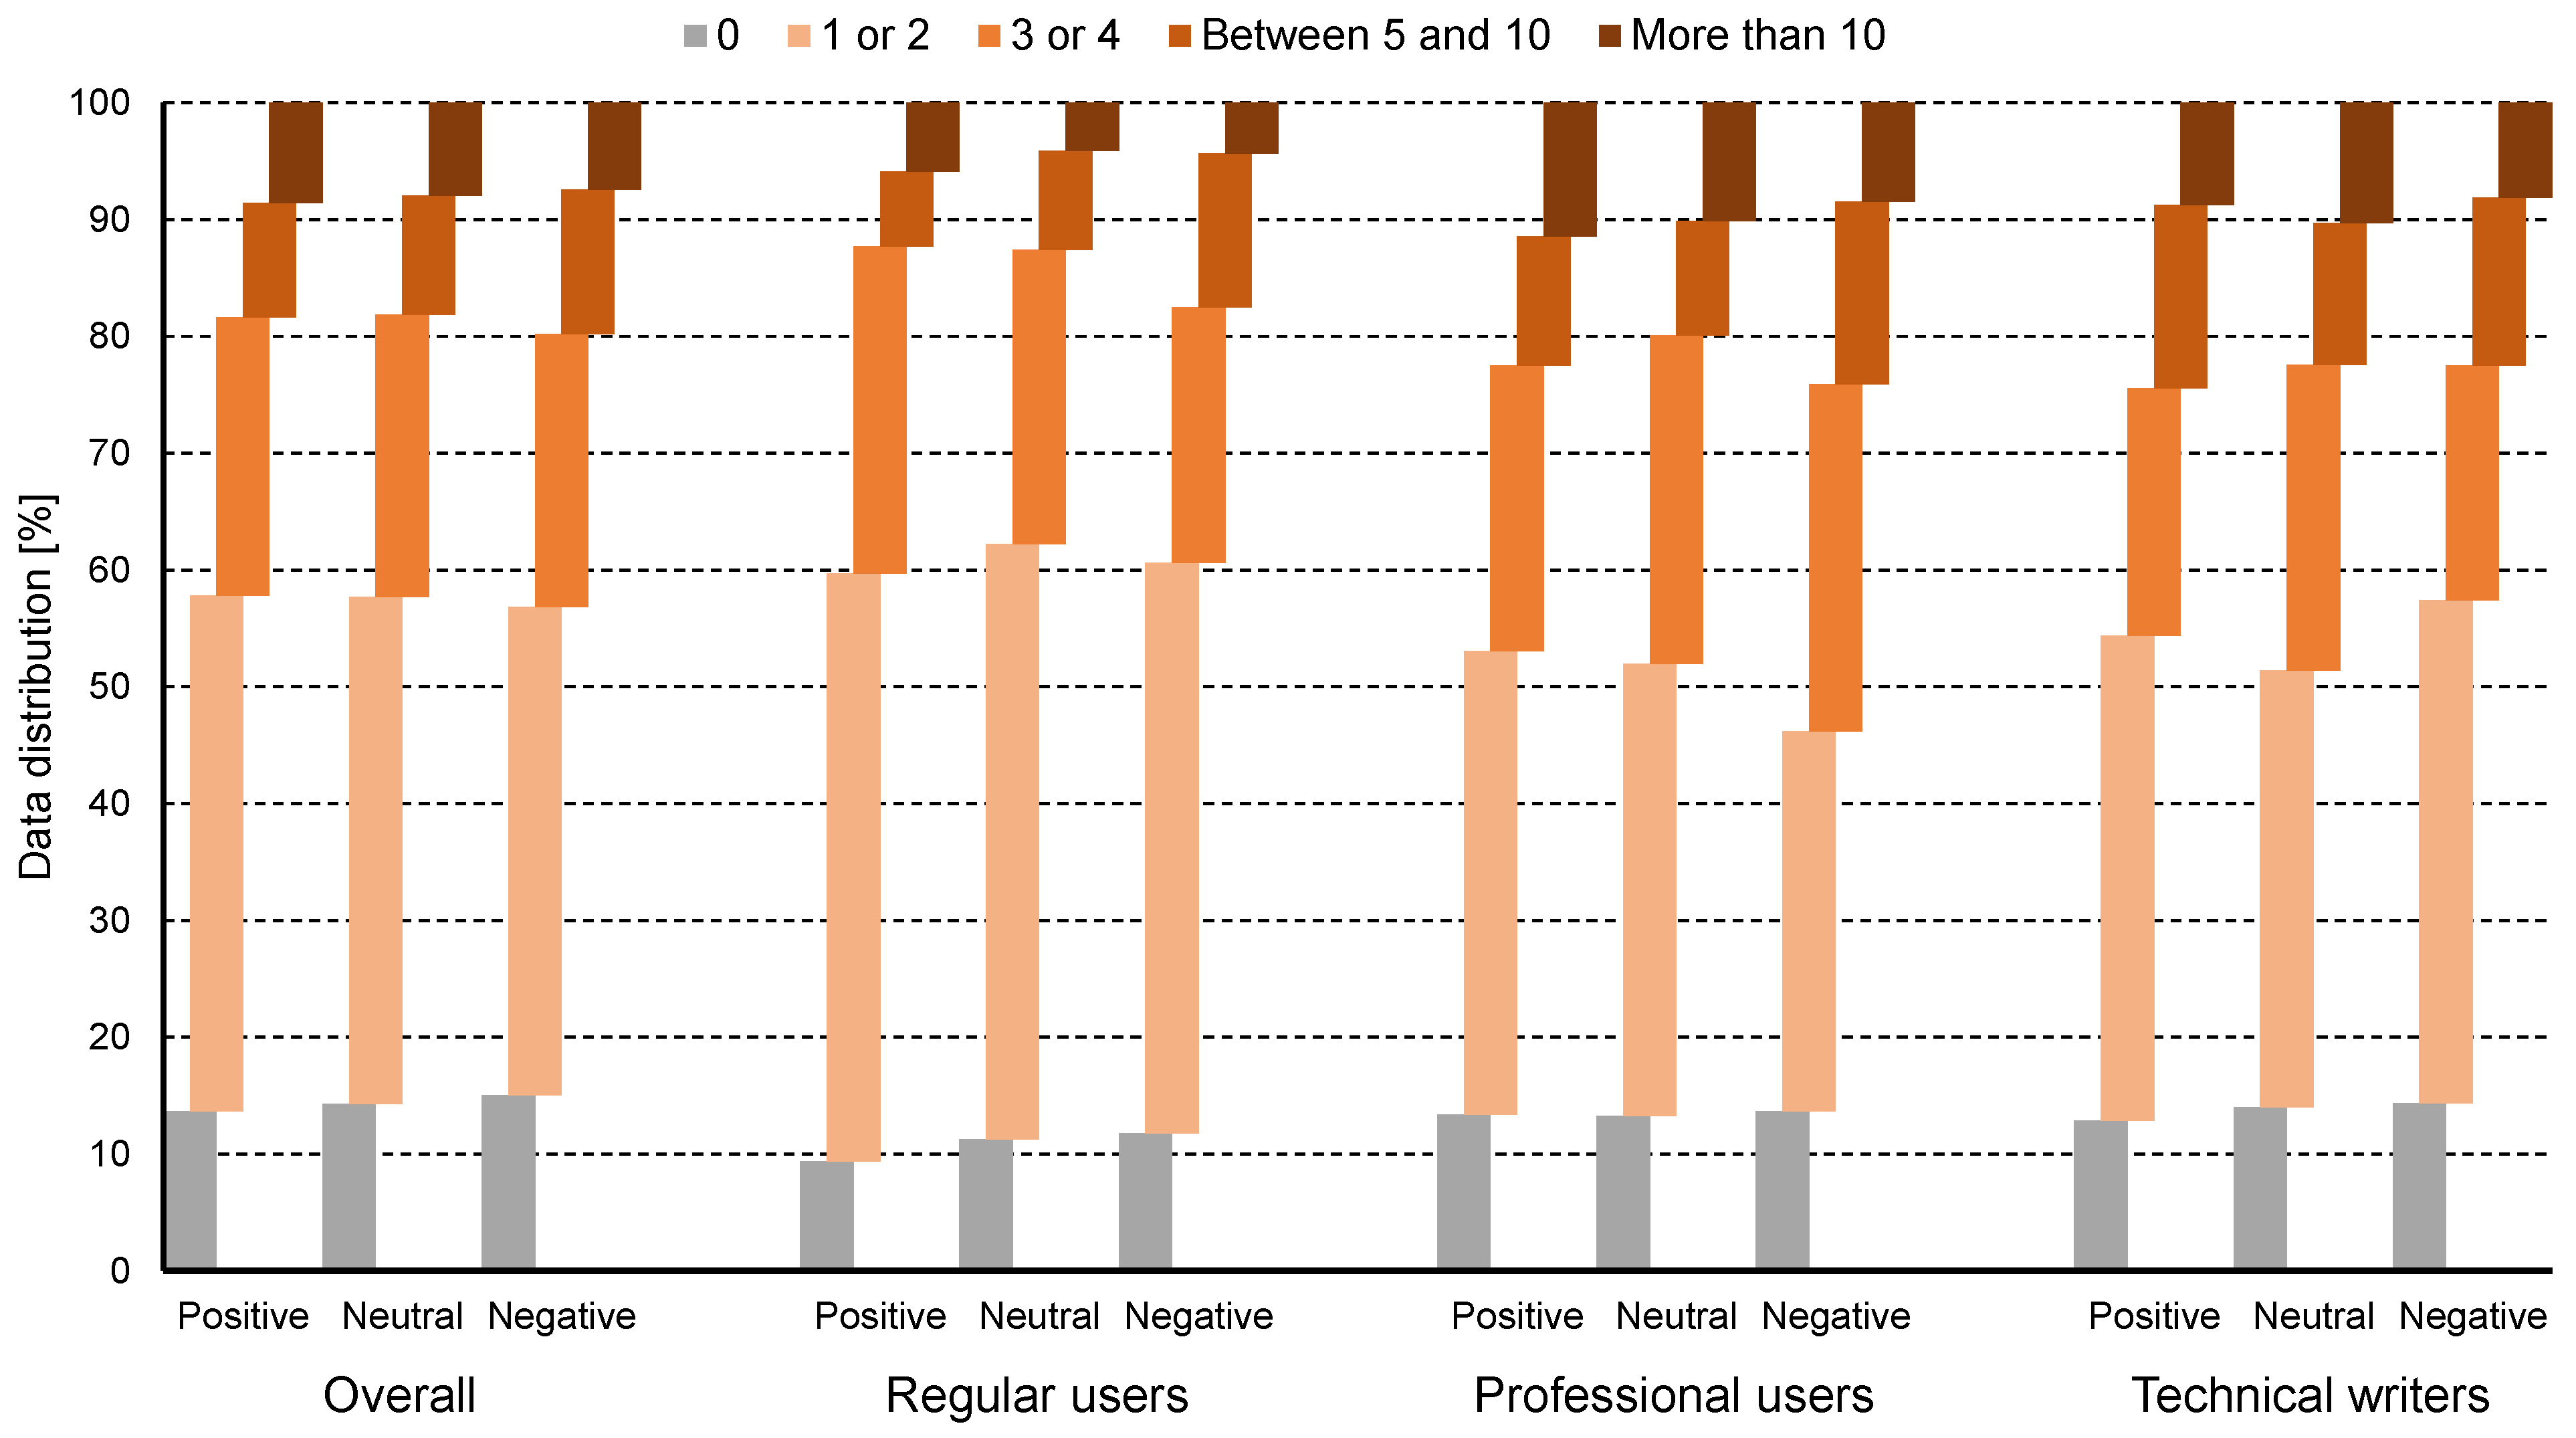
4.1.1. User Experience
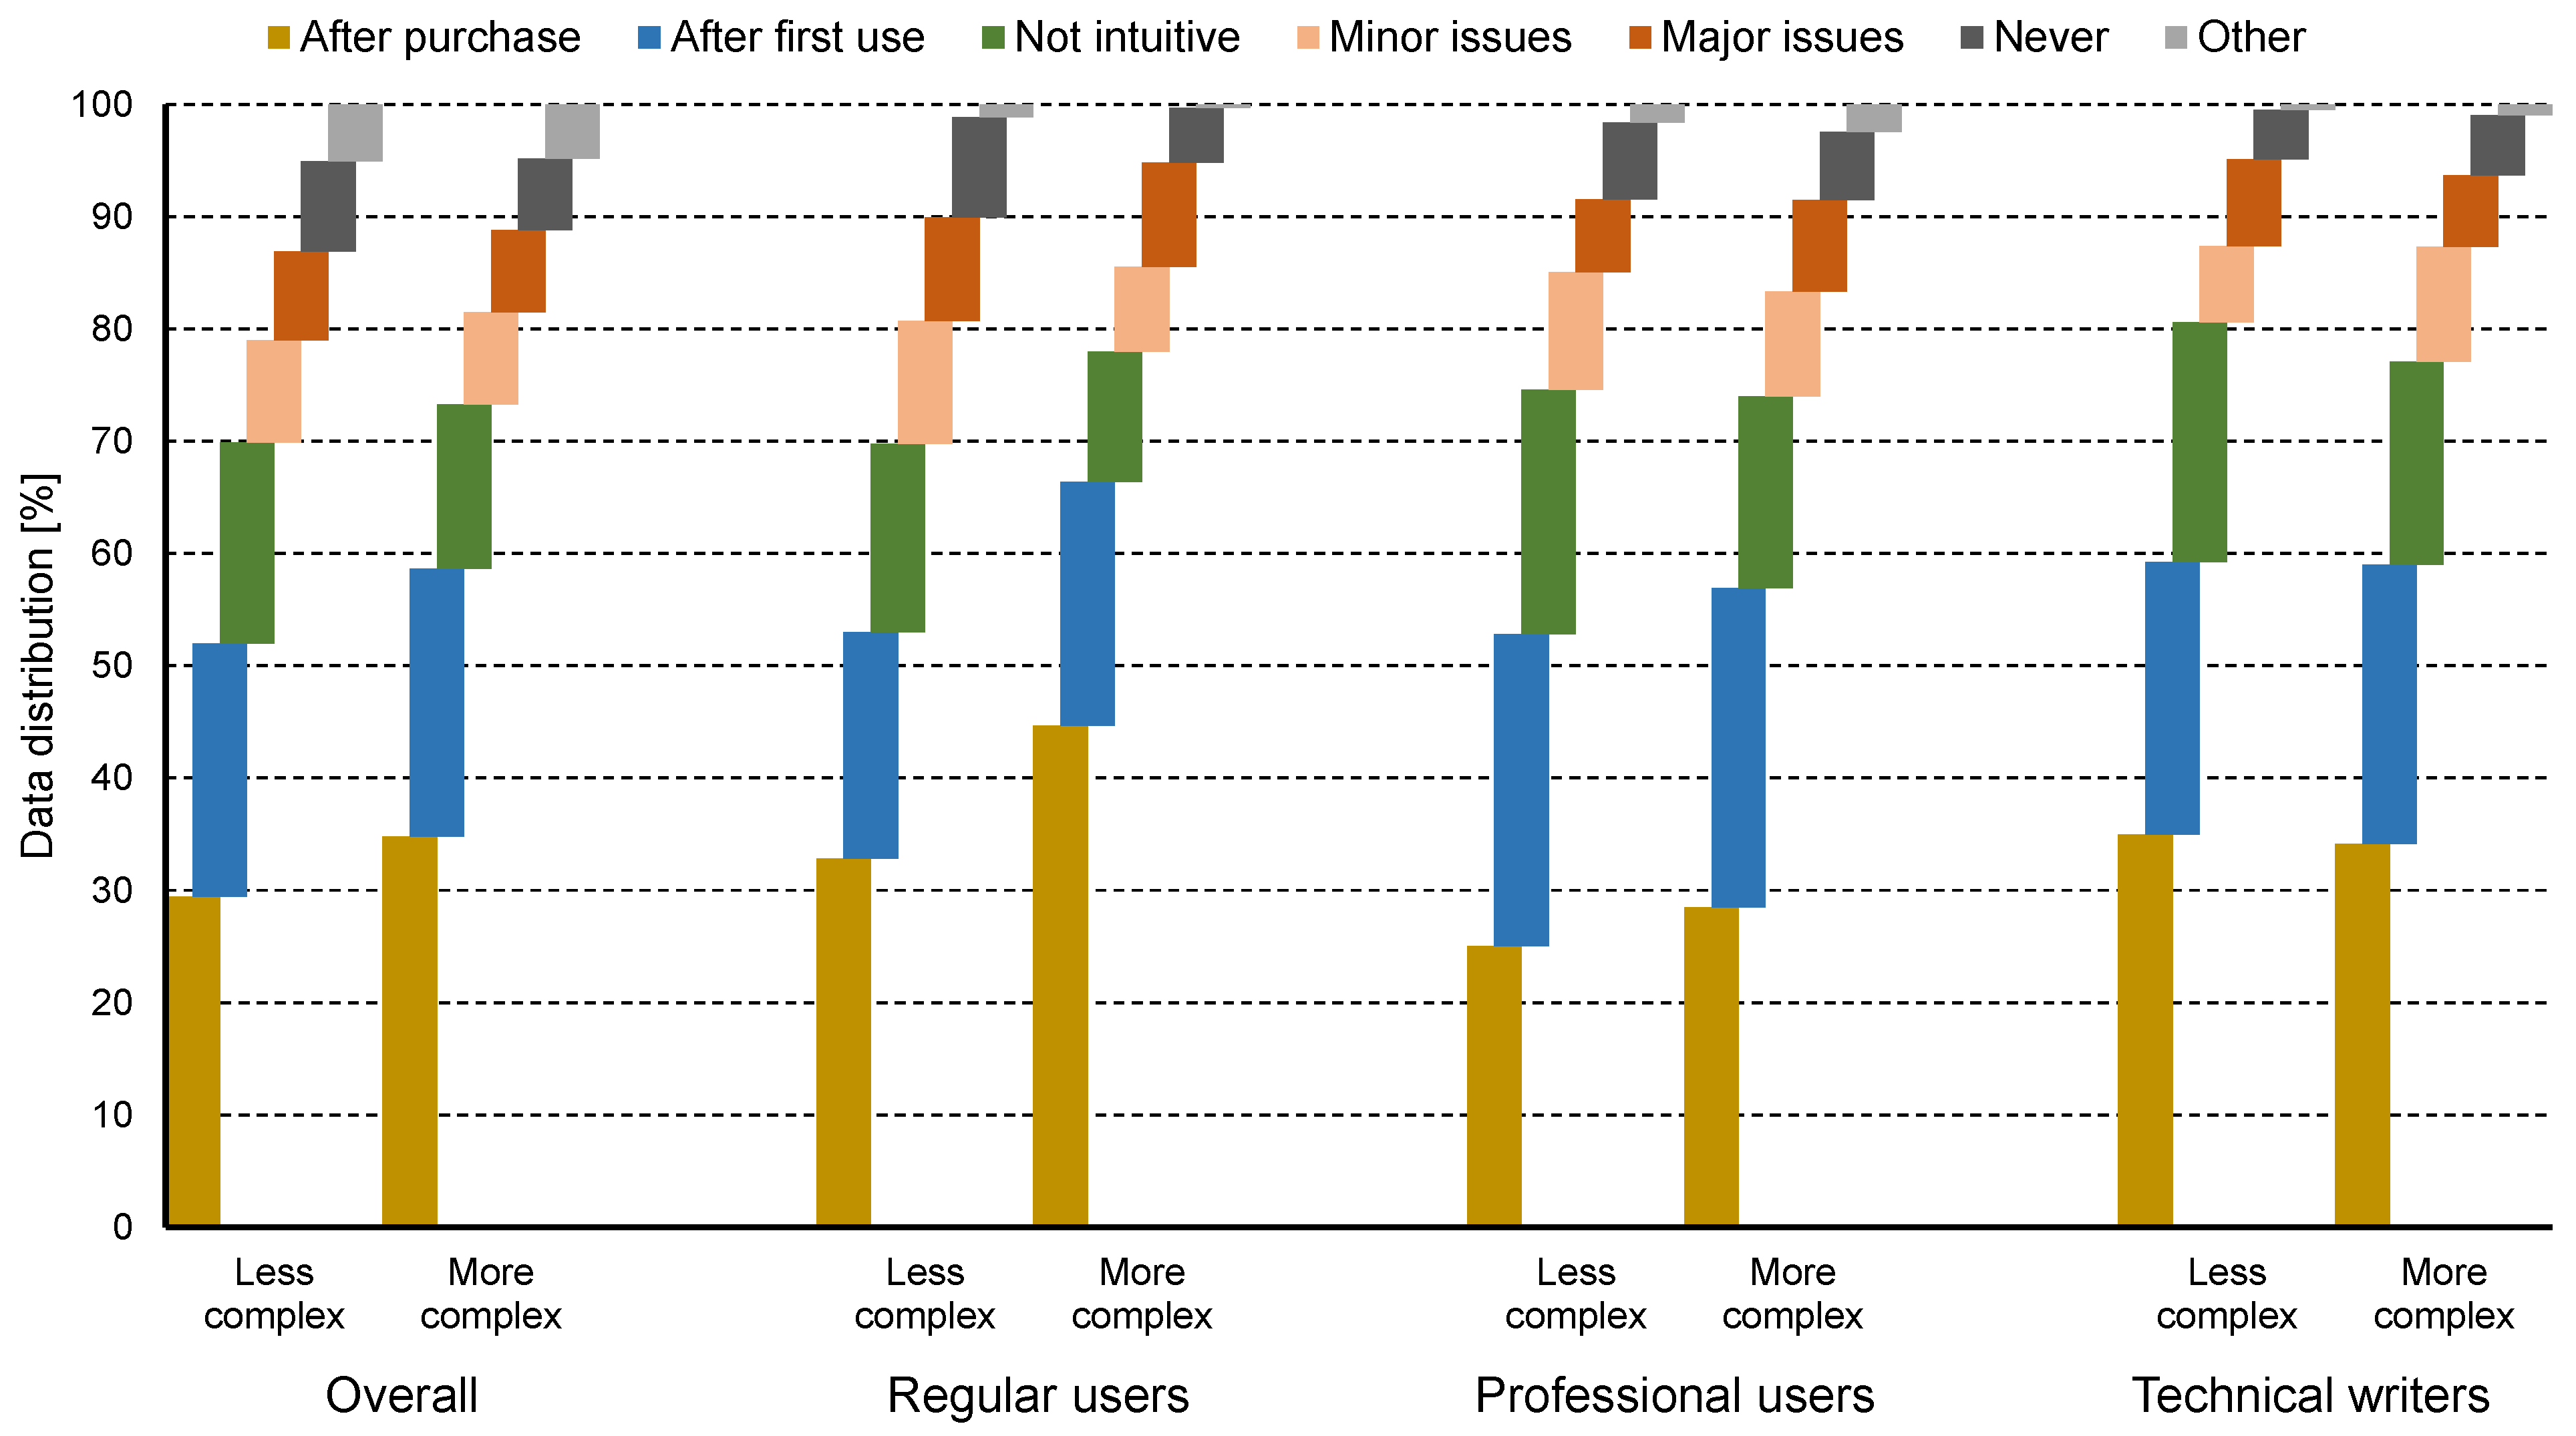
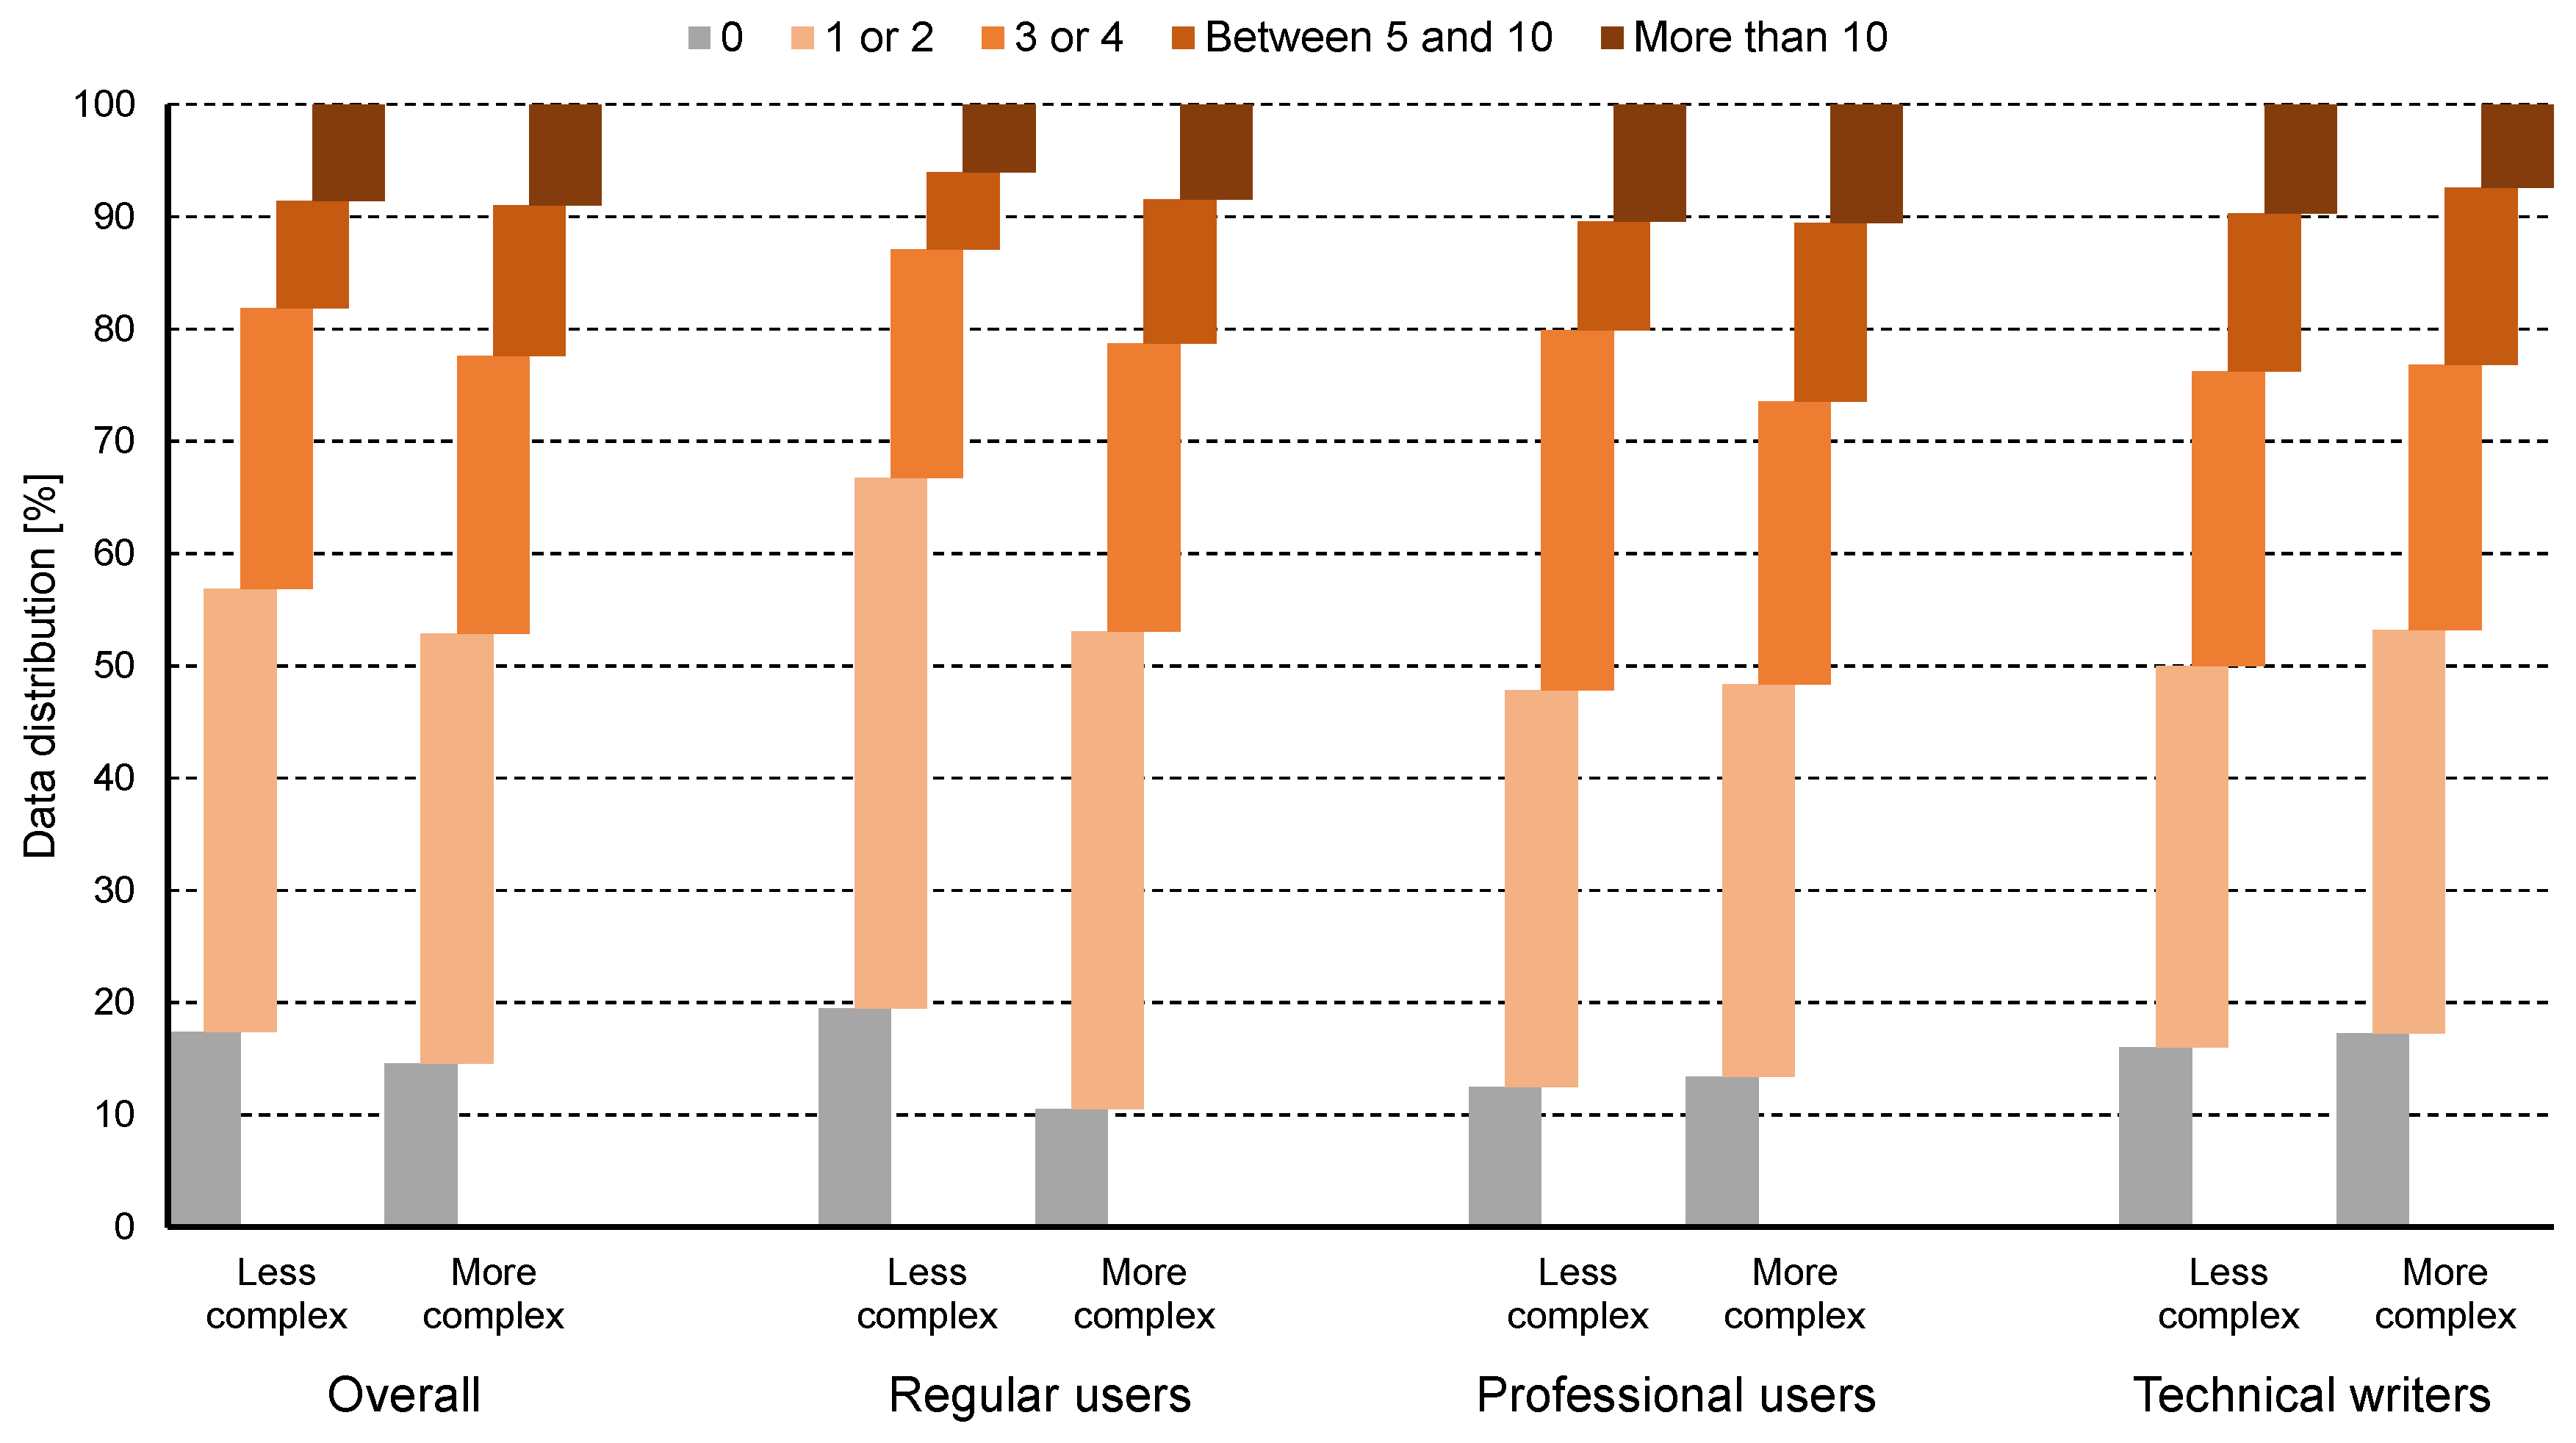
4.1.2. Device Complexity
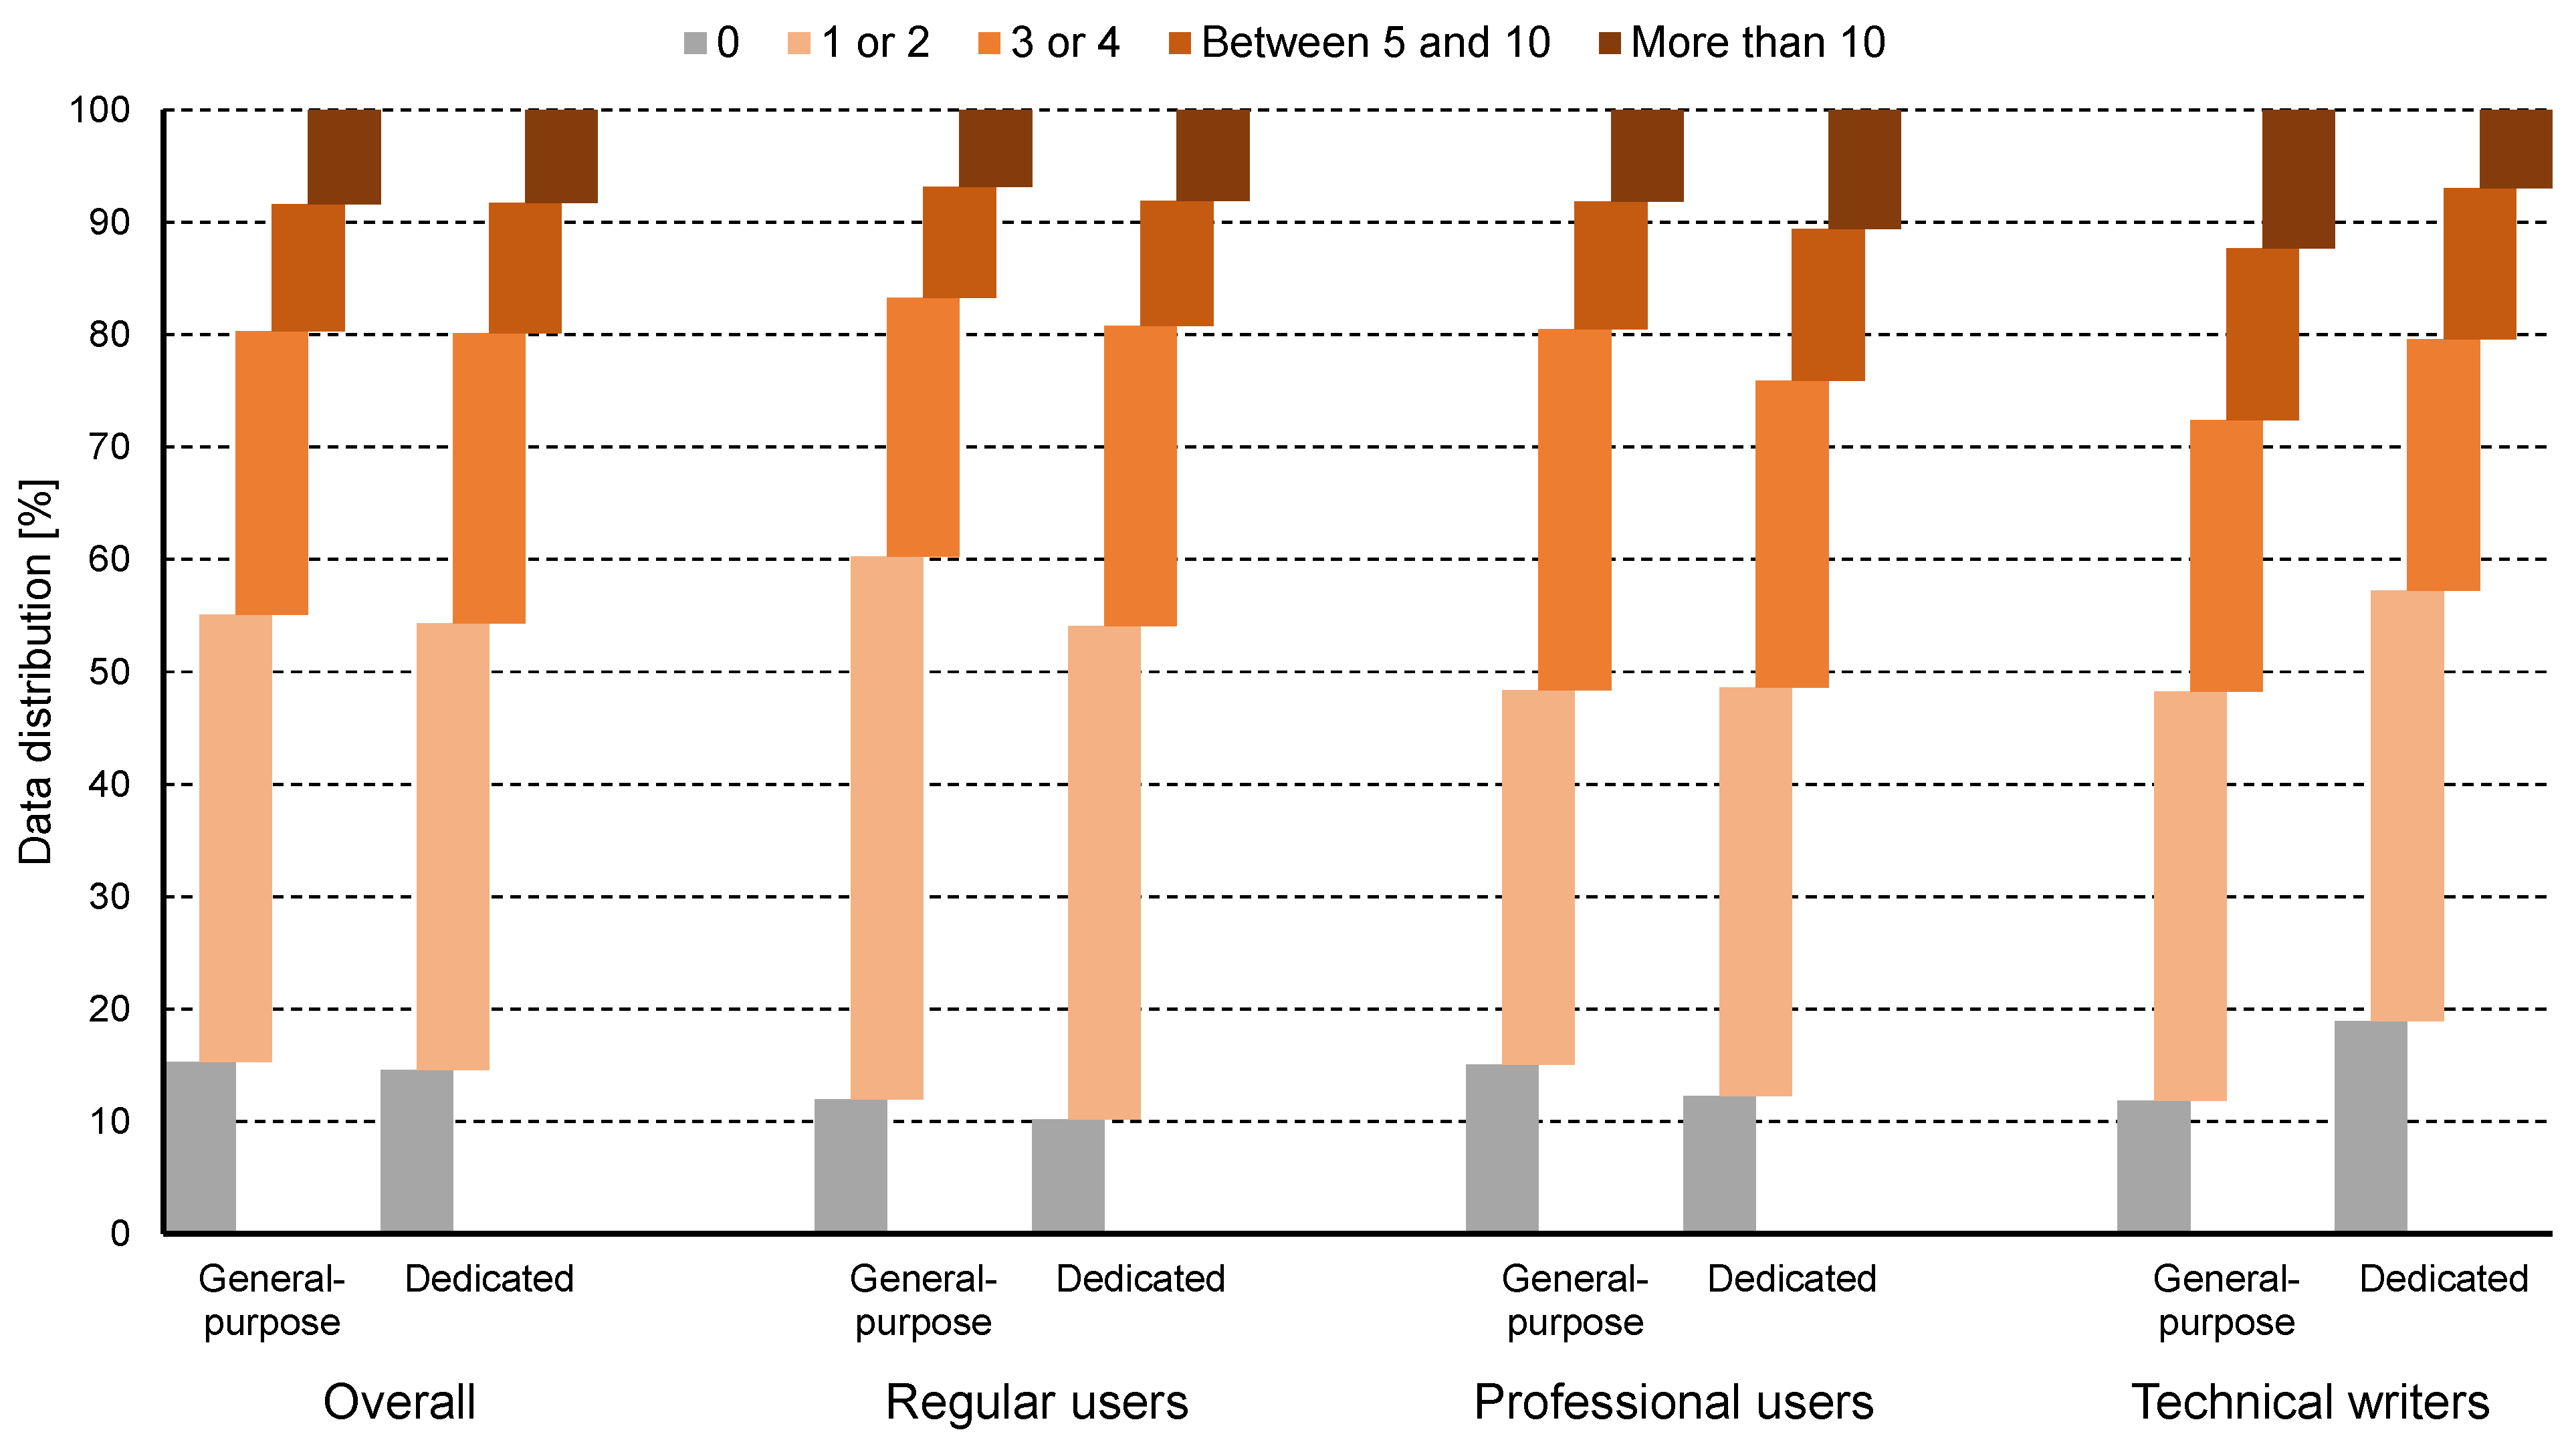
4.1.3. Device Purpose
4.1.4. Price Range
4.1.5. Other Questions
4.2. Research Beta
4.3. Research Gamma
4.4. Research Delta
5. Discussion
6. Conclusions
Author Contributions
Funding
Data Availability Statement
Acknowledgments
Conflicts of Interest
Abbreviations
| ADAS | Advanced driver assistance system |
| AR | Augmented reality |
| CHF | Congestive heart failure |
| MUM | Multi-dimensional user manual |
| PID | Pedagogical instructional design |
| VMS | Variable message sign |
Appendix A. Questions and Answers of Research Alpha
- 1.
- Q: In the case of devices with a good user experience, when do you first open the user manual?A: After purchase/After first use/If the device is not intuitive enough/If the device has minor issues/If the device has major issues/Never/Other
- 2.
- Q: In the case of devices with a good user experience, why do you usually open the user manual?A: To explore novel functionalities/To customize the device/To reset the device/For troubleshooting/Other
- 3.
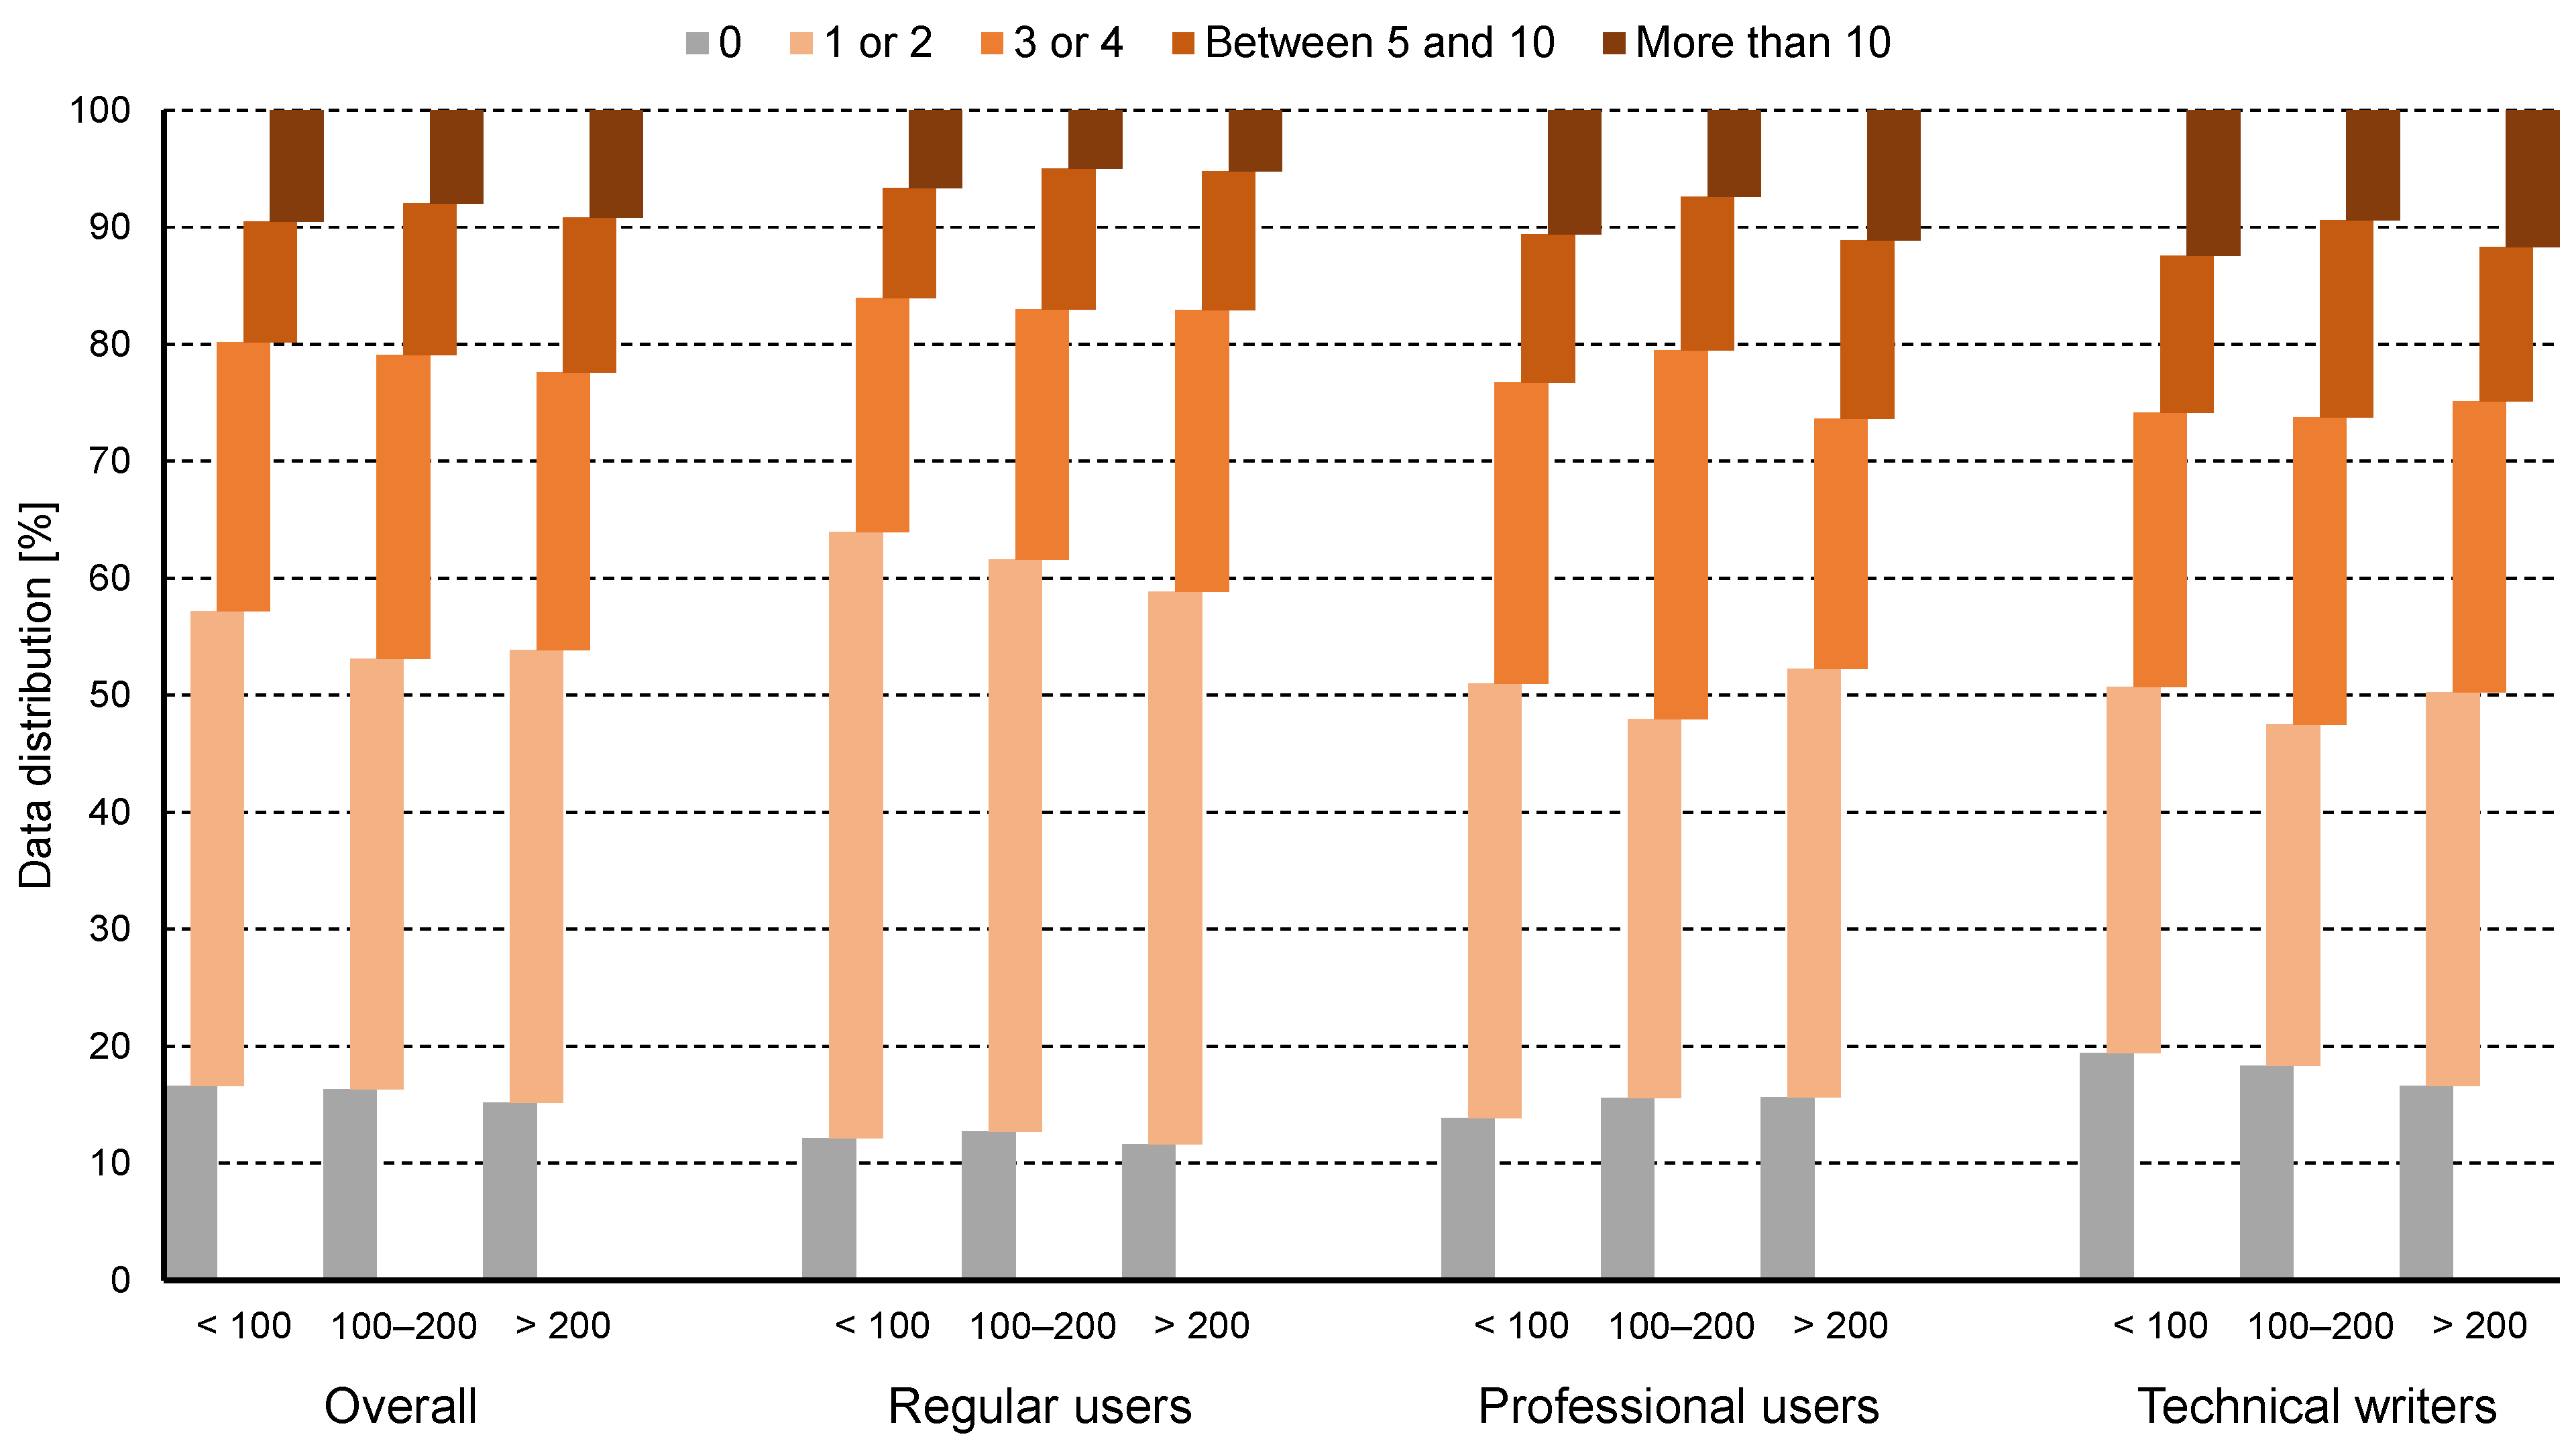
- Q: In the case of devices with a good user experience, during the complete life cycle of the device, how many times do you usually use the user manual?A: 0/1 or 2/3 or 4/Between 5 and 10/More than 10
- 4.
- Q: In the case of devices with a neutral user experience, when do you first open the user manual?A: After purchase/After first use/If the device is not intuitive enough/If the device has minor issues/If the device has major issues/Never/Other
- 5.
- Q: In the case of devices with a neutral user experience, why do you usually open the user manual?A: To explore novel functionalities/To customize the device/To reset the device/For troubleshooting/Other
- 6.
- Q: In the case of devices with a neutral user experience, during the complete life cycle of the device, how many times do you usually use the user manual?A: 0/1 or 2/3 or 4/Between 5 and 10/More than 10
- 7.
- Q: In the case of devices with a bad user experience, when do you first open the user manual?A: After purchase/After first use/If the device is not intuitive enough/If the device has minor issues/If the device has major issues/Never/Other
- 8.
- Q: In the case of devices with a bad user experience, why do you usually open the user manual?A: To explore novel functionalities/To customize the device/To reset the device/For troubleshooting/Other
- 9.
- Q: In the case of devices with a bad user experience, during the complete life cycle of the device, how many times do you usually use the user manual?A: 0/1 or 2/3 or 4/Between 5 and 10/More than 10
- 10.
- Q: In the case of less complex devices, when do you first open the user manual?A: After purchase/After first use/If the device is not intuitive enough/If the device has minor issues/If the device has major issues/Never/Other
- 11.
- Q: In the case of less complex devices, why do you usually open the user manual?A: To explore novel functionalities/To customize the device/To reset the device/For troubleshooting/Other
- 12.
- Q: In the case of less complex devices, during the complete life cycle of the device, how many times do you usually use the user manual?A: 0/1 or 2/3 or 4/Between 5 and 10/More than 10
- 13.
- Q: In the case of more complex devices, when do you first open the user manual?A: After purchase/After first use/If the device is not intuitive enough/If the device has minor issues/If the device has major issues/Never/Other
- 14.
- Q: In the case of more complex devices, why do you usually open the user manual?A: To explore novel functionalities/To customize the device/To reset the device/For troubleshooting/Other
- 15.
- Q: In the case of more complex devices, during the complete life cycle of the device, how many times do you usually use the user manual?A: 0/1 or 2/3 or 4/Between 5 and 10/More than 10
- 16.
- Q: In the case of general-purpose devices, when do you first open the user manual?A: After purchase/After first use/If the device is not intuitive enough/If the device has minor issues/If the device has major issues/Never/Other
- 17.
- Q: In the case of general-purpose devices, why do you usually open the user manual?A: To explore novel functionalities/To customize the device/To reset the device/For troubleshooting/Other
- 18.
- Q: In the case of general-purpose devices, during the complete life cycle of the device, how many times do you usually use the user manual?A: 0/1 or 2/3 or 4/Between 5 and 10/More than 10
- 19.
- Q: In the case of dedicated devices, when do you first open the user manual?A: After purchase/After first use/If the device is not intuitive enough/If the device has minor issues/If the device has major issues/Never/Other
- 20.
- Q: In the case of dedicated devices, why do you usually open the user manual?A: To explore novel functionalities/To customize the device/To reset the device/For troubleshooting/Other
- 21.
- Q: In the case of dedicated devices, during the complete life cycle of the device, how many times do you usually use the user manual?A: 0/1 or 2/3 or 4/Between 5 and 10/More than 10
- 22.
- Q: In the case of devices that cost less than USD 100, when do you first open the user manual?A: After purchase/After first use/If the device is not intuitive enough/If the device has minor issues/If the device has major issues/Never/Other
- 23.
- Q: In the case of devices that cost less than USD 100, why do you usually open the user manual?A: To explore novel functionalities/To customize the device/To reset the device/For troubleshooting/Other
- 24.
- Q: In the case of devices that cost less than USD 100, during the complete life cycle of the device, how many times do you usually use the user manual?A: 0/1 or 2/3 or 4/Between 5 and 10/More than 10
- 25.
- Q: In the case of devices that cost between USD 100 and USD 200, when do you first open the user manual?A: After purchase/After first use/If the device is not intuitive enough/If the device has minor issues/If the device has major issues/Never/Other
- 26.
- Q: In the case of devices that cost between USD 100 and USD 200, why do you usually open the user manual?A: To explore novel functionalities/To customize the device/To reset the device/For troubleshooting/Other
- 27.
- Q: In the case of devices that cost between USD 100 and USD 200, during the complete life cycle of the device, how many times do you usually use the user manual?A: 0/1 or 2/3 or 4/Between 5 and 10/More than 10
- 28.
- Q: In the case of devices that cost more than USD 200, when do you first open the user manual?A: After purchase/After first use/If the device is not intuitive enough/If the device has minor issues/If the device has major issues/Never/Other
- 29.
- Q: In the case of devices that cost more than USD 200, why do you usually open the user manual?A: To explore novel functionalities/To customize the device/To reset the device/For troubleshooting/Other
- 30.
- Q: In the case of devices that cost more than USD 200, during the complete life cycle of the device, how many times do you usually use the user manual?A: 0/1 or 2/3 or 4/Between 5 and 10/More than 10
- 31.
- Q: Do you primarily seek information in figures or in text?A: In figures/In text
- 32.
- Q: Regarding figures, what do you prefer in a quick guide?A: Conceptual figures/Photos or screenshots
- 33
- Q: What kind of figures do you prefer in a quick guide?A: Colored figures/Black and white figures
- 34.
- Q: If a mobile application is available, what form of access do you prefer?A: QR code/Direct link to application store/None of the above
- 35.
- Q: What ratio between text and figures do you prefer in a quick guide?A: 100% text, 0% figures/75% text, 25% figures/50% text, 50% figures/25% text, 75% figures/0% text, 100% figures
Appendix B. Questions and Answers of Research Beta
- 1.
- Q: How satisfied are you with the length of user manuals?A: −5 (Too short)/−4/−3/−2/−1/0/1/2/3/4/5 (Too long)
- 2.
- Q: If you used the user manual, how easily could you find that you searched for?A: 0 (Hard to find)/1/2/3/4/5/6/7/8/9/10 (Easy to find)
- 3.
- Q: Do you prefer text with objective/neutral tone or personal/friendly tone?A: −5 (Objective/neutral tone)/−4/−3/−2/−1/0/1/2/3/4/5(Personal/friendly tone)
- 4.
- Q: How easy is it to understand the text in user manuals?A: 0 (Difficult to understand)/1/2/3/4/5/6/7/8/9/10 (Easy to understand)
- 5.
- Q: What do you think about the amount of figures/pictures in user manuals?A: −5 (Too few)/−4/−3/−2/−1/0/1/2/3/4/5 (Too many)
- 6.
- Q: What do you think about the quality and usefulness of figures/pictures in user manuals?A: 0 (Low quality, useless)/1/2/3/4/5/6/7/8/9/10 (High quality, useful)
- 7.
- Q: If you encounter a grammatical/spelling/punctuation error in user manuals, how much does it negatively affect your opinion about the user manuals?A: 0 (Not at all)/1/2/3/4/5/6/7/8/9/10 (Greatly affects my opinion)
- 8.
- Q: How much does the low overall quality of the user manual negatively affect your opinion about the device?A: 0 (Not at all)/1/2/3/4/5/6/7/8/9/10 (Greatly affects my opinion)
- 9.
- Q: How much does the high overall quality of the user manual positively affect your opinion about the device?A: 0 (Not at all)/1/2/3/4/5/6/7/8/9/10 (Greatly affects my opinion)
- 10.
- Q: Would it be a problem for you if no printed user manual was provided for your device?A: 0 (Unacceptable)/1/2/3/4/5/6/7/8/9/10 (Completely acceptable)
- 11.
- Q: What is your primary source of help if you encounter an error with your device?A: −5 (Internet)/−4/−3/−2/−1/0/1/2/3/4/5 (User manual)
- 12.
- Q: What is your primary source of help if you wish to customize your device?A: −5 (Internet)/−4/−3/−2/−1/0/1/2/3/4/5 (User manual)
- 13.
- Q: What is more important to you regarding your device?A: −5 (Functionality)/−4/−3/−2/−1/0/1/2/3/4/5 (Design or appearance)
- 14.
- Q: Regarding the devices purchased in the past 5 years, how satisfied were you with them?A: 0 (Completely dissatisfied)/1/2/3/4/5/6/7/8/9/10 (Completely satisfied)
- 15.
- Q: Regarding the devices purchased in the past 5 years, how satisfied were you with the user manuals?A: 0 (Completely dissatisfied)/1/2/3/4/5/6/7/8/9/10 (Completely satisfied)
- 16.
- Q: Regarding the devices purchased in the past 5 years, how intuitive were the devices?A: 0 (Completely unintuitive)/1/2/3/4/5/6/7/8/9/10 (Completely intuitive)
- 17.
- Q: Regarding the devices purchased in the past 5 years, how satisfied were you with the performance of the devices compared to their prices?A: 0 (Completely dissatisfied)/1/2/3/4/5/6/7/8/9/10 (Completely satisfied)
- 18.
- Q: Regarding the devices purchased in the past 5 years, how satisfied were you with the user manuals of the devices compared to the prices of the devices?A: 0 (Completely dissatisfied)/1/2/3/4/5/6/7/8/9/10 (Completely satisfied)
Appendix C. Questions and Answers of Research Gamma
- 1.
- Q: Do you wear and use smart medical wearable devices for sleeping?A: Yes/No
- 2.
- Q: Do you wear and use smart medical wearable devices for sports and training?A: Yes/No
- 3.
- Q: Do you wear and use smart medical wearable devices during work?A: Yes/No
- 4.
- Q: Do you wear and use smart medical wearable devices for other activities?A: Yes/No
- 5.
- Q: Do you use smart medical wearable devices for sleep monitoring?A: Yes/No
- 6.
- Q: Do you use smart medical wearable devices for heart rate monitoring?A: Yes/No
- 7.
- Q: Do you use smart medical wearable devices for step counting?A: Yes/No
- 8.
- Q: Do you use smart medical wearable devices for ECG monitoring?A: Yes/No
- 9.
- Q: Do you use smart medical wearable devices for blood oxygen measurement?A: Yes/No
- 10.
- Q: Why do you usually open the user manual?A: For health concerns/To explore novel functionalities/To customize the device/To reset the device/For troubleshooting/Other reason
- 11.
- Q: What user manual format do you prefer?A: Printed/PDF/Static HTML/Interactive HTML
- 12.
- Q: Where do you primarily seek information in the user manual?A: In figures/In texts
- 13.
- Q: How intuitive do you find your smart medical wearable devices?A: Completely unintuitive/Unintuitive/Neutral/Intuitive/Completely intuitive
- 14.
- Q: During the complete life cycle of the device, how many times do you access the user manual?A: [Zero or positive integer]
- 15.
- Q: How easily do you find what you’re looking for in the user manual?A: Completely difficult/Difficult/Neutral/Easy/Completely easy
- 16.
- Q: How satisfied are you in general with the user manuals of smart medical wearable devices?A: Completely disstatisfied/Dissatisfied/Neutral/Satisfied/Completely satisfied
- 17.
- Q: If you encounter any abnormal medical value/measurement, how likely is it that you access the user manual for medical information?A: Completely unlikely/Unlikely/Neutral/Likely/Completely likely
- 18.
- Q: Do you find it acceptable to purchase a smart medical wearable device without a printed user manual?A: Completely unacceptable/Unacceptable/Neutral/Acceptable/Completely acceptable
Appendix D. Questions and Answers of Research Delta
- 1.
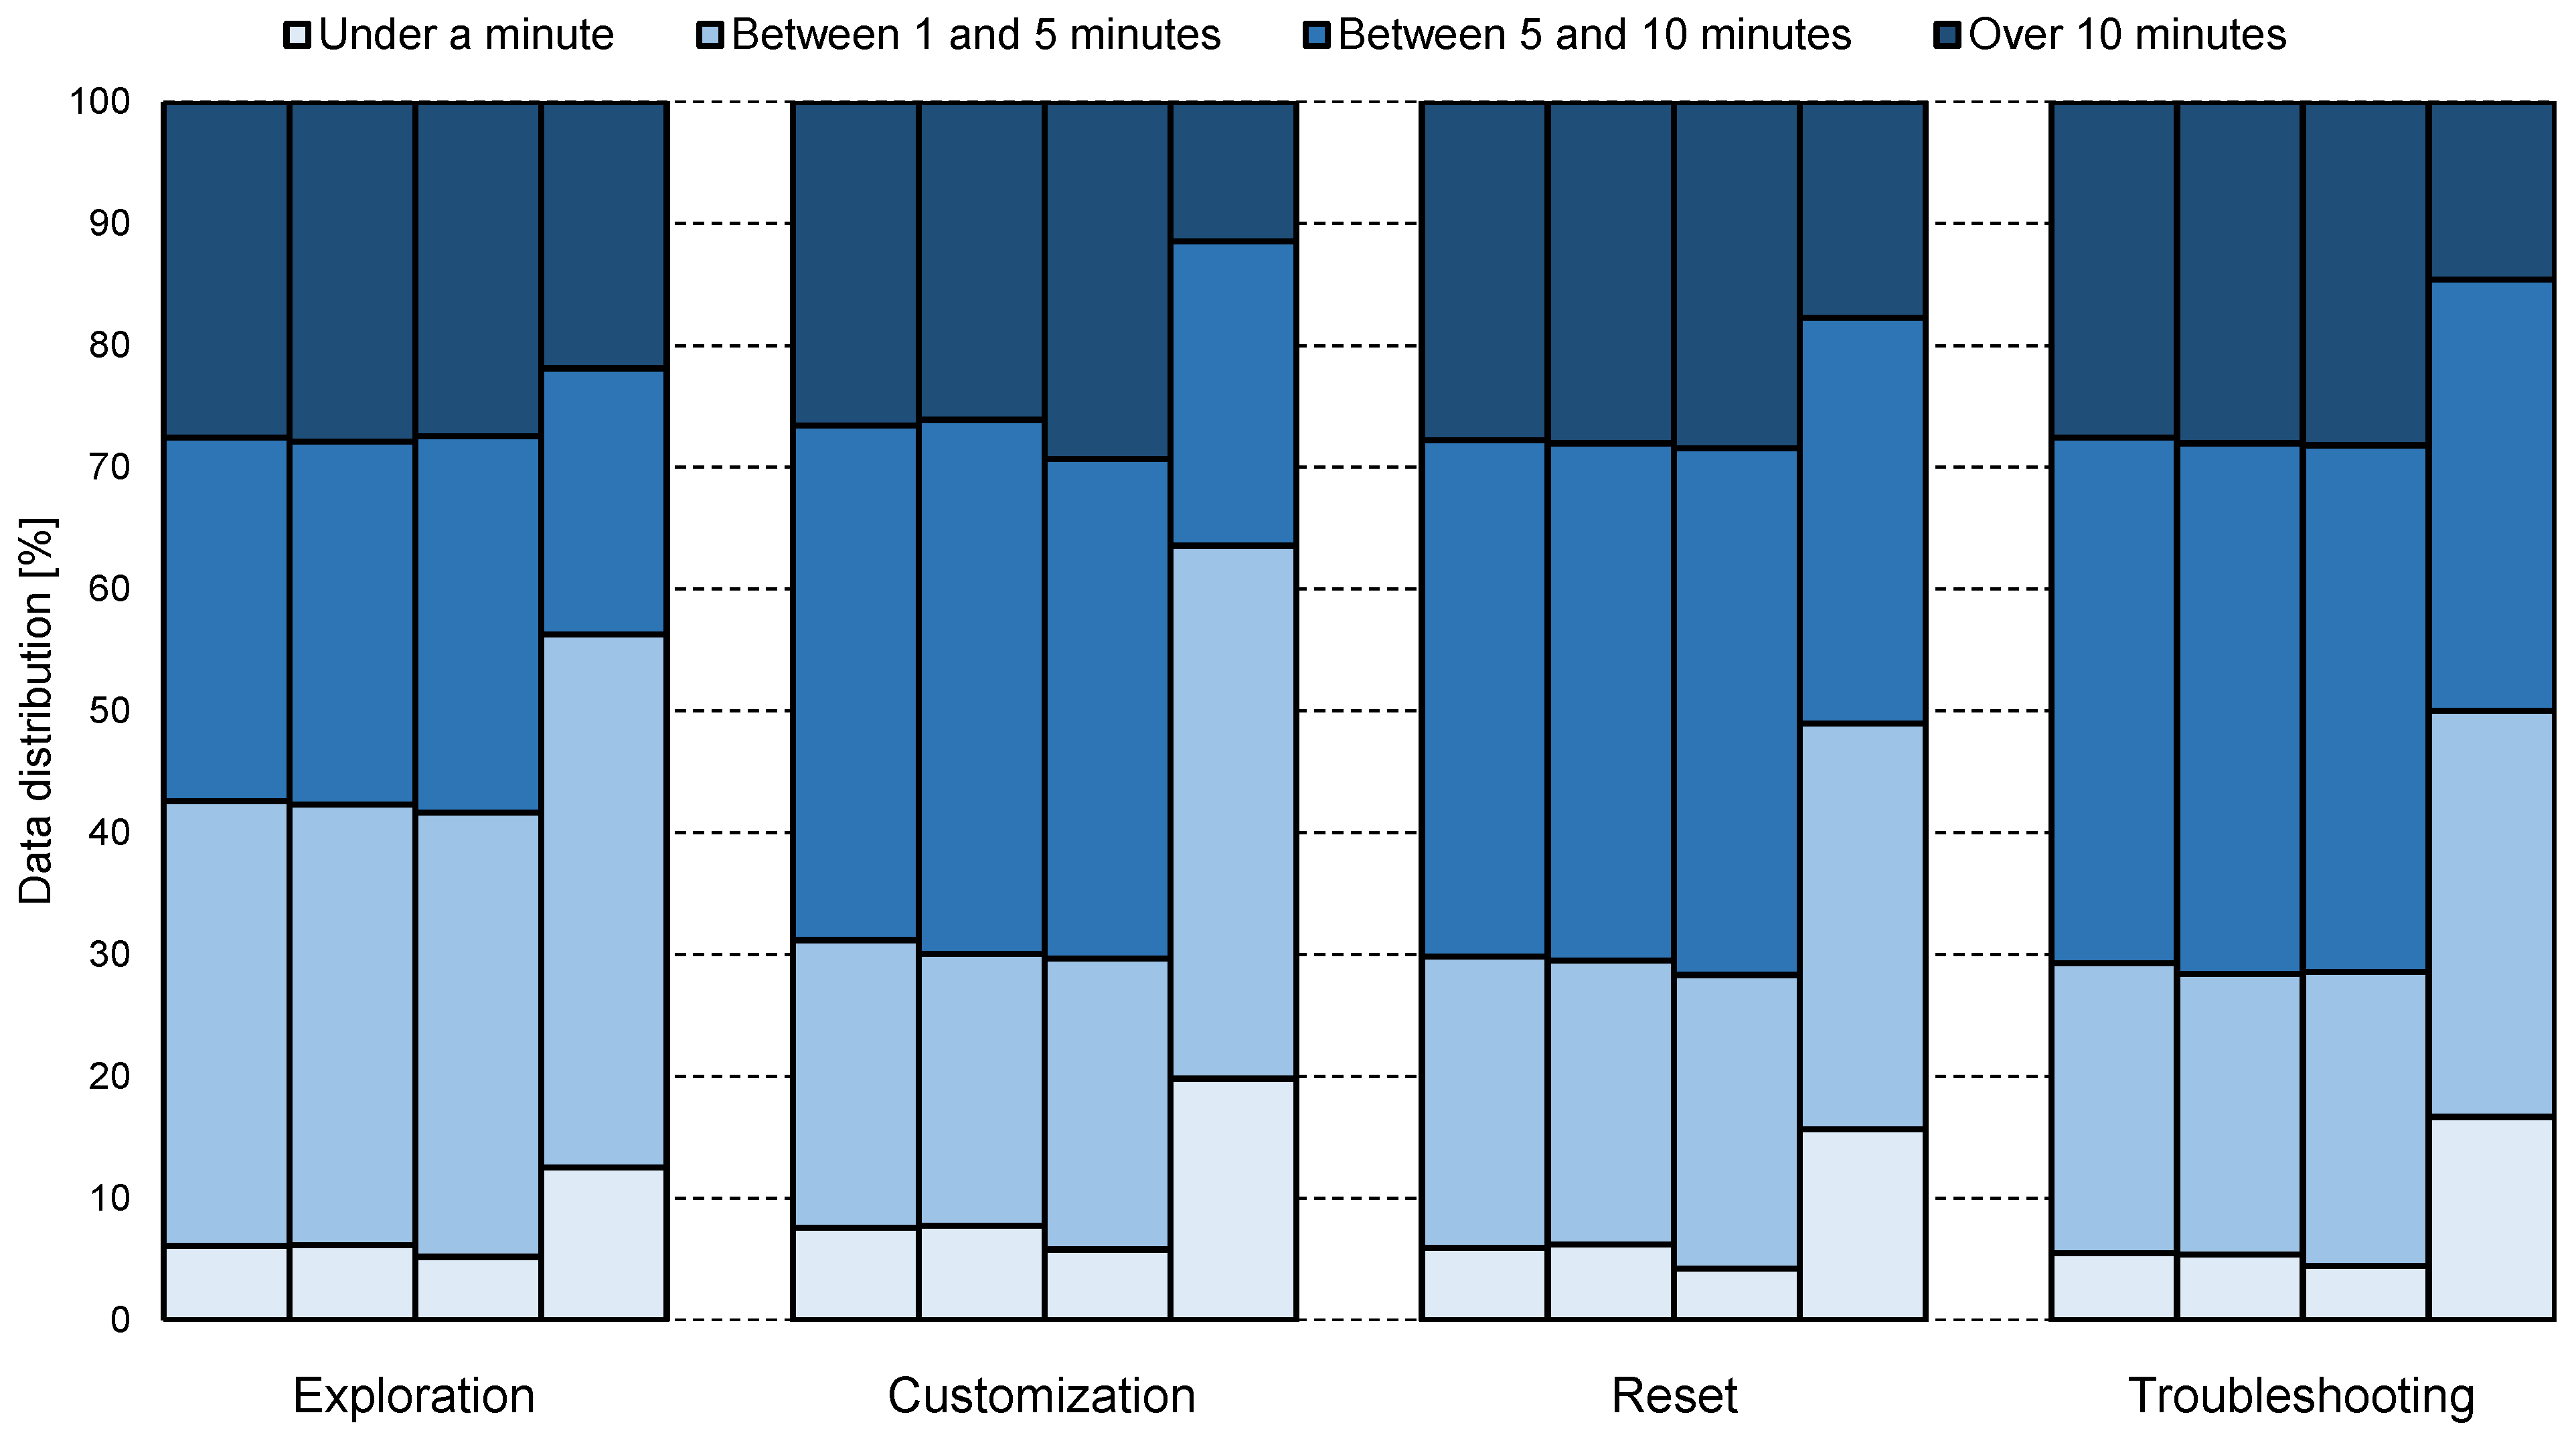
- Q: How much time does it usually take you to find what you’re looking for in the user manual in the case of exploring novel functionalities?A: Under a minute/Between 1 and 5 min/Between 5 and 10 min/Over 10 min
- 2.
- Q: How much time does it usually take you to find what you’re looking for in the user manual in the case of customizing the device?A: Under a minute/Between 1 and 5 min/Between 5 and 10 min/Over 10 min
- 3.
- Q: How much time does it usually take you to find what you’re looking for in the user manual in the case of resetting the device?A: Under a minute/Between 1 and 5 min/Between 5 and 10 min/Over 10 min
- 4.
- Q: How much time does it usually take you to find what you’re looking for in the user manual in the case of troubleshooting?A: Under a minute/Between 1 and 5 min/Between 5 and 10 min/Over 10 min
- 5
- Q: After how much time on average do you give up looking for information in the user manual in the case of exploring novel functionalities?A: Under a minute/Between 1 and 5 min/Between 5 and 10 min/Over 10 min
- 6.
- Q: After how much time on average do you give up looking for information in the user manual in the case of customizing the device?A: Under a minute/Between 1 and 5 min/Between 5 and 10 min/Over 10 min
- 7.
- Q: After how much time on average do you give up looking for information in the user manual in the case of resetting the device?A: Under a minute/Between 1 and 5 min/Between 5 and 10 min/Over 10 min
- 8.
- Q: After how much time on average do you give up looking for information in the user manual in the case of troubleshooting?A: Under a minute/Between 1 and 5 min/Between 5 and 10 min/Over 10 min
- 9.
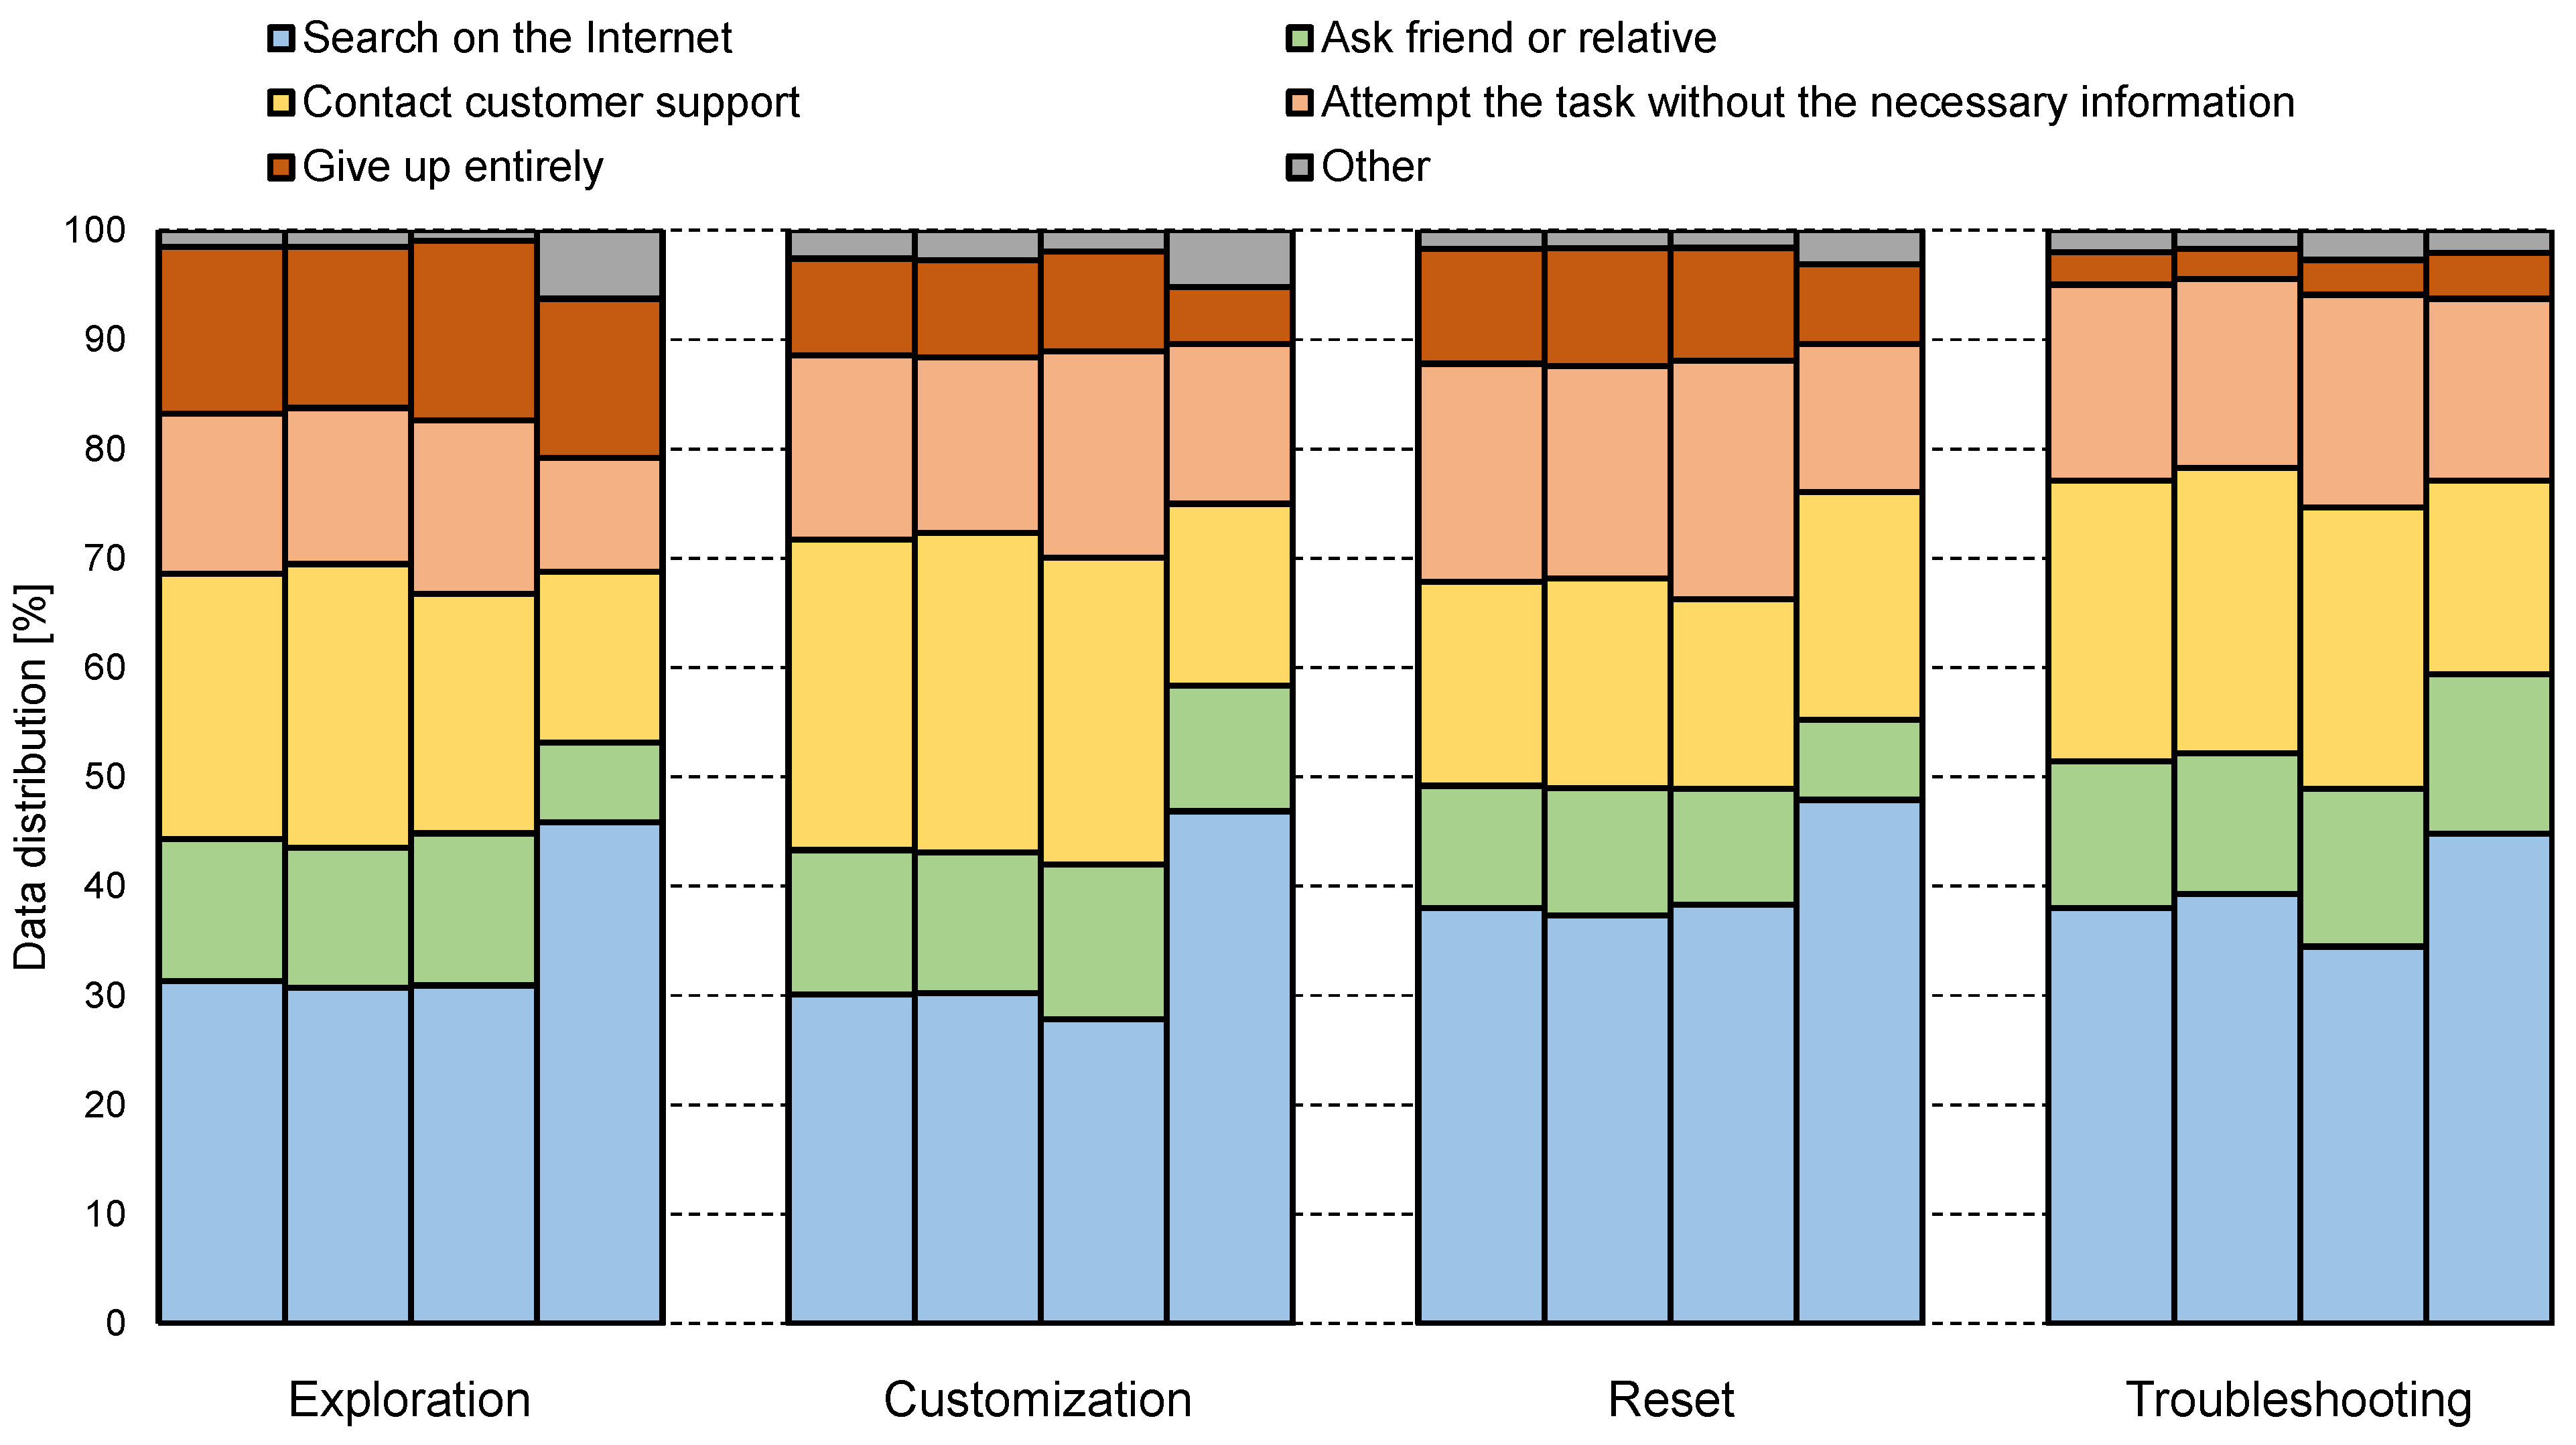
- Q: What do you usually do when you’re unable to find what you’re looking for in the user manual, in the case of exploring novel functionalities?A: Search on the Internet/Ask friend or relative/Contact customer support/Attempt the task without the necessary information/Give up entirely/Other
- 10.
- Q: What do you usually do when you’re unable to find what you’re looking for in the user manual in the case of customizing the device?A: Search on the Internet/Ask friend or relative/Contact customer support/Attempt the task without the necessary information/Give up entirely/Other
- 11.
- Q: What do you usually do when you’re unable to find what you’re looking for in the user manual in the case of resetting the device?A: Search on the Internet/Ask friend or relative/Contact customer support/Attempt the task without the necessary information/Give up entirely/Other
- 12.
- Q: What do you usually do when you’re unable to find what you’re looking for in the user manual in the case of troubleshooting?A: Search on the Internet/Ask friend or relative/Contact customer support/Attempt the task without the necessary information/Give up entirely/Other
- 13.
- Q: What do you prefer in terms of document language?A: −5 (Simplified)/−4/−3/−2/−1/0 (No preference)/+1/+2/+3/+4/+5 (Technical)
- 14.
- Q: If you’re unable to find what you’re looking for in the user manual, what do you think the reason might be?A: Too complicated technical language/Illogical structuring/Incomplete user manual (does not contain the information at all)/Implicit information (does not contain the information explicitly)/Other
- 15.
- Q: On average, how satisfied are you with the user manuals?A: 0 (Very unsatisfied)/1/2/3/4/5/6/7/8/9/10 (Very satisfied)
- 16.
- Q: On average, how satisfied are you with the time efficiency of user manuals (i.e., how fast do you find what you’re looking for)?A: 0 (Very unsatisfied)/1/2/3/4/5/6/7/8/9/10 (Very satisfied)
- 17.
- Q: On average, how satisfied are you with the language of the user manuals?A: 0 (Very unsatisfied)/1/2/3/4/5/6/7/8/9/10 (Very satisfied)
- 18.
- Q: On average, how satisfied are you with the structure of the user manuals?A: 0 (Very unsatisfied)/1/2/3/4/5/6/7/8/9/10 (Very satisfied)
- 19.
- Q: On average, how satisfied are you with the visualization (i.e., figures and images) of the user manuals?A: 0 (Very unsatisfied)/1/2/3/4/5/6/7/8/9/10 (Very satisfied)
- 20.
- Q: On average, how satisfied are you with the length of the user manuals?A: 0 (Very unsatisfied)/1/2/3/4/5/6/7/8/9/10 (Very satisfied)
References
- Mead, J. Measuring the value added by technical documentation: A review of research and practice. Tech. Commun. 1998, 45, 353. [Google Scholar]
- van Loggem, B. User documentation: The Cinderella of information systems. In Advances in Information Systems and Technologies; Springer: Berlin/Heidelberg, Germany, 2013; pp. 167–177. [Google Scholar]
- Rettig, M. Nobody reads documentation. Commun. ACM 1991, 34, 19–24. [Google Scholar] [CrossRef]
- Novick, D.G.; Ward, K. Why don’t people read the manual? In Proceedings of the 24th Annual ACM International Conference on Design of Communication, Myrtle Beach, SC, USA, 18–20 October 2006; pp. 11–18. [Google Scholar]
- Directive 2006/42/EC of the European Parliament and of the Council of 17 May 2006 on Machinery, and Amending Directive 95/16/EC; Document 32006L0042. Available online: https://eur-lex.europa.eu/legal-content/EN/ALL/?uri=CELEX%3A32006L0042 (accessed on 28 July 2023).
- Blackler, A.L.; Gomez, R.; Popovic, V.; Thompson, M.H. Life is too short to RTFM: How users relate to documentation and excess features in consumer products. Interact. Comput. 2016, 28, 27–46. [Google Scholar] [CrossRef]
- Wearables Unit Shipments Worldwide by Vendor from 1st Quarter 2014 to 4th Quarter 2022. Available online: https://www.statista.com/statistics/435933/quarterly-wearables-shipments-worldwide-by-vendor/ (accessed on 28 July 2023).
- Geyer, F.; Szakal, V.A.; Kara, P.A.; Simon, A. Cognitive-bias-induced differences in the perceived video quality of rugged and conventional smartphones. In Proceedings of the 2022 16th International Conference on Signal-Image Technology & Internet-Based Systems (SITIS), Dijon, France, 19–21 October 2022; IEEE: New York, NY, USA, 2022; pp. 592–599. [Google Scholar]
- Simon, A.; Xinyu, Q.; Kara, P.A.; Lakovic, L.; Ognjanovic, I.; Sendelj, R.; Reich, C.; Roganovic, M.; Mantas, J.; Bokor, L. The User, the Watch, and the Bestseller: Study on the Utilization of Smart Medical Wearables and Their User Manuals. In Proceedings of the Healthcare Transformation with Informatics and Artificial Intelligence: ICIMTH 2023, the 21st International Conference on Informatics, Management, and Technology in Healthcare, Athens, Greece, 1–3 July 2023; IOS Press: Amsterdam, The Netherlands, 2023; pp. 361–364. [Google Scholar]
- Simon, A.; Szy, L.; Kara, P.A.; Guindy, M. Who watches the watches: On the delivery of the specifications of smart wearable devices and recommendations on the related best practices. In Proceedings of the Smart Biomedical and Physiological Sensor Technology XIX, Orlando, FL, USA, 4 April 2022; SPIE: Bellingham, WA, USA, 2022. [Google Scholar]
- Gould, J.D.; Lewis, C. Designing for usability: Key principles and what designers think. Commun. ACM 1985, 28, 300–311. [Google Scholar] [CrossRef]
- Webb, D.R. Writing effective user manuals: Basic guidelines and tips. Libr. Hi Tech 1989, 7, 41–47. [Google Scholar] [CrossRef]
- Eriksson, M. How systems thinking methods increase usability of user manuals—A case study. In Proceedings of the 2007 IEEE International Engineering Management Conference, Singapore, 2–5 December 2007; IEEE: New York, NY, USA, 2007; pp. 214–219. [Google Scholar]
- Fowler, S.L.; Roeger, D. Programmer and writer collaboration: Making user manuals that work. IEEE Trans. Prof. Commun. 1986, PC-29, 21–25. [Google Scholar] [CrossRef]
- Muller, M.E. A review of the manuals for BMDP and SPSS. J. Am. Stat. Assoc. 1978, 73, 71–80. [Google Scholar] [CrossRef]
- Maynard, J. A user-driven approach to better user manuals. IEEE Trans. Prof. Commun. 1982, PC-25, 16–19. [Google Scholar] [CrossRef]
- Ramsay, J.E.; Oatley, K. Designing minimal computer manuals from scratch. Instr. Sci. 1992, 21, 85–97. [Google Scholar] [CrossRef]
- Carroll, J.M.; Smith-Kerker, P.L.; Ford, J.R.; Mazur-Rimetz, S.A. The minimal manual. Hum.-Comput. Interact. 1987, 3, 123–153. [Google Scholar] [CrossRef]
- Wright, P. Manual dexterity—A user-oriented approach to creating computer documentation. In Proceedings of the SIGCHI Conference on Human Factors in Computing Systems, Boston, MA, USA, 12–15 December 1983; pp. 11–18. [Google Scholar]
- Brockmann, R.J. Writing Better Computer User Documentation: From Paper to Online; John Wiley & Sons, Inc.: New York, NY, USA, 1986. [Google Scholar]
- Miles, G. Improving user manuals in software engineering education. In Proceedings of the Software Engineering Education: SEI Conference, Pittsburgh, PA, USA, 18–21 July 1989; Proceedings 2. Springer: Berlin/Heidelberg, Germany, 1989; pp. 189–202. [Google Scholar]
- Barrett, C. User Manuals and Their Problems. In The Practical Handbook of Computerization for Distribution Managers; Springer Science & Business Media: Berlin/Heidelberg, Germany, 1987; pp. 213–214. [Google Scholar]
- Schneider, G.M.; Martin, J.; Tsai, W.T. An experimental study of fault detection in user requirements documents. ACM Trans. Softw. Eng. Methodol. (TOSEM) 1992, 1, 188–204. [Google Scholar] [CrossRef]
- Wright, P. “The instructions clearly state…” Can’t people read? Appl. Ergon. 1981, 12, 131–141. [Google Scholar] [CrossRef]
- Zeitlin, L.R. Failure to follow safety instructions: Faulty communication or risky decisions? Hum. Factors 1994, 36, 172–181. [Google Scholar] [CrossRef]
- Williams-Deane, M.; Potter, L.S. Current oral contraceptive use instructions: An analysis of patient package inserts. Fam. Plan. Perspect. 1992, 24, 111–115. [Google Scholar] [CrossRef]
- Jansen, C.; Balijon, S. How do people use instruction guides?: Confirming and disconfirming patterns of use. Doc. Des. 2002, 3, 195–204. [Google Scholar] [CrossRef][Green Version]
- Comstock, E.M.; Clemens, E.A. Perceptions of computer manuals: A view from the field. In Proceedings of the Human Factors Society Annual Meeting, New York, NY, USA, 1 October 1987; SAGE Publications: Los Angeles, CA, USA, 1987; Volume 31, pp. 139–143. [Google Scholar]
- Cooper, M.M. The postmodern space of operator’s manuals. Tech. Commun. Q. 1996, 5, 385–410. [Google Scholar] [CrossRef]
- Millar, C. Making manuals obsolete: Getting information out of the manual and into the product. Tech. Commun. 1998, 45, 161–168. [Google Scholar]
- Zajc, M. The Concept of Dispositiv: Studying Technology in Terms of Its Use Because of the All Yet-to-be-Written User Manuals. A Decade of Transformation. In Proceedings of the IWM Junior Visiting Fellows Conferences, Volume VIII/11, 1999; pp. 1–24. Available online: https://files.iwm.at/uploads/jc-08-111.pdf (accessed on 6 August 2023).
- Mohammed, M.; Swales, J. Factors affecting the successful reading of technical instructions. Autumn 1984, 2, 206–217. [Google Scholar]
- Tomlinson, G. Thought for food: A study of written instructions. Symb. Interact. 1986, 9, 201–216. [Google Scholar] [CrossRef]
- Mirel, B. Analyzing audiences for software manuals: A survey of instructional needs for “real world tasks”. Tech. Commun. Q. 1992, 1, 13–38. [Google Scholar] [CrossRef]
- Setchi, R.M.; Pham, D.T.; Dimov, S.S. A methodology for developing intelligent product manuals. Eng. Appl. Artif. Intell. 2006, 19, 657–669. [Google Scholar] [CrossRef]
- Branavan, S.; Silver, D.; Barzilay, R. Learning to win by reading manuals in a monte-carlo framework. J. Artif. Intell. Res. 2012, 43, 661–704. [Google Scholar] [CrossRef]
- Mason, L.; Scirica, F.; Salvi, L. Effects of beliefs about meaning construction and task instructions on interpretation of narrative text. Contemp. Educ. Psychol. 2006, 31, 411–437. [Google Scholar] [CrossRef]
- Miller, J.S.; Smith, B.L.; Newman, B.R.; Demetsky, M.J. Effective Use of Variable Message Signs: Lessons Learned Through Development of Users’ Manuals. In Transportation Research Record; Sage: Newcastle upon Tyne, UK, 1995; pp. 1–8. [Google Scholar]
- Robinson, E.J.; Robinson, W. Communication and metacommunication: Quality of children’s instructions in relation to judgments about the adequacy of instructions and the locus of responsibility for communication failure. J. Exp. Child Psychol. 1983, 36, 305–320. [Google Scholar] [CrossRef]
- Mallenius, S.; Rossi, M.; Tuunainen, V.K. Factors affecting the adoption and use of mobile devices and services by elderly people–results from a pilot study. In Proceedings of the 6th Annual Global Mobility Roundtable, Los Angeles, CA, USA, 1 June 2007; Volume 31, p. 12. [Google Scholar]
- Ishihara, T.; Kobayashi, M.; Takagi, H.; Asakawa, C. How unfamiliar words in smartphone manuals affect senior citizens. In Proceedings of the Universal Access in Human-Computer Interaction. Applications and Services for Quality of Life: 7th International Conference, UAHCI 2013, Held as Part of HCI International 2013, Las Vegas, NV, USA, 21–26 July 2013; Proceedings, Part III 7. Springer: Berlin/Heidelberg, Germany, 2013; pp. 636–642. [Google Scholar]
- Van Hees, M.M. User instructions for the elderly: What the literature tells us. J. Tech. Writ. Commun. 1996, 26, 521–536. [Google Scholar] [CrossRef]
- Nygård, L.; Starkhammar, S. The use of everyday technology by people with dementia living alone: Mapping out the difficulties. Aging Ment. Health 2007, 11, 144–155. [Google Scholar] [CrossRef]
- Tsai, W.C.; Rogers, W.A.; Lee, C.F. Older adults’ motivations, patterns, and improvised strategies of using product manuals. Int. J. Des. 2012, 6, 55–65. [Google Scholar]
- Atlas, M.A. The user edit: Making manuals easier to use. IEEE Trans. Prof. Commun. 1981, PC-24, 28–29. [Google Scholar] [CrossRef]
- Dontcheva-Navratilova, O.; Adam, M.; Povolná, R.; Vogel, R.; Povolná, R. Persuasion in technical discourse: The role of interpersonal metadiscourse markers in user manuals. In Persuasion in Specialised Discourses; Springer: Berlin/Heidelberg, Germany, 2020; pp. 229–262. [Google Scholar]
- Dale, E.; Chall, J.S. A formula for predicting readability: Instructions. Educ. Res. Bull. 1948, 27, 37–54. [Google Scholar]
- Lam, C. Applying the spatial-contiguity effect to software manuals. In Proceedings of the 2006 IEEE International Professional Communication Conference, Saratoga Springs, NY, USA, 23–25 October 2006; IEEE: New York, NY, USA, 2016; pp. 321–327. [Google Scholar]
- Pham, D.; Setchi, R. Adaptive product manuals. Proc. Inst. Mech. Eng. Part C J. Mech. Eng. Sci. 2000, 214, 1013–1018. [Google Scholar] [CrossRef]
- Lemmen, K.A.; Gillissen, W.J.; Boon, K.L. The direct use of already existing user manuals for computer aided instruction and information retrieval with the aid of hypermedia. In Proceedings of the Computer Assisted Learning: 3rd International Conference, ICCAL’90, Hagen, Germany, 11–13 June 1990; Proceedings 3. Springer: Berlin/Heidelberg, Germany, 1990; pp. 277–287. [Google Scholar]
- Holt, P. System documentation and system design: A good reason for designing the manual first. In Proceedings of the IEE Colloquium on Issues in Computer Support for Documentation and Manuals, London, UK, 1 October 1993; IET: Hertfordshire, UK, 1993; p. 1. [Google Scholar]
- Showers, L.S.; Celuch, K.G.; Lust, J.A. Consumers’ use of product owner manuals. Adv. Consum. Interest 1992, 4, 22–28. [Google Scholar]
- Gillihan, D.; Herrin, J.; Bishop, A. Evaluating product manuals for increased usability. Tech. Commun. 1988, 35, 168–172. [Google Scholar]
- Woolgar, S. Configuring the user: The case of usability trials. Sociol. Rev. 1990, 38, 58–99. [Google Scholar] [CrossRef]
- Chafin, R.L. User manuals: What does the user really need? In Proceedings of the 1st Annual International Conference on Systems Documentation, Carson, CA, USA, 22–23 January 1982; pp. 36–39. [Google Scholar]
- Herbert, J.; Attridge, C. A guide for developers and users of observation systems and manuals. Am. Educ. Res. J. 1975, 12, 1–20. [Google Scholar] [CrossRef]
- Alexander, K.P. The usability of print and online video instructions. Tech. Commun. Q. 2013, 22, 237–259. [Google Scholar] [CrossRef]
- Li, S.; Scalise, R.; Admoni, H.; Rosenthal, S.; Srinivasa, S.S. Spatial references and perspective in natural language instructions for collaborative manipulation. In Proceedings of the 2016 25th IEEE International Symposium on Robot and Human Interactive Communication (RO-MAN), New York, NY, USA, 26–31 August 2016; IEEE: New York, NY, USA, 2016; pp. 44–51. [Google Scholar]
- Pham, D.T.; Setchi, R.M.; Dimov, S.S. Enhanced product support through intelligent product manuals. Int. J. Syst. Sci. 2002, 33, 433–449. [Google Scholar] [CrossRef]
- Loorbach, N.; Steehouder, M.; Taal, E. The effects of motivational elements in user instructions. J. Bus. Tech. Commun. 2006, 20, 177–199. [Google Scholar] [CrossRef]
- Wiklund, M.E. Medical Device User Manuals: Shifting toward Computerization; CRC Press: Boca Raton, FL, USA, 2002. [Google Scholar]
- Morrow, D.G.; Weiner, M.; Steinley, D.; Young, J.; Murray, M.D. Patients’ health literacy and experience with instructions: Influence preferences for heart failure medication instructions. J. Aging Health 2007, 19, 575–593. [Google Scholar] [CrossRef]
- Bhutkar, G.; Rajhans, N.; Konkani, A.; Dhore, M. Usability issues of user manuals provided with medical devices. Br. J. Healthc. Comput. Inf. Manag. 2009. [Google Scholar]
- Koster, E.S.; Blom, L.; Winters, N.A.; Van Hulten, R.P.; Bouvy, M.L. Interpretation of drug label instructions: A study among four immigrants groups in the Netherlands. Int. J. Clin. Pharm. 2014, 36, 274–281. [Google Scholar] [CrossRef]
- Chuang, M.H.; Lin, C.L.; Wang, Y.F.; Cham, T.M. Development of pictographs depicting medication use instructions for low-literacy medical clinic ambulatory patients. J. Manag. Care Pharm. 2010, 16, 337–345. [Google Scholar] [CrossRef] [PubMed]
- Landreneau, R. I Need to Know! Timely Accessing of Perioperative User Manuals. AORN J. 2010, 92, 658–661. [Google Scholar] [CrossRef]
- Bowen, J.; Reeves, S. Modelling user manuals of modal medical devices and learning from the experience. In Proceedings of the 4th ACM SIGCHI Symposium on Engineering Interactive Computing Systems, Copenhagen, Denmark, 25–28 June 2012; pp. 121–130. [Google Scholar]
- Andrade, F.; Nascimento, L.; Wood, G.; Calil, S. Applying heuristic evaluation on medical devices user manuals. In Proceedings of the World Congress on Medical Physics and Biomedical Engineering, Toronto, ON, Canada, 7–12 June 2015; Springer: Berlin/Heidelberg, Germany, 2015; pp. 1515–1518. [Google Scholar]
- Lehoux, P.; Saint-Arnaud, J.; Richard, L. The use of technology at home: What patient manuals say and sell vs. what patients face and fear. Sociol. Health Illn. 2004, 26, 617–644. [Google Scholar] [CrossRef] [PubMed]
- García-Domene, M.; Luque, M.; Díez-Ajenjo, M.; de Fez, D.; Esteve-Taboada, J.; Hernández-Andrés, R.; Sanchis-Jurado, V. Practices with clinical devices through the development of audiovisual user manuals. In Proceedings of the EDULEARN21 Proceedings, Online, 5–6 July 2021; IATED: Valencia, Spain, 2021; pp. 2466–2469. [Google Scholar]
- Allwood, C.M.; Kalén, T. Evaluating and improving the usability of a user manual. Behav. Inf. Technol. 1997, 16, 43–57. [Google Scholar] [CrossRef]
- Warren, T.L. Cultural influences on technical manuals. J. Tech. Writ. Commun. 2002, 32, 111–123. [Google Scholar] [CrossRef]
- Webber, B.; Badler, N.; Di Eugenio, B.; Geib, C.; Levison, L.; Moore, M. Instructions, intentions and expectations. Artif. Intell. 1995, 73, 253–269. [Google Scholar] [CrossRef]
- Fukuoka, W.; Kojima, Y.; Spyridakis, J.H. Illustrations in user manuals: Preference and effectiveness with Japanese and American readers. Tech. Commun. 1999, 46, 167–176. [Google Scholar]
- Li, Q.; Karreman, J.; de Jong, M. Chinese Technical Communicators’ Opinions on Cultural Differences between Chinese and Western User Manuals. In Proceedings of the 2019 IEEE International Professional Communication Conference (ProComm), Aachen, Germany, 23–26 July 2019; IEEE: New York, NY, USA, 2019; pp. 30–36. [Google Scholar]
- Li, Q.; de Jong, M.D.; Karreman, J. Cultural differences between Chinese and Western user instructions: A content analysis of user manuals for household appliances. IEEE Trans. Prof. Commun. 2020, 63, 3–20. [Google Scholar] [CrossRef]
- Hambleton, R.K.; Merenda, P.F.; Spielberger, C.D. Issues, designs, and technical guidelines for adapting tests into multiple languages and cultures. In Adapting Educational and Psychological Tests for Cross-Cultural Assessment; Psychology Press: London, UK, 2004; pp. 15–50. [Google Scholar]
- Pedraz-Delhaes, A.; Aljukhadar, M.; Sénécal, S. The effects of document language quality on consumer perceptions and intentions. Can. J. Adm. Sci. Can. Sci. L’Adm. 2010, 27, 363–375. [Google Scholar] [CrossRef]
- Xu, Q.; Deng, L. Investigating the use of translation continuation tasks in commercial translation teaching: A study on translating user manuals. Chin. J. Appl. Linguist. 2021, 44, 366–381. [Google Scholar] [CrossRef]
- Gil, J.R.B.; Pym, A. Technology and translation (a pedagogical overview). In Translation Technology and Its Teaching; Intercultural Studies Group, Universitat Rovira i Virgili: Tarragona, Spain, 2006. [Google Scholar]
- Gök, O.; Ersoy, P.; Börühan, G. The effect of user manual quality on customer satisfaction: The mediating effect of perceived product quality. J. Prod. Brand Manag. 2019, 28, 475–488. [Google Scholar] [CrossRef]
- Gemoets, L.A.; Mahmood, M.A. Effect of the quality of user documentation on user satisfaction with information systems. Inf. Manag. 1990, 18, 47–54. [Google Scholar] [CrossRef]
- Smart, K.L.; Madrigal, J.; Seawright, K.K. The effect of documentation on customer perception of product quality. IEEE Trans. Prof. Commun. 1996, 39, 157–162. [Google Scholar] [CrossRef]
- Likert, R. A technique for the measurement of attitudes. Arch. Psychol. 1932, 22, 55. [Google Scholar]
- Guillemette, R.A. What readers mean by ‘good documentation’. Inf. Manag. 1990, 18, 69–77. [Google Scholar] [CrossRef]
- Schriver, K.A. Quality in document design: Issues and controversies. Tech. Commun. 1993, 40, 239–257. [Google Scholar]
- Mitchell, G.E. What do users really want from computer documentation? In Proceedings of the Professional Communication Conference The New Face of Technical Communication: People, Processes, Products’, Philadelphia, PA, USA, 5–8 October 1993; IEEE: New York, NY, USA, 1993; pp. 27–31. [Google Scholar]
- Smart, K.L.; DeTienne, K.B.; Whiting, M. Customers’ use of documentation: The enduring legacy of print. In Proceedings of the 16th Annual International Conference on Computer Documentation, Quebec, QC, Canada, 24–26 September 1998; pp. 23–28. [Google Scholar]
- Smart, K.L.; Whiting, M.E.; DeTienne, K.B. Assessing the need for printed and online documentation: A study of customer preference and use. J. Bus. Commun. (1973) 2001, 38, 285–314. [Google Scholar] [CrossRef]
- Mehlenbacher, B.; Wogalter, M.S.; Laughery, K.R. On the reading of product owner’s manuals: Perceptions and product complexity. In Proceedings of the Human Factors and Ergonomics Society Annual Meeting, Baltimore, MD, USA, 30 September–4 October 2002; SAGE Publications: Los Angeles, CA, USA, 2002; Volume 46, pp. 730–734. [Google Scholar]
- Vick, N.J. Formatting user manuals for use. In Proceedings of the 2nd Annual International Conference on Systems Documentation, Seattle, WA, USA, 28–30 April 1983; pp. 102–107. [Google Scholar]
- McKee, J.B. Computer user manuals in print: Do they have a future? In Proceedings of the 4th Annual International Conference on Systems Documentation, Ithaca, NY, USA, 18–21 June 1986; pp. 8–14. [Google Scholar]
- Seiden, P.; Sullivan, P. Designing user manuals for the online public access catalog. Libr. Hi Tech 1986, 4, 29–36. [Google Scholar] [CrossRef]
- Westendorp, P. Design concepts of user manuals. In Quality of technical Documentation; Brill: Leiden, The Netherlands, 1994; pp. 39–48. [Google Scholar]
- Narayanan, N.H.; Hegarty, M. On designing comprehensible interactive hypermedia manuals. Int. J. Hum.-Comput. Stud. 1998, 48, 267–301. [Google Scholar] [CrossRef]
- De Amicis, R.; Ceruti, A.; Francia, D.; Frizziero, L.; Simões, B. Augmented Reality for virtual user manual. Int. J. Interact. Des. Manuf. (IJIDeM) 2018, 12, 689–697. [Google Scholar] [CrossRef]
- Gellevij, M.; Van der Meij, H.; De Jong, T.; Pieters, J. The effects of screen captures in manuals: A textual and two visual manuals compared. IEEE Trans. Prof. Commun. 1999, 42, 77–91. [Google Scholar] [CrossRef]
- Herriman, J. Metadiscourse in English instruction manuals. Engl. Specif. Purp. 2022, 65, 120–132. [Google Scholar] [CrossRef]
- Pavel, N.; Zitkus, E. Extending product affordances to user manuals. In Proceedings of the 19th International Conference on Engineering and Product Design Education, Oslo, Norway, 7–8 September 2017; The Design Society: Copenhagen, Denmark, 2017. [Google Scholar]
- Kovačević, D.; Brozović, M.; Možina, K. Improving visual search in instruction manuals using pictograms. Ergonomics 2016, 59, 1405–1419. [Google Scholar] [CrossRef] [PubMed]
- van Loggem, B.; Lundin, J. Interaction with user documentation: A preliminary study. In Proceedings of the 2013 International Conference on Information Systems and Design of Communication, Lisbon, Portugal, 11–12 July 2013; pp. 41–46. [Google Scholar]
- van Loggem, B. ’Nobody reads the documentation’: True or not? In Proceedings of the ISIC: The Information Behaviour Conference, Leeds, UK, 2–5 September 2014.
- Møller, M.H. Usability testing of user manuals. Commun. Lang. Work 2013, 2, 51–59. [Google Scholar] [CrossRef]
- Glenberg, A.M.; Robertson, D.A. Indexical understanding of instructions. Discourse Process. 1999, 28, 1–26. [Google Scholar] [CrossRef]
- Ganier, F. Factors affecting the processing of procedural instructions: Implications for document design. IEEE Trans. Prof. Commun. 2004, 47, 15–26. [Google Scholar] [CrossRef]
- Oviedo-Trespalacios, O.; Tichon, J.; Briant, O. Is a flick-through enough? A content analysis of Advanced Driver Assistance Systems (ADAS) user manuals. PLoS ONE 2021, 16, e0252688. [Google Scholar] [CrossRef]
- Earle, R.H.; Rosso, M.A.; Alexander, K.E. User preferences of software documentation genres. In Proceedings of the 33rd Annual International Conference on the Design of Communication, Limerick, Ireland, 16–17 July 2015; pp. 1–10. [Google Scholar]
- Van Der Meij, H. A closer look at visual manuals. J. Tech. Writ. Commun. 1996, 26, 371–383. [Google Scholar] [CrossRef]
- Clarke, M.M.; Carroll, L. Human factors guidelines for writers of user manuals. In Proceedings of the Human Factors Society Annual Meeting, Norfolk, Virginia, 10–14 October 1983; SAGE Publications: Los Angeles, CA, USA, 1983; Volume 27, pp. 496–500. [Google Scholar]
- Weiss, E.H. Breaking the grip of user manuals. ACM SIGDOC Asterisk J. Comput. Doc. 1988, 14, 4–11. [Google Scholar] [CrossRef]
- Ummelen, N. The selection and use of procedural and declarative information in software manuals. J. Tech. Writ. Commun. 1996, 26, 475–488. [Google Scholar] [CrossRef]
- Ummelen, N. Declarative information in software manuals: What’s the use? In Proceedings of the 15th Annual International Conference on Computer Documentation, Salt Lake City, UT, USA, 19–22 October 1997; pp. 283–296. [Google Scholar]
- Karreman, J.; Ummelen, N.; Steehouder, M. Procedural and declarative information in user instructions: What we do and don’t know about these information types. In Proceedings of the IPCC 2005 Proceedings, International Professional Communication Conference, Limerick, Ireland, 10–13 July 2005; IEEE: New York, NY, USA, 2005; pp. 328–333. [Google Scholar]
- Shachak, A.; Dow, R.; Barnsley, J.; Tu, K.; Domb, S.; Jadad, A.R.; Lemieux-Charles, L. User manuals for a primary care electronic medical record system: A mixed-methods study of user-and vendor-generated documents. IEEE Trans. Prof. Commun. 2013, 56, 194–209. [Google Scholar] [CrossRef] [PubMed]
- Bédard, Y.; Devillers, R.; Gervais, M.; Jeansoulin, R. Towards multidimensional user manuals for geospatial datasets: Legal issues and their considerations into the design of a technological solution. Proc. ISSDQ 2004, 4, 183–195. [Google Scholar]
- Devillers, R.; Gervais, M.; Bédard, Y.; Jeansoulin, R. Spatial data quality: From metadata to quality indicators and contextual end-user manual. In Proceedings of the OEEPE/ISPRS Joint Workshop on Spatial Data Quality Management, Istanbul, Turkey, 21–22 March 2002; pp. 21–22. [Google Scholar]
- Hoffmann, T.; English, T.; Glasziou, P. Reporting of interventions in randomised trials: An audit of journal instructions to authors. Trials 2014, 15, 1–6. [Google Scholar] [CrossRef] [PubMed]
- Schriger, D.L.; Arora, S.; Altman, D.G. The content of medical journal instructions for authors. Ann. Emerg. Med. 2006, 48, 743–749. [Google Scholar] [CrossRef] [PubMed]
- Hamouda, T.; Kafafy, H.; Mashaly, H.; Aly, N.M. Breathability performance of antiviral cloth masks treated with silver nanoparticles for protection against COVID-19. J. Ind. Text. 2022, 51, 1494–1523. [Google Scholar] [CrossRef] [PubMed]
- Liu, C.; Li, G.; He, Y.; Zhang, Z.; Ding, Y. Effects of wearing masks on human health and comfort during the COVID-19 pandemic. In IOP Conference Series: Earth and Environmental Science; IOP Publishing: Bristol, UK, 2020; Volume 531. [Google Scholar]


| Comparison | Overall | Regular Users | Professional Users | Technical Writers |
|---|---|---|---|---|
| Q1 | ||||
| Positive/Neutral | 0.99 | 0.77 | 0.97 | 0.51 |
| Positive/Negative | 0.38 | 0.01 | 0.88 | 0.02 |
| Neutral/Negative | 0.41 | 0.03 | 0.65 | 0.7 |
| Q2 | ||||
| Positive/Neutral | 0.99 | 0.77 | 0.95 | 0.97 |
| Positive/Negative | 0.43 | 0.05 | 0.32 | 0.62 |
| Neutral/Negative | 0.48 | 0.13 | 0.41 | 0.45 |
| Q3 | ||||
| Positive/Neutral | 0.99 | 0.76 | 0.93 | 0.61 |
| Positive/Negative | 0.9 | 0.12 | 0.29 | 0.98 |
| Neutral/Negative | 0.97 | 0.62 | 0.38 | 0.51 |
| Comparison | Overall | Regular Users | Professional Users | Technical Writers |
|---|---|---|---|---|
| Q1 | ||||
| Less complex/ More complex | 0.91 | 0.12 | 0.86 | 0.83 |
| Q2 | ||||
| Less complex/ More complex | 0.76 | 0.05 | 0.74 | 0.07 |
| Q3 | ||||
| Less complex/ More complex | 0.77 | 0.02 | 0.31 | 0.86 |
| Comparison | Overall | Regular Users | Professional Users | Technical Writers |
|---|---|---|---|---|
| Q1 | ||||
| General-purpose/ Dedicated | 0.94 | 0.32 | 0.76 | 0.74 |
| Q2 | ||||
| General-purpose/ Dedicated | 0.92 | 0.46 | 0.19 | 0.87 |
| Q3 | ||||
| General-purpose/ Dedicated | 0.99 | 0.8 | 0.63 | 0.15 |
| Comparison | Overall | Regular Users | Professional Users | Technical Writers |
|---|---|---|---|---|
| Q1 | ||||
| <100/100–200 | 0.99 | 0.83 | 0.93 | 0.95 |
| <100/>200 | 0.91 | 0.73 | 0.43 | 0.51 |
| 100–200/>200 | 0.98 | 0.91 | 0.67 | 0.5 |
| Q2 | ||||
| <100/100–200 | 0.99 | 0.98 | 0.81 | 0.99 |
| <100/>200 | 0.98 | 0.96 | 0.57 | 0.99 |
| 100–200/>200 | 0.99 | 0.98 | 0.81 | 0.99 |
| Q3 | ||||
| <100/100–200 | 0.81 | 0.83 | 0.52 | 0.71 |
| <100/>200 | 0.92 | 0.71 | 0.83 | 0.95 |
| 100–200/>200 | 0.81 | 0.83 | 0.52 | 0.71 |
Disclaimer/Publisher’s Note: The statements, opinions and data contained in all publications are solely those of the individual author(s) and contributor(s) and not of MDPI and/or the editor(s). MDPI and/or the editor(s) disclaim responsibility for any injury to people or property resulting from any ideas, methods, instructions or products referred to in the content. |
© 2023 by the authors. Licensee MDPI, Basel, Switzerland. This article is an open access article distributed under the terms and conditions of the Creative Commons Attribution (CC BY) license (https://creativecommons.org/licenses/by/4.0/).
Share and Cite
Simon, A.; Qiu, X.; Selmeczi-Kovacs, N.; Feher, I.; Alexi, G.; Kara, P.A. Influence Factors on User Manual Engagement in the Context of Smart Wearable Devices. Electronics 2023, 12, 3539. https://doi.org/10.3390/electronics12173539
Simon A, Qiu X, Selmeczi-Kovacs N, Feher I, Alexi G, Kara PA. Influence Factors on User Manual Engagement in the Context of Smart Wearable Devices. Electronics. 2023; 12(17):3539. https://doi.org/10.3390/electronics12173539
Chicago/Turabian StyleSimon, Aniko, Xinyu Qiu, Nikolett Selmeczi-Kovacs, Ildiko Feher, Gabriella Alexi, and Peter A. Kara. 2023. "Influence Factors on User Manual Engagement in the Context of Smart Wearable Devices" Electronics 12, no. 17: 3539. https://doi.org/10.3390/electronics12173539
APA StyleSimon, A., Qiu, X., Selmeczi-Kovacs, N., Feher, I., Alexi, G., & Kara, P. A. (2023). Influence Factors on User Manual Engagement in the Context of Smart Wearable Devices. Electronics, 12(17), 3539. https://doi.org/10.3390/electronics12173539