Article

Adaptive Absolute Attitude Determination Algorithm for a Fine Guidance Sensor

1
Shanghai Institute of Technical Physics, Chinese Academy of Sciences, Shanghai 200083, China
2
School of Electronic, Electrical and Communication Engineering, University of Chinese Academy of Sciences, Beijing 100049, China
3
Key Laboratory of Infrared System Detection and Imaging, Chinese Academy of Sciences, Shanghai 200083, China
*
Authors to whom correspondence should be addressed.
Electronics 2023, 12(16), 3437; https://doi.org/10.3390/electronics12163437
Submission received: 13 July 2023 / Revised: 8 August 2023 / Accepted: 10 August 2023 / Published: 14 August 2023

Abstract

:
In order to ensure the attitude determination accuracy and speed of a fine guidance sensor (FGS) in a space telescope with limited onboard hardware computing resources, an adaptive absolute attitude determination algorithm was proposed. The more stars involved in the attitude determination, the higher the attitude accuracy, but more hardware resources will be consumed. By analyzing the relationship between the attitude determination accuracy and the number of stars (NOS) in the field of view (FOV), and the relationship between the detector exposure time and the NOS, an adaptive method of adjusting the NOS in the FOV was proposed to keep the number of observed stars in the FOV of the detector at a target value. The star map recognition algorithm based on improved log-polar transformation has a higher recognition speed than the traditional algorithm but cannot accurately identify and match the corresponding guide star when the number of observed stars is less than the number of guide stars. Thus, a comparison-AND star identification algorithm based on polar coordinates was proposed. In the case of a given line-of-sight pointing and 100-frame image simulation calculation, the root mean square (RMS) value of the line-of-sight pointing error was less than 37 mas in the direction of a right ascension, and less than 25 mas in the direction of declination, as concluded from the experimental simulation.

1. Introduction

Large-scale sky surveys and deep space observation are the focus of international astronomy research, greatly promoting the development of astronomy and physics [1]. The Chinese Survey Space Telescope (CSST), which is expected to be put into scientific operation around 2024, is anticipated to provide mankind with new knowledge about distant galaxies, mysterious dark matter, dark energy, and the past and future evolution of the universe [2,3,4]. The CSST needs to detect the line-of-sight (LOS) pointing through a fine guidance sensor (FGS), perform star acquisition and identification in the field of view (FOV), and conduct attitude determination to provide fine pointing information to control the telescope [5].
For missions with sub-arcsecond-level or higher attitude accuracy, special hardware and software are needed for spacecraft attitude determination and control [6]. International space observation platforms that use FGSs to provide high-precision pointing for spacecraft have been launched or are being developed, including the Hubble Space Telescope (HST), the Spitzer Space Telescope (SST), the James Webb Space Telescope (JWST), and the Euclid Telescope (Euclid) [7,8,9,10].
The HST was launched in 1990. It is loaded with three FGSs with a measurement accuracy of 0.3 /s, which are mainly used to verify the accuracy of the HST’s high-precision pointing and measure target objects [11,12]. Two of them are used to point and lock onto the telescope’s target, and the third is used for astrometry, or precisely measuring the position of stars [13]. The FGSs can provide the HST with 2 milliarcseconds (mas) of pointing stability [14].
The SST was launched in 2003, and its pointing control is determined using a star sensor, a pointing control reference sensor (PCRS), and a gyroscope. Its pointing accuracy is 2.34 (1 σ ), and its pointing stability is 0.06 over 200 s [15]. It images stars through a star sensor, uses pattern recognition to determine the attitude of the star sensor relative to the specified inertial frame, and determines its attitude according to the orientation of the telescope relative to the star sensor [16]. The PCRS, as an FGS of the observation platform, provides the alignment datum between the telescope’s LOS and the external spacecraft attitude determination system [17]. By accurately measuring the position of known guide stars, it corrects the measurements of the star sensors and gyroscopes to obtain the actual pointing of the telescope [18,19].
The JWST was launched in 2021 and meets strict pointing requirements by introducing the fine guidance control system (FGCS). The FGCS includes an FGS and a fine steering mirror (FSM), using the FGS as a sensor and the FSM as an actuator [20]. The FGS extracts the position of the star observed in the FOV by obtaining the full-frame image, identifying it with the guide star catalog using the pattern-matching algorithm, measuring its position, supplying the data to the attitude control subsystem (ACS) of the JWST for attitude determination, and providing accurate pointing data for the ACS to achieve attitude stability [9,21,22]. The pointing accuracy of each axis is 6.5 (1 σ ) when the FGS is not working, and the pointing stability is 0.007 when the FGS is working [20,23].
Euclid was launched in 2023. It achieves extremely accurate pointing performance by installing a high-precision FGS on the main focal plane of the telescope [24,25]. Within 585 s, the relative attitude measurement accuracy is higher than 0.03 (3 σ ) on the X and Y axes, and higher than 2.1 (3 σ ) on the Z axis. The absolute attitude measurement accuracy is higher than 0.6 (3 σ ) on the X and Y axes, and higher than 8.7 (3 σ ) on the Z axis. The FGS of Euclid consists of four detectors, which are used when at least three stars are present in the detector. Where available, the relative or absolute attitude can be calculated in the detector reference frame. Stars detected by two of the four available detectors are used for attitude determination, with identification and matching performed according to the TRIAD algorithm. The q method is used to calculate the attitude quaternion [10,26].
Current star identification algorithms can be divided into subgraph isomorphism algorithms, star pattern recognition algorithms, and deep learning algorithms. Subgraph isomorphism algorithms mainly include polygon algorithms and matched group algorithms, among which the triangle algorithm is the most typical. Compared with other algorithms, the number of stars involved in constructing the features of this kind of algorithm is lower, but the database needs a large storage space, and it faces the problem of matching redundancy [27,28]. The deep learning algorithm eliminates a database search, and the search time is not affected by the number of patterns stored in the network. However, model training requires a large amount of storage space [29,30,31]. Compared with the subgraph isomorphism and deep learning algorithms, the star pattern recognition algorithm requires less storage space.
Attitude determination algorithms can be divided into two categories: static and stochastic algorithms. From the existing attitude determination algorithms, four commonly used algorithms for real-time implementation in previous tasks [6] include two static algorithms, namely the quaternion estimator (QUEST) [32] and triaxial attitude determination (TRIAD) [33,34]. Nonlinear observers [15,35] and the multiplicative extended Kalman filter (MEKF) [36] are nonlinear stochastic algorithms. THe HST and SST adopt stochastic observers for attitude determination [15,35]. The JWST uses the Kalman filter to determine the attitude [6].
In the CSST, the FGS is needed to provide accurate pointing information for the telescope. The flowchart shown in Figure 1 includes the image acquisition, centroid extraction, star identification, and attitude determination. Image acquisition and star identification were the main focuses of this work.
In order to ensure the absolute attitude determination accuracy of the FGS and considering the limited computing resources of the hardware on board, an adaptive absolute attitude determination algorithm for the FGS was proposed. As presented in Section 2, an adaptive adjustment method for the number of stars (NOS) in the FOV of the FGS was proposed. Based on the analysis of the relationship between the NOS in the FOV of the detector and the attitude accuracy, a polynomial model was established which takes information on the right ascension and declination of the direction of the LOS as the input and exposure time of the detector required by the number of target stars in the FOV of the detector as the output. The beetle swarm optimization algorithm was used to identify the model parameters, and the closed-loop feedback adjustment method was introduced to adjust the NOS in the detector’s FOV to further ensure that it was kept at a constant value. In Section 3, the calculation of the absolute attitude is described, including centroid extraction, star identification, and attitude determination. In the star identification part, a comparison-AND star identification algorithm based on polar coordinates was proposed (see Section 3.2 for details). In Section 4, the simulation and performance analysis of the algorithm are presented, and Section 5 draws the conclusions.

2. FGS Image Acquisition

An FGS is a measuring instrument that outputs the triaxial attitude of a space telescope. Its measuring accuracy directly affects the pointing accuracy of the space telescope’s LOS. Due to the uneven distribution of stars across the whole celestial sphere, the star magnitude and distribution density in different sky regions vary, resulting in great differences in the number of detected stars when the FGS is operating in an orbit, which further affects the calculation speed and attitude accuracy. To keep the NOS in the FOV of the FGS at a constant value, an adaptive method of adjusting this parameter was proposed.

2.1. The Relationship between the NOS and the Attitude Accuracy of an FGS

The attitude accuracy of an FGS is mainly related to the FOV, detector size, centroid positioning accuracy, and NOS in the FOV. The attitude accuracy can be estimated by Equations (1) and (2) [37,38].
E pitch = E yaw = A FOV · E centroid N pix · N star
E roll = arctan E centroid 0.3825 · N pix · 1 N star
where E pitch and E yaw are the attitude measurement accuracy in the pitch and yaw directions, respectively; E roll is the attitude measurement accuracy in the roll direction; A FOV is the FOV of the FGS; E centroid is the centroid positioning accuracy; N pix is the pixel number of the detector; and N star is the NOS in the FOV.
When A FOV = 0.5 , E centroid = 0.1 , and N pix = 2048 , the relationship between the NOS in the FOV and the attitude accuracy is shown in Figure 2. The roll accuracy is less accurate than the pitch/yaw accuracy. The reason for this is that the dimensions of the focal length are larger than the focal plane itself [37]. From the figure, it can be seen that with more stars included in the calculation, the attitude accuracy of the FGS is higher, but more hardware resources will be consumed in star identification and attitude determination. Therefore, it is necessary to analyze the relationship between the exposure time of the detector and the NOS and adjust the exposure time to keep the NOS at the target number that satisfies the attitude accuracy.

2.2. The Relationship between the Exposure Time of an FGS and the NOS Detected

The stars detected by the FGS can be regarded as point light sources because the positioning accuracy of a single pixel cannot meet the requirements of the attitude measurement [39]. To improve the positioning accuracy of star points, they are usually dispersed as 3 pixel × 3 pixel or 5 pixel × 5 pixel star spots by defocusing. The grayscale distribution of the star image can be approximated by the two-dimensional Gaussian distribution function [39]:
f i x , y = 1 2 π σ exp x X ¯ i + y Y ¯ i 2 σ 2
Usually, it can be treated as blackbody radiation when analyzing the thermal radiation of the stars. The irradiance of stars with an apparent magnitude of m is [40]
E m = E 0 × 2.512 m
where E 0 = 2.96 × 10 8 W / m 2 is the irradiance of a star with a magnitude of 0. The magnitude (mag) is used to represent the brightness of the star. The lower the magnitude, the brighter the star; and the higher the magnitude, the darker the star.
The star radiation flux received by the CMOS detector is [40]
Φ = τ × E m × π 4 D 2
where τ is the transmittance of the optical system, and D is the aperture of the optical system.
The number of photons received by the CMOS detector within exposure time t is [40]
N ph = Φ × t × 1 E ph
E ph = h c λ
where h is Planck’s constant, c is the speed of light, and λ is the wavelength.
The number of electrons received by the CMOS detector within exposure time t is [40]
N e = Φ × t × 1 E ph × Q E = τ × E 0 × 2.512 m × π × D 2 × t × λ × Q E 4 × h c
where QE is the quantum efficiency of the detector.
The digital number (DN) value of the image acquired by the detector within exposure time t is
D N = N e × G gain × B depth × 1 F W e = τ × E 0 × 2.512 m × π × D 2 × t × λ × Q E × G gain × B depth 4 × h c × F W e
where G gain is the detector gain, B depth is the pixel depth, and F W e is the full-well charge number.
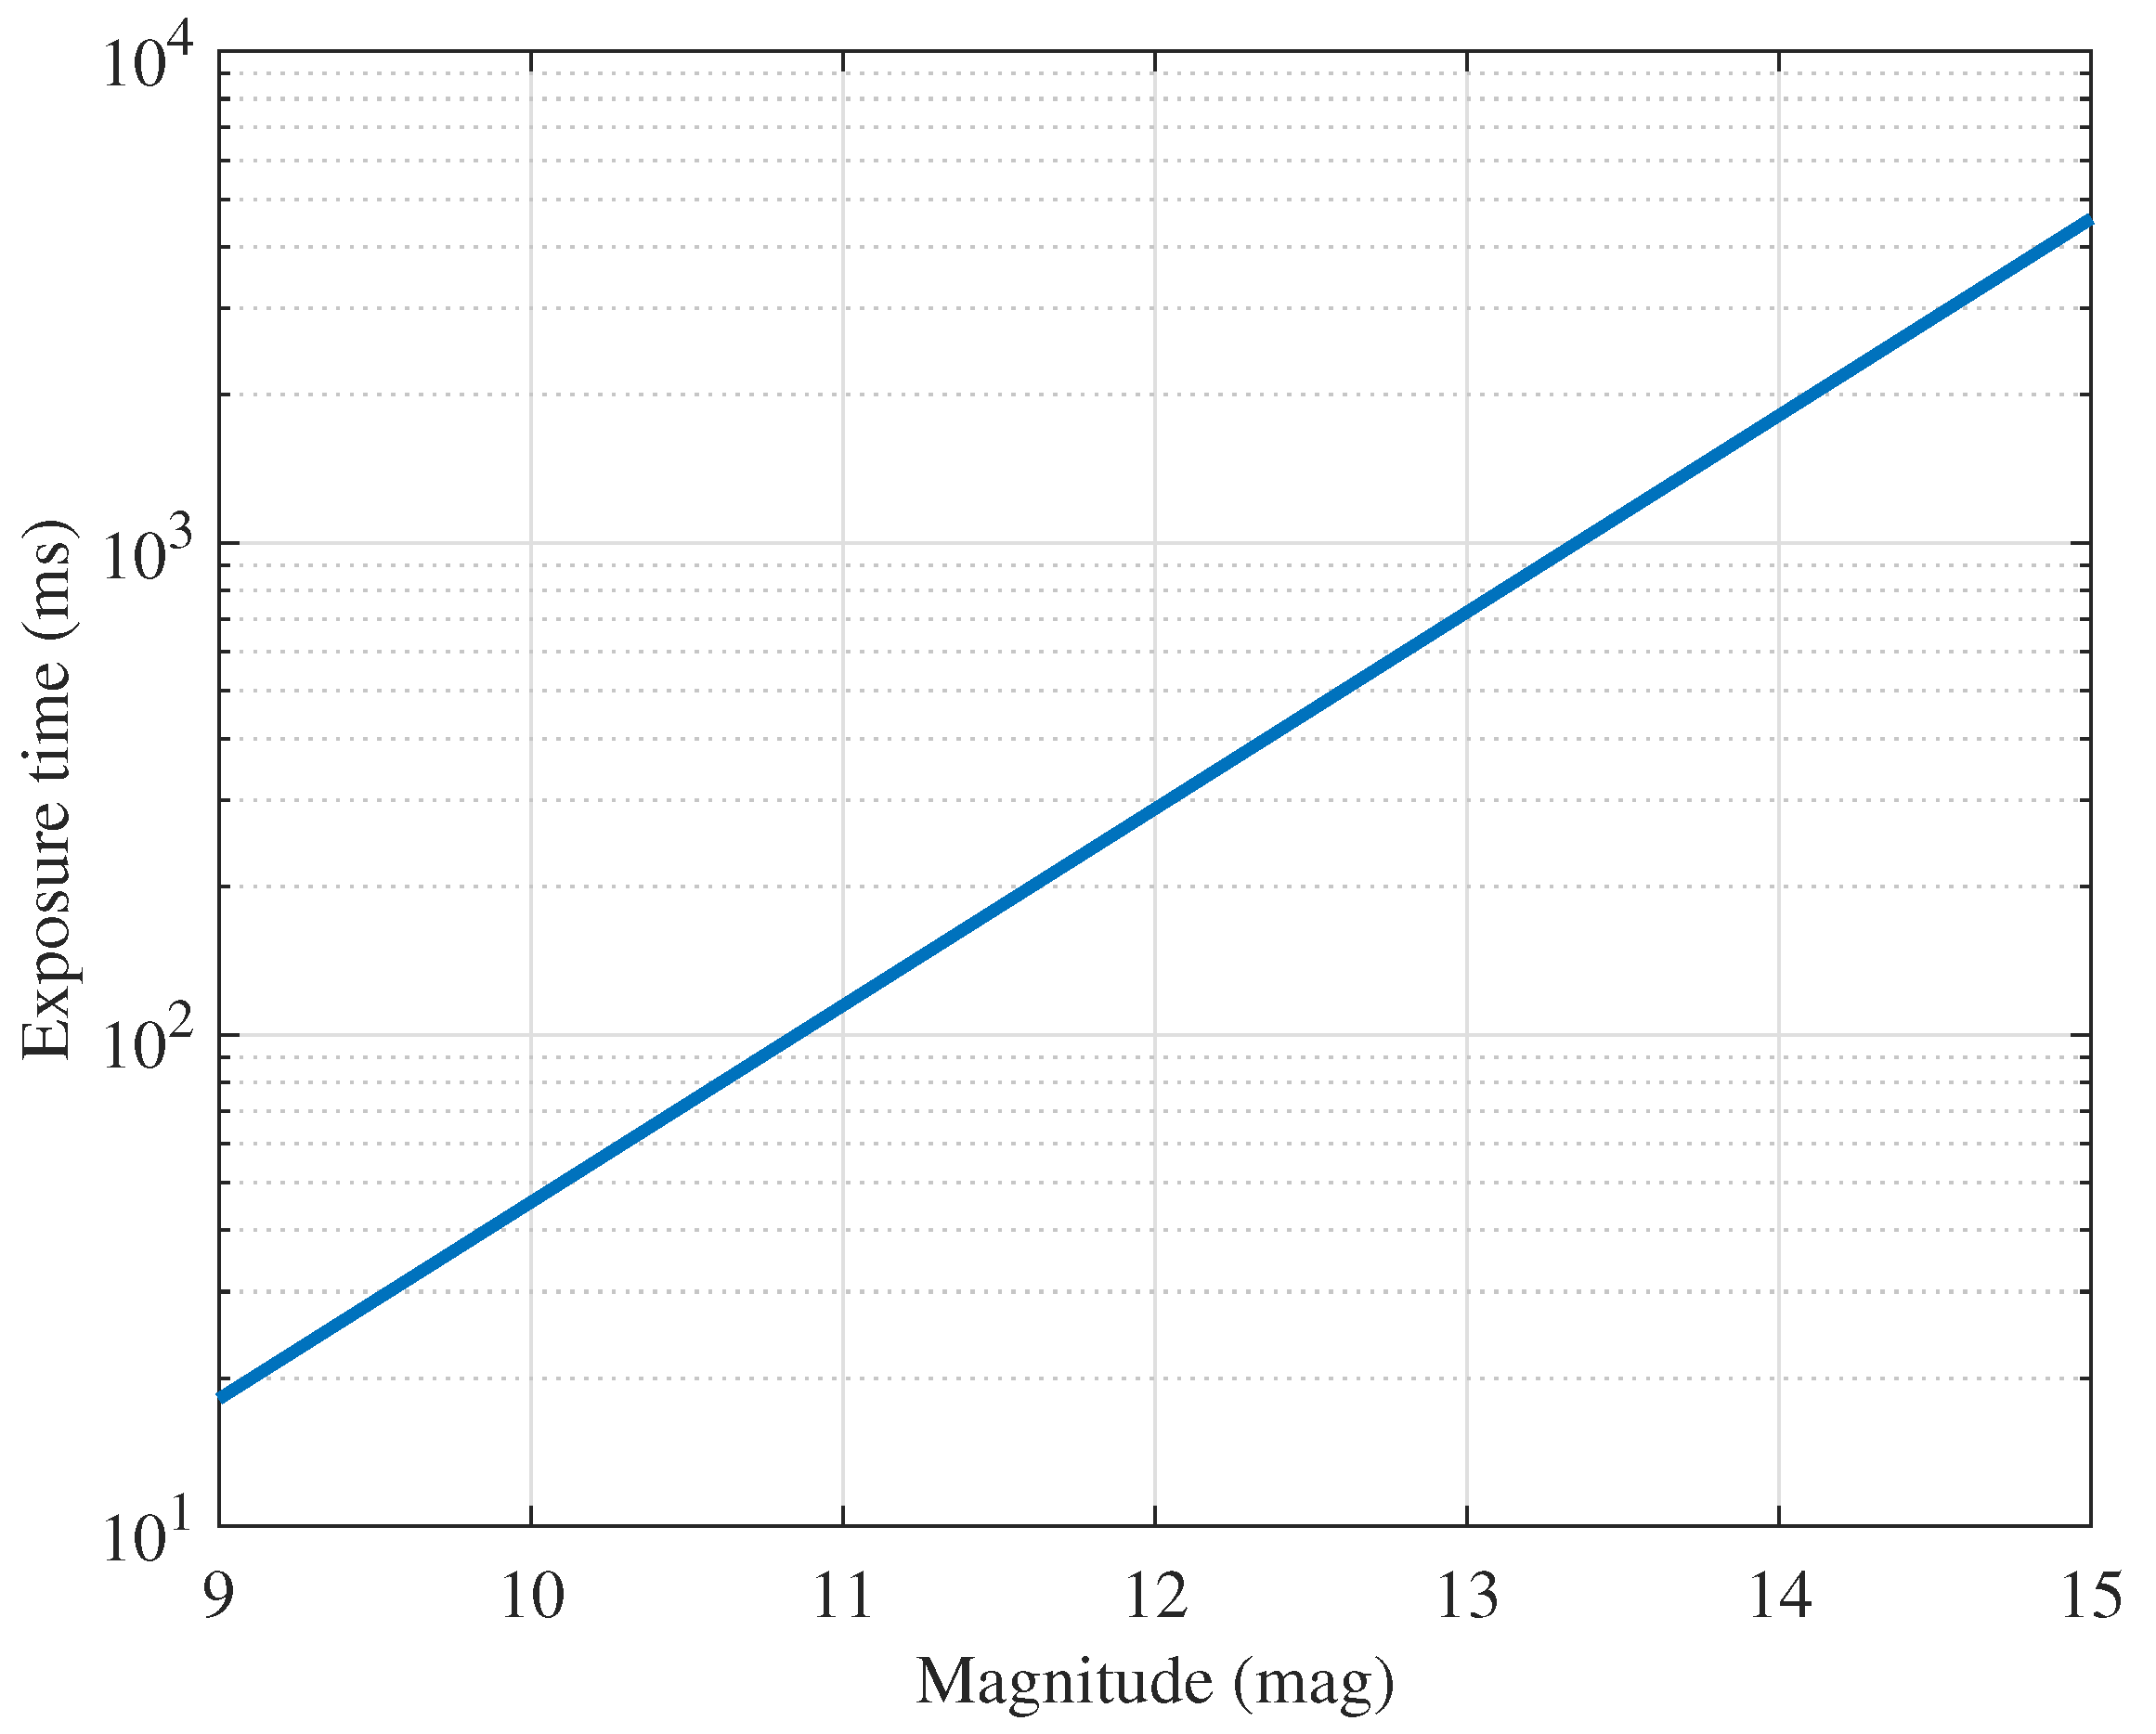
When D = 161.25 mm, τ = 0.85 , Q E = 0.6 , λ = 550 nm, and the magnitude range is 9–15, the exposure time corresponding to the 95% full-well DN value of the stars in the magnitude range is shown in Figure 3. From the figure, it can be concluded that as the exposure time increases, the stars of low magnitude will gradually become saturated.
It was assumed that the FOV of the FGS is 0.5 × 0.5 ; the detector size is 2048 × 2048 ; the LOS direction is 6.5 declination, 44 right ascension; and the magnitude range is 9–15. The range of the right ascension and declination corresponding to the FOV in the celestial coordinate system was calculated. The stars of 9–15 mag in this range were obtained from the GaiaDR2 star catalog, and the position coordinates of the stars in the celestial coordinate system were converted to focal-plane coordinates through the rotation transformation matrix and underwent perspective projection transformation from the celestial coordinate system to the FGS coordinate system. Moreover, the position of the stars on the focal plane was obtained. Then, according to Equations (3) and (9), the gray distribution of the star points on the focal plane was calculated, and a simulated star map, as shown in Figure 4a, was obtained. In this FOV, the NOS detected in the FOV was calculated by adjusting the exposure time, and the result is shown in Figure 4b. As the exposure time increased, the NOS detected in the FOV increased.

2.3. An Adaptive Adjustment Algorithm for the NOS in the FOV of the FGS

We needed to adaptively adjust the NOS in the detector FOV according to the observation conditions in different sky regions to keep the NOS in the FOV at a constant value, thus ensuring the attitude accuracy of the FGS with limited hardware computing resources; thus, an adaptive adjustment algorithm for the NOS in the FOV was proposed.
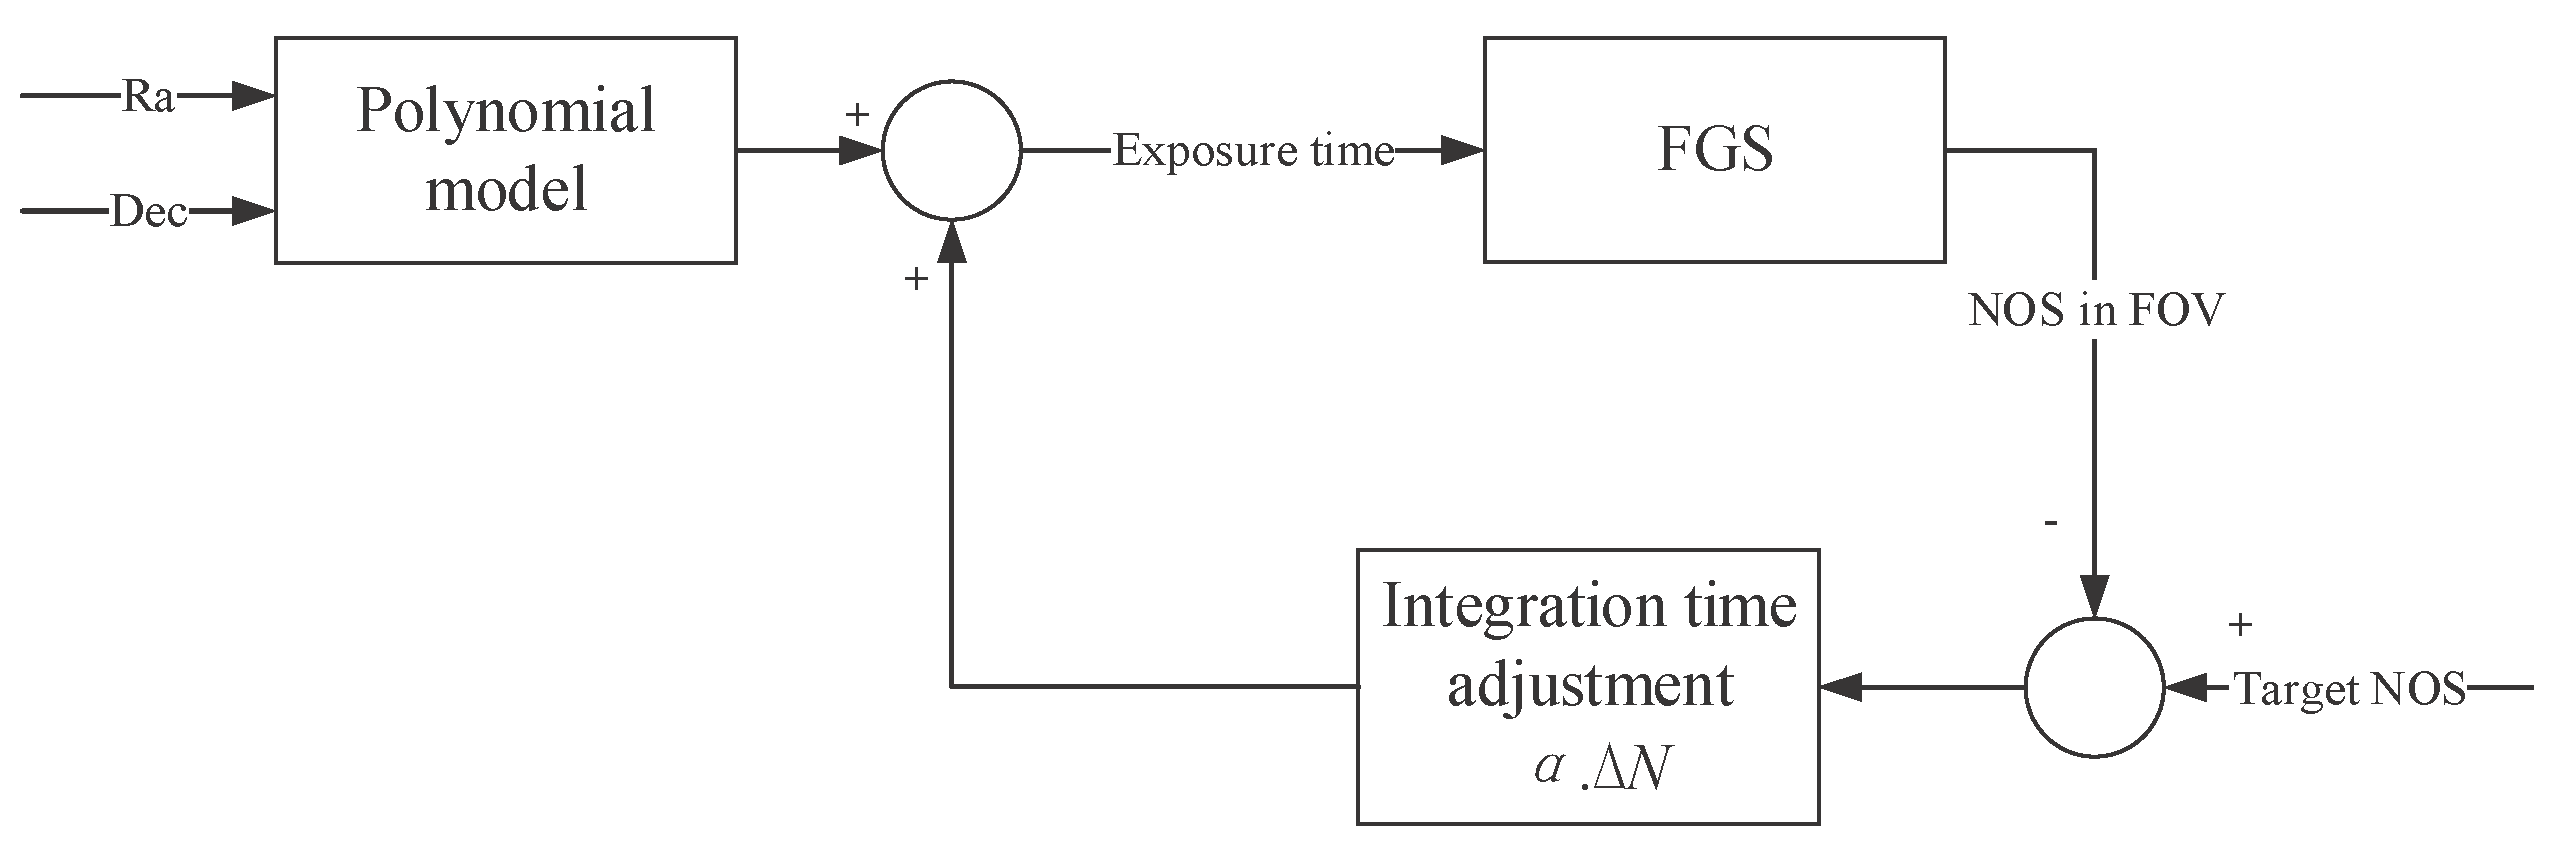
The algorithm model for the adaptive adjustment of the NOS in the FOV is shown in Figure 5. According to the right ascension and declination pointing information for the LOS of an FGS and the corresponding detector exposure time data required to reach the target star number in the FOV of the detector, a polynomial model was established, and the beetle swarm optimization algorithm (BSO) [41], which can quickly and accurately obtain a global optimal solution, was used to identify the model parameters. In view of the uncertainty of the polynomial model and the influence of various noises in the actual working process of the FGS, a closed-loop feedback adjustment method was introduced to further ensure that the NOS in the FOV of the FGS could meet the attitude determination requirement.
A polynomial model was constructed by taking the pointing of the LOS to the right ascension and declination as the input variable and the exposure time required for detecting the number of target stars in the FOV as the output variable.
t d , r = i = 0 m j = 0 m i x i j d i r j
where x i j is the undetermined coefficient, d represents declination, r represents right ascension, and t represents exposure time.
The BSO was used to fit the polynomial parameters. The core problem of the optimization algorithm is to minimize the objective function
F = t t 2 N
where F is the root mean square error between the model output exposure time and the actual exposure time, N is the number of data samples, and t is the exposure time.
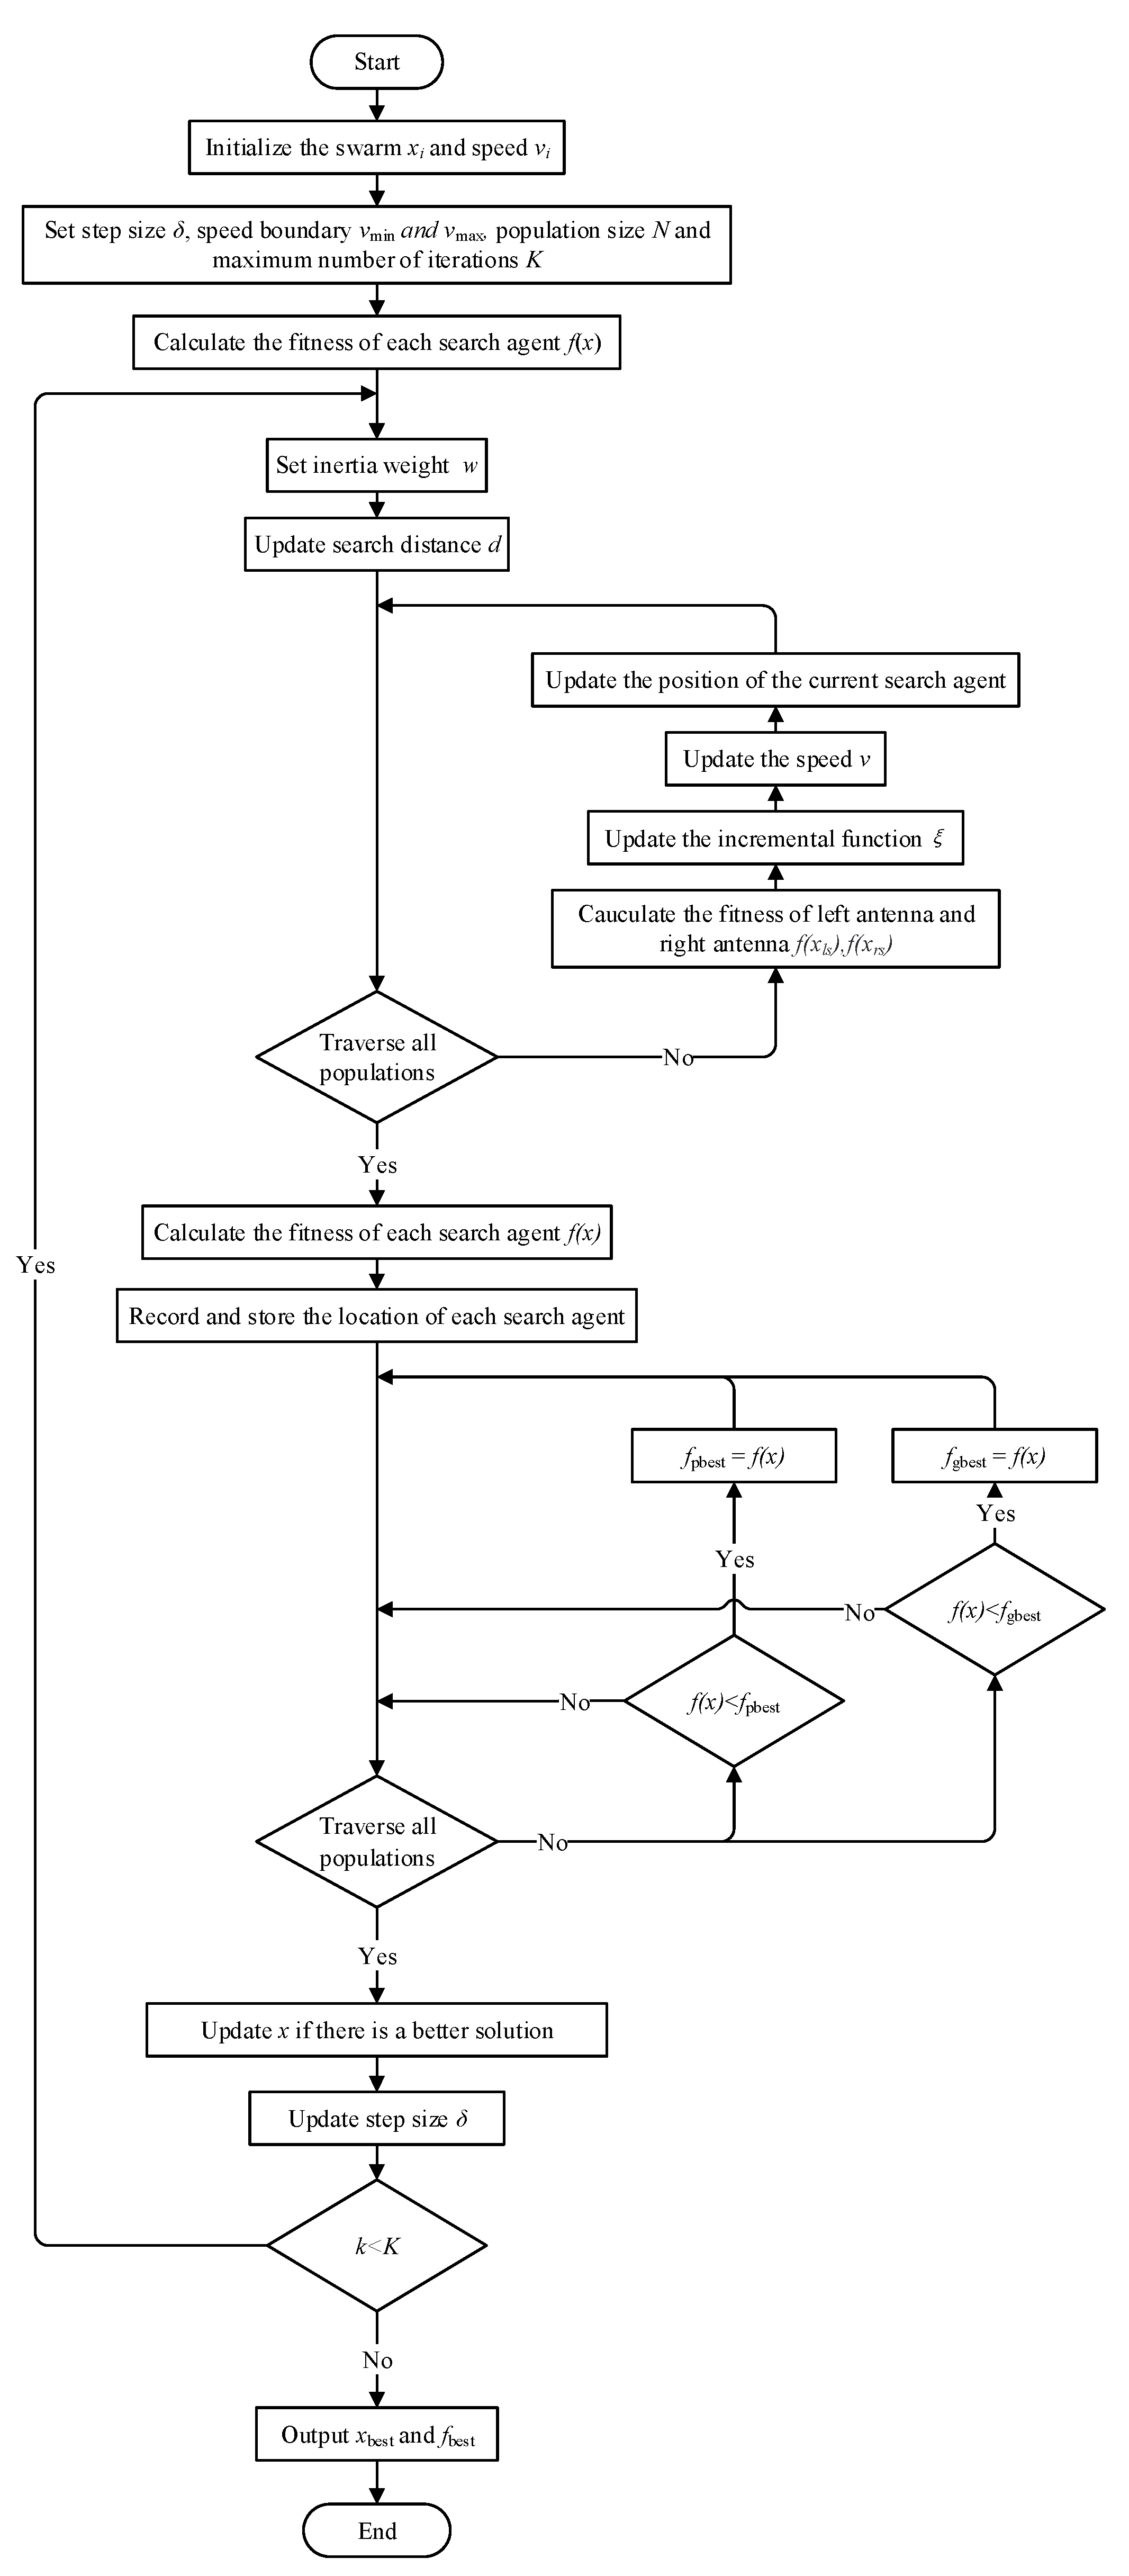
The flowchart of the BSO is shown in Figure 6. Firstly, a group of random solutions are initialized. Then at each iteration, the search agent updates its position based on its search mechanism and the best solution currently available. Finally, the optimal solution x b e s t is obtained after K iterations.

3. Absolute Attitude Determination of an FGS

The absolute attitude determination of an FGS mainly consists in obtaining the transformation matrix between the FGS coordinate system and the celestial coordinate system and determining the attitude of the LOS of the FGS in the celestial coordinate system. The whole calculation process involves multi-star centroid extraction, star identification, and attitude determination.

3.1. Multi-Star Centroid Extraction

Multi-star centroid extraction consists in star map preprocessing, multi-connected domain segmentation, and centroid positioning.

3.1.1. Star Map Preprocessing

Star map preprocessing mainly includes star map denoising and threshold segmentation. Low-pass filter templates 3 × 3 or 5 × 5 can be used for common denoising processes, such as the domain average template and Gaussian template [39]. In this paper, a 5 × 5 Gaussian template was used for denoising.
Threshold segmentation uses a streaming dynamic threshold segmentation algorithm [42], which is divided into row and sliding thresholds, as shown in Equations (12)–(14).
t h row = x g x , y 1 / n row
t h mov = 7 8 t h row + 1 8 g x , y
t h = t h row , t h row t h mov t h mov , t h row < t h mov
where g ( x , y ) represents the gray value of the filtered pixel; t h row is the mean value of all pixels in the previous row of the target pixel, with each row of pixels updated once; and t h mov is the average sliding value of all pixels before the target pixel, with each pixel updated once. The initial value is the average sliding value of all pixels in the first ten rows, respectively, and the weighting coefficient is the empirical value.

3.1.2. Multi-Connected Domain Segmentation

The shape of the star point target used for attitude determination is relatively simple. After threshold segmentation to obtain binary images, a one-scan labeling method of a 2 × 3 neighborhood can be adopted [43]. When the scanned pixel x value is not 0, the area count of the connected domain is increased by one, and the maximum and minimum values of the horizontal and vertical coordinates of the current connected domain are compared and recorded. When the whole image is scanned once, the connected domains with too small an area and a DN value greater than 95% of the full well are eliminated according to the equivalence table star area. According to the horizontal and vertical coordinate distribution of the connected domain, the pre-opening window provides the interception range of star points for centroid extraction.

3.1.3. Centroid Positioning

The centroid method was used to calculate the centroid of each connected domain, and the coordinates of star points (X, Y) were obtained [39].
X = x = 1 m y = 1 n F ( x , y ) x x = 1 m y = 1 n F ( x , y ) Y = x = 1 m y = 1 n F ( x , y ) y x = 1 m y = 1 n F ( x , y )
where F ( x , y ) represents the DN value of the pixel, x is the X coordinate value, and y is the Y coordinate value.

3.2. Star Identification

Star identification aims to identify the stars in the FOV by matching the stars in the current FOV of the FGS with the guide stars in the guide star catalog. According to the actual situation, to reduce the time taken for star identification as much as possible, a comparison-AND star identification algorithm based on polar coordinates was proposed, which included coordinate transformation, feature construction, and matching and recognition.

3.2.1. Coordinate Transformation

As shown in Figure 7, when the star map is rotated, the star point will change in the angular axis of the polar coordinate system, but its position on the distance axis will not change [28]. Based on this characteristic, the star points in the star map should be mapped from the plane Cartesian coordinates to the polar coordinate system.
The position of the star point should be set in the plane Cartesian coordinate system ( X i , Y i ) , a star selected as the main star, the position of the main star ( X o , Y o ) taken as the new origin, and the position of the star point ( X i , Y i ) , i = 1 , 2 , , N calculated in the new Cartesian coordinate system [28].
X i Y i = X i Y i X o Y o i = 1 , 2 , , N
where N represents the number of stars.
Through the formula of the Cartesian coordinate system against the polar coordinate system, the position of the star point r i , θ i , i = 1 , 2 , , N in the polar coordinate system can be obtained [28].
r i = X i 2 + Y i 2 θ i = arctan 2 Y i , X i i = 1 , 2 , , N
At this point, the calculated r i unit is the pixel, which needs to be converted into the corresponding angular distance.
d i = r i × F O V w P i x H i = 1 , 2 , , N
where FOVw represents the field angle of the detector in the horizontal direction, and PixH represents the number of pixels in the horizontal direction.

3.2.2. Feature Construction

The star point closest to the center on the focal plane is selected as the main star, so that the feature vector contains more star points, and its position is taken as the origin of the new rectangular coordinate system. The star points in the range R , with the origin as the center, are selected as the neighboring stars.
The distance between the main star and the neighboring star ranges from 0 to R , which is divided into n intervals; thus, each interval width is R / n . The number of stars in each interval is used as the element of the feature vector. That is, the feature vector can be expressed as
e os = a 1 a 2 a n
a j = k j = 1 , 2 , , n
where k represents the NOS in the j -th interval.
Similarly, each guide star in the guide star catalog is taken as the main star, and with the main star as the center, guide stars within the range of R are selected to construct the feature vector, which can be obtained as follows:
e gs = b 1 b 2 b n

3.2.3. Matching and Recognition

In reference [28], the sum of the absolute value of the subtraction between the feature vector constructed by the observing star and the feature vector in the guide star catalog was used as the value for matching. The smaller the sum, the higher the matching value would be. The guide star corresponding to the feature vector with the highest matching value was taken as the matching result. However, if there were more guide stars than observed stars in the same area, this method could not accurately identify and match the corresponding guide stars. Therefore, a matching strategy for comparison-AND was proposed.
Figure 8 shows a demonstration diagram of the comparison-AND matching strategy. The feature vector e gs of the guide star in the FOV is an m × n matrix, and the feature vector e os of the observing star is a 1 × n matrix. The following is the matching strategy:
  • The feature vector e gs of the guide star within the FOV is subtracted from the feature vector e os of the observing star, and a numerical matrix m × n is obtained.
  • The values in the m × n numerical matrix are judged., marked as 1 if the value is greater than or equal to 0, otherwise marked as 0, and an m × n label matrix is obtained.
  • The AND operation is performed on the elements of each row of the label matrix to obtain an m × 1 column vector.
  • The guide star feature vector corresponding to element 1 in the m × 1 column vector is the matching result. When n is large enough, the match is unique.
In Figure 8, e gs 3 is the matching feature vector of e os , and then the guide star information corresponding to the observing star can be obtained according to the angular distance information between the neighboring star and the main star.

3.3. QUEST Algorithm

The key problem in attitude determination is to determine the attitude from a set of vector measurements [44], so it is necessary to find a satisfied attitude matrix M .
w i = M v i i = 1 , , N
where v i is a group of reference unit vectors, the unit direction vectors of N navigation stars in the celestial coordinates; and w i is a group of observation unit vectors, which are the unit direction vectors of N observation stars in the FGS coordinate system.
For systems containing gyro information, the MEKF method is undoubtedly the most practical. For systems without gyro information, an attitude determination algorithm based purely on vector observation or a predictive filter estimation algorithm is generally used. Because we did not consider the gyro information, the QUEST [32] algorithm was used to solve the Wahba [45] problem directly via the point-by-point method to deal with multiple vector observation pairs, and the optimal attitude quaternion in the sense of least squares was obtained [46].
The loss function proposed by Wahba is shown in Equation (23), which is minimized by finding the matrix M .
L M = 1 2 i = 1 N a i w i M v i 2 i = 1 , , N
where a i is a set of non-negative weights.
The loss function can be converted to:
L M = i = 1 N a i t r M B T
B = i = 1 N a i w i v i T
where t r · represents the trace of a matrix and is the sum of all the elements of the main diagonal of the matrix. The solution of the minimum value of the loss function can be converted to the solution of the maximum value of the gain function G M = t r M B T .
Let the quaternion be
q = q 1 q 2 q 3 q 4 = q v q 4
G M can be represented by the quaternion
G q = q T K q
where
K = S σ I Z Z T σ
σ = tr ( B )
S = B + B T
Z = B 23 B 32 B 31 B 13 B 12 B 21 = i = 1 N a i ( w i × v i )
Under the constraint conditions expressed in Equation (26), the optimal posture is represented by the maximized quaternion at the right end of Equation (27), that is, the eigenvector corresponding to the maximum eigenvalue of K , which is
K q opt = λ max q opt
Let this be equivalent to
( λ max + σ ) I S q v = q 4 Z
and let
( λ max σ ) q 4 = q v T Z
which can be obtained from Equation (33):
q v = q 4 ( λ max + σ ) I S Z = q 4 det [ ( λ max + σ ) I S ] adj [ ( λ max + σ ) I S ] Z = q 4 det [ ( λ max + σ ) I S ] [ ( λ max 2 σ 2 + tr ( adj ( S ) ) ) I + ( λ max σ ) S + S 2 ] Z
where adj ( · ) is the adjoint matrix.
The optimal quaternion can be obtained as follows:
q opt = 1 γ 2 + X 2 X γ
where
γ = det [ ( λ max + σ ) I S ] = ( λ max 2 σ 2 + tr ( adj ( S ) ) ) ( λ max + σ ) det ( S )
X = [ ( λ max 2 σ 2 + tr ( adj ( S ) ) ) I + ( λ max σ ) S + S 2 ] Z
If one wants to obtain the optimal quaternion, the maximum eigenvalue of K should be obtained first. By substituting Equation (34) into Equation (35), one can obtain
ψ ( λ max ) γ ( λ max σ ) Z T X Z = 0
By substituting Equations (37) and (38) into Equation (39), the fourth-order equation of λ max , namely the characteristic equation det ( λ max I K ) = 0 , can be obtained. λ max can be obtained using the Newton iteration method. Then, the optimal quaternion is obtained, and finally the attitude matrix M is obtained.

4. Experimental Results

4.1. Results of Adaptive Adjustment Algorithm for the NOS in the FOV

The imaging system parameters of the FGS are shown in Table 1.
A sky region of the GaiaDR2 star catalog was selected for the simulation experiment, as shown in Figure 9.
The selected region had a declination of 5.75 7.25 and right ascension of 43.25 44.75 , which was equivalent to the FOV of nine detectors. Taking the number of nine target stars as an example, according to the star catalog information, the exposure time required to obtain the number of target stars in the FOV of the detector was obtained using Equations (4) to (9), as shown in Table 2.
The data in Table 2 were substituted into Equation (10), and the polynomial order was set as 3. The BSO algorithm was used to fit the polynomial parameters. Suppose the number of iterations is 300, the number of populations is 120, the acceleration constant c 1 = 2.8 and c 2 = 1.3 , the maximum weight is 0.9, the minimum weight is 0.4, λ = 0.95 , the initial step is 2, and the attenuation factor is 0.95. The polynomial coefficients are shown in Table 3.
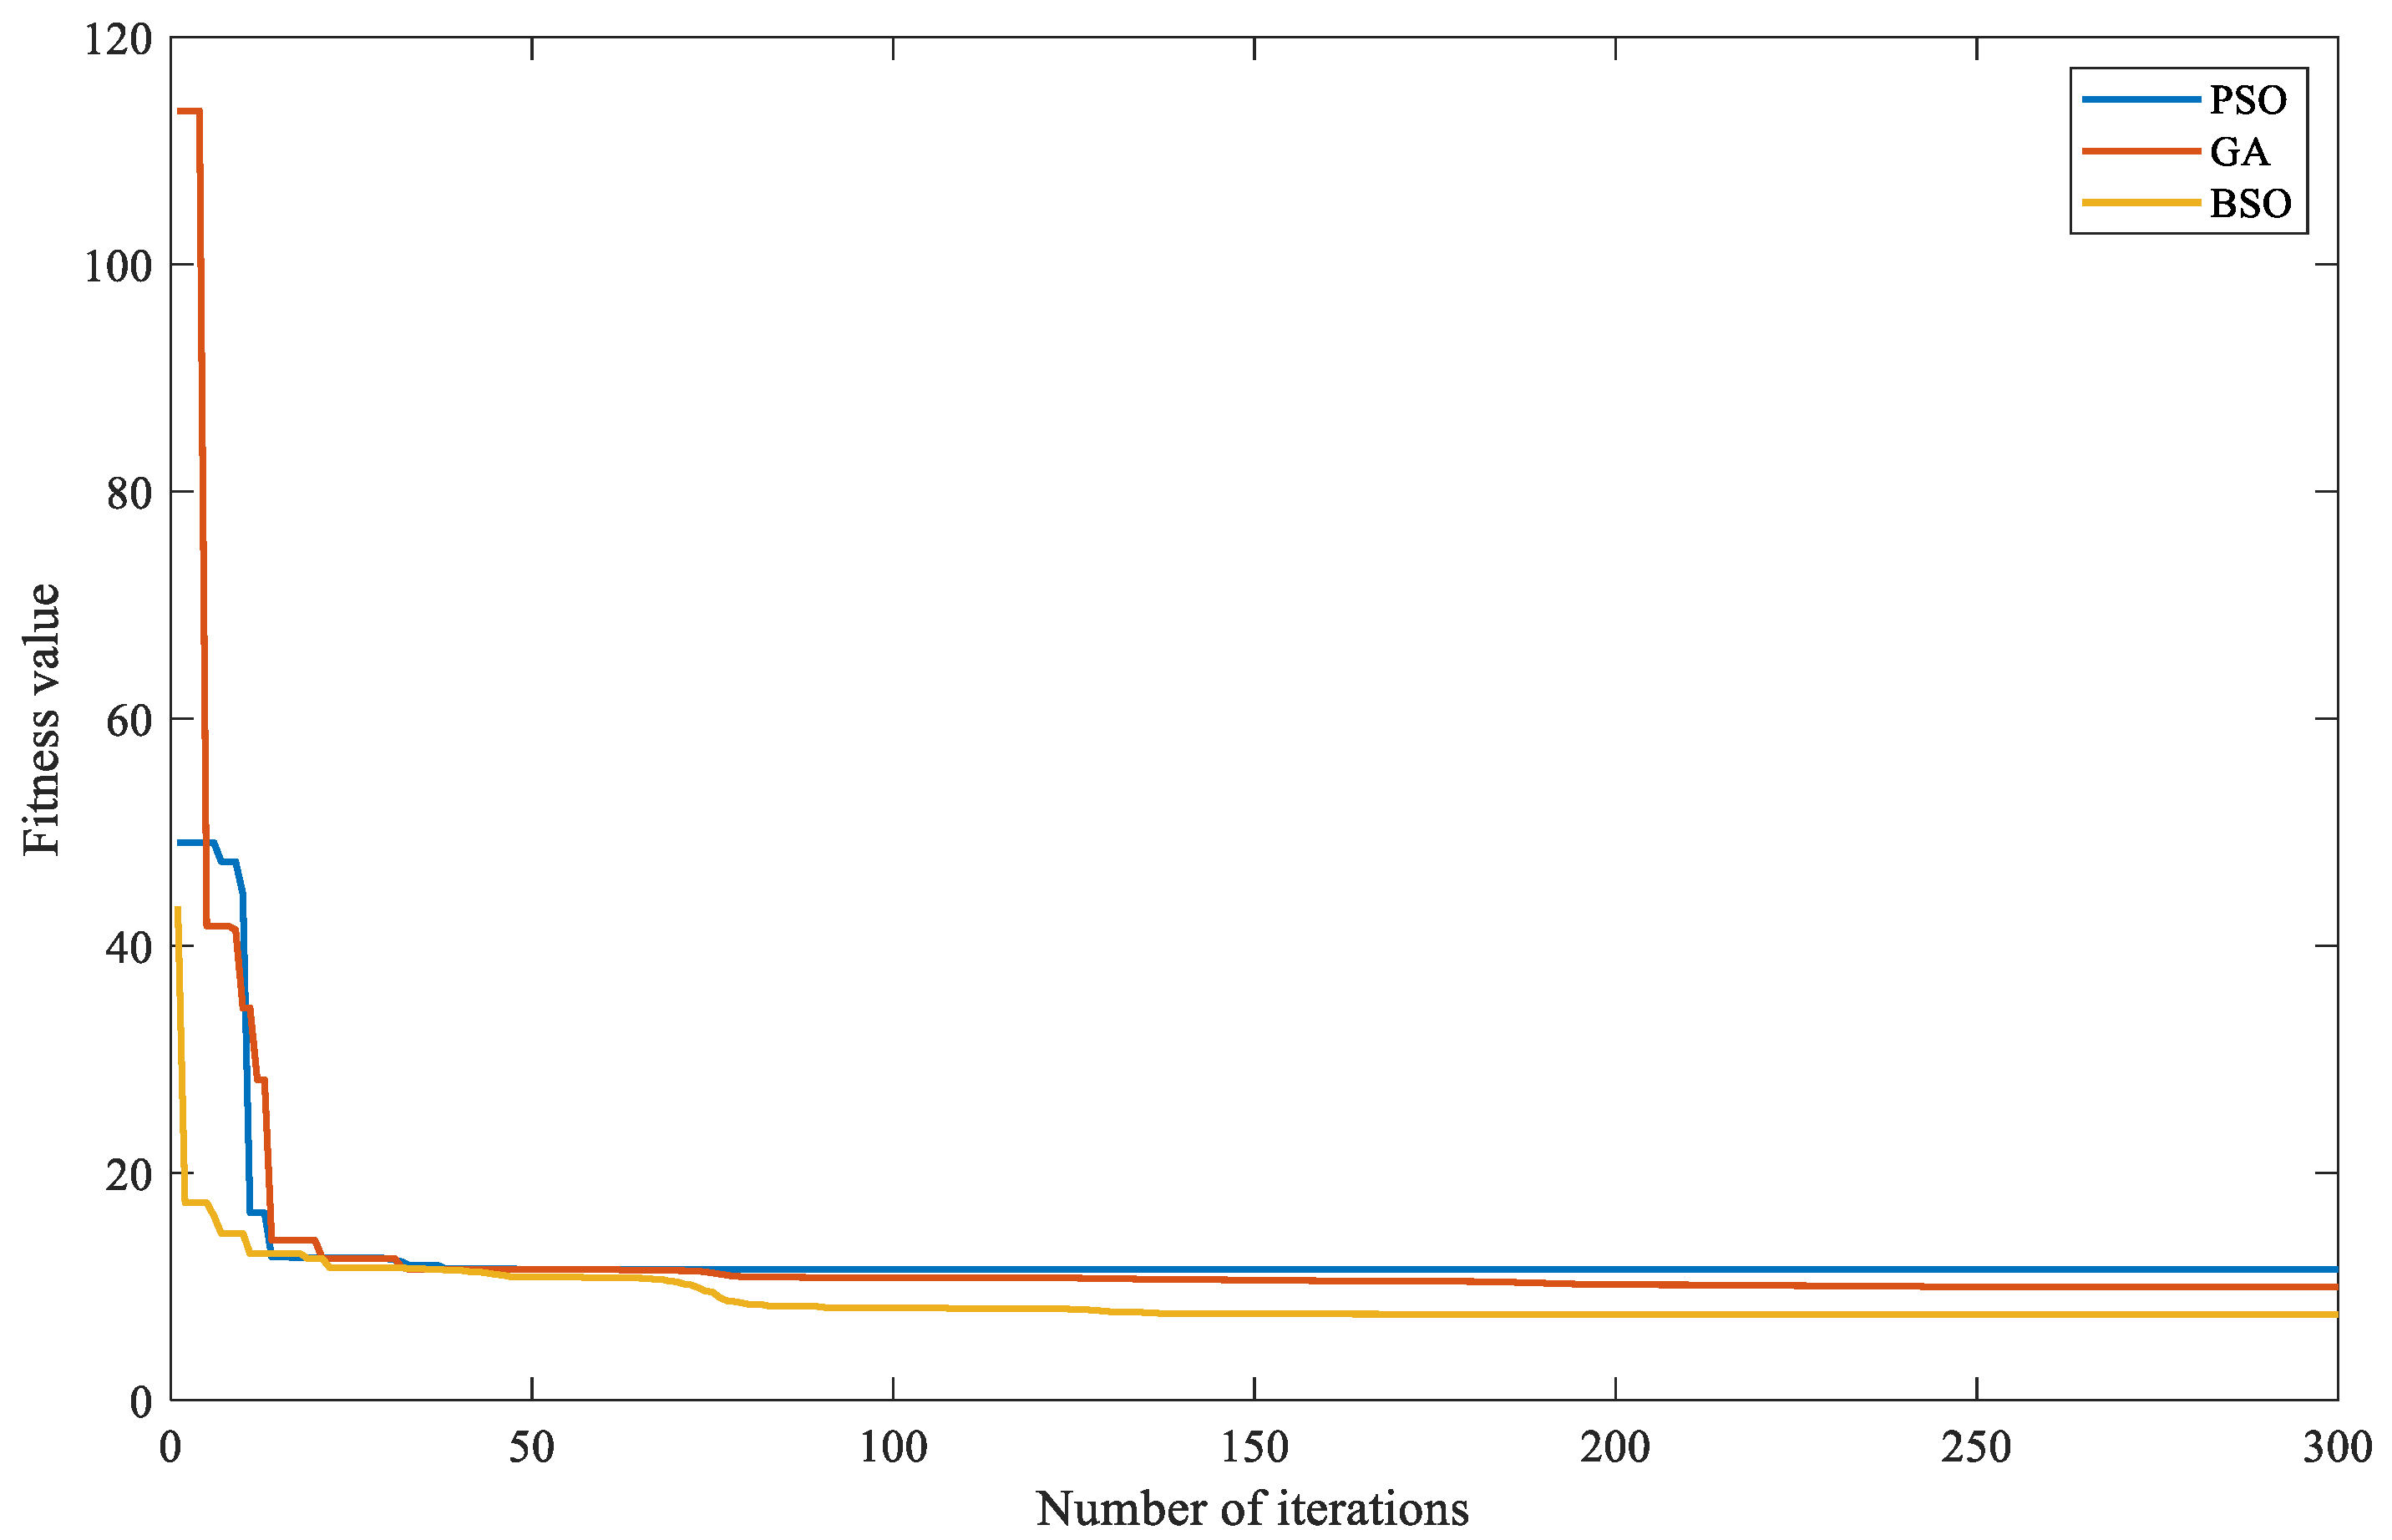
The performance of the optimization algorithm was evaluated by the final convergence value of the objective function. The fitting results of the BSO algorithm, the particle swarm optimization algorithm (PSO), and the genetic algorithm (GA) were compared, as were the convergence curves of each algorithm, as shown in Figure 10.
The above three intelligent optimization algorithms could identify the parameters of the polynomial model, but the BSO could not easily fall into the local optimal compared with the other two optimization algorithms, and the fitting accuracy was higher.
Taking the LOS of the detector pointing to the right ascension 43.5 and declination 6 as an example, the exposure time output by the model was substituted into the simulated detector system to obtain the actual NOS in the FOV of the detector; the feedback adjustment was carried out according to the method in Figure 5; and the learning rate α was 0.5. The star number adjustment results in the FOV of the detector are shown in Figure 11.
As seen in the figure, due to modeling errors, the NOS in the FOV obtained from the polynomial model was eight when it was input into the FGS simulated detector system. However, after introducing the closed-loop adjustment mechanism, the exposure time was adjusted accordingly to make the NOS in the FOV of the detector reach the target value.

4.2. Absolute Attitude Determination Results

Suppose that the imaging system parameters of the FGS are shown in Table 1, R = F O V x 2 + F O V y 2 / 2 , n = 160 , and stars of 9–15 mag in the GaiaDR2 star catalog are used as guide stars. Given an LOS pointing to the right ascension and declination ( α , δ ) , focal plane star points were generated according to the exposure time. The coordinates of the observed star on the focal plane were obtained through multi-star centroid extraction. The feature vectors of the observed stars were obtained through coordinate transformation and feature extraction. Finally, the attitude matrix was obtained by the QUEST algorithm, and then the pointing ( α , δ ) of the LOS was calculated.
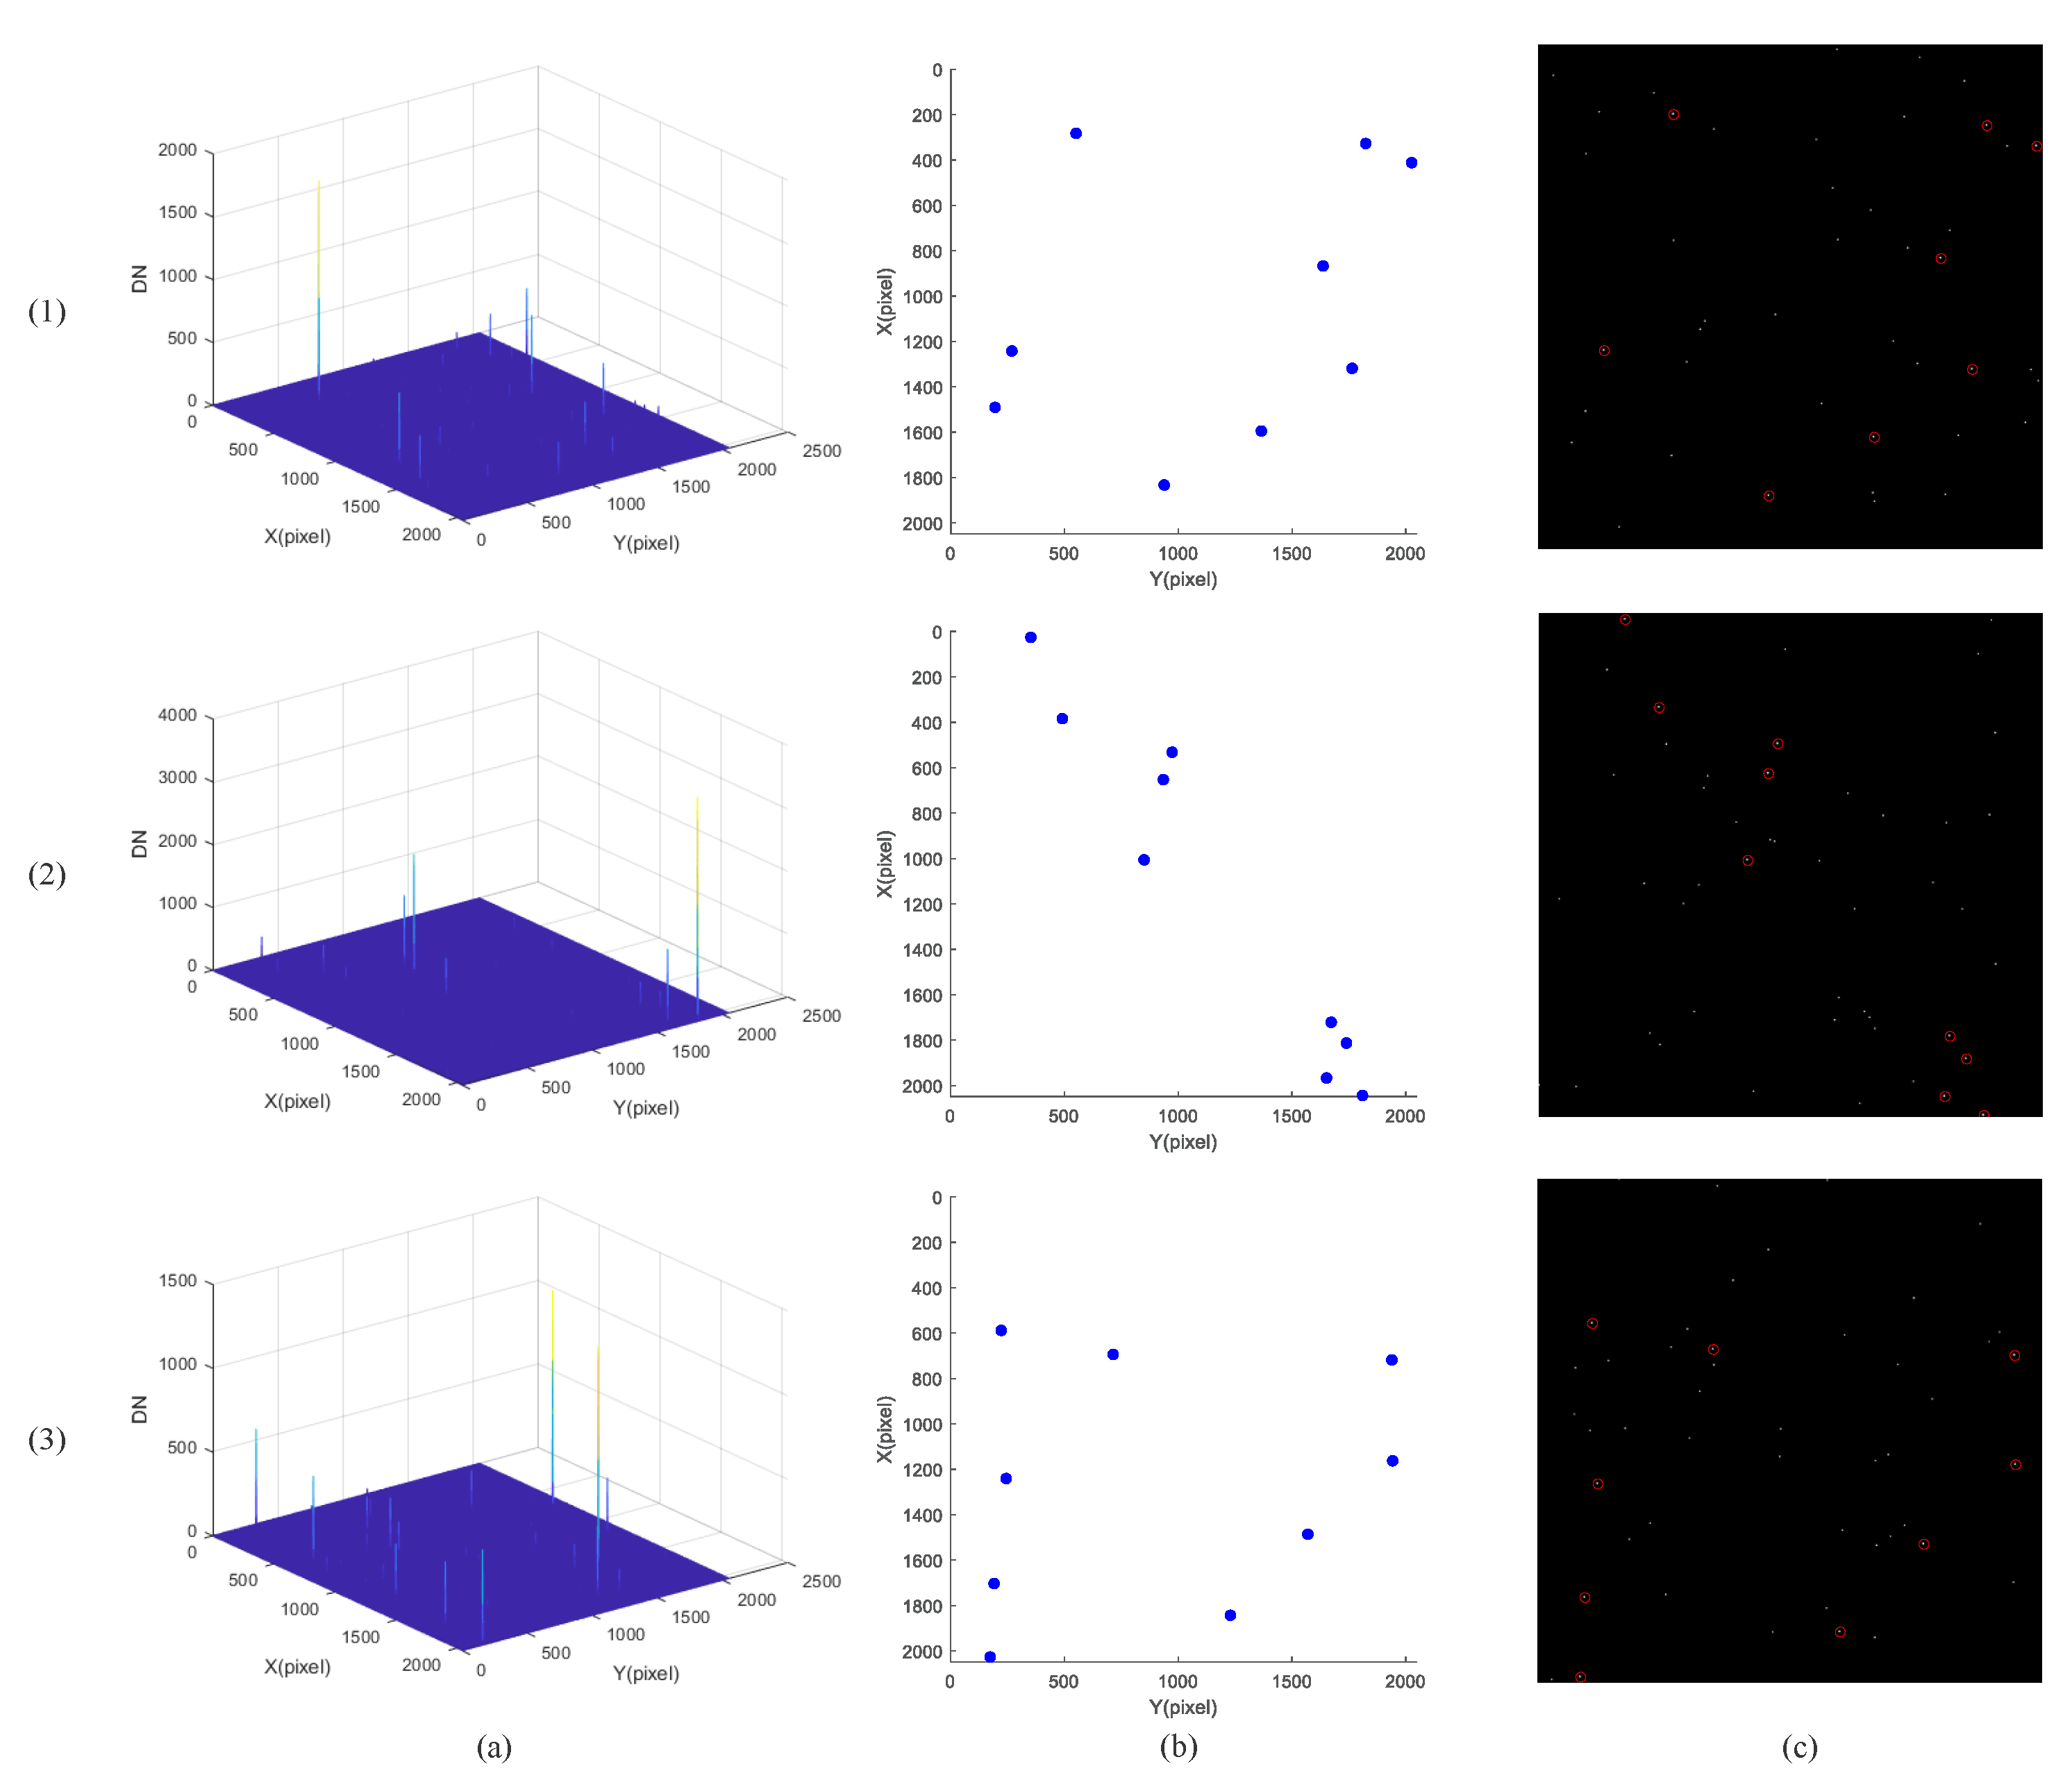
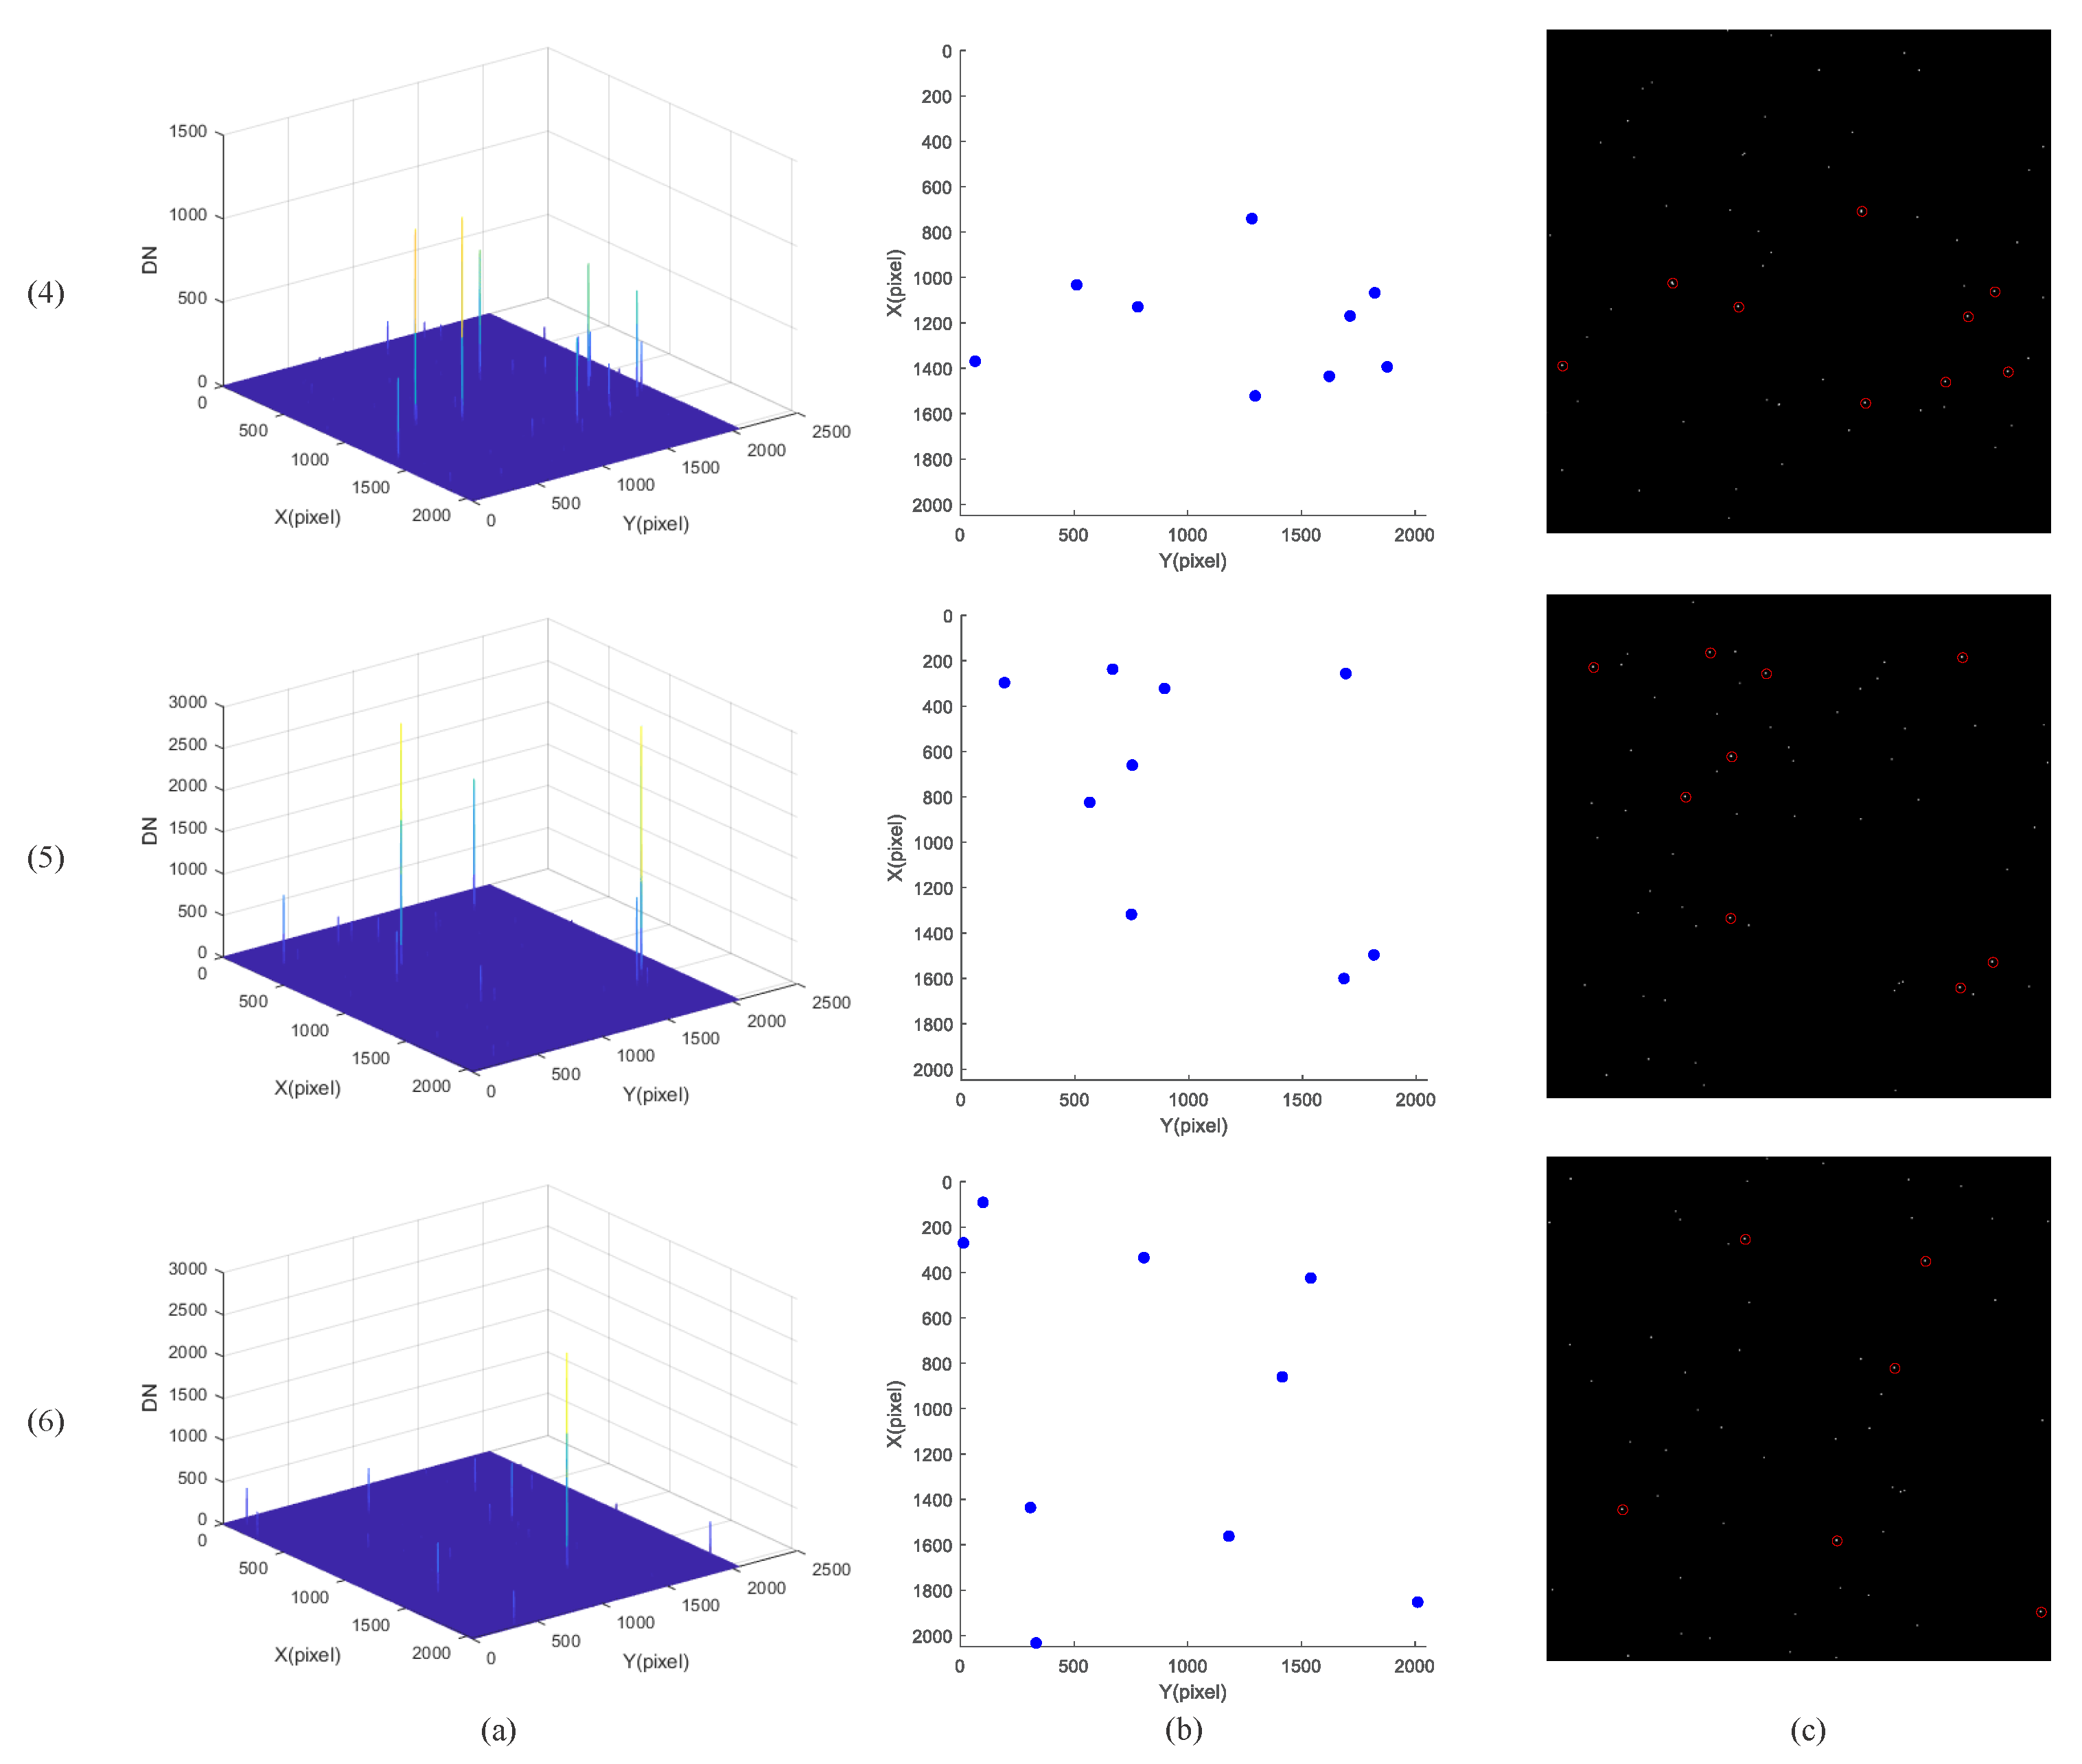
Nine Gaussian white noise simulated star images with a standard deviation of 2 were generated by providing nine LOS directions and exposure times. The matching and recognition results of the observed star and the guide star are shown in Figure 12, Figure 13 and Figure 14. Figure 12a represents the distribution of star points in the focal plane. Figure 12b represents the distribution of the observed star on the focal plane following centroid extraction. Figure 12c represents the guide star in the FOV, and the red circle is the matched guide star. From Figure 12, Figure 13 and Figure 14, it can be concluded that the matching algorithm based on polar coordinate comparison-AND could accurately identify the guide star corresponding to the observation star.
The LOS pointing results with and without Gaussian white noise were obtained via attitude determination, as shown in Table 4, and the LOS pointing error is shown in Table 5.
Ideally, when no noise is added, the calculated LOS direction should be consistent with the given direction. However, due to the error of the centroid extraction, the calculated LOS direction will have an error. It can be seen from Table 5 that the pointing errors of different pointing regions varied without noise, but the error was within 32 mas. In the case of noise, the LOS pointing error would be larger than that without noise, though staying within 37 mas.

4.3. Absolute Attitude Error Analysis

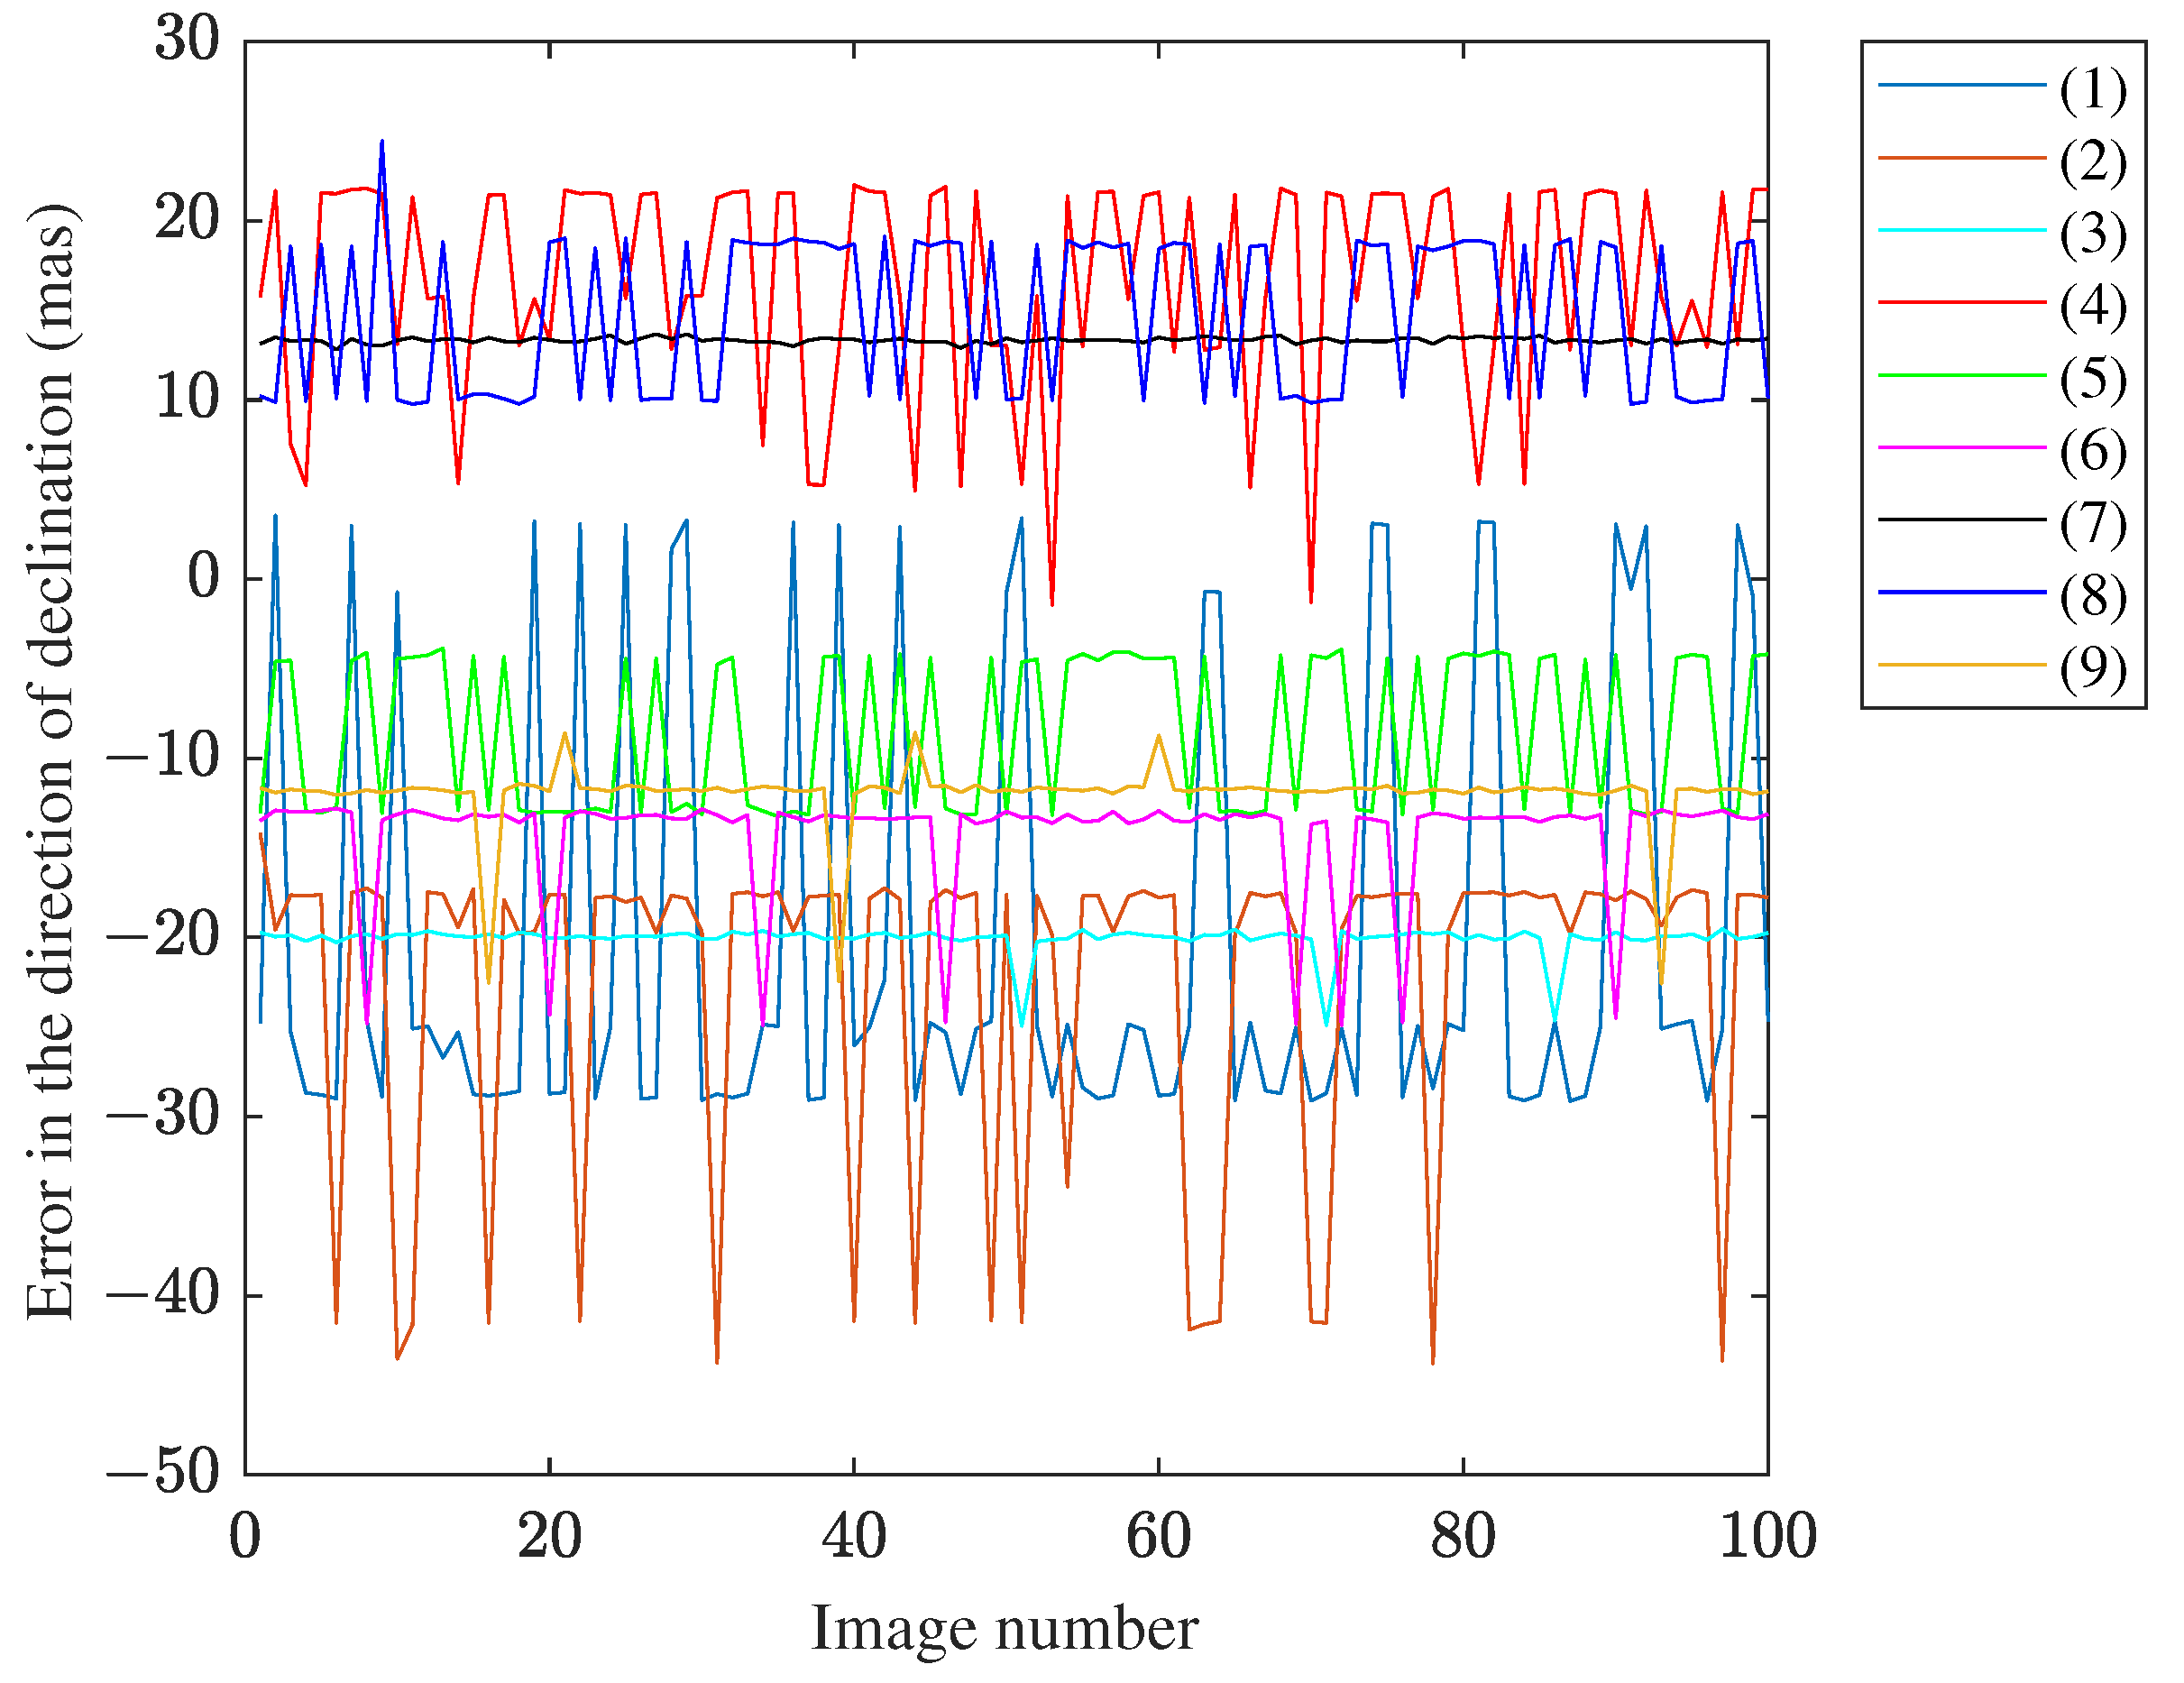
One hundred frames of different Gaussian white noise simulation images with a standard deviation of 2 were generated for nine LOS directions, the matching calculation was carried out for each of them, and the LOS pointing error and matching calculation time were calculated. The error in the right ascension direction and declination direction of the calculation results of 100 frames is shown in Figure 15 and Figure 16, respectively. From the two figures, it could be concluded that the error fluctuated under the influence of noise, but in general, regardless of the right ascension direction or declination direction, the error was within 50 mas.
The root mean square (RMS) value of the LOS pointing error for 100 frames of images was calculated, and the results are shown in Table 6. From the table, it is clear that the RMS value of the pointing error in the direction of right ascension was within 37 mas, and the RMS value of the pointing error in the direction of declination was within 25 mas.

5. Conclusions

In this paper, an adaptive absolute attitude determination algorithm for the FGS was proposed. By analyzing the relationship between the attitude determination accuracy and the NOS in the FOV, and the relationship between the detector exposure time and the NOS, an adaptive adjustment method for the NOS in the FOV was proposed. Through experimental simulations, when the input LOS pointed to the right ascension and declination, the NOS in the FOV could reach the target value by adaptively adjusting the exposure time. To ensure the speed of attitude determination, a comparison-AND based on a polar coordinate star identification algorithm was proposed to match the star map, and the QUEST algorithm was used to obtain the current absolute attitude information of the FGS and calculate the direction of the current LOS. Because the centroid extraction featured errors, the calculated LOS pointing in the experimental simulation produced errors. In the case of no noise, the pointing errors of different pointing regions varied, but the error was within 32 mas. In the case of noise, the LOS pointing error was larger than that without noise, but within 37 mas. For the nine LOS pointing and 100 frame image simulation calculation, the results showed that the calculated pointing error was less than 50 mas in both the right ascension and declination directions: the RMS value for right ascension was less than 37 mas, and the RMS value for declination was less than 25 mas. The pointing accuracy obtained using this method met the requirements for the attitude determination of an FGS and laid the foundation for the in-orbit application of an FGS. However, herein, we only carried out an attitude determination simulation for an FGS under a single noise. In the future, the attitude determination under the influence of multiple noises can be analyzed, and the algorithm can be integrated into an FGS for verification.

Author Contributions

Conceptualization, D.Y. and C.F.; methodology, Y.Y., C.F. and Q.Z.; software, Y.Y., C.F. and Q.Z.; validation, Y.Y., C.F. and Q.Z.; formal analysis, Y.Y., C.F. and Q.Z.; investigation, Y.Y.; resources, D.Y.; data curation, Y.Y.; writing—original draft preparation, Y.Y.; writing—review and editing, Y.Y., C.F., Q.Z. and D.Y.; visualization, Y.Y. and Q.Z.; supervision, D.Y.; project administration, D.Y.; funding acquisition, Q.Z. All authors have read and agreed to the published version of the manuscript.

Funding

This research was funded by the National Natural Science Foundation of China (NSFC), grant number 12103075.

Data Availability Statement

Not applicable.

Conflicts of Interest

The authors declare no conflict of interest.

References

  1. Zhan, H. Consideration for a large-scale multi-color imaging and slitless spectroscopy survey on the Chinese space station and its application in dark energy research. Sci. Sin. Phys. Mech. Astron. 2011, 41, 1441–1447. [Google Scholar] [CrossRef]
  2. CGTN. Chinese Xuntian Space Telescope to Unravel Cosmic Mysteries in 2023. 2022. Available online: https://news.cgtn.com/news/2022-05-06/Chinese-Xuntian-Space-Telescope-to-unravel-cosmic-mysteries-in-2023-19Ojkqf3iQ8/index.html (accessed on 23 May 2023).
  3. Zhan, H. The Chinese Survey Space Telescope. 2021. Available online: http://ilariacaiazzo.com/wp-content/uploads/2021/09/HuZhanSlides.pdf (accessed on 23 May 2023).
  4. Zhan, H. The wide-field multiband imaging and slitless spectroscopy survey to be carried out by the Survey Space Telescope of China Manned Space Program. Chin. Sci. Bull. 2021, 66, 1290–1298. [Google Scholar] [CrossRef]
  5. Chen, H. Fine Guidance Sensor Processing and Optical Closed-Loop Semi-Physical Simulation in Space Telescope. Ph.D. Thesis, Shanghai Institute of Technical Physics, University of Chinese Academy of Sciences, Beijing, China, 2019. [Google Scholar]
  6. Bhatia, D. Attitude Determination and Control System Design of Sub-Arcsecond Pointing Spacecraft. J. Guid. Control. Dyn. 2021, 44, 295–314. [Google Scholar] [CrossRef]
  7. NASA. Hubble Space Telescope—Fine Guidance Sensors. 2018. Available online: https://www.nasa.gov/sites/default/files/atoms/files/hst_fine_guidance_fact_sheet1_0.pdf (accessed on 23 May 2023).
  8. Sridhar, B.; Aubrun, J.N.; Lorell, K. Design of a precision pointing control system for the space infrared telescope facility. IEEE Control Syst. Mag. 1986, 6, 28–34. [Google Scholar] [CrossRef]
  9. Rowlands, N.; Vila, M.B.; Evans, C.; Aldridge, D.; Desaulniers, D.L.; Hutchings, J.B.; Dupuis, J. JWST fine guidance sensor: Guiding performance analysis. In Proceedings of the Space Telescopes and Instrumentation 2008: Optical, Infrared, and Millimeter, Marseille, France, 23–28 June 2008; Oschmann, J.M., Jr., de Graauw, M.W.M., MacEwen, H.A., Eds.; International Society for Optics and Photonics (SPIE): Bellingham, WA, USA, 2008; Volume 7010, p. 701036. [Google Scholar] [CrossRef]
  10. Bosco, A.; Saponara, M.; Procopio, D.; Carnesecchi, F.; Saavedra, G. High accuracy spacecraft attitude measurement: The Euclid Fine Guidance Sensor. In Proceedings of the 2019 IEEE 5th International Workshop on Metrology for AeroSpace (MetroAeroSpace), Turin, Italy, 19–21 June 2019; pp. 290–296. [Google Scholar] [CrossRef]
  11. Benedict, G.F.; Mcarthur, B.E.; Bean, J.L. HST FGS astrometry—The value of fractional millisecond of arc precision. Proc. Int. Astron. Union 2007, 3, 23–29. [Google Scholar] [CrossRef]
  12. Li, L.; Yuan, L.; Wang, L.; Zheng, R.; Wang, X.; Wu, Y. Influence of micro vibration on measurement and pointing control system of high-performance spacecraft from Hubble Space Telescope. Opt. Precis. Eng. 2020, 28, 2478–2487. [Google Scholar]
  13. NASA. Hubble: An Overview of the Space Telescope. 2021. Available online: https://www.nasa.gov/sites/default/files/atoms/files/hstoverview-v42021_1.pdf (accessed on 23 May 2023).
  14. Nelan, E.P.; Lupie, O.L.; McArthur, B.; Benedict, G.F.; Franz, O.G.; Wasserman, L.H.; Abramowicz-Reed, L.; Makidon, R.B.; Nagel, L. Fine guidance sensors aboard the Hubble Space Telescope: The scientific capabilities of these interferometers. In Proceedings of the Astronomical Interferometry, Kona, HI, USA, 20–28 March 1998; Reasenberg, R.D., Ed.; Conference Series. Society of Photo-Optical Instrumentation Engineers (SPIE): Bellingham, WA, USA, 1998; Volume 3350, pp. 237–247. [Google Scholar] [CrossRef]
  15. Bayard, D. An Overview of the Pointing Control System for NASA’s Space Infra-Red Telescope Facility (SIRTF). In Proceedings of the AIAA Guidance, Navigation, and Control Conference and Exhibit, Austin, TX, USA, 11–14 August 2003. [Google Scholar] [CrossRef] [Green Version]
  16. Bayard, D.; Kang, B.; Brugarolas, P.; Boussalis, D. Focal plane calibration of the Spitzer space telescope. IEEE Control Syst. Mag. 2010, 29, 47–70. [Google Scholar] [CrossRef] [Green Version]
  17. Mainzer, A.K.; Young, E.T.; Greene, T.P.; Acu, N.; Jamieson, T.H.; Mora, H.; Sarfati, S.; van Bezooijen, R.W.H. Pointing calibration and reference sensor for the Space Infrared Telescope Facility. In Proceedings of the Space Telescopes and Instruments V, Kona, HI, USA, 20–28 March 1998; Bely, P.Y., Breckinridge, J.B., Eds.; International Society for Optics and Photonics (SPIE): Bellingham, WA, USA, 1998; Volume 3356, pp. 1095–1101. [Google Scholar] [CrossRef]
  18. Mainzer, A.K.; Young, E.T. On-orbit performance testing of the pointing calibration and reference sensor for the Spitzer Space Telescope. In Proceedings of the Optical, Infrared, and Millimeter Space Telescopes, Glasgow, UK, 21–25 June 2004; Mather, J.C., Ed.; International Society for Optics and Photonics (SPIE): Bellingham, WA, USA, 2004; Volume 5487, pp. 93–100. [Google Scholar] [CrossRef]
  19. Mainzer, A.K.; Young, E.T.; Huff, L.W.; Swanson, D. Pre-launch performance testing of the pointing calibration and reference sensor for SIRTF. In Proceedings of the IR Space Telescopes and Instruments, Waikoloa, HI, USA, 22–28 August 2002; Mather, J.C., Ed.; International Society for Optics and Photonics (SPIE): Bellingham, WA, USA, 2003; Volume 4850, pp. 122–129. [Google Scholar] [CrossRef]
  20. Meza, L.; Tung, F.C.; Anandakrishnan, S.M.; Spector, V.A.; Hyde, T.T. Line of Sight Stabilization of James Webb Space Telescope. In Proceedings of the 27th Annual AAS Guidance and Control Conference, Breckenridge, CO, USA, 5–9 February 2005. [Google Scholar]
  21. NASA. JWST Fine Guidance Sensor. 2022. Available online: https://jwst-docs.stsci.edu/jwst-observatory-hardware/jwst-fine-guidance-sensor (accessed on 23 May 2023).
  22. Chayer, P.; Holfeltz, S.; Nelan, E.; Hutchings, J.; Doyon, R.; Rowlands, N. JWST Fine Guidance Sensor Calibration. 2010. Available online: https://www.stsci.edu/~INS/2010CalWorkshop/chayer.pdf (accessed on 23 May 2023).
  23. Greenhouse, M. The James Webb Space Telescope: Mission Overview and Status. In Proceedings of the AIAA SPACE 2012 Conference & Exposition, Big Sky, MT, USA, 2–9 March 2019. [Google Scholar] [CrossRef] [Green Version]
  24. Bosco, A.; Bacchetta, A.; Saponara, M.; Criado, G.S. Euclid pointing performance: Operations for the Fine Guidance Sensor reference star catalogue. In Proceedings of the 2018 SpaceOps Conference, Marseille, France, 28 May–1 June 2018. [Google Scholar] [CrossRef]
  25. Bacchetta, A.; Saponara, M.; Torasso, A.; Saavedra Criado, G.; Girouart, B. The Euclid AOCS science mode design. CEAS Space J. 2015, 7, 71–85. [Google Scholar] [CrossRef]
  26. Bosco, A.; Bacchetta, A.; Saponara, M. Euclid Star Catalogue Management for the Fine Guidance Sensor. In Proceedings of the DASIA 2015—DAta Systems in Aerospace, Barcelona, Spain, 19–21 May 2015; Ouwehand, L., Ed.; ESA Special Publication. ESA: Paris, France, 2015; Volume 732, p. 50. [Google Scholar]
  27. Liu, H.; Wei, X.; Li, J.; Wang, G. A Star Identification Algorithm Based on Recommended Radial Pattern. IEEE Sens. J. 2022, 22, 8030–8040. [Google Scholar] [CrossRef]
  28. Yan, X.L.; Xu, W.; Yang, G.L. Star Map Recognition Algorithm Based on Improved Log-Polar Transformation. Acta Opt. Sin. 2021, 41, 103–109. [Google Scholar]
  29. Rijlaarsdam, D.; Yous, H.; Byrne, J.; Oddenino, D.; Furano, G.; Moloney, D. Efficient Star Identification Using a Neural Network. Sensors 2020, 20, 3684. [Google Scholar] [CrossRef] [PubMed]
  30. Wang, B.; Wang, H.; Jin, Z. An Efficient and Robust Star Identification Algorithm Based on Neural Networks. Sensors 2021, 21, 7686. [Google Scholar] [CrossRef] [PubMed]
  31. Wang, H.; Wang, Z.Y.; Wang, B.D.; Yu, Z.Q.; Jin, Z.H.; Crassidis, J.L. An artificial intelligence enhanced star identification algorithm. Front. Inf. Technol. Electron. Eng. 2020, 21, 1661–1670. [Google Scholar] [CrossRef]
  32. Shuster, M.D. The quest for better attitudes. J. Astronaut. Sci. 2006, 54, 657–683. [Google Scholar] [CrossRef]
  33. Markley, F.L.; Crassidis, J.L. Static Attitude Determination Methods. In Fundamentals of Spacecraft Attitude Determination and Control; Springer: New York, NY, USA, 2014; pp. 183–233. [Google Scholar] [CrossRef]
  34. Black, H.D. A passive system for determining the attitude of a satellite. AIAA J. 1964, 2, 1350–1351. [Google Scholar] [CrossRef]
  35. Bayard, D. Fast observers for spacecraft pointing control. In Proceedings of the 37th IEEE Conference on Decision and Control (Cat. No.98CH36171), Tampa, FL, USA, 18 December 1998; Volume 4, pp. 4702–4707. [Google Scholar] [CrossRef]
  36. Markley, F.L.; Crassidis, J.L. Fundamentals of Spacecraft Attitude Determination and Control; Space Technology Library; Springer: New York, NY, USA, 2014; Volume 4. [Google Scholar] [CrossRef]
  37. Liebe, C. Accuracy performance of star trackers—A tutorial. IEEE Trans. Aerosp. Electron. Syst. 2002, 38, 587–599. [Google Scholar] [CrossRef]
  38. Zhang, J.; Lian, J.; Yi, Z.; Yang, S.; Shan, Y. High-Accuracy Guide Star Catalogue Generation with a Machine Learning Classification Algorithm. Sensors 2021, 21, 2647. [Google Scholar] [CrossRef]
  39. Zhang, G. Star Identification; National Defense Industry Press: Beijing, China, 2011. [Google Scholar]
  40. Zheng, T. Research on High-Speed Processing of Fine Guidance Sensor in Space Telescope. Ph.D. Thesis, Shanghai Institute of Technical Physics, University of Chinese Academy of Sciences, Beijing, China, 2018. [Google Scholar]
  41. Wang, T.; Yang, L.; Liu, Q. Beetle Swarm Optimization Algorithm: Theory and Application. arXiv 2018, arXiv:1808.00206. [Google Scholar] [CrossRef]
  42. Liu, B. The Design and Implementation of Star Image Centroid Detection Algorithm Based on FPGA. Master’s Thesis, Shanghai Jiao Tong University, Shanghai, China, 2019. [Google Scholar]
  43. Cheng, H.; Ding, R.; Hu, B.; Li, J.; Li, Y. Fast Extraction Method for Connected Domain of Infrared Remote Sensing Image Based on High Level Synthesis. Aerosp. Shanghai 2021, 38, 144–151. [Google Scholar] [CrossRef]
  44. Shuster, M.D.; Oh, S.D. Three-axis attitude determination from vector observations. J. Guid. Control 1981, 4, 70–77. [Google Scholar] [CrossRef]
  45. Farrell, J.L.; Stuelpnagel, J.; Wessner, R.H.; Velman, J.R.; Brook, J.E. A Least Squares Estimate of Satellite Attitude (Grace Wahba). SIAM Rev. 1966, 8, 384–386. [Google Scholar] [CrossRef]
  46. Zhou, X. Design and Implementation of an Attitude Determination Software System Based on Star Sensor. Master’s Thesis, Huazhong University of Science and Technology, Wuhan, China, 2013. [Google Scholar]
Figure 1. FGS workflow block diagram.
Electronics 12 03437 g001
Figure 2. The relationship between the NOS in the FOV and attitude accuracy.
Electronics 12 03437 g002
Figure 3. The corresponding exposure time when 9∼15 mag stars reach 95% full well.
Electronics 12 03437 g003
Figure 4. The relationship between the exposure time and the NOS in the FOV. (a) Simulated star map. (b) Statistical results of exposure time and the NOS (exposure time interval is 5 ms).
Electronics 12 03437 g004
Figure 5. The algorithm model for an adaptive adjustment of the NOS in the FOV.
Electronics 12 03437 g005
Figure 6. A flowchart of the BSO.
Electronics 12 03437 g006
Figure 7. Changes in the star map before and after rotation in different coordinate systems. (a) The plane Cartesian coordinates. (b) The polar coordinate system.
Electronics 12 03437 g007
Figure 8. A demonstration diagram of comparison-AND.
Electronics 12 03437 g008
Figure 9. A sky region of the GaiaDR2 star catalog.
Electronics 12 03437 g009
Figure 10. The convergence curves of each algorithm.
Electronics 12 03437 g010
Figure 11. The star number adjustment results in the FOV of the detector.
Electronics 12 03437 g011
Figure 12. The matching and recognition of the observed stars and the guide star results. (a) The distribution of star points in the focal plane. (b) The distribution of the observed star on the focal plane following centroid extraction. (c) The guide star in the FOV (the red circle is the matched guide star).
Electronics 12 03437 g012
Figure 13. The matching and recognition results of the observed star and the guide star (continued). (a) The distribution of star points in the focal plane. (b) The distribution of the observed star on the focal plane following centroid extraction. (c) The guide star in the FOV (the red circle is the matched guide star).
Electronics 12 03437 g013
Figure 14. The matching and recognition results of the observed star and the guide star (continued). (a) The distribution of star points in the focal plane. (b) The distribution of the observed star on the focal plane following centroid extraction. (c) The guide star in the FOV (the red circle is the matched guide star).
Electronics 12 03437 g014
Figure 15. Error in right ascension direction for 100 frames.
Electronics 12 03437 g015
Figure 16. Error in declination direction for 100 frames.
Electronics 12 03437 g016
Table 1. The imaging system parameters of the FGS.
ParameterValue
Horizontal FOV 0.5
Vertical FOV 0.5
Focal length1290 mm
Aperture161.25 mm
Number of horizontal pixels2048
Number of vertical pixels2048
Horizontal pixel size5.5 μ m
Bit depth12 bit
Table 2. The exposure time required for the detector to obtain the target number of stars.
Right Acension 43.5 44 44.5
Exposure Time (ms)
Declination
6 542648
6.5 422550
7 312557
Table 3. The optimal values of the polynomial coefficient.
CoefficientValue
x 00 987.00
x 01 987.00
x 02 −63.81
x 03 0.84
x 10 987.00
x 11 218.55
x 12 −3.59
x 20 −989.00
x 21 9.61
x 30 29.20
Table 4. The results of the calculation of the LOS direction with noise and without noise.
IndexLOS DirectionCalculated LOS Direction
  Without NoiseNoise
Right
Ascension ( )
Declination ( )Right
Ascension ( )
Declination ( )Right
Ascension ( )
Declination ( )
143.56.043.499995565.9999931743.499992685.99999304
243.56.543.499996726.4999911443.499995026.49999512
343.57.043.499992276.9999958043.499991396.99999443
444.06.044.000001706.0000041844.000004506.00000441
544.06.544.000003646.4999994043.999998066.50000196
644.07.044.000007576.9999976144.000008816.99999627
744.56.044.500007036.0000032744.500010216.00000366
844.56.544.500004496.4999981044.500000296.50000677
944.57.044.500006956.9999988244.500008086.99999670
Table 5. The LOS pointing error with noise and without noise.
IndexError (mas)
Without NoiseNoise
Right AscensionDeclinationRight AscensionDeclination
1−16.0−24.6−26.4−25.1
2−11.8−31.9−17.9−17.6
3−27.8−15.1−31.0−20.1
46.115.016.215.9
513.1−2.2−7.07.1
627.2−8.631.7−13.4
725.311.836.813.2
816.2−6.81.024.4
925.0−4.329.1−11.9
Table 6. The RMS value of the LOS direction error for 100 frames.
IndexRMS (mas)
Right AscensionDeclination
123.523.7
218.924.0
330.620.1
49.017.8
58.39.6
630.614.5
736.713.3
810.015.4
930.012.1
Disclaimer/Publisher’s Note: The statements, opinions and data contained in all publications are solely those of the individual author(s) and contributor(s) and not of MDPI and/or the editor(s). MDPI and/or the editor(s) disclaim responsibility for any injury to people or property resulting from any ideas, methods, instructions or products referred to in the content.