Article

Adaptive Quantization Range Division Technique for Electronic Control Data Compression in CNC Machine Tools

National Center of Technology Innovation for Intelligent Design and Numerical Control, Huazhong University of Science and Technology, Wuhan 430074, China
*
Author to whom correspondence should be addressed.
Electronics 2023, 12(16), 3387; https://doi.org/10.3390/electronics12163387
Submission received: 24 June 2023 / Revised: 2 August 2023 / Accepted: 6 August 2023 / Published: 9 August 2023

Abstract

:
With the development of new technologies such as artificial intelligence and big data, Industry 4.0 in manufacturing has been launched. As the core pillar of industrial manufacturing, computer numerical control (CNC) machine tools face significant challenges in data acquisition transmission and storage due to their complex structure, high volume of data points, strong time-series characteristics, and large amounts of data. To address the shortcomings of existing compression algorithms in quantization methods for large amounts of data in the instruction-domain, this paper proposes a quantization method based on distortion rate evaluation and linear fitting entropy reduction transformation, which aims to compress state signals such as the load power and load current while ensuring the availability of the data. This approach provides technical support for the transmission of high-frequency big data and meets the lightweight data acquisition requirements of digital twins for CNC machine tools. Compared to the empirical approach, this approach was more accurate and more computationally efficient.

1. Introduction

This section firstly provides relevant background information regarding machine tools in industrial manufacturing, as well as the motivation of data compression techniques for computer numerical control (CNC). Then, we summarize our work’s contributions and describe the paper’s structure.

1.1. Background and Motivation

Industry 4.0 has ushered in an era of artificial intelligence, big data, and cloud computing, which have been integrated into various industries to varying degrees [1,2,3,4]. Industrial big data plays a key role in the intelligence of manufacturing, particularly in achieving a rapid response to interactions between factors inside and outside the system [5]. CNC machine tools are the main class of equipment used in the manufacturing industry, and the large volumes of data they generate during processing are vital in ensuring machine tool health, enabling fault diagnosis, and optimizing product quality [6].
However, the large amount of electronic control data generated by CNC systems at the network edge places significant pressure on data transmission capacity and storage space. At present, it is difficult to establish digital twins of NC machine tools, which involves many related applications, such as real-time 3D visualization monitoring of the running state of NC equipment in the workshop [7], contour error compensation [8], process parameter optimization [9] and a series of smart applications that require mass amounts of data. In addition, the high frequency of data collection leads to the occupation of a large amount of storage space and causes great difficulties in the analysis and utilization of data. Edge computing [10,11] is a crucial component of the industrial internet platform, serving a range of important functions from device connection to edge intelligence, and is widely used in the Internet of Things. In the field of CNC machining, there are numerous delay-sensitive tasks, such as multiaxis machining and real-time monitoring of equipment, which must be completed efficiently. Edge computing is an effective solution for addressing related problems [12,13]. However, despite the widespread application of edge computing in the Internet of Things, there is a lack of research on the deployment of data compression technology at the edge [14]. In the current industrial internet, the limited network bandwidth in industrial production sites cannot guarantee the stability of the transmission process for industrial control data on the necessary massive scale. With the rapid development of the Industrial Internet of Things (IIoT), the associated rapidly developing data-processing requirements often fail to be met. The lack of efficient and fast data lightweight algorithms for edge computing of CNC machine tools cannot cope with the needs of massive data aggregation of digital twins. Due to the inability to account for both information integrity and cost economy, big data acquisition of CNC machine tools has become the bottleneck of high-fidelity digital twins. Compression is generally divided into four steps: prediction, observation, quantization, and reconstruction. Lossy compression may include more steps, such as sparse representation. Sparse representation has proven to have outstanding applications in signal processing and image processing [15,16,17,18,19,20,21,22]. However, in the subsequent quantification process, empirical quantification will be adopted in most cases. Certain compression quality fluctuations will occur in the face of various working conditions in the processing of NC machine tools.

1.2. Contribution

This paper proposes an efficient edge computing model for CNC machine tools by addressing the issue of quantifying compressed data. The proposed model employs a sparse representation method to reconstruct or characterize the effective information of machine data signals through a minimal number of sparse coefficients. However, the lack of a unified standard for quantifying many small sparse coefficients during sparse representation can lead to unexpected compression results. Therefore, this paper also proposes a new quantization standard based on the characteristics of CNC machine tool signals generated in different working conditions to provide a reliable theoretical basis for edge data compression and signal analysis, thereby improving data transmission efficiency and saving storage space.
The main contributions of this article can be summarized as follows:
  • A sparse-domain quantization interval threshold determination method based on the discrete cosine transform is proposed for use in the field of CNC machine tools, which can improve the efficiency and quality of compression-aware methods of CNC machine tools under different working conditions.
  • Previous methods have typically used a fixed value or percentage for quantization; however, this approach lacks scientific justification. This article abandons the fixed-value quantization approach and instead proposes a distortion rate evaluation formula for determining the quantization interval, thereby ensuring compression accuracy.
  • Aiming at the electronic data of CNC machine tools processed by DCT, this paper proposed an algorithm to quickly calculate the value range division and determine the quantization step size. This algorithm can optimize the compression effect under different working conditions of CNC machine tools.

1.3. Organization of the Paper

This article is organized as follows. Section 2 presents a review of related work. Section 3 provides a detailed introduction to the proposed algorithm design, quantification, and evaluation model. Section 4 discusses the experimental process, results, and analysis. Finally, Section 5 concludes the article.

2. Related Work

Commonly used sparse transform bases include the discrete Fourier transform (DFT), discrete cosine transform (DCT), discrete wavelet transform (DWT), curvelets, and overcomplete dictionaries. Because the experimental data used in this paper originate from the current signal of a CNC machine tool, for the large amount of data generated in the instruction-domain [23], frequency-domain transforms (such as the Fourier transform and DCT) may be better sparse representation methods. For the optimization problem, Shen et al. [24] present an approximation algorithm, which is one of the motivations of the proposed method. Li et al. [25] conducted signal analysis and data processing based on the sparse characteristics of CNC system electronic control data. Liu et al. [26] improved the transmission efficiency of networked CNC system machine control instructions (MCI) using multichannel differential run-length coding (MDRL). Sabbagh et al. [27] implemented industrial data compression using physically inspired compression methods. Liu et al. [28] improved the rotation gate algorithm and the Lempel–Ziv–Welch (LZW) algorithm for the compression of static text data and process data and adopted a two-level compression method to compress data for network transmission. Yuan et al. [29] used a new image compression method based on Haar-V functions (ICHV), which shows good performance in industrial image compression. Chen et al. [30] proposed a fog-based compression scheme optimized for Kronecker support, utilizing the spatiotemporal correlations between data, and achieved better compression results in the IIoT context. Wang et al. [31] established a data compression model to solve the problem of the load imposed on the link bandwidth by superlarge tasks in the industrial internet by representing the computational load of compression and decompression as a nonlinear function of the compression ratio. To explore the data correlations between different clusters and meet the high data accuracy requirements of industrial applications, Chen et al. [32] proposed a hierarchical adaptive compression design for efficient data collection (LACD-EDC) in industrial wireless sensor networks (IWSNs). Bagherian et al. [33] provided a concise overview of important emerging quantum compression techniques in quantum information processing, including the proposed concept of quantum edge computing. Because there is little research on the compression of CNC machine tools under different working conditions, this paper proposes a method to determine the threshold of the sparse domain quantization interval based on the discrete cosine transform and proposes the distortion rate evaluation formula and the value range division algorithm to determine the quantization interval. These methods can help stabilize the compression accuracy of NC machine tools under different working conditions.

3. Proposed Scheme

This section describes the selection of the method for specific application scenarios and the overall algorithm composition and detailed explanation.
In a CNC system, the machine tool spindle is the most important functional component of the CNC machine tool. It is responsible for controlling the tool to run in accordance with the given instructions, and the changes in its current reflect the regulation of the servo motor and the cutting load of the machining process, determining the machining quality and accuracy. Therefore, the machine tool spindle current is an important signal reflecting changes in the operating state of the machine tool. Furthermore, the variations in the current also indirectly reflect the accuracy and quality of the machining [23]. Therefore, this paper presents research from the perspective of analyzing the spindle current. Based on the existing research on the compression technology of the spindle load current of CNC machine tools [25], the load power and load current have the characteristics of “frequency domain generation and time domain acquisition”, and the acquisition signal has good sparseness after DCT processing. Due to the complex coupling of each component of the CNC machine tool directly, most of the electronic control data are time series data, and the correlation between the data is strong. DCT is used for the global conversion of time domain signals to frequency domain signals, which are still real numbers. Accordingly, the DCT is chosen for use in this paper.
A sample of the current signal from a CNC machine tool is taken as an example T i , as shown in Figure 1a. The results of applying the DCT to the data signal are shown in Figure 1b. During this step, raw signals from the time domain are mapped into the frequency domain F: T i F i . At this stage, the signal does not necessarily meet strict sparse requirements. In Figure 1c, the DCT coefficients are sorted in descending order. In Figure 1d, the absolute values of the DCT coefficients are sorted from large to small to show the distribution of DCT coefficients, which can be expressed as F i   s o r t e d .
Through some other processing, such as quantization, the required sparse characteristics can still be achieved. Most of the sparse coefficients F i   s o r t e d are concentrated near zero, but a small number of large sparse coefficients span a wide value range, making it difficult to divide the value range appropriately for subsequent processing. Therefore, a value range division method is needed that can preserve some large DCT coefficients to represent the key information of the raw data sequence T i while also quantizing small DCT coefficients to achieve sparsity. To date, there is no consensus on a standard quantization process, although value range partitioning, which usually retains a proportion of large DCT coefficients across 95% of the value range, and equal-step quantization methods are commonly employed. The two methods above have no basis in experimental data.
Currently, data quantization methods are generally divided into vector quantization and scalar quantization depending on the different inputs provided to the quantizer. Since the data considered in this paper are current data provided by a CNC machine tool, which are not expressed in vector form, a scalar quantization method is adopted here.
As established in the previous paragraph, the value range space of the current signal T i after DCT sparse basis transformation is quantized using the principle of scalar quantization. Scalar quantization can be divided into two types: quantization of a nonuniform distribution and quantization of a uniform distribution. From Figure 1d, it is evident that the distribution of the coefficient values after the DCT sparse basis transformation of the spindle current signal follows a quasiexponential distribution, which is not a uniform distribution. Therefore, uniform quantization of a nonuniform distribution is employed in this study. However, considering the complex working conditions of CNC machine tools, it is necessary to design a quantitative method that can adapt to a variety of working conditions to ensure the compression stability of electronic control data of CNC machine tools. In the quantization of a nonuniform distribution, the given source distribution F i   s o r t e d and corresponding quantizer levels are used to determine the step size that achieves the corresponding distortion rate.
Thus, the corresponding quantization intervals and target value range partitioning can be obtained. The formulas for calculating the distortion rate are as follows:
The step size of the quantization intervals is expressed as:
= 2 X m a x M + x
The distortion rate of the quantization intervals is expressed as:
σ p 2 = i = 1 M 2 ( i 1 ) i ( x 2 i 1 2 ) 2 f ( x ) d x + ( M 2 1 ) M ( x M 1 2 ) 2 f ( x ) d x
In this equation, M represents the number of quantization levels, and f ( x ) represents the probability distribution of the DCT coefficients. Since M is a constant and is an unknown.
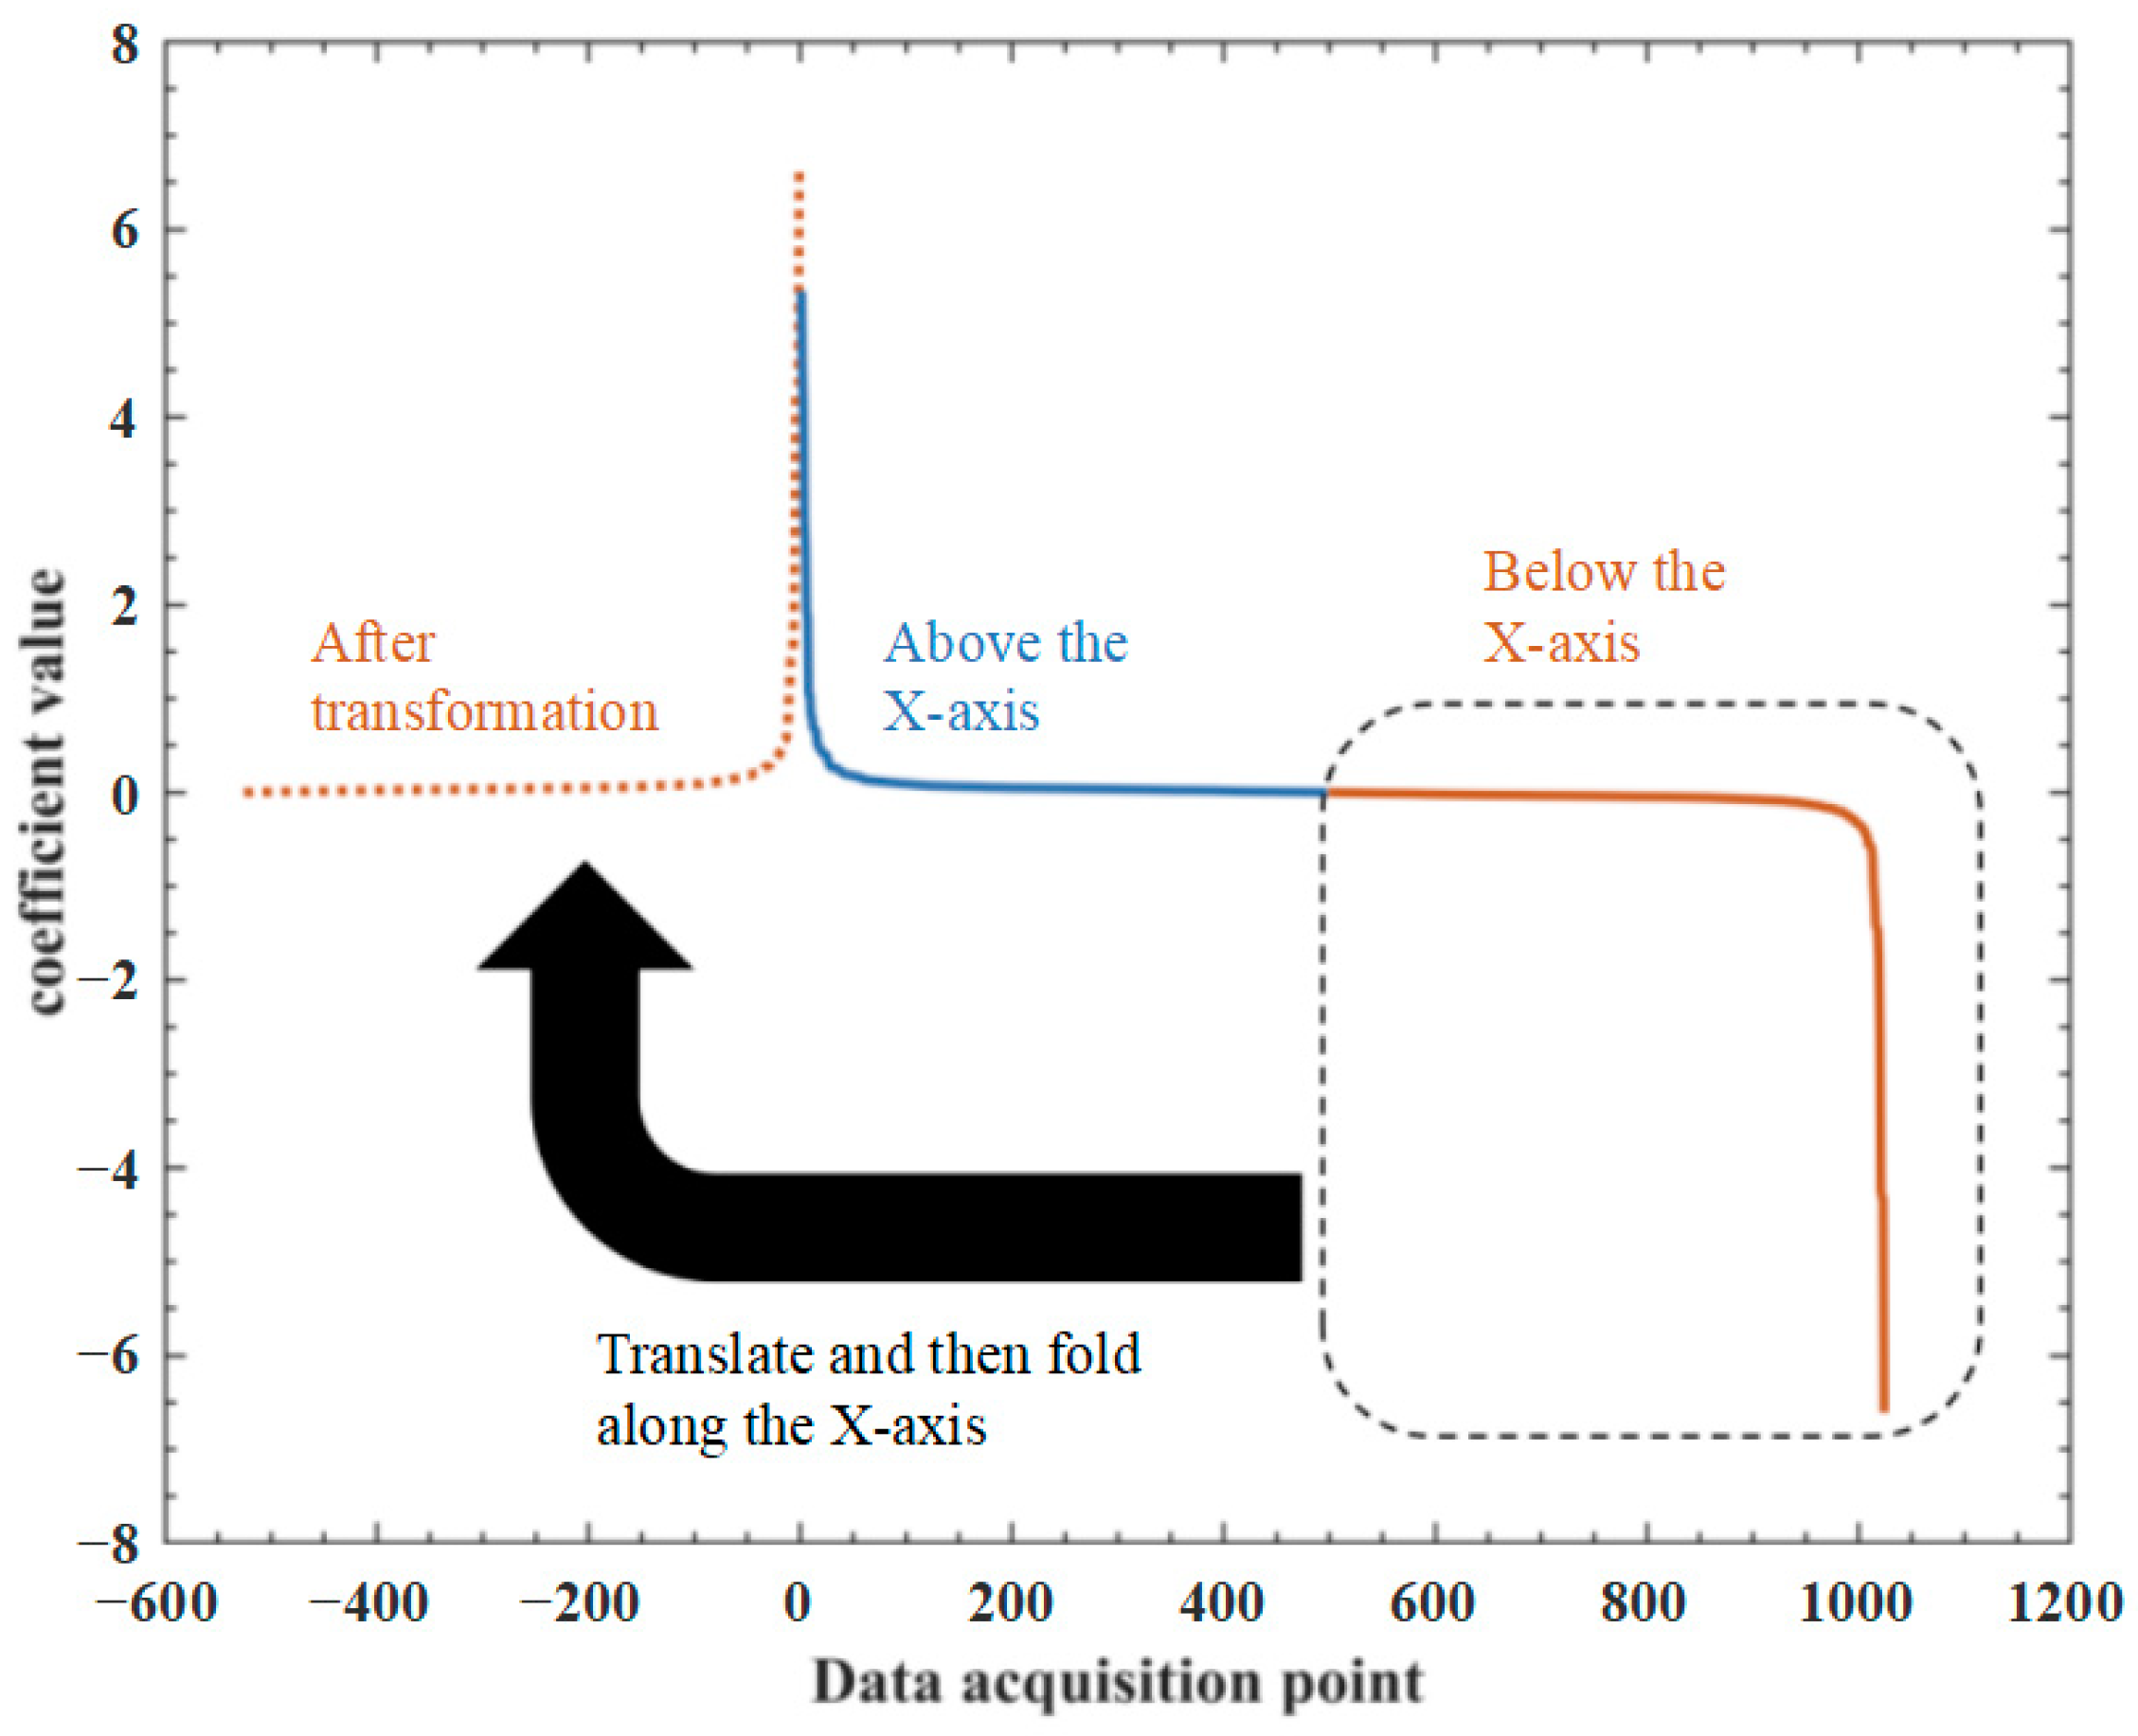
As the negative DCT coefficient in Figure 1c is shifted from the second quadrant and reversed to the fourth quadrant, it can be seen from Figure 2 that the distribution of such a DCT coefficient is very similar to the Laplace transform. In Equation (2), f ( x ) represents the probability distribution of the DCT coefficient, which resembles the Laplace distribution 0.5 b e x a c .
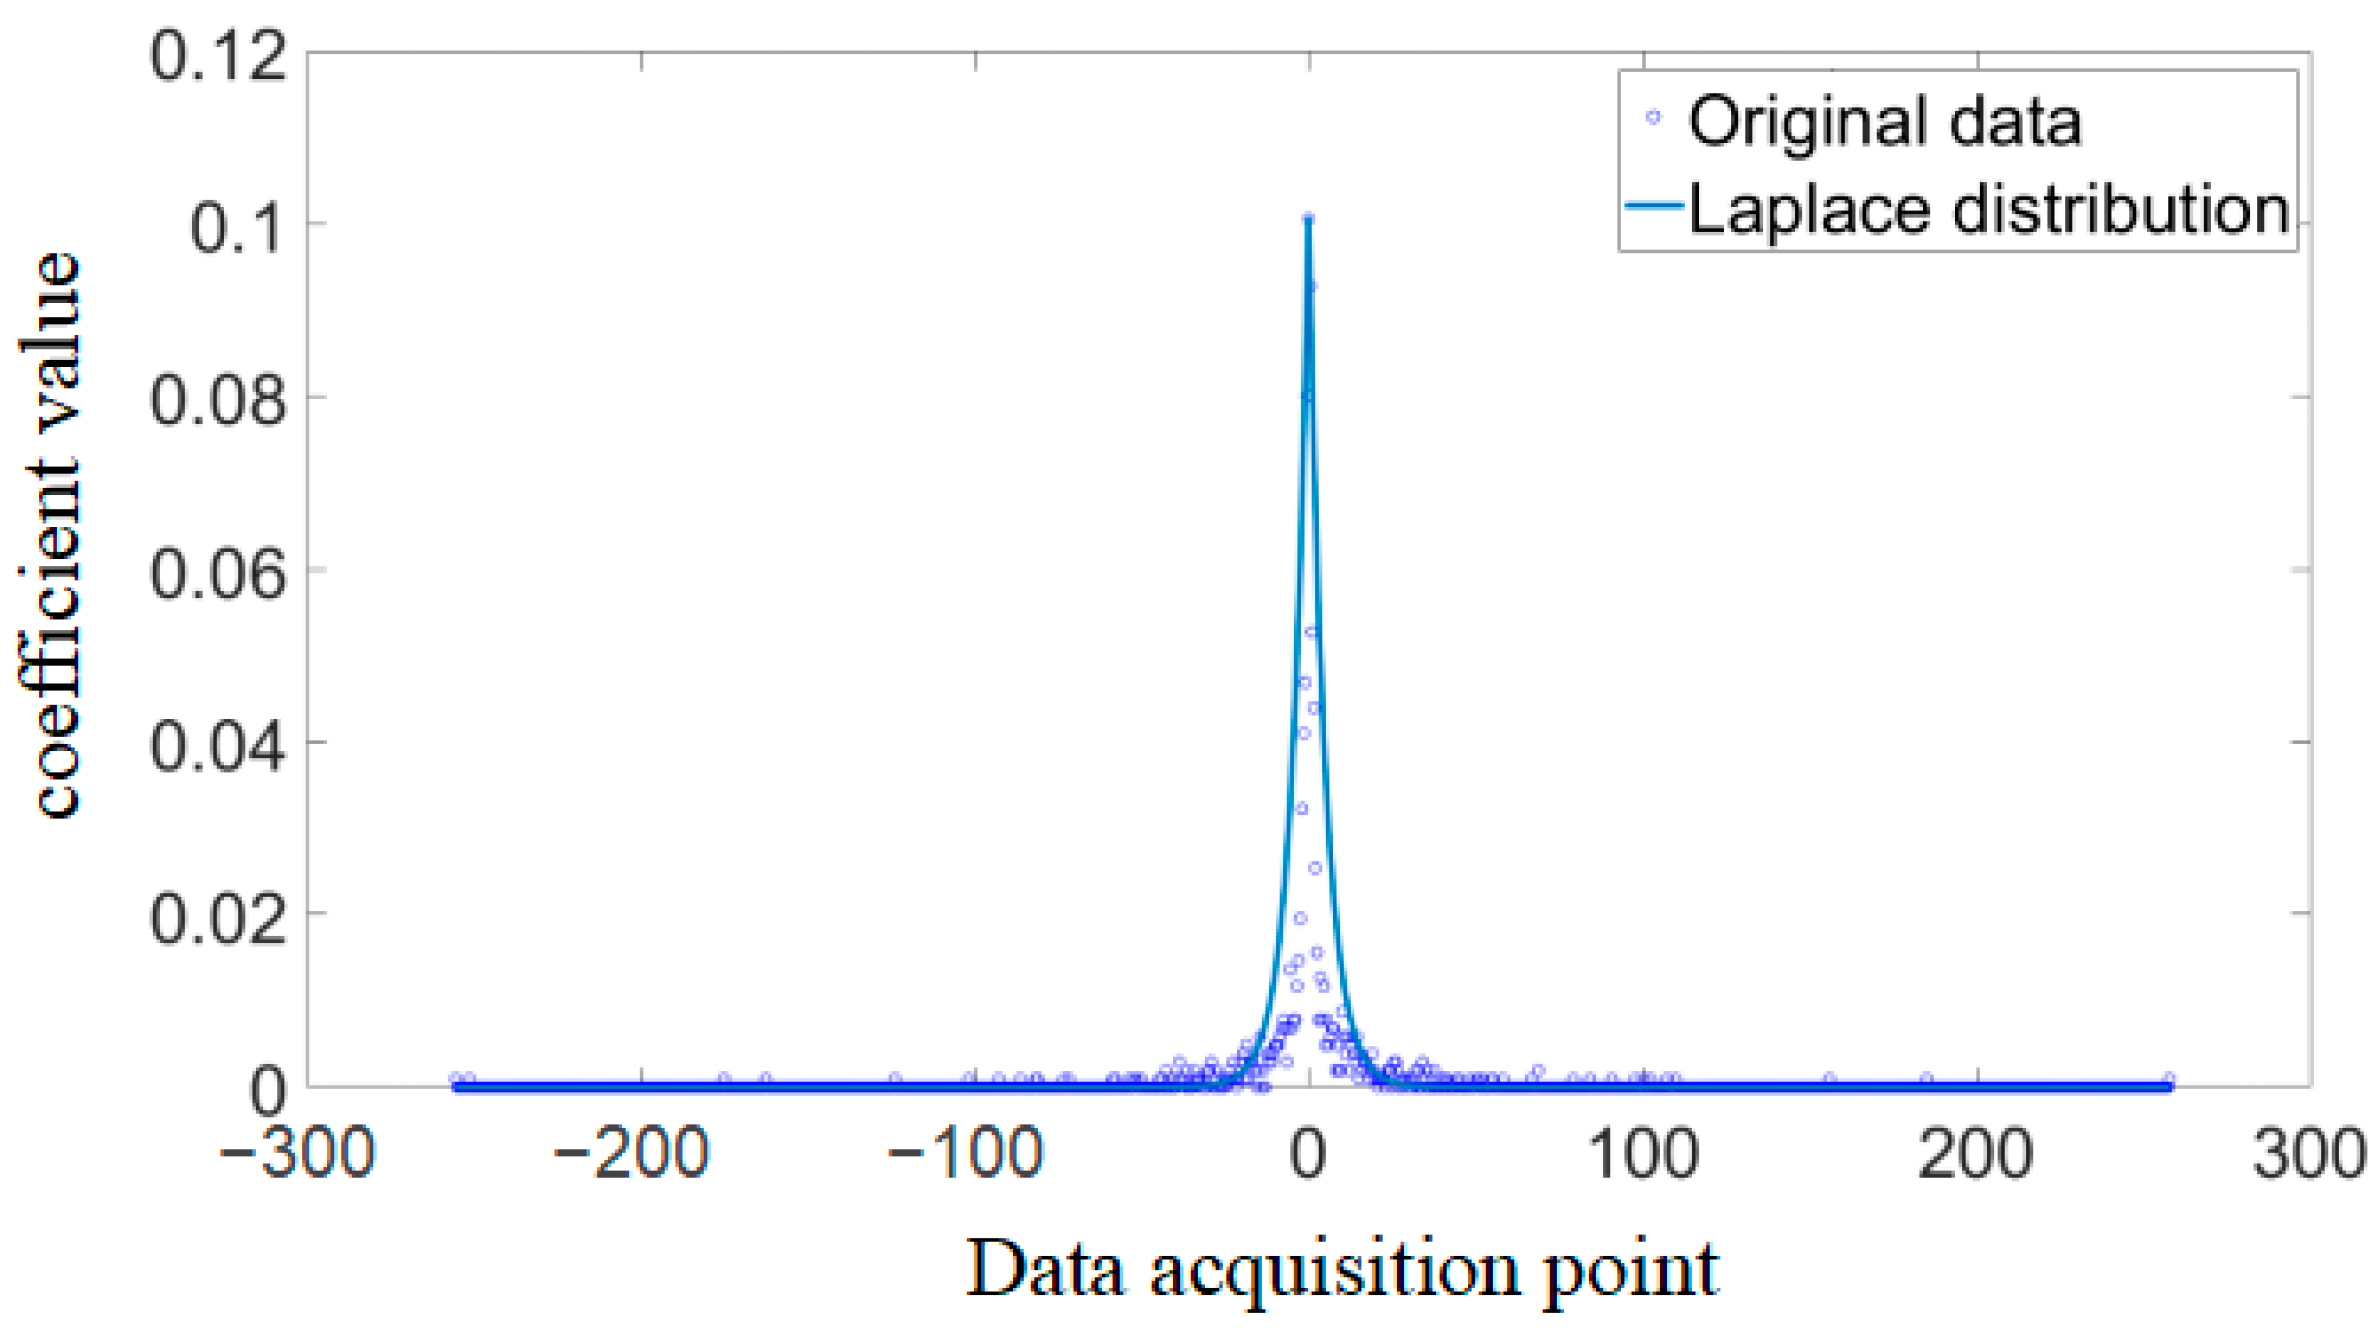
However, as shown in Figure 3, when the Laplace distribution is used to fit the current data curve, the error is still relatively large. As the values on the fitted curve approach zero, the DCT coefficient points strongly diverge from the fitted curve, indicating that the feasibility of the above formula is limited. Therefore, this paper proposes a probability distribution curve for the DCT coefficients that is more consistent with the distribution obtained after DCT processing. The formula for solving the curve fitting problem is as follows:
y = a e b | x c | d
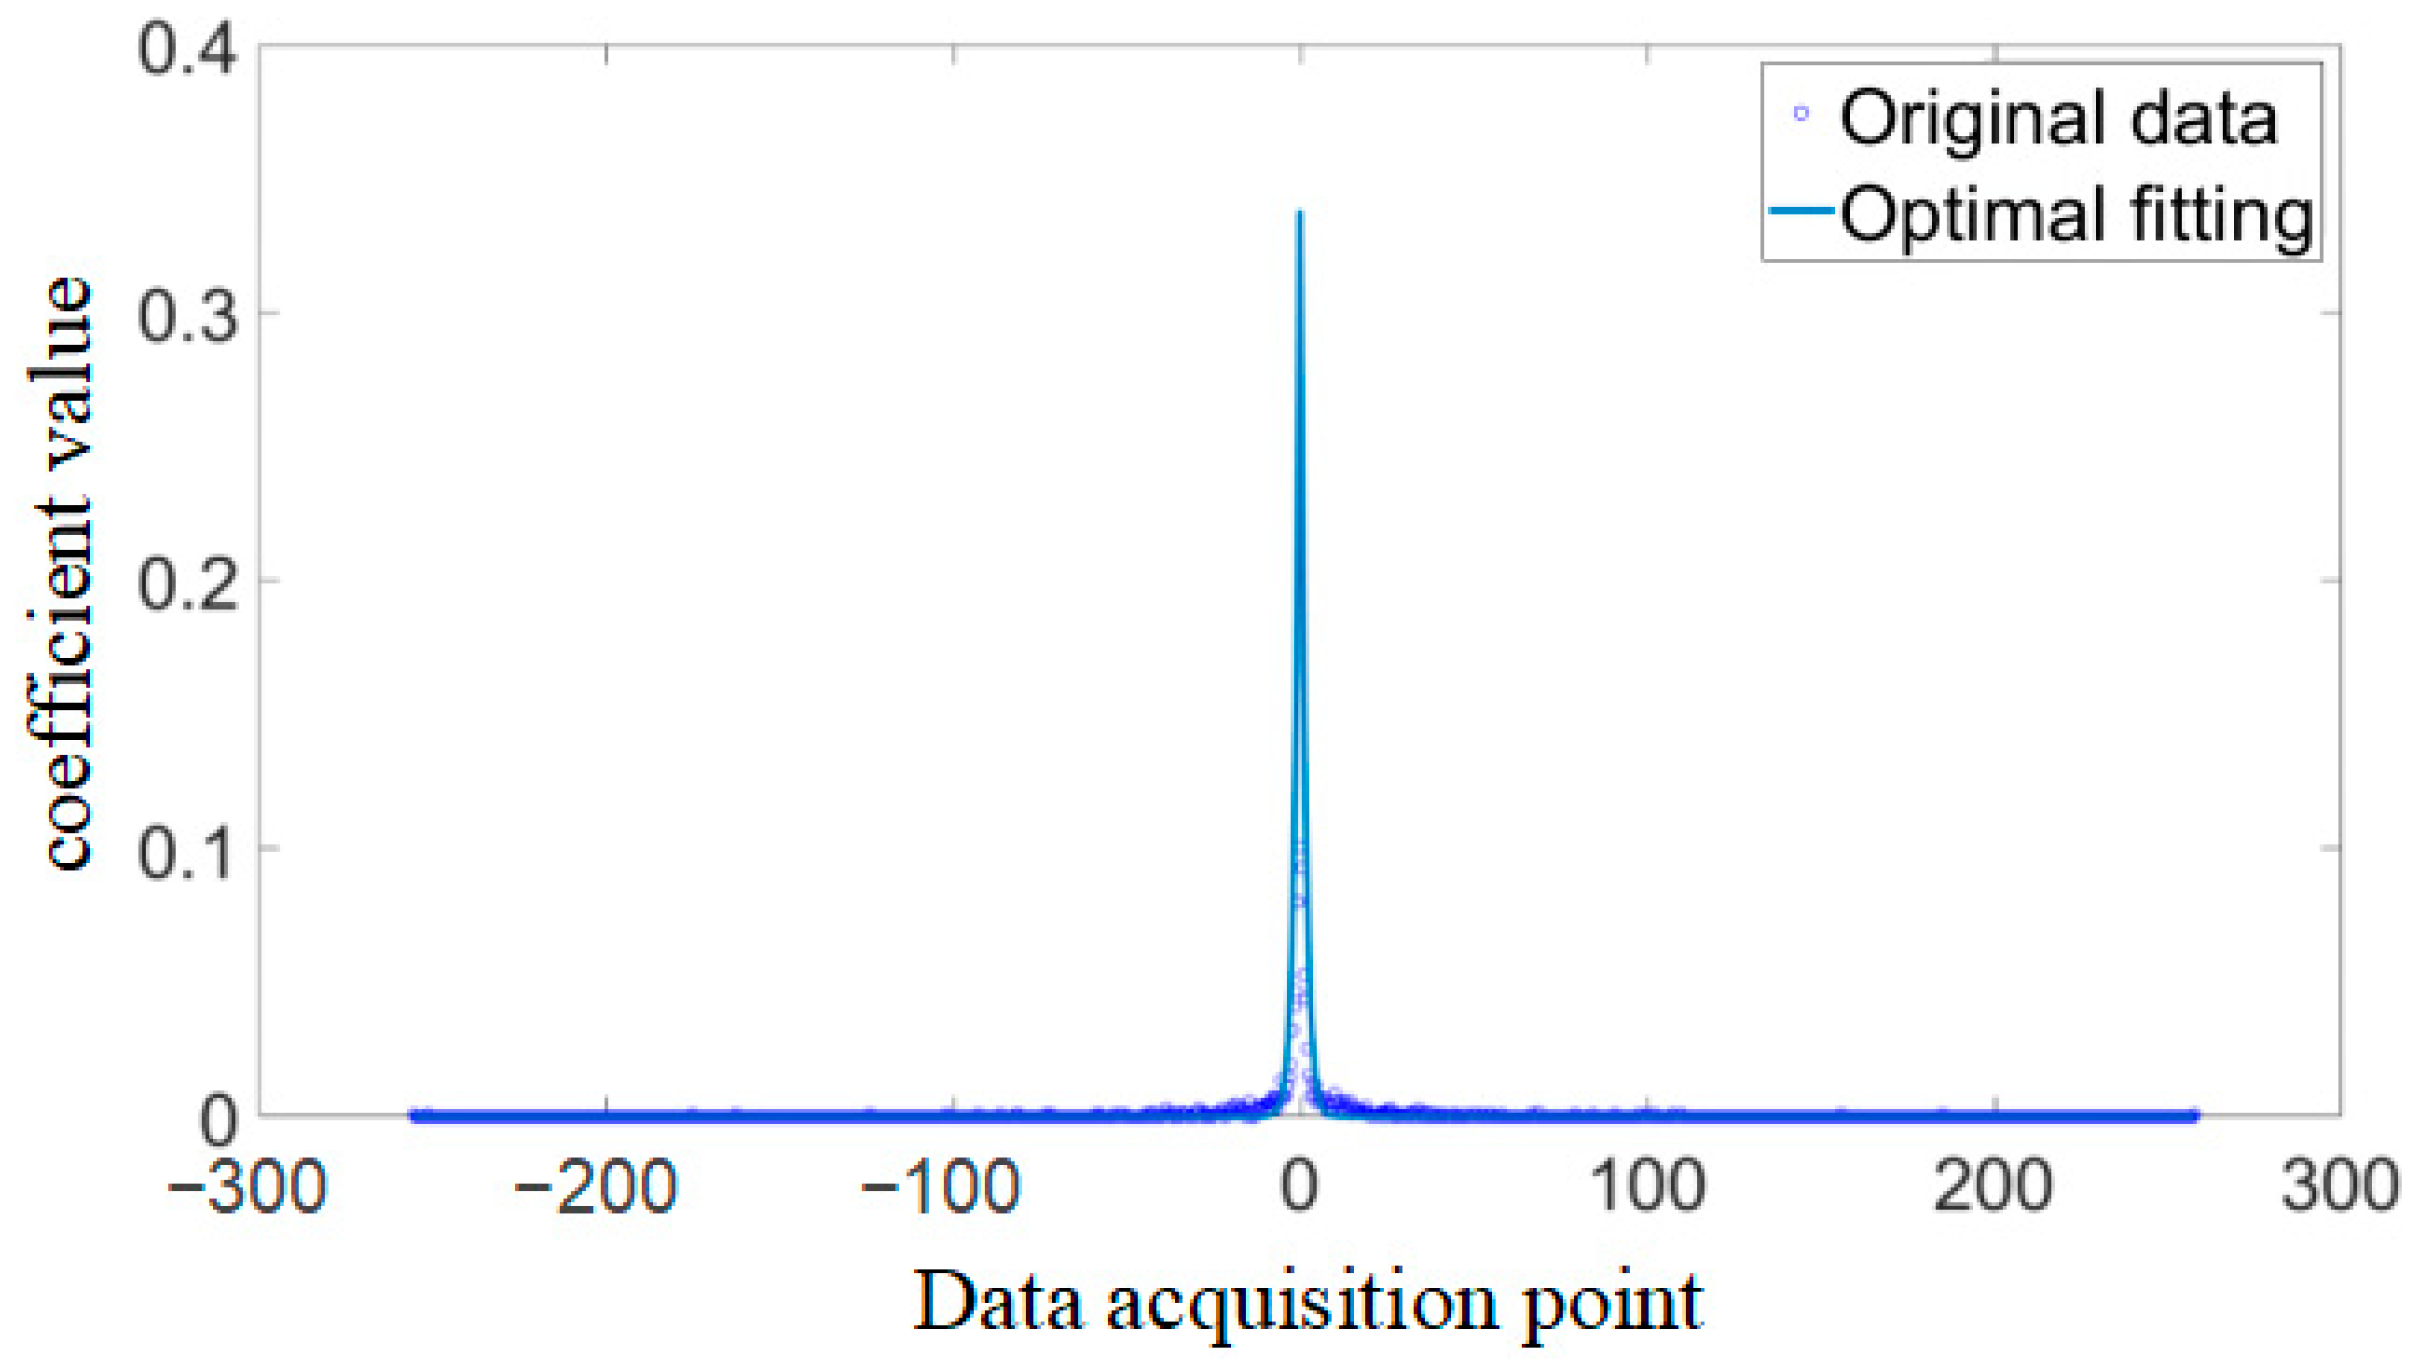
In this exponential equation, a represents the amplitude of the curve, b represents the span, c represents the median of the curve, and d represents the slope index at various points on the curve. The curve fitting results in Figure 4 clearly show that the probability density distribution of the DCT coefficients is basically consistent with the fitted curve, thus proving the feasibility of the proposed formula.
Furthermore, it can be observed from the formula for nonuniform quantization that the probability distribution f ( x ) of the DCT coefficients of the current signal is large when the data acquisition point is outside a range of M 2 1 . Many large DCT coefficients contain most of the information. Therefore, according to Equation (2), the second term of the distortion rate formula can be neglected, which can reduce the algorithm complexity and improve the accuracy, allowing us to rewrite the equation for the distortion rate as follows.
σ p 2 = i = 1 M ( i 1 ) i ( x 2 i 1 2 ) 2 f ( x ) d x
As shown in Equation (4), the calculated distortion rate is actually the probability of the relative variance of the DCT coefficient values. As the numerical value of the current signal of a CNC machine changes, the magnitude of the distortion rate will also fluctuate greatly, which is not conducive to the establishment of uniform standards. Therefore, the relative variance probability can be further optimized into the absolute error probability. This modification can fix the standard of the final distortion rate at a certain value, which is beneficial to the operation in practical programs. Using the absolute distortion rate to measure the value range isolation points of current data after DCT processing is a significant improvement over the previous empirical method, making the experimental results more scientifically based and justified.
Based on the above situation, this paper proposes an optimized algorithm for value range partitioning, which can quickly calculate the upper bound of value range partitioning for raw CNC machine tool current data after DCT processing and determine the size of the quantization step. This algorithm abandons the use of empirical values for quantization interval calculation as done in previous methods, providing a measurement standard and theoretical basis for the results and thus making them more practical and valuable in real-world applications.
The specific quantization process is shown in Algorithm 1.
Algorithm 1: Quantization Algorithm
Input:
Set of raw CNC machine tool spindle current signal samples Current; Threshold θ; Initial quantization step ; d     0.9
Output:
Quantization interval; Quantization step
1:function QA(Current, θ, ,   d )
2:  Randomly extract a data segment containing 1024 points in Current, denoted as Sample().
3:  Sample() was processed by DCT, denoted as Sample(DCT).
4:  Sort the absolute values of Sample(DCT) in descending order, denoted as SortedSample(DCT). //Conform to the data processing form
5:  Compute σ p according to Equation (4) with quantization step and SortedSample(DCT). //Get the initial quantization step and distortion rate
6:  While θ < σ p  do
7:     = × d
8:    Compute distortion rate σ p according to Equation (4) with quantization step and SortedSample(DCT).
9:  EndWhile //Get the quantization interval and step size
10:end function
The above pseudocode illustrates the steps of collecting current signals from a CNC machine, applying DCT processing and sorting, and then calculating the processed current signal data using Equation (4). By setting a certain value and continuously looping until σ p reaches industrial requirements, the upper limit of the quantization interval can be determined along with the step size to obtain a more scientifically based range of values.
The space complexity of the algorithm grows proportionally with the length of the current signal samples Current. The time complexity O ( N l o g N ) allows the algorithm to improve the overall compression quality by taking a small amount of computation time during the actual work of the CNC machine tools.
Compared to the previous approach of using empirical values to determine the range, this algorithm generates a series of value range intervals based on the current data produced by the CNC machine under different processing conditions, providing a more rational basis for range determination rather than relying solely on empirical values. Notably, when methods based on empirical values encounter special processing situations, such as significant fluctuations, the partitioning range can differ significantly from that encountered under normal conditions, leading to a loss of effective information or an increase in redundant information and thus resulting in large reconstruction errors.
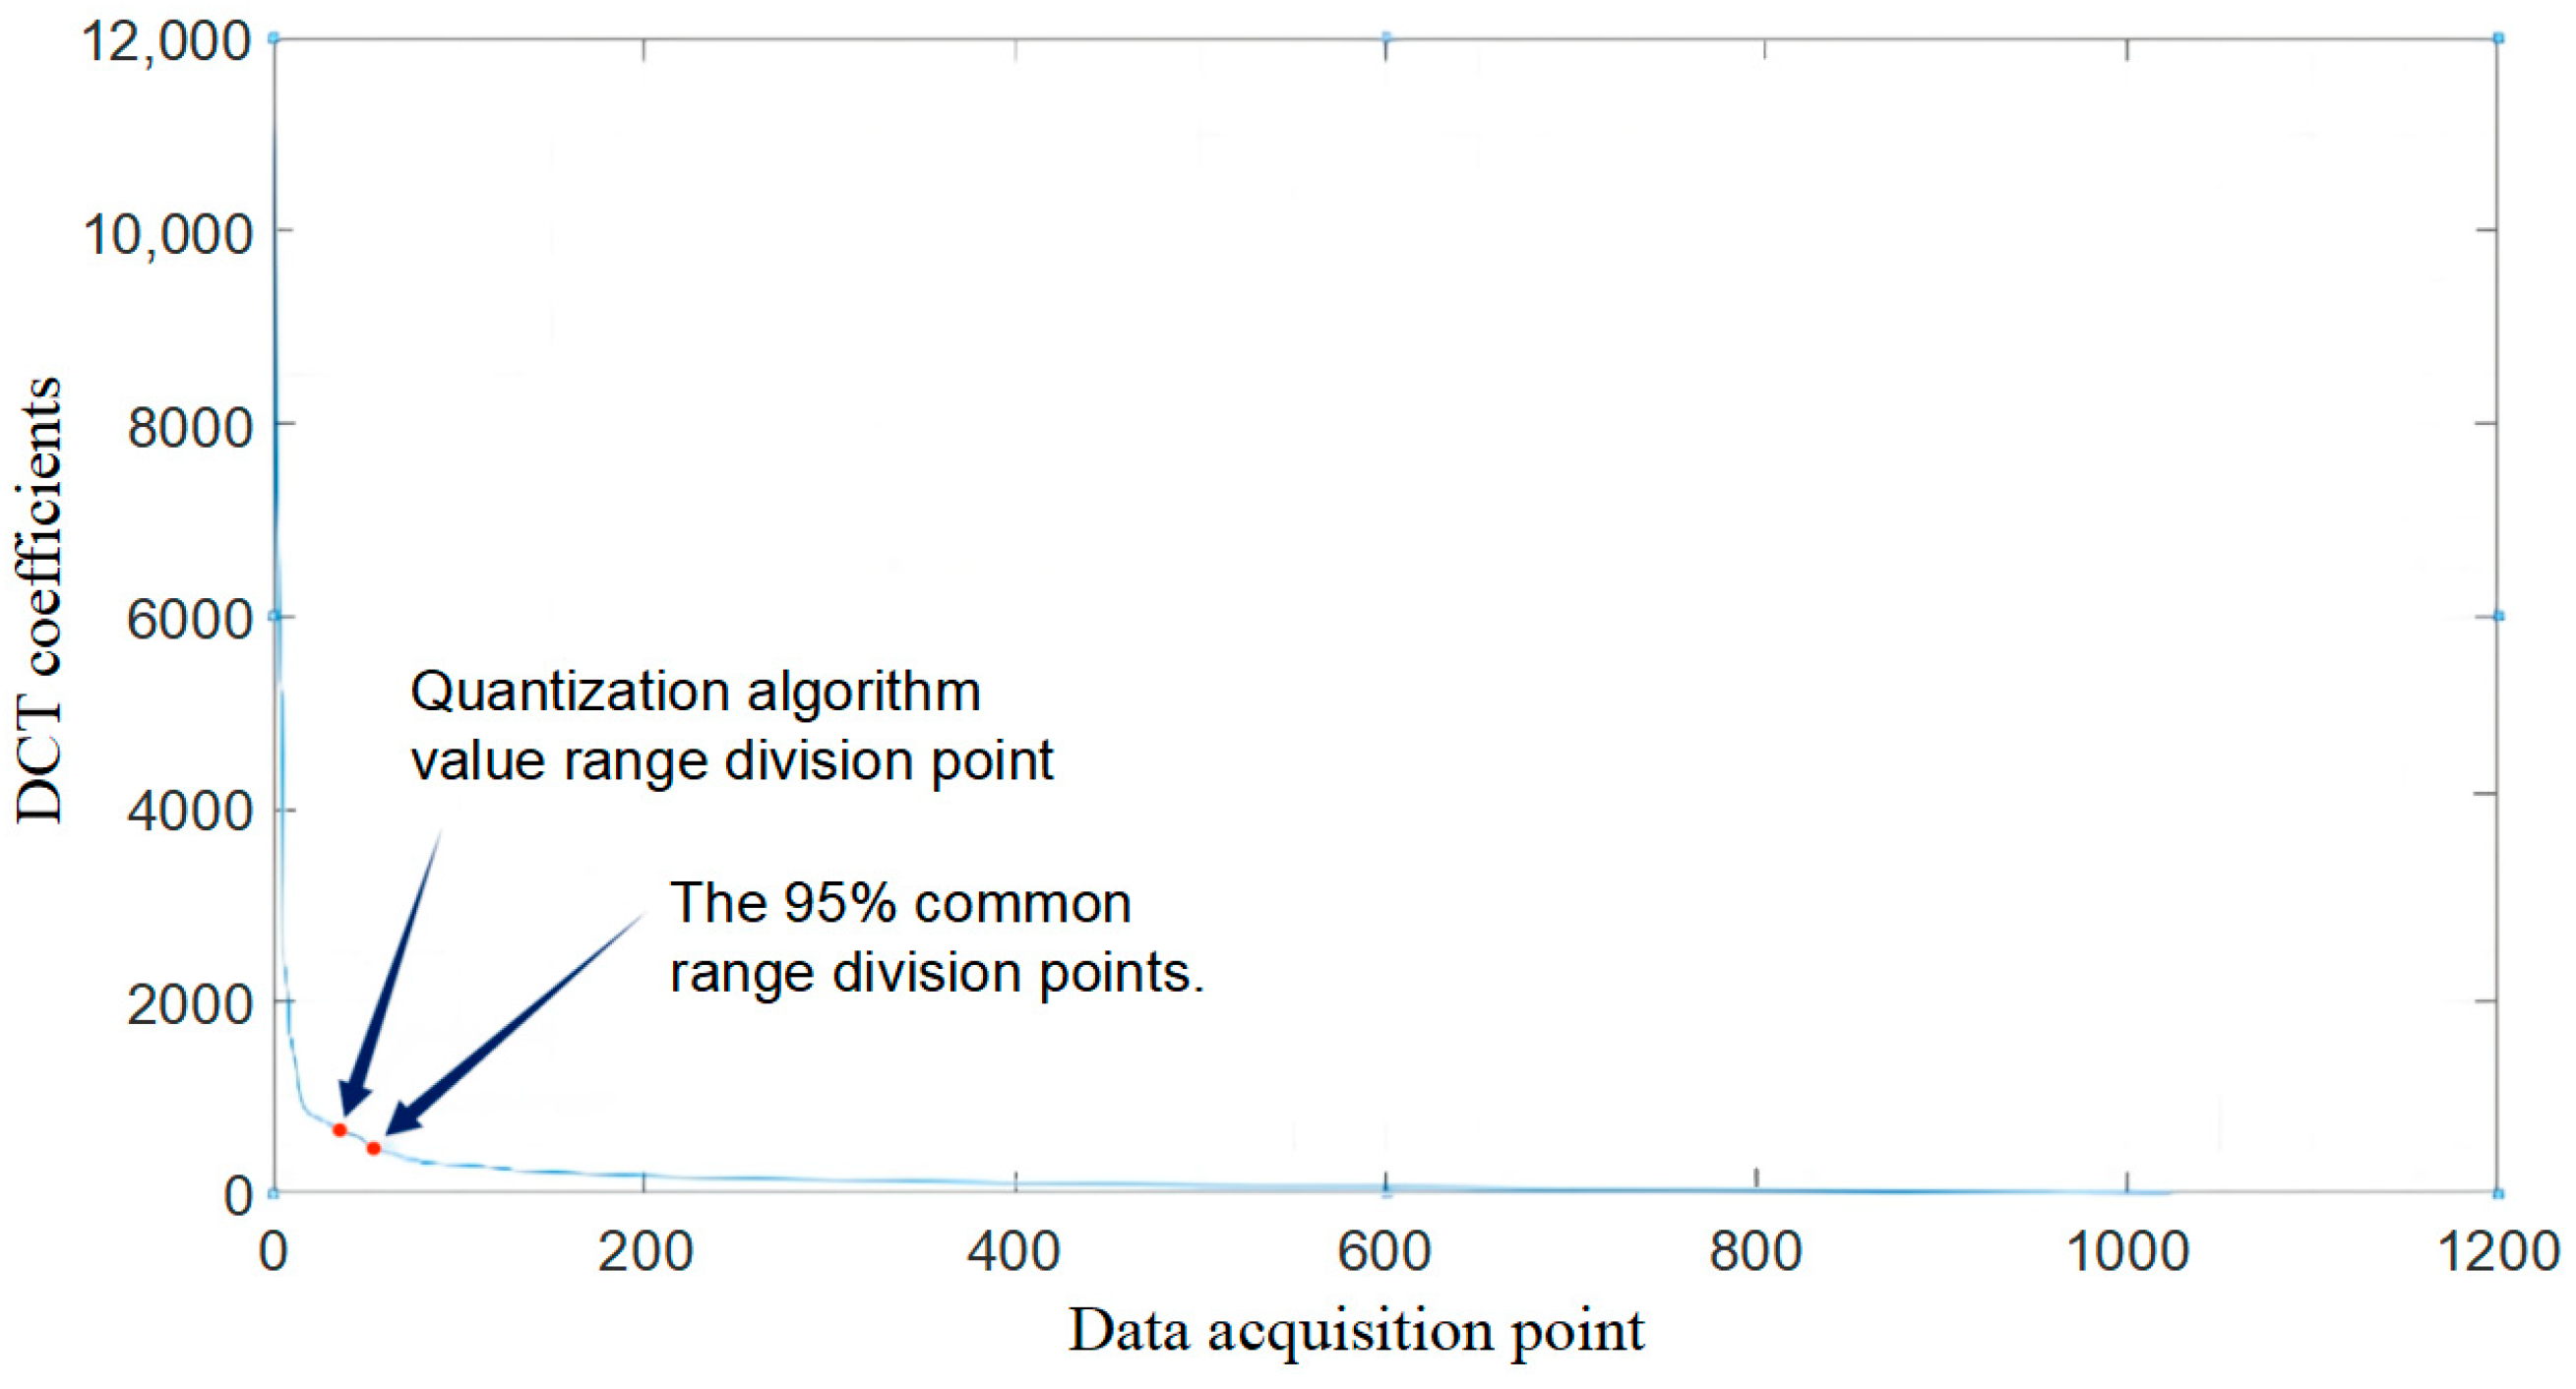
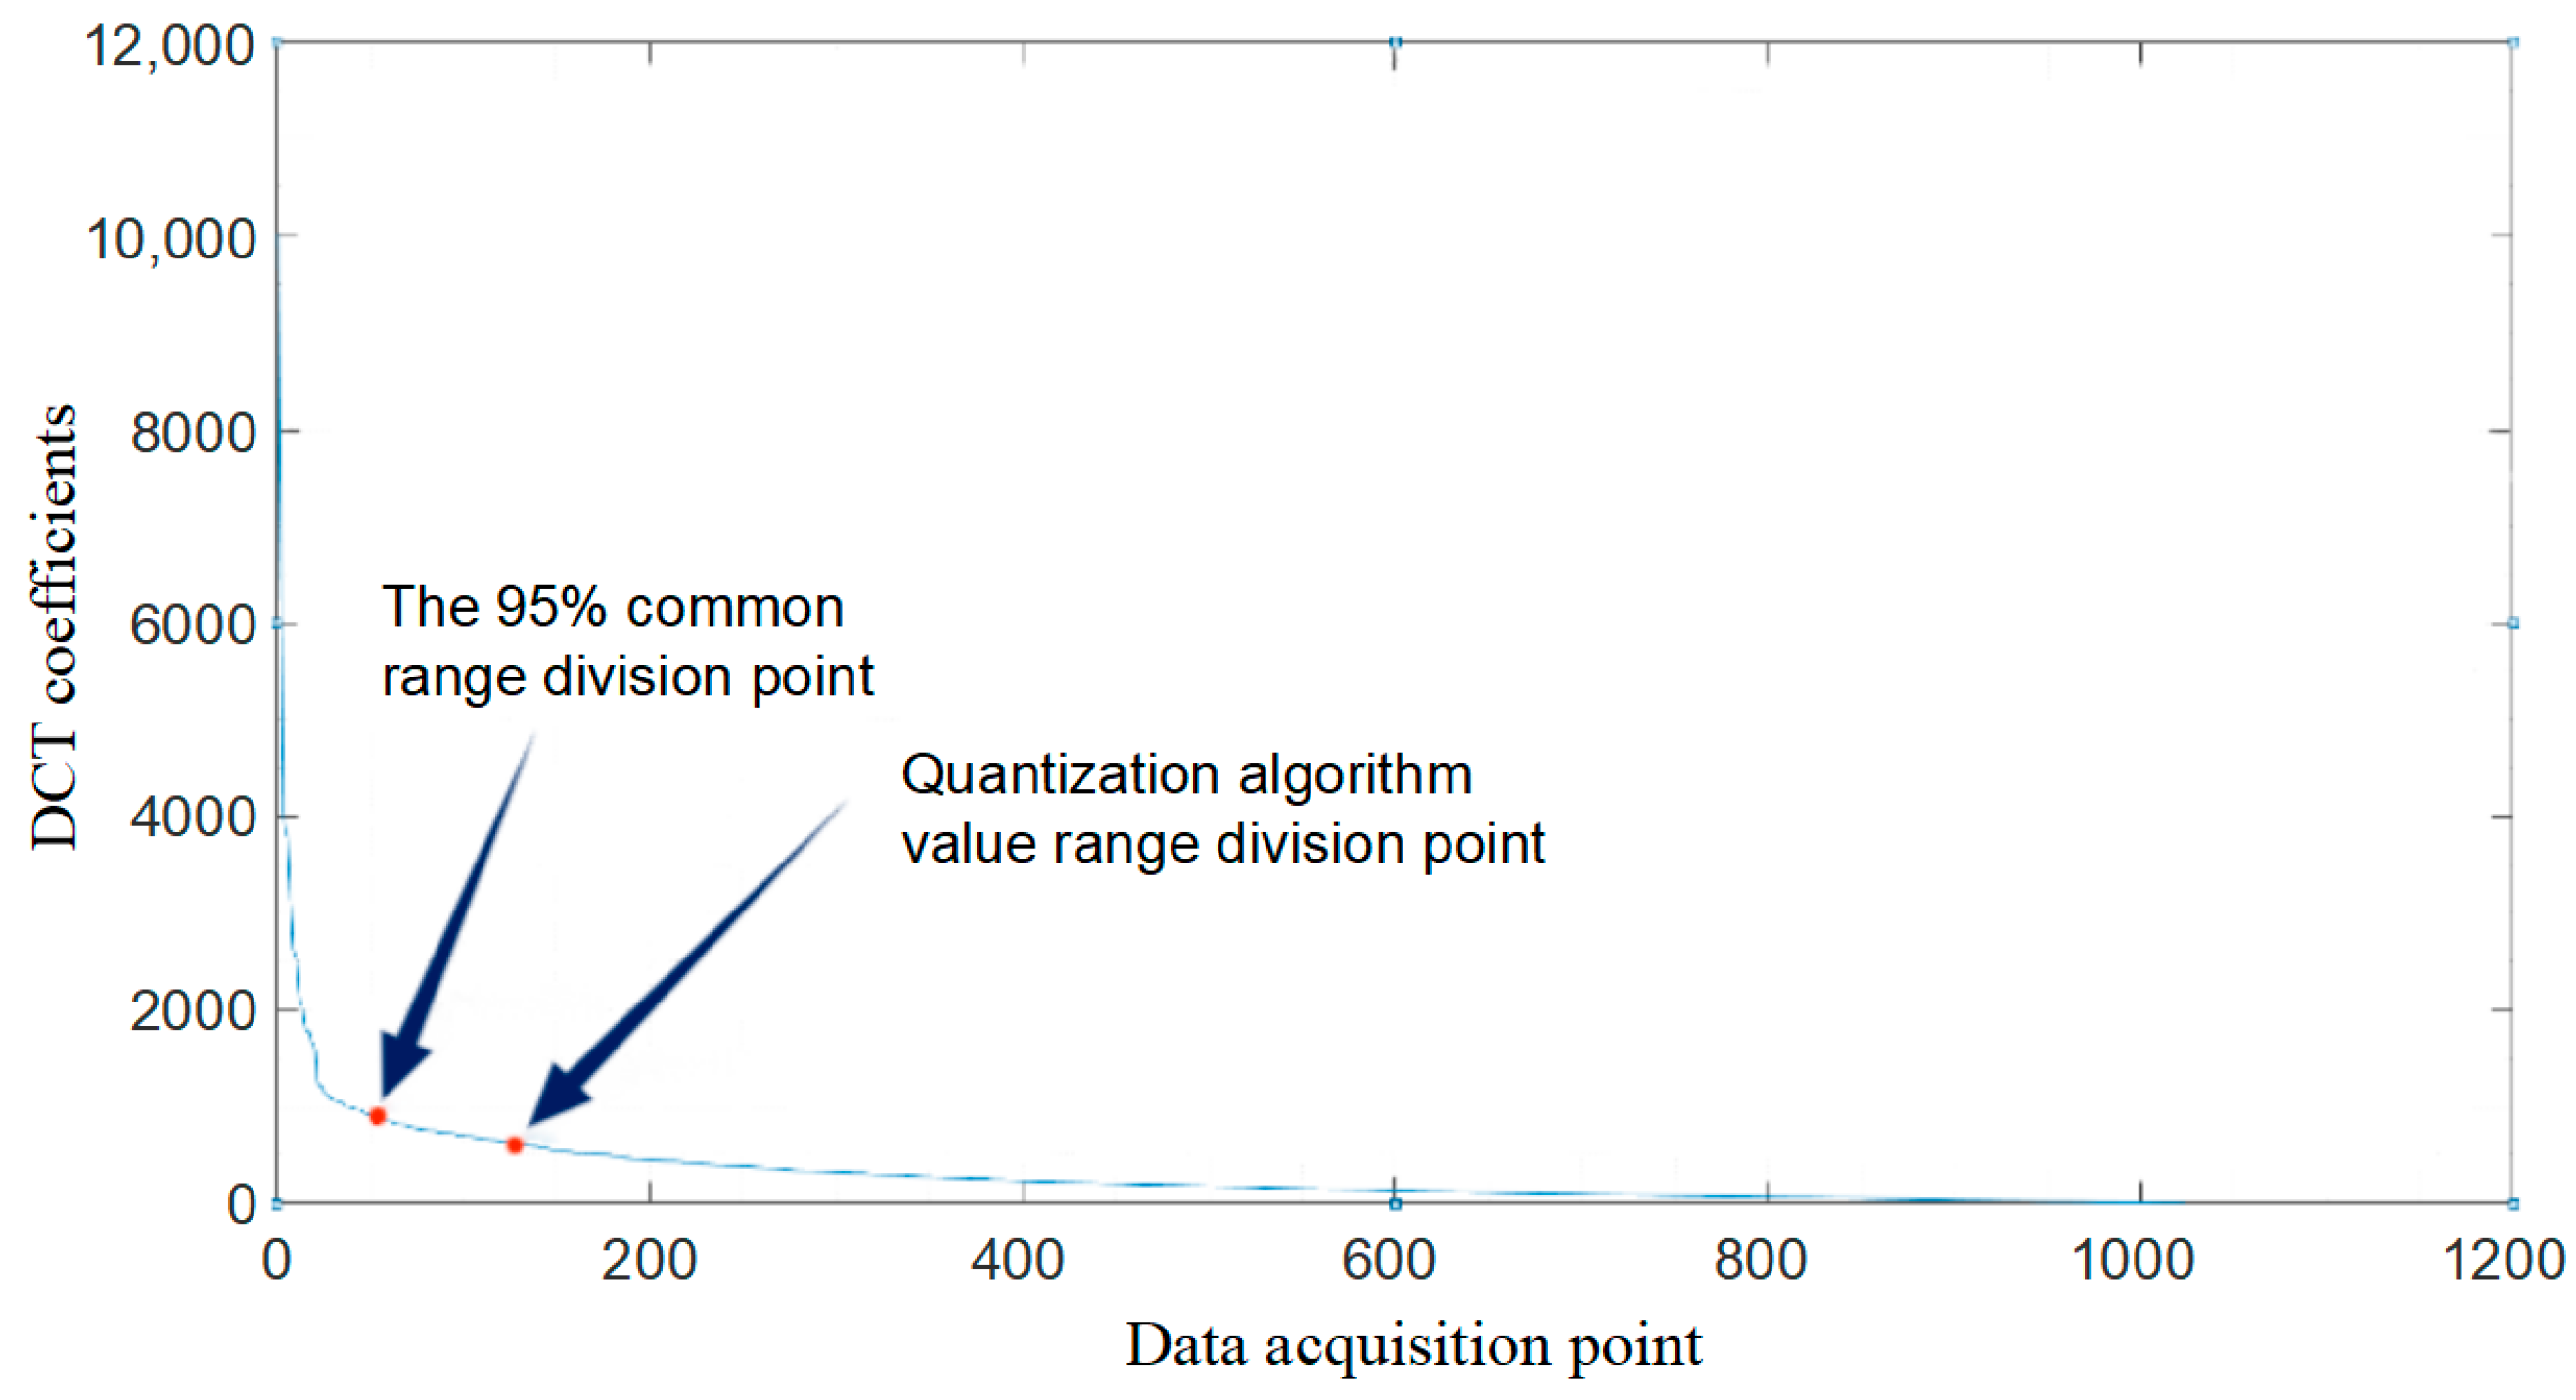
For a more detailed comparison, 1024 coefficient points were selected for this study from the current data collected from the CNC machine tool under certain conditions, and the absolute values of the DCT coefficients were then sorted. The range division point generated by the algorithm based on Equation (4) and the empirical division point used in previous methods are compared in Figure 5.
Under normal processing conditions, the range division points generated by the two different methods are different, with the empirical division point being lower than the algorithm-derived division point. The difference is not particularly significant; however, in the case of an abnormal fluctuation, as seen in Figure 6, the empirical division point is considerably higher than the algorithm-derived division points. This indicates that the empirical value can only somewhat approximate the range division point calculated on the basis of Equation (4) and cannot completely reproduce it. Moreover, for the 1024 sequential points extracted under an abnormal fluctuation, the difference between the empirical and algorithm-derived division points is as large as 70 to 80 coefficient points, representing an error of up to 8%.
From the above data comparison, it can be seen that using empirical values as a method of measurement is relatively unstable. Some large DCT coefficients with much information will be quantized, or the quantized part will be less, which will lead to serious data loss or insufficient compression, resulting in very unstable compression of CNC data. The disadvantage of using empirical values is that without a theoretical basis as a background, the effectiveness of the selected value range division points in measuring the range of electrical control data cannot be sufficiently proven. Therefore, the above algorithm is proposed to identify the value range division points based on the operating conditions of the electrical control data separately, making the selected division points more convincing.

4. Experiments and Evaluation

In this section, we describe the experimental setup for evaluating our proposed method and discuss the performance results.

4.1. Experimental Settings

The CNC control data used in this paper were obtained from the testing and processing workshop of Wuhan Huazhong Numerical Control Co., Ltd., which locates in Wuhan City, China. The CNC lathe equipment model used was HNC-808TA; the CNC machining center model used was JMAST-VMC-V6; the size of the milling cutter used was 6 mm, and the size of the flat file used was 8 mm (three-blade aluminum milling cutter). The data were collected while processing 7075 aluminum raw materials. The data collection software packages used were SSTT (Huazhong Numerical Control Data Acquisition System) for collecting data from the CNC milling machines and lathes and Industrial Big Data Visualization Platform (IBA) for collecting electrical control data from the CNC milling machines. The sampling rating is 1 ms. Our experiments were conducted on a CPU running Windows i7-9700 with 16 GB RAM using MATLAB R2020b.

4.2. Experimental Analysis

In the actual operation of CNC machine tools, the data upload cycle is 200 ms, and the data compression requirement is mainly real-time compression. Therefore, the processing method of segmentation compression is generally used. According to the actual situation mentioned above, the following experimental results are based on a randomly selected set of 1024 sequential data points drawn from the spindle load current data collected during stable machining of a complex part using a CNC machining center. Embedded Zerotree Wavelet (EZW) compression was performed on the data set with the large coefficient removed, the Haar wavelet base was selected for the wavelet, the number of bits of the original data and the number of bits of the EZW code stream were calculated, and the ratio of the two was calculated. Moreover, 64 bits of spindle current data were compressed, and the compression ratio was 32%.
Considering the overall experimental rigor, this paper collected the spindle load current of the CNC machining center under four working conditions: stable processing, fluctuating conditions, normal processing and abnormal processing of the computer shell. Different thresholds are set for the four working conditions. Whenever the calculated distortion rate σ p is lower than the threshold θ , the quantization step is reduced, and the distortion rate σ p is recalculated according to Equation (4). When the distortion rate σ p is higher than the threshold θ , the quantization step and the corresponding quantization interval can be obtained. The detailed experimental results of the four working conditions are shown in the following figures.
As shown in Figure 7, Panel (a) shows the experimental situation of the load current, Panel (b) shows the absolute-value-sorted current DCT coefficients after value range division, and Panel (c) shows the absolute-value-sorted current DCT coefficients after quantization. The DCT coefficient error is within 0.1.
The operating condition shown in Figure 8 is an experimental situation in which a set of 1024 sequential data points was randomly selected from the spindle load current data collected from a CNC machining center under fluctuating conditions during the machining of a certain brand of computer shell. Figure 8 also shows the error before and after quantization.
The condition shown in Figure 9 corresponds to spindle load current data collected from a CNC machining center during normal processing of a certain complex part, again based on 1024 randomly extracted sequential data points. This figure also shows the quantization error under normal machining conditions.
The scenario shown in Figure 10 is an experimental situation in which the spindle load current data were collected during the processing of the sample complex part represented in the above figure using a CNC machining center under abnormal machining conditions. A corresponding period of 1024 sequential data points was captured. This figure also illustrates the error before and after quantization under abnormal machining conditions.
The above experimental results indicate that all quantization errors are below 0.3. Furthermore, as a commonly used method to measure the quality of signal reconstruction in fields such as compression [34], the peak signal-to noise ratio (PSNR) of the improved quantization method is introduced as one of the criteria to measure the quality of the experimental results. The average relative error and compression ratio of the empirical quantization method and improved quantization method are also introduced to evaluate the experimental results. All of the above experimental evaluation indexes are shown in Table 1.
It can be seen from the above reconstruction experiments that the average relative errors of the data in all four cases are small and the reconstruction errors are also within an acceptable range. However, when using the proposed quantization evaluation system, it may lead to a relatively small increase in the compression ratio in some cases when the CNC equipment is in an abnormal machining state to ensure data reconstruction accuracy. Determining how to handle this issue will be an important problem to address in future research.

5. Conclusions

Starting from the characteristics of the electrical control data of CNC machine tools, this paper selects sparse bases for the control data collected from CNC milling machines to fit the probability density distribution of the quantization errors in scalar quantization experiments. A new quantization evaluation system is proposed such that in subsequent experiments, the relative curve error before and after quantization is used as the evaluation criterion. The probability density function is used in place of the empirical values previously used in the scalar quantization process to determine the quantization interval, making the experimental results more stable and effective. The proposed method can help to improve the compression effect of the electrical control data from CNC machine tools, providing a solid theoretical foundation for such processing and facilitating the further integration of industrial big data and compressive sensing theory.
At present, the quantization method proposed in this paper is only combined with EZW coding for compression and has not been jointly tested with other coding methods. Only four working conditions of CNC milling machines are tested. More comprehensive research can be done in the future.

Supplementary Materials

The following supporting information can be downloaded at: https://www.mdpi.com/article/10.3390/electronics12163387/s1.

Author Contributions

W.H. is in charge of Methodology, Software, Validation and Writing-Original Draft. H.Z. is in charge of the Investigation and Conceptualization. J.Y. is in charge of Investigation Conceptualization and Supervision. E.H. is in charge of the Conceptualization and Methodology. C.D. is in charge of the Software, Validation, Writing-Reviewing and Editing. All authors have read and agreed to the published version of the manuscript.

Funding

This work was supported by the National Center of Technology Innovation for Intelligent Design and Numerical Control (NCDC), Huazhong University of Science and Technology. This work was funded by the Hubei Province Science and Technology Major Project, China (grant no. 2021AAB001) and National High-quality Development Program, China (grant no. CEIEC-2021-ZM02-0171).

Data Availability Statement

Data are contained within the article or Supplementary Material.

Conflicts of Interest

The authors declare no conflict of interest.

References

  1. Ghobakhloo, M. Industry 4.0, digitization, and opportunities for sustainability. J. Clean. Prod. 2020, 252, 119869. [Google Scholar] [CrossRef]
  2. Xu, X.; Lu, Y.; Vogel-heuser, B.; Wang, L. Industry 4.0 and industry 5.0inception, conception and perception. J. Manuf. Syst. 2021, 61, 530–535. [Google Scholar] [CrossRef]
  3. Sofic, A.; Rakic, S.; Pezzotta, G.; Markoski, B.; Arioli, V.; Marjanovic, U. Smart and resilient transformation of manufacturing firms. Processes 2022, 10, 2674. [Google Scholar] [CrossRef]
  4. Salunkhe, O.; Berglund, A.F. Industry 4.0 enabling technologies for increasing operational flexibility in final assembly. Int. J. Ind. Eng. Manag. 2022, 13, 38–48. [Google Scholar] [CrossRef]
  5. Xu, L.D.; He, W.; Li, S. Internet of things in industries: A survey. IEEE Trans. Ind. Inform. 2014, 10, 2233–2243. [Google Scholar] [CrossRef]
  6. Khan, W.; Rehman, M.; Zangoti, H.; Afzal, M.; Armi, N.; Salah, K. Industrial internet of things: Recent advances, enabling technologies and open challenges. Comput. Electr. Eng. 2020, 81, 106522. [Google Scholar] [CrossRef]
  7. Haoran, Z.; Jianhua, L.; Hui, X.; Cunbo, Z.; Tian, M.; Jinshan, L.; Bin, W. 3D visualization real-time monitoring method for digital twin workshop. Comput. Integr. Manuf. Syst. 2019, 25, 1432–1443. [Google Scholar]
  8. Hendrawan, Y.M.; Simba, K.R.; Uchiyama, N. Iterative learning contouring controller based on trajectory generation with linearly interpolated contour error estimation and bézier reposition trajectory for computerized numerical control machine tool feed drive systems. Adv. Mech. Eng. 2019, 11, 168781401986810. [Google Scholar] [CrossRef] [Green Version]
  9. Wang, W.; Tian, G.; Chen, M.; Tao, F.; Zhang, C.; Ai-ahmari, A.; Li, Z.; Jiang, Z. Dual-objective program and improved artificial bee colony for the optimization of energy-conscious milling parameters subject to multiple constraints. J. Clean. Prod. 2020, 245, 118714. [Google Scholar] [CrossRef]
  10. Zhou, J.; Li, P.; Zhou, Y.; Wang, B.; Zang, J.; Meng, L. Toward new-generation intelligent manufacturing. Engineering 2018, 4, 11–20. [Google Scholar] [CrossRef]
  11. Shi, W.; Cao, J.; Zhang, Q.; Li, Y.; Xu, L. Edge computing: Vision and challenges. IEEE Internet Things J. 2016, 3, 637–646. [Google Scholar] [CrossRef]
  12. Passian, A.; Buchs, G.; Seck, C.M.; Marino, A.M.; Peters, N.A. The concept of a quantum edge simulator: Edge computing and sensing in the quantum era. Sensors 2022, 23, 115. [Google Scholar] [CrossRef] [PubMed]
  13. Sonmez, C.; Ozgovde, A.; Ersoy, C. Edgecloudsim: An environment for performance evaluation of edge computing systems. In Proceedings of the 2017 Second International Conference on Fog and Mobile Edge Computing (FMEC), Valencia, Spain, 8–11 May 2017. [Google Scholar] [CrossRef]
  14. Xu, D.; Li, Q.; Zhu, H. Energy-saving computation offloading by joint data compression and resource allocation for mobile-edge computing. IEEE Commun. Lett. 2019, 23, 704–707. [Google Scholar] [CrossRef]
  15. Lu, Y.; Wang, Y. A physics-constrained dictionary learning approach for compression of vibration signals. Mech. Syst. Signal Process. 2021, 153, 107434. [Google Scholar] [CrossRef]
  16. Silva LR, M.; Filho LM, D.A.; Duque, C.A. Sparse representation algorithm applied to power systems signal compression. Int. Trans. Electr. Energy Syst. 2019, 29, e2693. [Google Scholar] [CrossRef] [Green Version]
  17. Ghaffari, A. Image compression-encryption method based on two-dimensional sparse recovery and chaotic system. Sci. Rep. 2021, 11, 369. [Google Scholar] [CrossRef] [PubMed]
  18. Wen, L.; Gao, L.; Li, X. A new deep transfer learning based on sparse auto-encoder for fault diagnosis. IEEE Trans. Syst. Man Cybern. Syst. 2019, 49, 136–144. [Google Scholar] [CrossRef]
  19. Tang, Z.; Chen, Z.; Bao, Y.; Li, H. Convolutional neural network-based data anomaly detection method using multiple information for structural health monitoring. Struct. Control Health Monit. 2019, 26, e2296. [Google Scholar] [CrossRef] [Green Version]
  20. Xu, S.; Zhang, J.; Bo, L.; Li, H.; Zhang, H.; Zhong, Z.; Yuan, D. Singular vector sparse reconstruction for image compression. Comput. Electr. Eng. 2021, 91, 107069. [Google Scholar] [CrossRef]
  21. Kalluri, M.; Jiang, M.; Ling, N.; Zheng, J.; Zhang, P. Adaptive rd optimal sparse coding with quantization for image compression. IEEE Trans. Multimed. 2019, 21, 39–50. [Google Scholar] [CrossRef]
  22. Erb, W. Graph wedgelets: Adaptive data compression on graphs based on binary wedge partitioning trees and geometric wavelets. IEEE Trans. Signal Inf. Process. Over Netw. 2023, 9, 24–34. [Google Scholar] [CrossRef]
  23. Chen, J.; Yang, J.; Zhou, H.; Xiang, H.; Zhu, Z.; Li, Y.; Lee, C.; Xu, G. Cps modeling of cnc machine tool work processes using an instruction-domain based approach. Engineering 2015, 1, 247–260. [Google Scholar] [CrossRef] [Green Version]
  24. Shen, P.; Huang, B.; Wang, L. Range division and linearization algorithm for a class of linear ratios optimization problems. J. Comput. Appl. Math. 2019, 350, 324–342. [Google Scholar] [CrossRef]
  25. Li, X.; Zhang, P.; Hui, E.; Chen, G. Based on embedded zerotree wavelet coding data compression algorithm research of nc machine tool control system. In Proceedings of the 2019 4th International Conference on Mechanical, Control and Computer Engineering (ICMCCE), Hohhot, China, 25–27 October 2019. [Google Scholar] [CrossRef]
  26. Liu, M.; Yao, Y.; Du, J. An efficient machine tool control instruction compression method for networked numerical control systems. Robot. Comput.-Integr. Manuf. 2021, 67, 102027. [Google Scholar] [CrossRef]
  27. Sabbagh, R.; Cai, Z.; Stothert, A.; Djurdjanovic, D. Physically inspired data compression and management for industrial data analytics. Front. Comput. Sci. 2020, 2, 41. [Google Scholar] [CrossRef]
  28. Lin, X.; Wang, L.; Liu, F.; Zhang, Z. Data Compression Method for Computerized Numerical Control Reliability Data. J. Chin. Comput. Syst. 2017, 38, 2202–2206. [Google Scholar]
  29. Yuan, X.; Cai, Z. Ichv: A new compression approach for industrial images. IEEE Trans. Ind. Inform. 2022, 18, 4427–4435. [Google Scholar] [CrossRef]
  30. Chen, S.; Wang, Z.; Zhang, H.; Yang, G.; Wang, K. Fog-based optimized kronecker-supported compression design for industrial iot. IEEE Trans. Sustain. Comput. 2020, 5, 95–106. [Google Scholar] [CrossRef]
  31. Wang, Z.; Ding, Y.; Jin, X.; Chen, Y.; Gao, C. Task offloading for edge computing in industrial internet with joint data compression and security protection. J. Supercomput. 2023, 79, 4291–4317. [Google Scholar] [CrossRef]
  32. Chen, S.; Zhang, S.; Zheng, X.; Ruan, X. Layered adaptive compression design for efficient data collection in industrial wireless sensor networks. J. Netw. Comput. Appl. 2019, 129, 37–45. [Google Scholar] [CrossRef]
  33. Bagherian, M.; Chehade, S.; Whitney, B.; Passian, A. Classical and quantum compression for edge computing: The ubiquitous data dimensionality reduction. Computing 2023, 105, 1419–1465. [Google Scholar] [CrossRef]
  34. Mahdaoui, A.E.; Ouahabi, A.; Moulay, M.S. Image denoising using a compressive sensing approach based on regularization constraints. Sensors 2022, 22, 2199. [Google Scholar] [CrossRef] [PubMed]
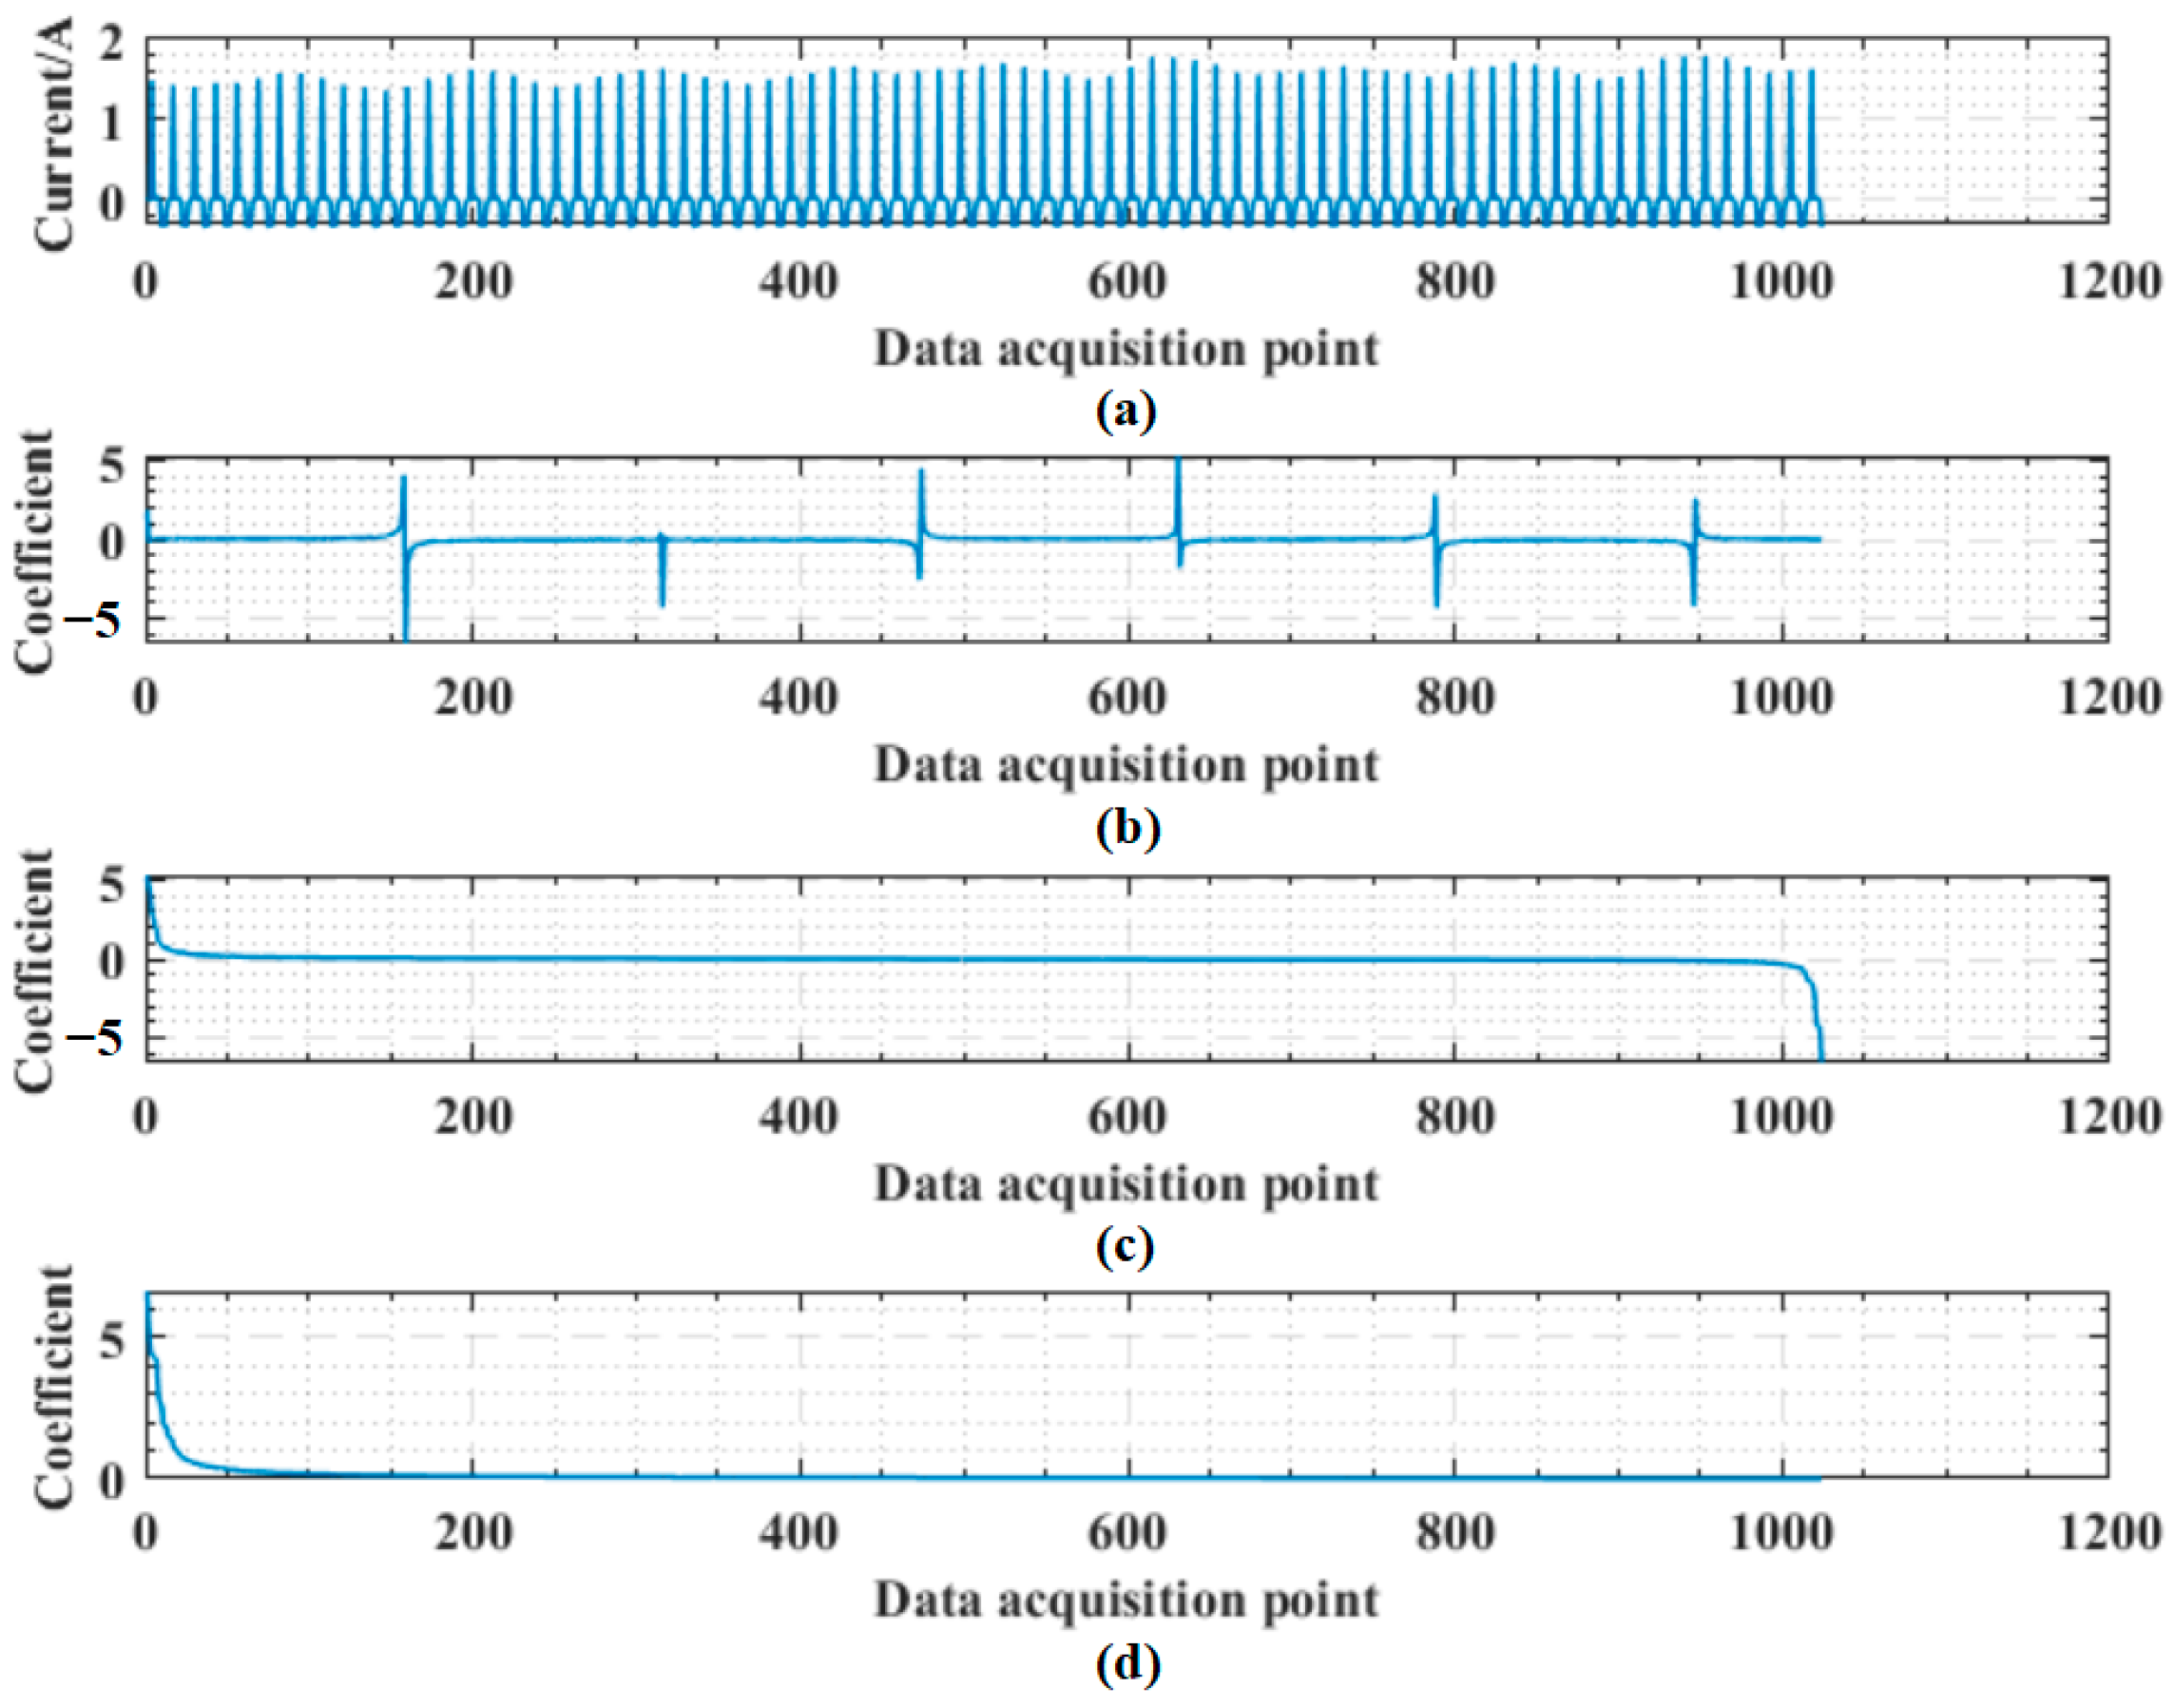
Figure 1. Raw current data and subsequent processing: (a) original current data; (b) DCT coefficients; (c) DCT coefficients sorted in descending order; (d) DCT coefficients sorted in descending order of absolute value.
Electronics 12 03387 g001
Figure 2. Absolute values of DCT coefficients arranged in descending order.
Electronics 12 03387 g002
Figure 3. Comparison between the Laplace distribution and the raw data.
Electronics 12 03387 g003
Figure 4. Comparison between the fitted curve based on the proposed formula and the raw data.
Electronics 12 03387 g004
Figure 5. Division point under normal processing.
Electronics 12 03387 g005
Figure 6. Division point when abrupt fluctuation occurs.
Electronics 12 03387 g006
Figure 7. Stable processing of a computer shell with a CNC machining center: (a) spindle current data; (b) absolute values of the spindle current DCT coefficients; (c) quantized DCT coefficients; (d) error before and after quantization.
Electronics 12 03387 g007
Figure 8. Fluctuating conditions during the processing of a computer shell with a CNC machining center: (a) spindle current data; (b) absolute values of the spindle current DCT coefficients; (c) quantized DCT coefficients; (d) quantization error.
Electronics 12 03387 g008
Figure 9. Normal processing of a computer shell with a CNC machining center: (a) spindle current data; (b) absolute values of the spindle current DCT coefficients; (c) quantized DCT coefficients; (d) quantization error.
Electronics 12 03387 g009
Figure 10. Abnormal processing of a computer shell with a CNC machining center: (a) spindle current data; (b) absolute values of the spindle current DCT coefficients; (c) quantized DCT coefficients; (d) quantization error.
Electronics 12 03387 g010
Table 1. Analysis of the relative error and compression ratio of empirical quantization and improved quantization and other experimental results.
Type of Machine ToolType of Machining ConditionSize of Data (bit)Average Relative Error (Empirical Method)Average Relative Error (Improved Method)Compression Ratio (Empirical Method)Compression Ratio (Improved Method)PSNR
(Improved
Method)
(dB)
Running Time
(s)
CNC machining centerStable processing32,7686.35%4.75%28.81%25.73%50.73660.1143
Fluctuating conditions32,7685.39%4.39%36.53%32.52%52.32410.2081
Normal processing32,7685.95%4.35%33.79%31.41%53.26470.1432
Abnormal processing32,7685.85%3.85%23.98%20.74%39.09810.1896
Disclaimer/Publisher’s Note: The statements, opinions and data contained in all publications are solely those of the individual author(s) and contributor(s) and not of MDPI and/or the editor(s). MDPI and/or the editor(s) disclaim responsibility for any injury to people or property resulting from any ideas, methods, instructions or products referred to in the content.