Abstract
It is crucial to review and update course materials regularly in higher education. However, in the course evaluation process, it is debatable what a difficult learning topic is. This paper proposes a data mining approach to detect learning topics requiring attention in the improvement process of teaching materials by analyzing the discrepancy between formative and summative assessments. In addition, we propose specific methods involving clustering and noise reduction using the OPTICS algorithm and discrepancy calculation steps. Intensive experiments have been conducted on a dataset collected from accurate assessment results of the data structures and algorithms (DSA) course for IT major students at our university. The experimental results have shown that noise reduction can assist in identifying underperforming and overperforming students. In addition, our proposed method can detect learning topics with a high discrepancy for continuously improving teaching materials, which is essential for question recommendation in adaptive learning systems.
1. Introduction
Nowadays, the amount of data collected from educational institutions is growing tremendously due to the development of blended learning and online learning environments, especially in the era of the COVID-19 pandemic. With such a large amount of data, it is not easy to interpret student performance by simply skimming or manually performing analyses. Therefore, an educational data mining (EDM) tool is needed to explore educational data to understand how students learn [1] and then propose personalized methods for achieving better study plans. EDM is a relatively new discipline that emerged from applying data mining techniques to educational data [2]. EDM research consists of four major directions: predicting student performance, providing decision support to instructors and students based on analytical results, detecting student’s learning progress, and optimizing algorithms [3]. The objective of this research is to concentrate specifically on the branch of decision support, which provides instructors with insights into the quality of the course.
Students often get stuck when trying to solve problems and lack alternative actions for regulating their behavior [4]. These obstacles usually occur when the learning topics are so complex that students cannot learn them by themselves, leading to them being discouraged, being frustrated, and eventually opting out of self-regulation. Commonly, we can collect information about difficult topics from learners through feedback surveys [5]. However, hard topics manifest in low scores in assessments via quizzes, exams, and practice. Lecturers commonly identify difficult topics by using formulas such as the ratio of passed submissions to total submissions [6]. However, determining what counts as a pass can be subjective and may vary among lecturers, making it hard to reach a consensus when multiple lecturers are involved in teaching a course. The challenging question is whether there is a way to identify a difficult topic that is not entirely dependent on feedback from learners and can be uniformly applied by a group of lecturers.
As an essential part of the higher education process, a series of assessments will be carried out on the learning process to assess the outcomes of the acquired knowledge after a study period. The assessments of acquired knowledge, known as summative assessments, usually take place in the middle and at the end of a semester via midterm and final exams. Having well-designed and well-developed assessments will support students’ learning processes by being more accessible and also more challenging [7]. Earlier research has divided assessment into two types: formative assessments and summative assessments. Formative assessments are an integral part of the instructional process, providing teachers and students with timely feedback on student understanding to facilitate adjustments, while summative assessments are a concluding test administered at the end of a semester or course to evaluate the overall learning and assess the effectiveness of the instructional program [8].
Consequently, in a regular course, the lecturer will assign classroom assignments and short quizzes to collect acquisition and feedback from students. Based on these results, periodic tests like midterms or finals are designed under the ongoing learning process and the course outcome. In other words, we expect a correspondence between the results of students’ formative and summative assessments. Existing research has shown that assessments may not reflect the acquisition level of the taught subjects [9]. Moreover, the misalignment between formative assessment practices and the summative assessment framework was identified as problematic, threatening the assessment quality and student learning [10].
In this study, we aim to formulate this misalignment, called the discrepancy between formative and summative assessments, then use it to explore difficult learning topics in the teaching process. This is an illustrative example of evaluating and detecting difficult topics independently of the lecturer’s and learner’s perspectives. Research results can be used in the continuous improvement process to improve and enhance the course to meet learners’ needs better. Therefore, to strengthen learners’ motivations, lecturers must have a method to review learning topics to determine which ones are actually difficult. Once the problematic topics are detected, the lecturer can adjust the learning content by revising the description of topics, reducing the difficulty level, increasing the time to do the test, etc., so that learners can overcome barriers in the self-study process. The main contributions of our work can be summarized as follows:
- We propose a data mining method to detect learning topics with a high discrepancy for improving teaching materials.
- We propose a clustering method to reduce noise in the dataset to enhance the effectiveness of data analysis.
- We build a real dataset from formative and summative assessment results for experiment conduction to evaluate the effectiveness of the proposed method.
The rest of the paper is constructed as follows. Section 2 presents our investigation of related works that have applied educational data mining to assessment topics. Then, we present the proposed approach in Section 3, focusing on metrics for the discrepancy between formative and summative assessments, their meaning, and how to calculate them. For experiments, we present how to apply the proposed method to the programming courses at our university and discuss the experimental results in Section 4. Finally, Section 5 concludes this study with results and future research.
2. Related Works
Difficult learning topics have been studied across several literature sources. The reasons for determining learning topics as difficult can be due to an excessive content [11], a high complexity [12], or an abstract nature [13]. Typically, difficult learning topics are perceived by learners. For example, in [13], through a questionnaire and descriptive analysis, the authors mapped the difficult topics of biology in senior high school based on the opinions of undergraduate students. Similarly, in [11], the authors quantified student perceptions to confirm neuroanatomy as one of the most difficult learning topics. In [14], the difficult topics selected for pedagogical research were considered difficult by many students.
Learner evaluations are mostly conducted after the learning process, primarily through feedback methods [11,13]. Therefore, collecting comprehensive feedback from all learners is not guaranteed. This paper presents studies that apply formative and/or summative assessments to educational data mining to detect difficult learning topics from the perspectives of all learners.
Restated, formative assessment is a practice where the lecturer gathers evidence of students’ learning [15], which is often referred to as a classroom assessment or a lecturer assessment [10], and then adapts the next instruction or feedback to learners based on the given evidence to meet student learning needs. Formative assessment is often characterized as an assessment for learning because it aims to improve teaching and learning [16] and to diagnose student difficulties encountered during their learning process [17]. Summative assessment, as opposed to formative assessment, is defined as cumulative assessments that intend to capture what a student has learned, or the quality of the learning, and judge performance against a standard [7]. Therefore, summative assessments are often defined as outcome-based assessments for placement or promotion decisions [10,17].
Educational data mining is the task of using data mining techniques in educational environments. According to [1]:
“Educational Data Mining (EDM) is concerned with developing methods for exploring the unique types of data that come from educational environments [18]. It can be also defined as the application of data mining (DM) techniques to this specific type of dataset that come from educational environments to address important educational questions [19].”
Regarding research subjects, one of the important tasks of EDM is to focus on students in a learning environment or during activities through examining feedback, assessment, and outcomes [20]. Therefore, EDM provides analytics that help students and lecturers improve learning and teaching processes.
In [18], the authors conducted a literature review that categorizes EDM applications into eleven different tasks. However, in a statistical manner, the authors of [3] sorted the main research topics of 777 literature articles and came up with the following top five ranking: (1) prediction of student performance, (2) decision support for teachers and students, (3) detection of behavioral patterns, (4) comparison or optimization of algorithms, and (5) descriptive and predictive analyses of dropout. Meanwhile, from another point of view, based on the application of data mining techniques, the authors of [21] divided all research on educational data mining into four main categories: computer-supported learning analytics (CSLA), computer-supported behavioral analytics (CSBA), computer-supported visualization analytics (CSVA), and computer-supported predictive analytics (CSPA).
- CSLA refers to applying data mining techniques to students’ interactions and their collaborative learning behaviors in a course context. By continuously monitoring these learning activities, the lecturer can tailor the students’ learning experiences to meet the learning requirements of the subject. The authors of [22] explored the effects of EDM on student participation during computer-supported collaborative learning (CSCL) sessions. They visualized which elements enable students to participate more and help them to collaborate better in CSCL. Within the context of assessments, the authors of [23] applied the techniques of collaborative annotating and data mining to formative assessments and further developed an annotation-sharing and intelligent formative assessment (ASIFA) system as an auxiliary Web learning tool. Study [24] developed a collaborative reading annotation system with a formative assessment and feedback mechanisms to forecast the learners with a low reading comprehension and advise them to interact with learners who are predicted to have a high reading comprehension performance and infrequently interact in the digital reading activity.
- CSBA refers to yielding insights or patterns in students’ learning behaviors. The authors of [25] used data mining to identify students’ behavioral patterns and preferences when participating in online learning activities. They found that using EDM improved students’ learning experience when collaborating at a distance. Within the context of assessments, the authors of [16] evaluated whether the self-regulated learning characteristics of learners impact successful engagement with formative assessments and subsequent summative performances in both online and blended environments. In addition, in paper [26], the authors linked evaluative judgments to two self-regulated learning models and presented a model on the effects of co-regulation of learning.
- CSVA concentrates on visually studying educational data to highlight relevant information and offer proper decisions based on the data. Data visualization tools can be used in higher education to simplify complex data and to track students’ multi-dimensional data captured from their interaction with online educational systems [27]. Within the context of assessments, the authors of [28] presented a mobile formative assessment tool using data mining in order to identify the key formative assessment rules according to the web-based learning portfolios of an individual learner. The results were visualized to help teachers precisely assess the learning performance of individual learners. On the other hand, study [29] describes how using raw data and information from reliable assessments can inform teachers’ decisions, leading to improved instructions.
- CSPA aims to predict student performance and retention in a specific course(s) based on the result of assessments. A classic application of this category is to indicate at-risk students who may drop out early and need special attention. For instance, the authors of [30] applied data mining to predict the fail to pass ratio among students based on their final grades. Within the context of assessments, the paper [8] proposed a system for performance assessments of students and explored how formative and summative assessments can be used to assess their performance. On the other hand, study [31] intended to devise an earlier and more accurate analytical means of predicting the degree class that a student will graduate with using formative and summative assessments. Similarly, the authors of [32] investigated the influence of assessment elements and other factors on the final grade in two core mathematical subjects to regress and predict the summative assessment results.
In addition to evaluating student learning, the data collected from data mining are also a source of information for reviewing and reinforcing the learning material. These works fall into a sub-category in the CSPA dimension called learning material evaluation or constructing courseware. The authors of [33] stated that EDM could help learners determine their learning needs by adjusting the complexity of a learning task. In [10], the authors provided concrete insights into what teacher conceptions hinder the development of formative assessment practices, aligning with outcome-based summative assessments. However, this process is mostly manual and takes time to be done. Therefore, this study presents an approach that allows lecturers to detect difficult learning topics based on the discrepancy between formative and summative assessments.
3. The Proposed Approach
3.1. Observations
In this study, we propose a new approach through data accumulation to identify difficult topics. This approach is based on the discrepancy between learners’ efforts and exam results by subject topics, in which learners’ efforts and exam results, in turn, correspond to formative and summative assessment results collected from the course. The topic that requires attention is related to the highest discrepancy found. Our approach is limited by the following two risks: (a) the exam question does not follow the content taught in class and (b) the test results do not match the learner’s performance, which might be described as “man proposes, god disposes”. In the following, we consider several assumptions about risk (a) and its effects to clarify the proposed solution; meanwhile, risk (b) will be mentioned and discussed in the experimental results.
Assumption 1.
When preparing a summative assessment, the lecturer will observe the statistical results of a formative assessment.
Exams that are too easy or too difficult do not differentiate the ability and effort of learners in a group. In other words, the exam questions need to match the ability of the vast majority of learners. The best way to understand the suitability of the learners is to consider the results or feedback on the acquisition level during the learning process.
Assumption 2.
For every learning topic in the course, lecturers use the same set of courseware for all teaching classes.
Although many different teaching methods can be applied in the same classroom, this is not mandatory for all lecturers. Instead, the set of shared documents on the e-learning system, including lectures, interactive class exercises, and homework, are inherited, improved over the years, and can be applied to all classes. Within this research, we call those documents courseware of the subject.
Assumption 3.
Most learners have stable and moderate learning behavior for all topics in the same subject.
Each course covers multiple topics rolled out weekly with the same courseware for every learner. The exercise patterns (multi-choice questions, fill-in-the-blank, programming, etc.) cover various levels, from easy to difficult. Learning behavior includes learning attitude, diligence, level of effort, and self-discipline to work from home. If the courseware is engaging enough and accessible from the very first topic, studious learners who do not encounter unexpected situations will maintain a consistent learning behavior over the course process.
In this study, we focus on assessing the acquisition level of most learners (with the same set of lecturers and learners). If a metric that describes the acquisition level exists, it should follow the Observations and Definitions as follows:
Definition 1.
The level of lecture acquisition is the metric through which it is assessed if the learner meets the learning outcome through the courseware and learning process.
Observation 1.
If there exist two topics with the same level of lecture acquisition to the vast majority of learners (with the same set of lecturers and learners) and if there is a measuring tool for this, then the results returned from the measuring tool for those two topics need to be approximately the same.
From Assumptions 2 and 3, given that learners have stable learning behavior with well-designed courseware and an appropriate teaching path, the learners should meet the required level of learning outcome. Thus, the results from the tool to measure the level of lecture acquisition according to statistics must be approximately equivalent.
Observation 2.
If there is a tool to measure the level of lecture acquisition, it should depend on the results collected from the summative assessment.
The summative assessment is a final assessment to officially determine the learner’s achievement level. Therefore, any measurement method needs to be based on this assessment.
Proposition 1.
It needs to integrate additional information gathered from the formative assessment with the measuring tool for assessing the lecture acquisition level to achieve higher accuracy.
Regarding timing, the formative assessment needs to be released and completed before the summative assessment. The latter is considered as a method of post-testing, post-checking, or post-auditing. The information extracted from the summative assessment is typically enough to understand learners’ acquisition levels through statistical methods illustrating a Gaussian distribution. However, designing an exam without observing the information collected from the formative assessment will mean it is likely that the results of the summative assessment do not reveal the performance and efforts of each learner.
Moreover, according to the Assumption 1, the observation of statistical results of the formative assessment to create a summative assessment is often subjective from an individual or a group in charge of making the exam. Therefore, there is no guarantee of consistency between formative and summative assessment results. In other words, the results obtained from the summative assessment are not guaranteed to accurately describe the observed measuring tool.
We can obtain the following Propositions 2 and 3 based on Observation 1 and Proposition 1.
Proposition 2.
If the tool to measure the level of lecture acquisition exists, then it should observe the information gathered from both the formative and summative assessments.
The discrepancy between formative and summative assessment of a topic is meaningful and observable. To do that, we need to consider the following definition of discrepancy.
Definition 2.
The discrepancy between formative and summative assessments in each topic is the average discrepancy between two formative and summative assessments in the same subject by learners.
Proposition 3.
When comparing topics, the topic with the most significant discrepancy is the one that needs to be reviewed in the continuous improvement process.
When composing the exam, observation of the topic with the largest discrepancy can be problematic. Therefore, the relevant summative assessment should be reviewed for future semesters or, if the person or group in charge of making the exam still wants to keep the same assessment/difficulty level in the summative assessment, they need to find a way to add more exercise content in the courseware and even change the content of the formative assessment. Whatever the decision is, it is still in the continuous improvement process phase.
3.2. Proposed Courseware Improvement Process
Figure 1 illustrates the courseware improvement process that is the core of our proposed approach. In the Learning Management System (LMS) block, the courseware includes learning materials for learners, such as videos, slides, and exercises in the online environment. Meanwhile, the data accumulation records learners’ interactions with the courseware, such as time spent watching videos, opening/downloading lecture slides, doing exercises, auto-grading results of assignments, etc. The data related to assessment score are used for the following steps:
- Clustering and Noise Reduction: the data are divided into different related topics, including formative and summative assessments, which will be clustered and the noise will be removed. The data may contain some particular learners who have abnormal learning behaviors. Particular learners should be supported separately and removed from the data for the general support of learners to be correct.
- Discrepancy Calculation: the discrepancy is described by the average absolute difference between the learner’s formative and summative scores.
- Difficult Topic Exploring: the topic with the highest discrepancy is focused on. The result may be sent to the courseware improvement process block. This process collects information and sends suggestions to the lecturer. Finally, the lecturer reviews the topic and can appropriately adjust the courseware for the following semesters.

Figure 1.
Illustration of the proposed courseware improvement process.
3.2.1. Clustering Method and Noise Reduction
In a classroom, there will typically be students with the same learning behavior, and there will also be students whose learning behavior is unstable. This can happen because although learners have different prior knowledge, they can study together in groups and form the same study habits. On the other hand, students with individual learning tendencies or abnormal learning behaviors will produce distinct learning behaviors, which we call outliers.
From the lecturer’s perspective, it would be ideal if they had a teaching method that is adaptable to each learning behavior. Therefore, lecturers strive to support as many learners as possible, leading to good support for large groups of people with similar learning behaviors and rare support for the outliers. Our study focused on observing the inconsistencies in most learners’ learning and assessing processes. As a result, the noise resulting from outliers will be excluded from our approach. We chose the OPTICS algorithm as a clustering and noise detection method to remove outliers.
Clusters are defined as dense regions separated by low-density regions. The algorithm starts with an arbitrary object in the dataset and checks the neighbor objects within a given radius (eps). If the neighbors within that eps are more than the minimum number of objects (minPts) required for a cluster, it is marked as a core object. Otherwise, if the objects in its surroundings within the given eps are less than the minPts required, this object is marked as noise. The drawback is that it depends on one fixed eps for different clusters like DBSCAN [34]. Therefore, this method may produce bad predictions when encountering clusters with different intervals. OPTICS is a model that improves this weakness. Instead of determining based on a fixed distance of eps, OPTICS determines if the distance between two points is appropriate by evaluating the distance of each pair of points in the local environment. Figure 2 demonstrates an example, which shows that OPTICS detects outliers better than DBSCAN.
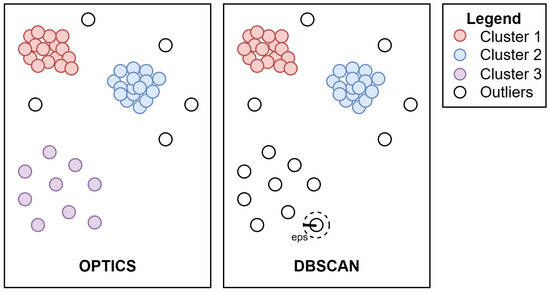
Figure 2.
Differences between DBSCAN and OPTICS.
3.2.2. Discrepancy Calculation
After applying the OPTICS algorithm for clustering, all noise points are removed, and the discrepancy between formative and summative assessments is calculated. To observe the average discrepancy between formative and summative assessments of each student, we propose a metric to calculate their dissimilarity based on each topic in a course. For each topic t in the set of topics T used for evaluation, the discrepancy metric d is determined by (1).
- is the set of learners participating in the formative assessments. Meanwhile, is the set of learners participating in the summative assessments. These two sets may differ, for example, a student did not take the final exam due to a personal issue like an unexpected illness. Therefore, a set will be used to calculate the discrepancy.
- is an element in the set of scores of the students in the formative assessment F that represents the formative score for topic t of student i.
- is an element in the set of scores of the students in the summative assessment S that represents the summative score for topic t of student i.
The discrepancy is described by the average absolute difference between the learner’s formative and summative scores. The difference between the formative and summative scores is the learner’s discrepancy, which can lean towards either of the two assessments. To avoid excluding any possibilities, we use the absolute value of the discrepancy when calculating its overall summation. The discrepancy d is calculated by taking the average differences across the number of learners. We chose a simple average estimate, the arithmetic mean, for this formula because learners are considered to have similar characteristics. However, we do not claim a limit to only using mean measures. As the d value approaches 0, the correspondence between the learning and testing procedures becomes stronger. Conversely, a larger d value indicates a more significant discrepancy between the two processes of learning and testing.
4. Experiments and Evaluation
4.1. Experiment Setup
The dataset was collected from the actual learning process of students in the data structures and algorithms (DSA) course at our university, which was planned as shown in Figure 3. After learning theories in class, learners took a laboratory lesson to practice their coding skills. This course also contains two summative assessments, namely the midterm and final exams.
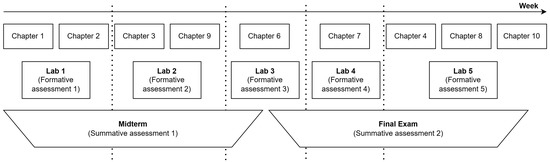
Figure 3.
DSA course planning as formative and summative assessment perspective.
The course’s content is divided into ten topics according to ten chapters. The content of each topic is summarized in Table 1. The order of teaching the learning topics in the theory class is not always required to be in ascending order, but they can vary based on the proposal of the group of lecturers. Specifically, Topic 9 was taught during the midterm period, while Topic 4 was moved down to be conducted during the final period. In addition, the group of lecturers suggested not assessing Topic 5 since the course is only taught at a fundamental level; thereby, no assessment was conducted to test learners’ knowledge.

Table 1.
Content of topics.
Table 2 describes the lab topics. The lab dataset contains 671 learners in rows; each has five score columns corresponding to five lab sessions. Each lab session includes the contents of several related topics. Meanwhile, Table 3 represents the associated topics that will be assessed in midterm and final exams. The exam dataset consists of 634 learners in a row; each has ten score columns corresponding to ten topics. A midterm or final exam may contain multiple questions asked about a topic; the score of a topic for a learner is the average score of the related questions. Notably, the content of topic 6 appears both in the midterm and final exam and the midterm is held right after the study week of topic 6 (Tree), so it only checks some basic content about the Tree and the remaining content will be examined in the final exam.
Table 2.
Information of lab dataset with 671 learners.
Table 3.
Information of exam dataset with 634 learners.
An investigation of the exam information shows that there are 37 fewer learners than learners who attended labs. This might be because these learners cannot participate in the exam for health reasons due to the COVID-19 pandemic. Therefore, a smaller set of 634 learners was used for the experiment because the selected learners should participate in both processes to evaluate the discrepancy between the two assessment methods.
4.2. Results and Discussion
The process of courseware improvement originates from the clustering and noise reduction step, as shown in Figure 1. The input data are matrices containing information about the formative and summative assessments of a topic. In the real dataset, this input matrix consists of one column as a feature of the lab score and the remaining columns as features of the midterm or final exam scores, so these scores are related to the topics taught in the lab session. The relationships between exams, lab sessions, and topics are described in Table 2 and Table 3 above. Table 4 describes the configurations of six proposed matrices (visualized in Figure 4) as inputs that will be processed by the OPTICS model for clustering and noise removal.
Table 4.
Configuration of six matrices proposed as inputs for OPTICS model.
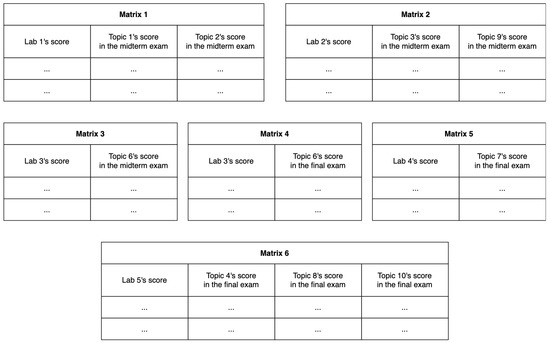
Figure 4.
Visualization of six matrices proposed as inputs for OPTICS model.
Figure 5 represents a histogram of the number of students in each cluster obtained from the clustering process through one of the six matrices. Among them, midterm exam includes Figure 5a–c corresponding to Matrix 1, 2, and 3, and final exam includes Figure 5d–f, corresponding to Matrix 4, 5, and 6. In the obtained results, overall, most clusters have less than ten students. However, in some cases, some clusters consist of more than ten students, such as about 55 from Matrix 1, 60 from Matrix 5, 80 from Matrix 4, and 125 from Matrix 3.
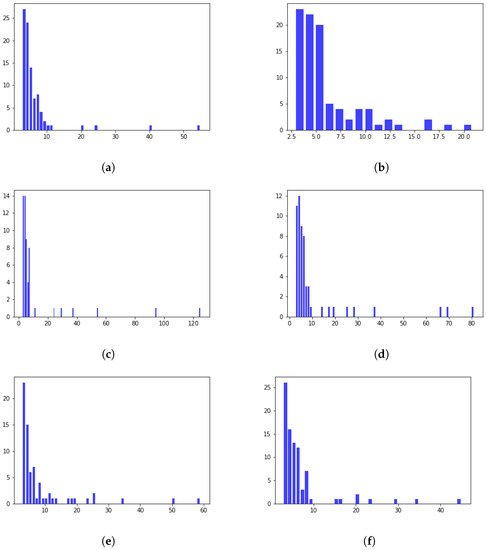
Figure 5.
Histogram of the number of students in each cluster. (a) Clustering results from matrix 1; (b) Clustering results from matrix 2; (c) Clustering results from matrix 3; (d) Clustering results from matrix 4; (e) Clustering results from matrix 5; (f) Clustering results from matrix 6.
Table 5 shows the clustering results—the silhouette score for clustering ranges from 0.51 to 0.8. The silhouette is moderately high for most matrices, indicating reasonable clustering results. The lowest noise ratio is 6% (38/634), and the highest noise ratio is 17% (109/634). The number of clusters ranges from 56 to 92 clusters.
Table 5.
Clustering results with (min_samples = 3).
Figure 6 represents the histogram of discrepancies for clusters related to the midterm exam. The horizontal axis represents the ranges of discrepancy values; meanwhile, the vertical axis represents the percentage of clusters corresponding to each discrepancy value. For example, in Topic 1, 30% of the clusters have discrepancies ranging from 0 to 0.1. The results show a decreasing trend in discrepancies. The results also indicate that most clusterings result from matrices with many clusters with a low discrepancy and a few with a high discrepancy. However, Figure 6d shows more clusters with high discrepancies for topic 6 than for the other four topics. Specifically, for discrepancy values of 0.8 and above, the discrepancy values for topic 6 are higher than those for topics 1, 2, 3, and 9.
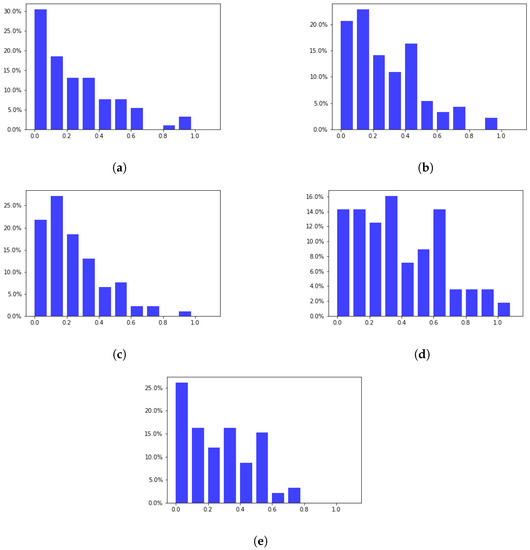
Figure 6.
Histogram of discrepancy of topics related to the midterm exam. (a) Topic 1; (b) Topic 2; (c) Topic 3; (d) Topic 6; (e) Topic 9.
Figure 7 represents the histogram of discrepancies for clusters related to the final exam. The data representation is similar to that in Figure 6. Figure 7a–d shows that many clusters have low discrepancies and are concentrated at the beginning of the range. However, Figure 7e shows that many clusters have discrepancies concentrated in the middle range (from 0.1 to 0.6). On the other hand, Figure 7a,c,d has more clusters than the others in the discrepancy range of 0.8 and above.
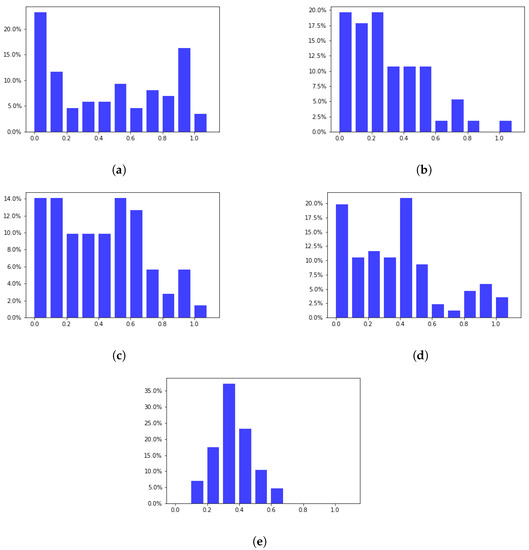
Figure 7.
Histogram of discrepancy of topics related to the final exam. (a) Topic 4; (b) Topic 6; (c) Topic 7; (d) Topic 8; (e) Topic 10.
The visualized findings in charts like Figure 6 and Figure 7 have three intuitive meanings for lecturers. Firstly, they can visually perceive the relationship between the distribution of cluster discrepancies and the difficulty level of the topic. Secondly, if the number of clusters is concentrated in the high discrepancy area, it may indicate a difficult topic. Finally, they can choose a threshold to determine if the difficult topic exists.
Additionally, the histogram results for the cluster analysis suggest a threshold of 0.8 to detect difficult learning topics. Using this threshold, Figure 6 shows that topic 6 (Tree) is the most difficult in the midterm exam. Additionally, with the same threshold, Figure 7 shows three difficult topics (4 (Searching), 7 (Advanced Tree), and 8 (Heap-Hash)) in the final exam. However, determining this threshold can be challenging when multiple topics have a discrepancy above the threshold.
We also examine the outlier results from OPTICS by counting the number of occurrences of each student in the labs. Specifically, out of a total of 634 students, 278 students (43.85%) were found to be outliers at least once across all matrices clusterings. Figure 8a shows the distribution of the number of students with noise occurrences per matrix, with 175 students having one occurrence, 83 students having two occurrences, 20 students having three occurrences, and 2 students having four occurrences, and no students having five or six occurrences. In addition, Figure 8b also shows this distribution as a percentage of the total 278 students with noise occurrences greater than 0. Based on this distribution, students with noise occurrences greater than 1 were analyzed (a total of 105 students).
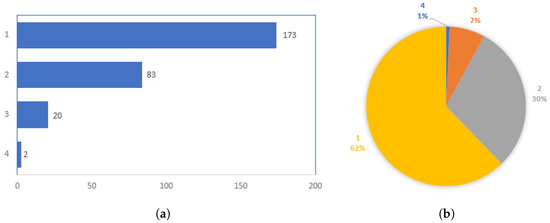
Figure 8.
Distribution of noise occurences (a,b).
The results of the outlier analysis are demonstrated in Table 6, showing the selected students’ lab scores, midterm and final exam results, and grades. In Table 6, we found that there are three groups of students as follows: overperforming students with high lab scores and lower midterm or final exams (students with no. 6, 13, and 210), underperforming students with low lab scores but who performed well in the exams (students with no. 4,275,440), and the other group (students with no. 158,307). Notably, student 20***04 scored a 10 in the lab assessment, which was higher than most other students, but received significantly lower scores of 3.47 and 3.3 in the midterm and final exams, respectively.
Table 6.
Sample students from outliers (in more than one matrix clustering).
Overall, out of 105 students, we counted 28 overperforming learners (27%) and 50 underperforming learners (48%). With the total percentage of underperforming and overperforming learners being 75%, it suggests that our noise removal process effectively removed particular learners, addressing another risk regarding the test results not matching the learner’s performance, which might be describe as “man proposes, god disposes” as highlighted as risk (b) in the problem statement.
5. Conclusions
This paper presented a study adopting data mining to determine the discrepancy between formative and summative assessments, then uses this to detect difficult learning topics. This is an illustrative example of evaluating and detecting difficult topics independently of the lecturer’s and learner’s perspectives. Based on assumptions and the proposed observations, a courseware improvement process is suggested, which involves the clustering and noise reduction step and the discrepancy calculation step for exploring difficult topics.
We conducted experiments on a real dataset collected from the DSA courses at our university. The experimental results confirm that the OPTICS model can detect difficult topics: Tree, Advanced Tree, Heap-Hash, and Searching. Using the cluster analysis histogram results, a threshold of 0.8 is suggested to detect difficult learning topics. Moreover, the OPTICS-detected noise contains a large proportion (75%) of two groups of learners considered outlier data.
The research results can be applied to improve and enhance the courseware to meet learners’ needs better. Therefore, to strengthen learners’ motivations, lecturers must have a method to review learning topics to determine which ones are actually difficult. Once the complex topics are detected, the lecturer can adjust the learning content by revising the description of topics, reducing the difficulty level, and increasing the time to complete the test so that learners can overcome barriers in the self-study process, especially in an adaptive learning system.
In future research, we will propose a method to detect high-discrepancy topics where no topic yields the highest discrepancy in both OPTICS and statistic methods. An effective noise reduction analysis on the total distribution and changing the highest discrepancy topic could also be a further interesting study. An investigation into applying this process to innovative pedagogical approaches, e.g., project-based learning, will also be conducted shortly.
Author Contributions
Conceptualization, H.T., T.V.-V., T.-V.L. and N.H.-T.; methodology, H.T., T.V.-V. and N.H.-T.; software, H.T., T.V.-V. and T.B.; validation, H.T., T.V.-V. and T.B.; formal analysis, T.-V.L., H.-A.P. and N.H.-T.; writing—original draft preparation, H.T. and T.V.-V.; writing—review and editing, T.-V.L., H.-A.P. and N.H.-T.; supervision, T.-V.L., H.-A.P. and N.H.-T.; project administration, H.-A.P. All authors have read and agreed to the published version of the manuscript.
Funding
This research was funded by Vietnam National University Ho Chi Minh City (VNU-HCM) under grant number DS2022-20-07.
Data Availability Statement
The dataset used in this study is publicly available at https://github.com/Tekoo9/discrepancy_on_formative_and_summative, accessed on 7 April 2023.
Acknowledgments
The authors acknowledge Ho Chi Minh City University of Technology (HCMUT), VNU-HCM for supporting this study.
Conflicts of Interest
The authors declare no conflict of interest.
References
- Romero, C.; Ventura, S. Educational data mining and learning analytics: An updated survey. Wires Data Min. Knowl. Discov. 2020, 10, e1355. [Google Scholar] [CrossRef]
- Bilal Zorić, A. Benefits of Educational Data Mining. J. Int. Bus. Res. Mark. 2020, 6, 12–16. [Google Scholar] [CrossRef]
- Du, X.; Yang, J.; Hung, J.L.; Shelton, B. Educational data mining: A systematic review of research and emerging trends. Inf. Discov. Deliv. 2020, 48, 225–236. [Google Scholar] [CrossRef]
- Liebendörfer, M.; Kempen, L.; Schukajlow, S. First-year university students’ self-regulated learning during the COVID-19 pandemic: A qualitative longitudinal study. ZDM Math. Educ. 2022, 55, 119–131. [Google Scholar] [CrossRef]
- Araujo, L.; López-Ostenero, F.; Martinez-Romo, J.; Plaza, L. Identifying the most difficult topics in a computer science subject taught with distance methodology. In Proceedings of the 11th Annual International Conference of Education, Research and Innovation (ICERI), Seville, Spain, 12–14 November 2018; pp. 5388–5394. [Google Scholar] [CrossRef]
- Tran, H.; Vu, T.; Nguyen, H.; Tran, D.; Nguyen, T.; Le, V. An efficient approach to measure the difficulty degree of practical programming exercises based on student performances. REV J. Electron. Commun. 2021, 11, 41–48. [Google Scholar] [CrossRef]
- Annandale, M.; Belkasim, S.; Bunt, B.; Chahine, I.; Beer, J.; Jacobson, T.; Jagals, D.; Kamanga, E.; Mackey, T.; Olivier, J.; et al. Learning through Assessment: An Approach towards Self-Directed Learning; AOSIS: New York, NY, USA, 2021; pp. 11–13. [Google Scholar] [CrossRef]
- HasmukhGogri, M.; Shaikh, S.; Iyengar, V. Evaluation of Students Performance based on Formative Assessment using Data Mining. Int. J. Comput. Appl. 2013, 67, 18–21. [Google Scholar] [CrossRef]
- Tridane, M.; Belaaouad, S.; Benmokhtar, S.; Gourja, B.; Mohamed, R. The Impact of Formative Assessment on the Learning Process and the Unreliability of the Mark for the Summative Evaluation. Procedia Soc. Behav. Sci. 2015, 197, 680–685. [Google Scholar] [CrossRef]
- Gulikers, J.; Biemans, H.; Wesselink, R.; Wel, M. Aligning formative and summative assessments: A collaborative action research challenging teacher conceptions. Stud. Educ. Eval. 2013, 39, 116–124. [Google Scholar] [CrossRef]
- Hall, S.; Stephens, J.; Parton, W.; Myers, M.; Harrison, C.; Elmansouri, A.; Lowry, A.; Border, S. Identifying Medical Student Perceptions on the Difficulty of Learning Different Topics of the Undergraduate Anatomy Curriculum. Med. Sci. Educ. 2018, 28, 469–472. [Google Scholar] [CrossRef]
- Falah, J.; Wedyan, M.; Alfalah, S.F.M.; Abu-Tarboush, M.; Al-Jakheem, A.; Al-Faraneh, M.; Abuhammad, A.; Charissis, V. Identifying the Characteristics of Virtual Reality Gamification for Complex Educational Topics. Multimodal Technol. Interact. 2021, 5, 53. [Google Scholar] [CrossRef]
- Fauzi, A.; Mitalistiani, M. High school biology topics that perceived difficult by undergraduate students. Didakt. Biol. J. Penelit. Pendidik. Biol. 2018, 2, 73. [Google Scholar] [CrossRef]
- Prochazkova, K.; Novotný, P.; Hancarova, M.; Prchalová, D.; Sedlacek, Z. Teaching a difficult topic using a problem-based concept resembling a computer game: Development and evaluation of an e-learning application for medical molecular genetics. BMC Med. Educ. 2019, 19, 390. [Google Scholar] [CrossRef] [PubMed]
- Gikandi, J.; Morrow, D.; Davis, N. Online formative assessment in higher education: A review of the literature. Comput. Educ. 2011, 57, 2333–2351. [Google Scholar] [CrossRef]
- Broadbent, J.; Sharman, S.; Panadero, E.; Fuller-Tyszkiewicz, M. How does self-regulated learning influence formative assessment and summative grade? Comparing online and blended learners. Internet High. Educ. 2021, 50, 100805. [Google Scholar] [CrossRef]
- Dixson, D.; Worrell, F. Formative and Summative Assessment in the Classroom. Theory Into Pract. 2016, 55, 153–159. [Google Scholar] [CrossRef]
- Bakhshinategh, B.; Zaïane, O.; Elatia, S.; Ipperciel, D. Educational data mining applications and tasks: A survey of the last 10 years. Educ. Inf. Technol. 2018, 23, 537–553. [Google Scholar] [CrossRef]
- Romero, C.; Ventura, S. Data Mining in Education. Wiley Interdiscip. Rev. Data Min. Knowl. Discov. 2013, 3, 12–27. [Google Scholar] [CrossRef]
- Lemay, D.; Baek, C.; Doleck, T. Comparison of Learning Analytics and Educational Data Mining: A Topic Modeling Approach. Comput. Educ. Artif. Intell. 2021, 2, 100016. [Google Scholar] [CrossRef]
- Aldowah, H.; Al-Samarraie, H.; Fauzy, W. Educational Data Mining and Learning Analytics for 21st century higher education: A Review and Synthesis. Telemat. Inform. 2019, 37, 13–49. [Google Scholar] [CrossRef]
- Janssen, J.; Erkens, G.; Kanselaar, G.; Jaspers, J. Visualization of participation: Does it contribute to successful computer-supported collaborative learning? Comput. Educ. 2007, 49, 1037–1065. [Google Scholar] [CrossRef]
- Lin, J.W.; Lai, Y. Using collaborative annotating and data mining on formative assessments to enhance learning efficiency. Comput. Appl. Eng. Educ. 2014, 22, 364–374. [Google Scholar] [CrossRef]
- Chen, C.M.; Chen, L.C.; Horng, W.J. A collaborative reading annotation system with formative assessment and feedback mechanisms to promote digital reading performance. Interact. Learn. Environ. 2021, 29, 848–865. [Google Scholar] [CrossRef]
- Hung, J.L.; Zhang, K. Revealing online learning behaviors and activity patterns and making predictions with data mining techniques in online teaching. MERLOT J. Online Learn. Teach. 2008, 4, 426–437. [Google Scholar]
- Panadero, E.; Broadbent, J.; Boud, D.; Lodge, J. Using formative assessment to influence self- and co-regulated learning: The role of evaluative judgement. Eur. J. Psychol. Educ. 2018, 34, 535–557. [Google Scholar] [CrossRef]
- Romero, C.; Ventura, S. Educational data mining: A survey from 1995 to 2005. Expert Syst. Appl. 2007, 33, 135–146. [Google Scholar] [CrossRef]
- Chen, C.M.; Chen, M.C. Mobile formative assessment tool based on data mining techniques for supporting web-based learning. Comput. Educ. 2009, 52, 256–273. [Google Scholar] [CrossRef]
- Schmid, D. Data Mining: A Systems Approach to Formative Assessment. J. Danc. Educ. 2012, 12, 75–81. [Google Scholar] [CrossRef]
- Bunkar, K.; Singh, U.K.; Pandya, B.; Bunkar, R. Data mining: Prediction for performance improvement of graduate students using classification. In Proceedings of the Ninth International Conference on Wireless and Optical Communications Networks (WOCN), Indore, India, 20–22 September 2012; pp. 1–5. [Google Scholar] [CrossRef]
- Adam, I.; Bello, H.; Abdullahi, A.; Dan-Azumi, M.; Abdullahi, N. Using Formative and Summative Assessments in Data Mining to Predict Students’ Final Grades. Int. Res. J. Innov. Eng. Technol. 2020, 4, 43–49. [Google Scholar] [CrossRef]
- Gocheva-Ilieva, S.; Teofilova, M.; Iliev, A.; Kulina, H.; Voynikova, D.; Ivanov, A.; Atanasova, P. Data Mining for Statistical Evaluation of Summative and Competency-Based Assessments in Mathematics. In Proceedings of the International Joint Conference: 12th International Conference on Computational Intelligence in Security for Information Systems (CISIS 2019) and 10th International Conference on EUropean Transnational Education (ICEUTE 2019), Seville, Spain, 13–15 May 2019; Springer International Publishing: Berlin/Heidelberg, Germany, 2020; Volume 951, pp. 1–10. [Google Scholar] [CrossRef]
- Pejić, A.; Molcer, P.S. Exploring data mining possibilities on computer based problem solving data. In Proceedings of the 14th International Symposium on Intelligent Systems and Informatics (SISY), Subotica, Serbia, 29–31 August 2016; pp. 171–176. [Google Scholar] [CrossRef]
- Ali, T.; Asghar, S.; Sajid, N.A. Critical analysis of DBSCAN variations. In Proceedings of the 2010 International Conference on Information and Emerging Technologies, Karachi, Pakistan, 14–16 June 2010; pp. 1–6. [Google Scholar] [CrossRef]
Disclaimer/Publisher’s Note: The statements, opinions and data contained in all publications are solely those of the individual author(s) and contributor(s) and not of MDPI and/or the editor(s). MDPI and/or the editor(s) disclaim responsibility for any injury to people or property resulting from any ideas, methods, instructions or products referred to in the content. |
© 2023 by the authors. Licensee MDPI, Basel, Switzerland. This article is an open access article distributed under the terms and conditions of the Creative Commons Attribution (CC BY) license (https://creativecommons.org/licenses/by/4.0/).