Abstract
Considering that current voltage transformer models of electrical multiple units (EMUs) are narrow-band models or transformer models, this paper introduces a wide-band model of EMU voltage transformers based on the vector fitting method, circuit synthesis theory and black-box model theory. The admittances of voltage transformers from 30 kHz to 5 MHz are measured by the vector network analyzer, the branch admittances in the pi-type equivalent circuit are calculated according to the equation of a two-port network equivalent circuit. Based on the vector matching method, the rational function formulas of branch admittances are obtained, and the formulas are converted into the circuit models by circuit synthesis theory. The pi-type equivalent circuit model is constructed in the simulation software, and so is the voltage transformer model in the range of 30 kHz–5 MHz. The frequency sweeping method is used to measure the transmission characteristics from direct current (DC)to 30 kHz. The pi-type model is modified according to transmission characteristics, whereby the wide-band model in DC-5 MHz is obtained. Fast pulse experiments are carried out on the voltage transformer, and the actual injected fast pulse voltage is used as the excitation source in the simulation model. The measurement and simulation results on the secondary side of the voltage transformer show that the wide-band model has a high accuracy.
1. Introduction
Various overvoltages often occur during the operation of EMUs, such as an overvoltage of operating the vacuum circuit breaker (VCB), over-phase overvoltage and lightning overvoltage. Overvoltages often lead to the damage of high-voltage equipment on the train, affecting the normal operation of the train. In order to investigate overvoltage principles, it is the most economical and convenient to establish a simulation model of overvoltage. Several high-voltage device models are used in the simulation model of overvoltage, including voltage transformers. The voltage transformer is an important component in high-voltage power transmission control; it is used for metering protection, power measurement and voltage measurement of the contact network, and it plays an important role in the whole high-voltage system. To ensure the accuracy of the overvoltage simulation model, the accuracy of the voltage transformer model is extremely important.
At present, most of the overvoltage simulation models for EMUs use inductors and resistors in parallel to model voltage transformers [1,2,3]. In [4], a saturable transformer model and an excitation characteristic curve are used to model the voltage transformer, and an overvoltage simulation platform of the traction power supply system is established. In [5], the transformer model of the unified magnetic equivalent circuit (UMEC) is used to simulate the voltage transformer on the train, and a simulation model of high-voltage closing overvoltage is established based on the power system computer-aided design (PSCAD). In the field of power systems, many scholars have also conducted a lot of research on voltage transformers. In [6,7], it is shown that the transmission characteristics of voltage transformers are nonlinear in the wide-band range. In [8,9,10], the wide-band voltage transformer model is established based on the vector matching method. It is important to accurately simulate the transmission characteristics of the voltage transformer, and the high-frequency component of actual overvoltage usually reaches several hundred kHz [11].
The current voltage transformer models used in EMUs are narrow-band models or transformer models. There is no broadband model based on the transfer characteristics in the actual train. According to the relevant research, the transmission characteristics of the voltage transformer in the high-frequency range show obvious nonlinearity. The current voltage transformer model used in the simulation model of the train has deficiencies and limitations. Therefore, in order to improve the accuracy of the voltage transformer model, it is necessary to research the wide-band model of the voltage transformer in EMUs.
2. Principle and Analysis
2.1. Vector Fitting Method
The vector fitting method is a rational function approximation algorithm based on least squares and Sanathanan–Koerner iteration proposed by Bjørn Gustavsen [12,13,14]. After the vector is fitted, the rational function expression of the vector is obtained as shown in Equation (1).
where cn are the residues of the rational function, and an are the poles of the rational function. cn and an are real or complex, d and e are real numbers, and s indicates the complex frequency.
The vector fitting method is a robust computational method for rational approximation by iteration as it can fit scalar or vector. For fitting smooth curves, the initial poles can be chosen as real to satisfy the fitting accuracy. When there are multiple resonance peaks in the curve to be fitted, the initial poles are selected as complex to achieve fast and accurate fitting; the complex poles are shown in Equations (2) and (3).
The imaginary part β will cover the entire x-coordinate of the data to be fitted. It generally consists in generally linear spacing or logarithmic spacing, as shown in Equation (4).
In Equation (4), X1 and Xend are the starting point and ending point of the x-coordinates of the data, and N is the fitting order. When the curve has n resonance peaks, there are at least 2n initial poles.
In the process of fitting, the fitting order, iteration number, initial pole spacing and weight are chosen according to the characteristics of the data. When the curve of the data is relatively smooth, the fitting order and iteration number can be lower. When the data curve fluctuates considerably, a higher fitting order and iteration number are chosen. For the initial pole spacing, it is linear or logarithmic. When modeling a device that interacts with the rest of the system, the measured parameters may differ significantly from those in practice, which can easily lead to an amplification of error. The error can be avoided or reduced by weighting. Generally, there are three weights used for weighting, as shown in Equation (5).
The first weight W1 equals to 1, where the weight of each measured value is the same. The second weight W2 is the inverse of the modulus. The third weight W3 is the inverse of the square root of the modulus, where f is the measured value of characteristic parameters, and abs denotes the calculation of modulus.
The vector fitting method is widely used to fit the frequency response of the device. In the process of fitting, the poles are restricted to ensure the stability of the system in time-domain simulation.
2.2. Two-Port Network
When a device has an input port and an output port, it is considered a two-port network. The electrical characteristics of the device can be expressed in terms of the port parameters. The port parameters are usually represented as matrices for ease of expression and calculation, including the impedance parameter matrix Z, the admittance parameter matrix Y, the transmission parameter matrix T and the scattering parameter matrix S. For a two-port network, if the impedance parameter matrix Z, admittance parameter matrix Y or scattering parameter matrix S is symmetric, the two-port network is called a reciprocal network. For a reciprocal two-port network, it can be equated to a T-type or pi-type equivalent circuit. The equivalent circuits are shown in Figure 1.
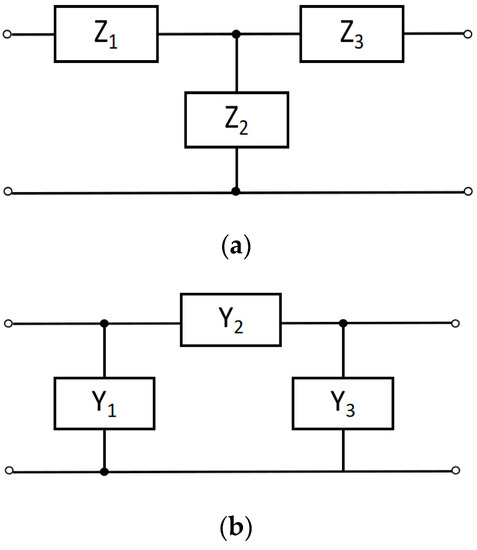
Figure 1.
The (a) T-type and (b) pi-type equivalent circuit of two-port network.
As illustrated in Figure 1, Z1, Z2 and Z3 are the branch impedance in the T-type equivalent circuit. Y1, Y2 and Y3 are the branch admittances in the pi-type equivalent circuit, and the formulae for calculating the branch admittances are shown in Equations (6)–(8).
In the equations, Y11, Y12, Y21 and Y22 are the admittances of the two-port network, respectively.
2.3. Black-Box Modeling Method
The black-box modeling method is used to construct a mathematical model based on certain characteristic parameters of the measured equipment. The mathematical model is converted into the circuit model by circuit synthesis theory and a corresponding simulation model is built with the help of a simulation platform. The black-box modeling of electrical equipment needs to measure the transmission characteristics, admittances or impedance, and then the rational function equation of the parameter is obtained using the vector fitting method. At last, the equation is transformed into the corresponding circuit model [12,13].
In order to ensure that the constructed model can accurately simulate the transmission characteristics of a voltage transformer, the model is established by using the admittances in this paper. The premise of the modelling is that the device is a reciprocal two-port network, and the process of modeling is as follows. At first, the admittances of the device are measured and converted into the branch admittances of a pi-type equivalent circuit. The admittances corresponding to the three branches are obtained, as shown in Figure 1. Then, the vector fitting method is used to fit the branch admittances to obtain the rational function equation, namely, a mathematical model. At last, the final model is obtained by converting the mathematical model to a circuit model according to circuit synthesis theory.
Based on the vector fitting method to fit the admittances of the branches, the rational function equation is obtained, as shown in Equation (1). At this time, the branch admittances are characterized by Equation (1).
The resistor-inductor series circuit is shown in Figure 2.
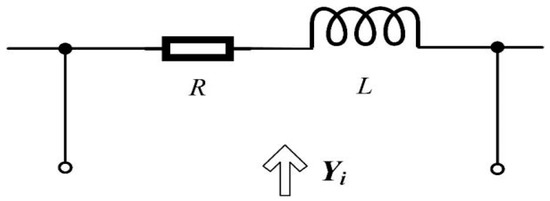
Figure 2.
The resistor-inductor series circuit.
In Figure 2, the admittance of the circuit from the input port is shown in Equation (9).
When the poles an and residues cn of Equation (1) are real numbers, comparing Equations (1) and (9), the inductance and resistance are determined by way of Equation (10).
Hence, when the poles an and the residues cn are real, the cumulative term in Equation (1) can be equated to the resistor-inductor series circuit, as shown in Figure 2.
When the poles an and residues cn of Equation (1) are complex numbers, the adjacent poles an+1 and residues cn+1 are conjugate complex numbers of an and cn. The an, an+1, cn and cn+1 are expressed by Equations (11)–(14).
where and are the real and imaginary parts of the conjugate complex pair an and an+1. and are the real and imaginary parts of the conjugate complex pair cn and cn+1.
The nth and (n+1)th terms in the cumulative term are simplified, and the result is shown in Equation (15).
The combined circuit is obtained by connecting the resistor-inductor series circuit and the capacitor-conductor parallel circuit in series, as shown in Figure 3.
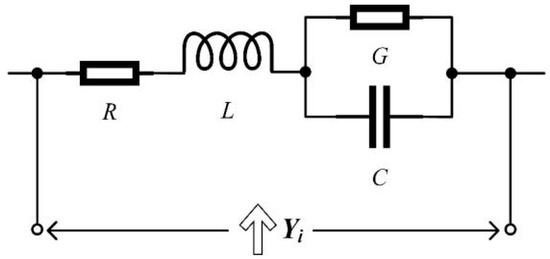
Figure 3.
The combined circuit.
As shown in Figure 3, the admittance of the circuit from the input port is shown in Equation (16).
For contrast between Equations (15) and (16), the inductance, resistance, capacitance and conductance are determined as shown in Equations (17) and (18).
Thus, when the poles an and the residues cn of Equation (1) are complex, based on the basic theory of circuits, the rational functional equations are transferred to circuit models. The cumulative term in Equation (1) can be equated to the combined circuit, as shown in Figure 3.
The capacitor-conductor parallel circuit is shown in Figure 4.
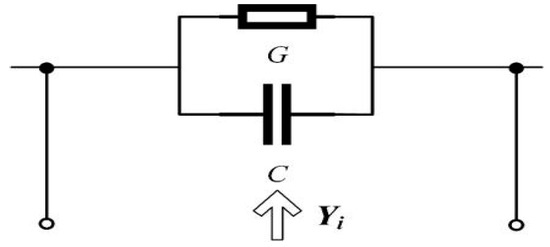
Figure 4.
The capacitor-conductor parallel circuit.
As per Figure 4, the admittance of the circuit from the input port is as given in Equation (19).
For the comparison of Equations (1) and (19), the conductance and capacitance are determined, as shown in Equation (20).
Therefore, the non-accumulative term se + d in Equation (1) can be equated to the capacitor-conductor parallel circuit, as shown in Figure 4.
In summary, when the mathematical model characterized by Equation (1) represents the admittance, the equivalent models are shown in Figure 2, Figure 3 and Figure 4. The branch admittance model of the pi-type equivalent circuit can be obtained by connecting the corresponding models in parallel, as shown in Figure 5.
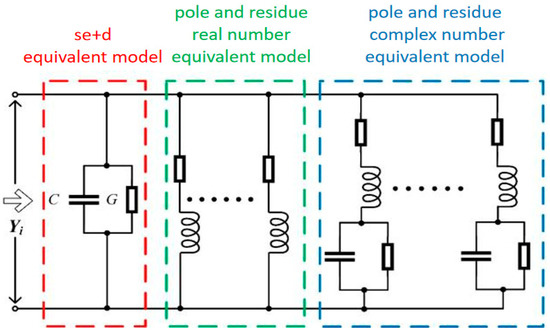
Figure 5.
The branch admittance model.
3. Experiment and Simulation
3.1. Measurement of Admittances and Transmission Characteristics
In this paper, the admittances from 30 kHz to 5 MHz are measured using a vector network analyzer. The schematic diagram of measurement is shown in Figure 6 and the measured results are shown in Figure 7.
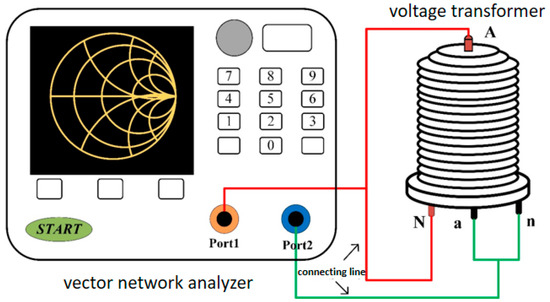
Figure 6.
Schematic diagram of measurement using vector network analyzer.
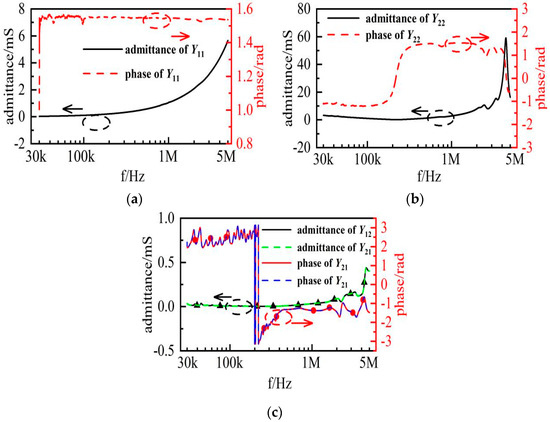
Figure 7.
Measured results of admittances (a) Y11, (b) Y22, (c) Y12 and Y21.
As illustrated in Figure 7, the measured results of Y12 and Y21 are the same. Therefore, the voltage transformer is a reciprocal two-port network, and it can be modeled using a pi-type equivalent circuit.
The transmission characteristics of the voltage transformer are measured by the frequency sweeping method from DC to 30 kHz, which the schematic diagram shows in Figure 8. The voltage transformer in this paper is an electromagnetic voltage transformer with a rated ratio of 250:1 at 50 Hz. The working principle is electromagnetic induction, so the transmission characteristics at DC cannot be measured. Because the distribution parameter at low frequency is small and can be ignored, the phase-frequency characteristic is 0 and the amplitude-frequency characteristic is 250 by default at DC. The transmission characteristics in DC-30 kHz are shown in Figure 9.
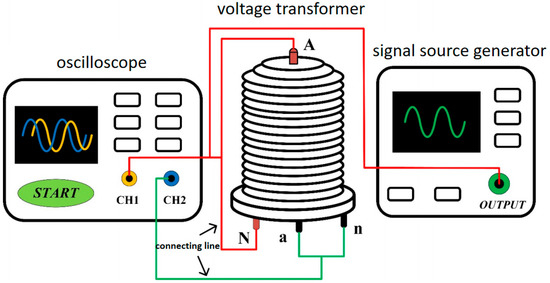
Figure 8.
Schematic diagram of frequency sweep method.
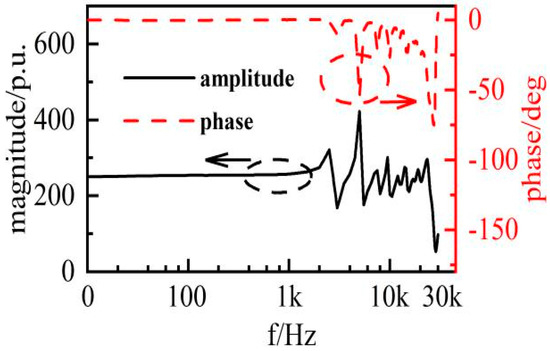
Figure 9.
Measured results of transmission characteristics in DC-30 kHz.
In Figure 9, the transmission characteristics of the voltage transformer in EMU remain basically unchanged from DC to 1 kHz, while the transmission characteristics show obvious nonlinearity from 1 kHz to 30 kHz. Thus, it can be seen that there are shortcomings and limitations in the model of the voltage transformer used in the current EMU.
3.2. Vector Fitting of Branch Admittances
According to Equations (6)–(8), the branch admittances are calculated in the pi-type equivalent circuit, which is called the original result below. The branch admittances are fitted using the vector fitting method. The fitting parameters are set as shown in Table 1.

Table 1.
List of fitting parameters.
After the vector is fitted, the corresponding poles, residues and constants of branch admittances are obtained. The fitting results of the branch admittances are shown in Figure 10.
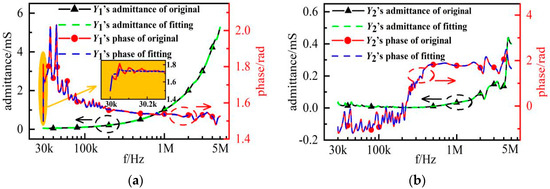
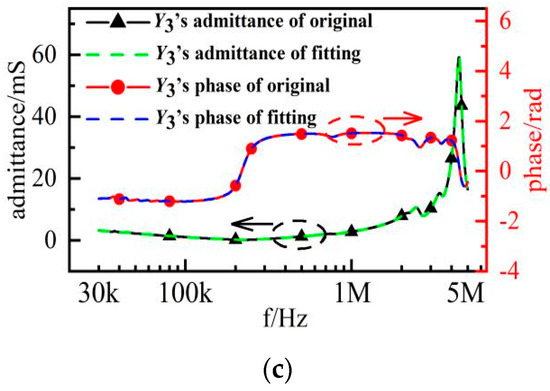
Figure 10.
Fitting results of branch admittances (a) Y1, (b) Y2 and (c) Y3.
As seen in Figure 10, the fitting results of the three branches are in good agreement with the original results. Only the phase of Y1 is slightly wrong when compared with the original results in the range of 30 kHz–30.2 kHz. The reason for this error is mainly due to the fact that the fitting order is not optimized to the best in the fitting process, considering the complexity of the branch model. The error exists in a narrow frequency range, where the maximum error is about 0.1 rad. The phase values of the original results are greater than 1.4 rad in this frequency range, and the maximum relative error is less than 8%, which is small. The fitting results basically meet the requirements.
3.3. Simulation and Analysis of Pi-Type Equivalent Circuit Model
According to the theoretical derivation in 2.3, Yi are the branch admittances of the pi-type equivalent circuit model. The poles, residues and constant terms in Equation (1) are obtained by fitting. Then the inductances, resistances, capacitances and conductance are determined according to Equations (10), (17), (18) and (20). By combining the models shown in Figure 2, Figure 3 and Figure 4, the branch admittance models are obtained, as shown in Figure 11.
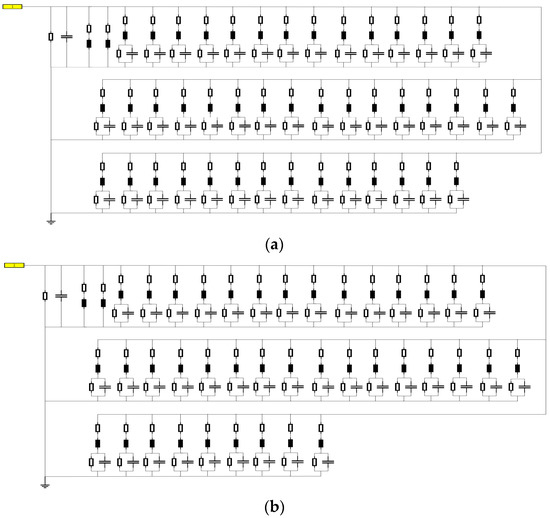
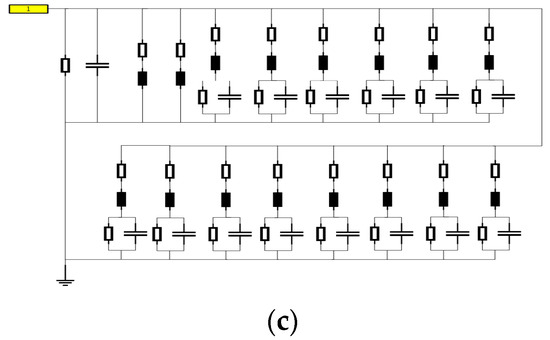
Figure 11.
The circuit models of branch admittances (a) Y1, (b) Y2 and (c) Y3.
The modeling and simulation of branch admittances are carried out in the simulation software. The simulation results for each branch are shown in Figure 12.
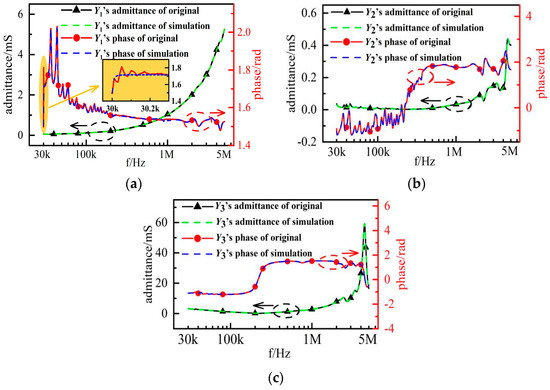
Figure 12.
Simulation results of branch admittances (a) Y1, (b) Y2 and (c) Y3.
As illustrated in Figure 12, the simulation results of the three branch admittances are in good agreement with the original results. Only the phase of Y1 is partially in error with respect to the original results between 30 kHz and 30.2 kHz, and the error mainly originates from two aspects. On the one hand, there are errors between the fitting results and the original results. The parameters of each circuit element in the simulation model are calculated based on the fitting results. According to the Y1 phase in Figure 10, it can be seen that there is an error between the fitting results and the original results in the range of 30 kHz–30.2 kHz. As a result, the simulation results of Y1 in the simulation model have errors with the original results. On the other hand, the error is due to the limited accuracy of the calculation in the simulation and the limited accuracy of the parameters used in the modeling. The error is small and basically meets the requirements of engineering applications, which shows the accuracy of the branch models.
According to the pi-type equivalent circuit diagram shown in Figure 1, the pi-type model in the range of 30 kHz–5 MHz is obtained by connecting the three circuit models of branch admittances, which is shown in Figure 13.
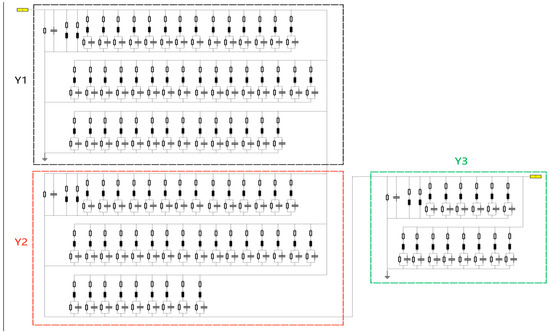
Figure 13.
The pi-type equivalent circuit model.
In this paper, we are mainly concerned with the transmission characteristics of the model, including the amplitude–frequency characteristics and phase–frequency characteristics. The pi-type model is simulated, and the measurement and simulation results are shown in Figure 14.
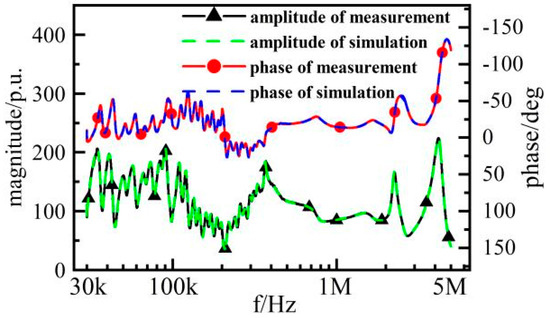
Figure 14.
Simulation results of transmission characteristics of pi-type model in 30 kHz–5 MHz.
As seen in Figure 14, the simulation results of the transmission characteristics of the pi-type model are in good agreement with the actual measured results of the voltage transformer, which shows the accuracy of the pi-type model. The measurement results of the transmission characteristics are calculated based on the admittances shown in Figure 7, and the calculation relationship is shown in Equation (21).
3.4. Simulation and Analysis of Wide-Band Model
In Section 3.3, the pi-type model is established from 30 kHz to 5 MHz based on the admittance of the transformer. The simulation results show that the model can accurately simulate the transfer characteristics.
In order to model the voltage transformers in DC-5 MHz, the pi-type model needs to be modified. Then, the modified model can simulate the transfer characteristics from DC to 5 MHz. The pi-type model is simulated to obtain Y12 and Y22 in DC-5 MHz. Equation (21) shows that the transfer characteristics can be calculated from Y22 and Y12. Based on the simulated Y12 and the transfer characteristics from DC to 30 kHz, the Y22 in the simulation model can be corrected in DC-30 kHz. According to Equations (6)–(8), the correction to Y22 only affects the branch admittance of Y3 in the pi-type model; so, only the model of Y3 needs to be corrected. According to Equation (21), the corrected Y3 is calculated from the corrected Y22 and Y12 in DC-5 MHz. It is called to the original result below. The modeling of the modified Y3 is carried out in the simulation software. The circuit model is shown in Figure 15.
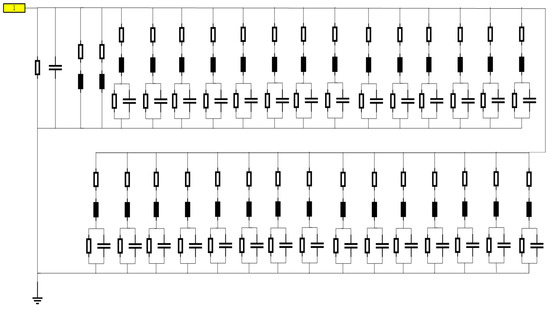
Figure 15.
The circuit model of corrected Y3.
The modified Y3 is fitted according to the vector fitting method. The fitting order is 60, the iteration number is 50, the initial pole spacing is linear spacing and the weight is the inverse of the square root of the modulus of Y3. The simulation of the modified Y3 is carried out in the simulation software. The fitting results and simulation results are shown in Figure 16.
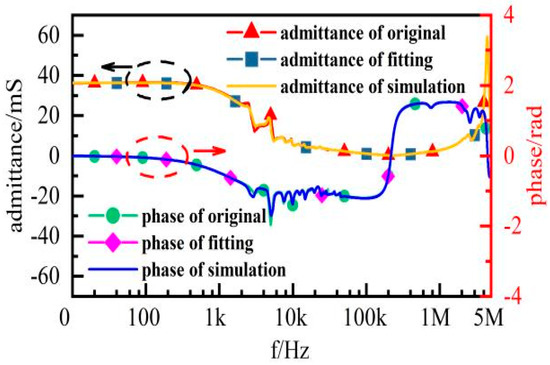
Figure 16.
Fitting results and simulation results of corrected Y3.
As shown in Figure 16, the fitting results of the modified Y3 are basically consistent with the original results, the simulation results are also in good agreement with the original results. From this, it is clear that the modified Y3 has high accuracy. The final wide-band model can be obtained by changing the model of Y3 with the rest unchanged. The wide-band model of the voltage transformer is shown in Figure 17. The simulation results of its transmission characteristics are shown in Figure 18.
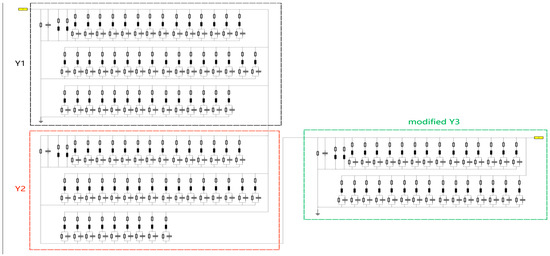
Figure 17.
The wide-band model of voltage transformer.
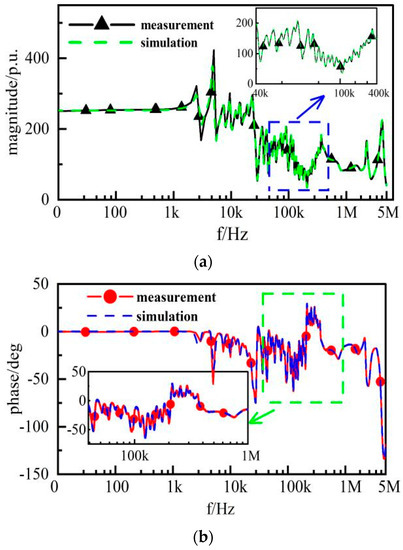
Figure 18.
Simulation results of (a) amplitude–frequency characteristic and (b) phase–frequency characteristic of wide-band model.
In Figure 18, the simulation results of the transmission characteristics are in good agreement with the actual measured data. The model can accurately simulate the actual transmission characteristics, and it has high accuracy.
To further verify the model, fast pulse experiments were carried out on the voltage transformer. The fast pulse voltage was injected into the primary side of the transformer, and the data of the fast pulse voltage were imported into the simulation model as the excitation source. The actual measured data and simulation results of secondary side voltages are compared, and the results are shown in Figure 19.
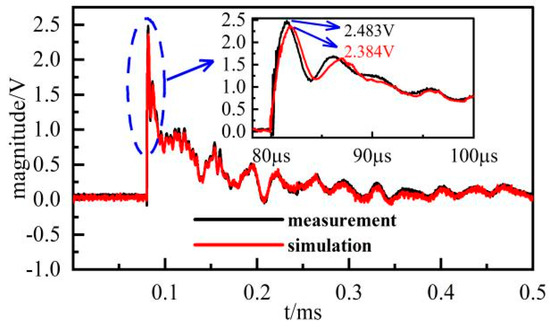
Figure 19.
Measurement and simulation results of secondary side.
As seen in Figure 19, when the wide-band model is injected with the fast pulse voltage as the excitation, there is a partial time differences between the simulation results and the actual measured results at the peak. The difference is very small, within 2.5 μs. The whole process of fast pulse experiments is about 475 μs, so the time differences can be ignored. The absolute error of amplitude at the peak is about 99 mv, and the relative error is 3.99%. The errors are mainly caused by two aspects: one is the partial error of the transmission characteristics between the simulation and actual measurement, and the other is the measured error during the fast pulse experiment. The simulation results basically match with the measured results. The errors are small and meet 10% of the requirements for engineering applications. The error is acceptable. Therefore, it can be seen from the simulation results that the wide-band model can simulate the actual transmission characteristics accurately, which further proves that the wide-band model of voltage transformers in EMUs has a high accuracy.
4. Conclusions
In order to improve the accuracy of the voltage transformer model in EMUs, the black-box model method is used to establish a wide-band model of voltage transformers in this paper. The pi-type model in the range of 30 kHz–5 MHz is established based on the equivalent circuit of a two-port network and the vector fitting method. According to the transmission characteristics and simulation results of the pi-type model from DC to 30 kHz, the pi-type model is modified to obtain the wide-band model. The simulation results of the wide-band model and fast pulse experiment show that the model has high accuracy. The wide-band model of the voltage transformer provides a new idea and method for modeling the voltage transformer in EMUs, and it improves the shortcomings and defects of the current voltage transformer model in the field of EMUs.
Author Contributions
Methodology, Y.W.; software, Y.W. and Y.C.; validation, Y.C. and X.T.; resources, Q.W. and J.Z.; writing—original draft preparation, Y.W. and Y.C.; writing—review and editing, X.L. All authors have read and agreed to the published version of the manuscript.
Funding
This research was funded by The Fundamental Research Operation Funds of the Central Universities of China, grant number 2682021ZTPY128, 2682021ZT039 and Key R&D Project of Sichuan Science and Technology Department, grant number 2022YFG0248, 2022YFG0253.
Data Availability Statement
The data presented in this study are available on request from the corresponding author. The data are not publicly available due to the data also featuring as part of an ongoing study.
Conflicts of Interest
The funders had no role in the design of the study; in the collection, analyses, or interpretation of data; in the writing of the manuscript; nor in the decision to publish the results.
References
- Wan, Y.S.; Liu, Y.Y.; Gao, G.Q. Influence of grounding mode on surge overvoltage caused by pantograph raising in high-speed EMU. J. China Railw. Soc. 2017, 39, 32–37. [Google Scholar]
- Zheng, Y.; Liu, Y.Y.; Wan, Y.S.; Gao, G.Q.; Cao, B.Y. Simulation and analysis of overvoltage on the body of high-speed train Caused by lightning Catenaries. High Volt. Appar. 2017, 53, 44–49. [Google Scholar]
- Jiang, Z.Y. Research on the Fault Mechanism of On-Board Network Voltage Transformer of EMU. Master’s Thesis, Dalian Jiaotong University, Dalian, China, 2019. [Google Scholar]
- Lu, F.C.; Han, F.; Wang, F.C.; Jia, B.C. Overvoltage in CRH reactor lifting process and simulation analysis of restraining measures. High Volt. Appar. 2008, 52, 1–6. [Google Scholar]
- Cheng, B. Simulation and Suppression Research of High-Voltage Closing Overvoltage of EMU. Master’s Thesis, Southwest Jiaotong University, Sichuan, China, 2019. [Google Scholar]
- Gong, X.H.; Kong, W.Z.; Yu, Z.Q.; Yuan, Y.C.; He, J.L. Experimental study on broadband transmission characteristics of substation transformers. High Volt. Eng. 2009, 35, 1736–1742. [Google Scholar]
- Kaczmarek, M.; Jama, S. Accuracy of inductive voltage transformer in the presence of voltage high harmonics. In Proceedings of the 2014 International Conference on High Voltage Engineering and Application, Poznan, Poland, 8–11 September 2014; pp. 1–4. [Google Scholar]
- Zhang, Z.Y.; Chen, Y.T. A high frequency circuit model for potential transformer in Gas insulated substation based on the black box method. High Volt. Appar. 2008, 44, 259–300. [Google Scholar]
- Zhang, Z.Y.; Chen, Y.T.; Liu, Y.P. High frequency circuit model of transformer windings based on frequency responses for VFTO studies. In Proceedings of the 2008 Third International Conference on Electric Utility Deregulation and Restructuring and Power Technologies, Nanjing, China, 6–9 April 2008; pp. 1528–1532. [Google Scholar]
- Sui, X.F. Research on the Modeling Method of High Frequency Passive Circuit of Voltage Transformer. Master’s Thesis, North China Electric Power University, Baoding, China, 2009. [Google Scholar]
- Zhang, T.H.; Pu, Z.L.; Han, C.G.; Li, X.Q.; Wang, Q.F.; Zhang, J.Q. Research on the operating overvoltage characteristics of intercity trains when closing circuit breakers. Insul. Surge Arresters 2021, 6, 81–87. [Google Scholar]
- Gustavsen, B.; Semlyen, A. Simulation of transmission line transients using vector fitting and modal decomposition. IEEE Trans. Power Deliv. 1998, 13, 605–614. [Google Scholar] [CrossRef]
- Gustavsen, B.; Semlyen, A. Rational approximation of frequency domain responses by vector fitting. IEEE Trans. Power Deliv. 1999, 14, 1052–1061. [Google Scholar] [CrossRef]
- Gustavsen, B. Improving the pole relocating properties of vector fitting. IEEE Trans. Power Deliv. 2006, 21, 1587–1592. [Google Scholar] [CrossRef]
Disclaimer/Publisher’s Note: The statements, opinions and data contained in all publications are solely those of the individual author(s) and contributor(s) and not of MDPI and/or the editor(s). MDPI and/or the editor(s) disclaim responsibility for any injury to people or property resulting from any ideas, methods, instructions or products referred to in the content. |
© 2023 by the authors. Licensee MDPI, Basel, Switzerland. This article is an open access article distributed under the terms and conditions of the Creative Commons Attribution (CC BY) license (https://creativecommons.org/licenses/by/4.0/).