Article

High-Frequency Oscillation Suppression Strategy for Flexible DC Transmission Systems Based on Additional Joint Damping

1
State Grid Fujian Electric Power Research Institute, Fuzhou 350007, China
2
Fujian Key Laboratory of Smart Grid Protection and Operation Control, Fuzhou 350007, China
3
College of Electrical Engineering, Sichuan University, Chengdu 610065, China
*
Author to whom correspondence should be addressed.
Electronics 2023, 12(13), 2825; https://doi.org/10.3390/electronics12132825
Submission received: 3 June 2023 / Revised: 22 June 2023 / Accepted: 23 June 2023 / Published: 26 June 2023

Abstract

:
Flexible DC transmission systems experience negative damping characteristics in the high-frequency range due to the delay in the system control link. This can lead to interactions between the impedance of modular multilevel converters (MMCs) and AC transmission lines, resulting in high-frequency oscillation (HFO) issues. To resolve this problem, a simplified MMC control model was developed, taking into account the current inner loop control link. The Sobol method was employed to analyze the factors influencing the impedance characteristics of MMC. Additionally, a combined approach involving a virtual passive filtering method and an equivalent current sampling method was proposed to provide additional damping. The study compared and analyzed the impact of additional damping control on the impedance characteristics and system stability of MMCs. Lastly, a flexible direct current grid connection simulation model was constructed using PSCAD to validate the effectiveness of the proposed additional damping control strategy.

1. Introduction

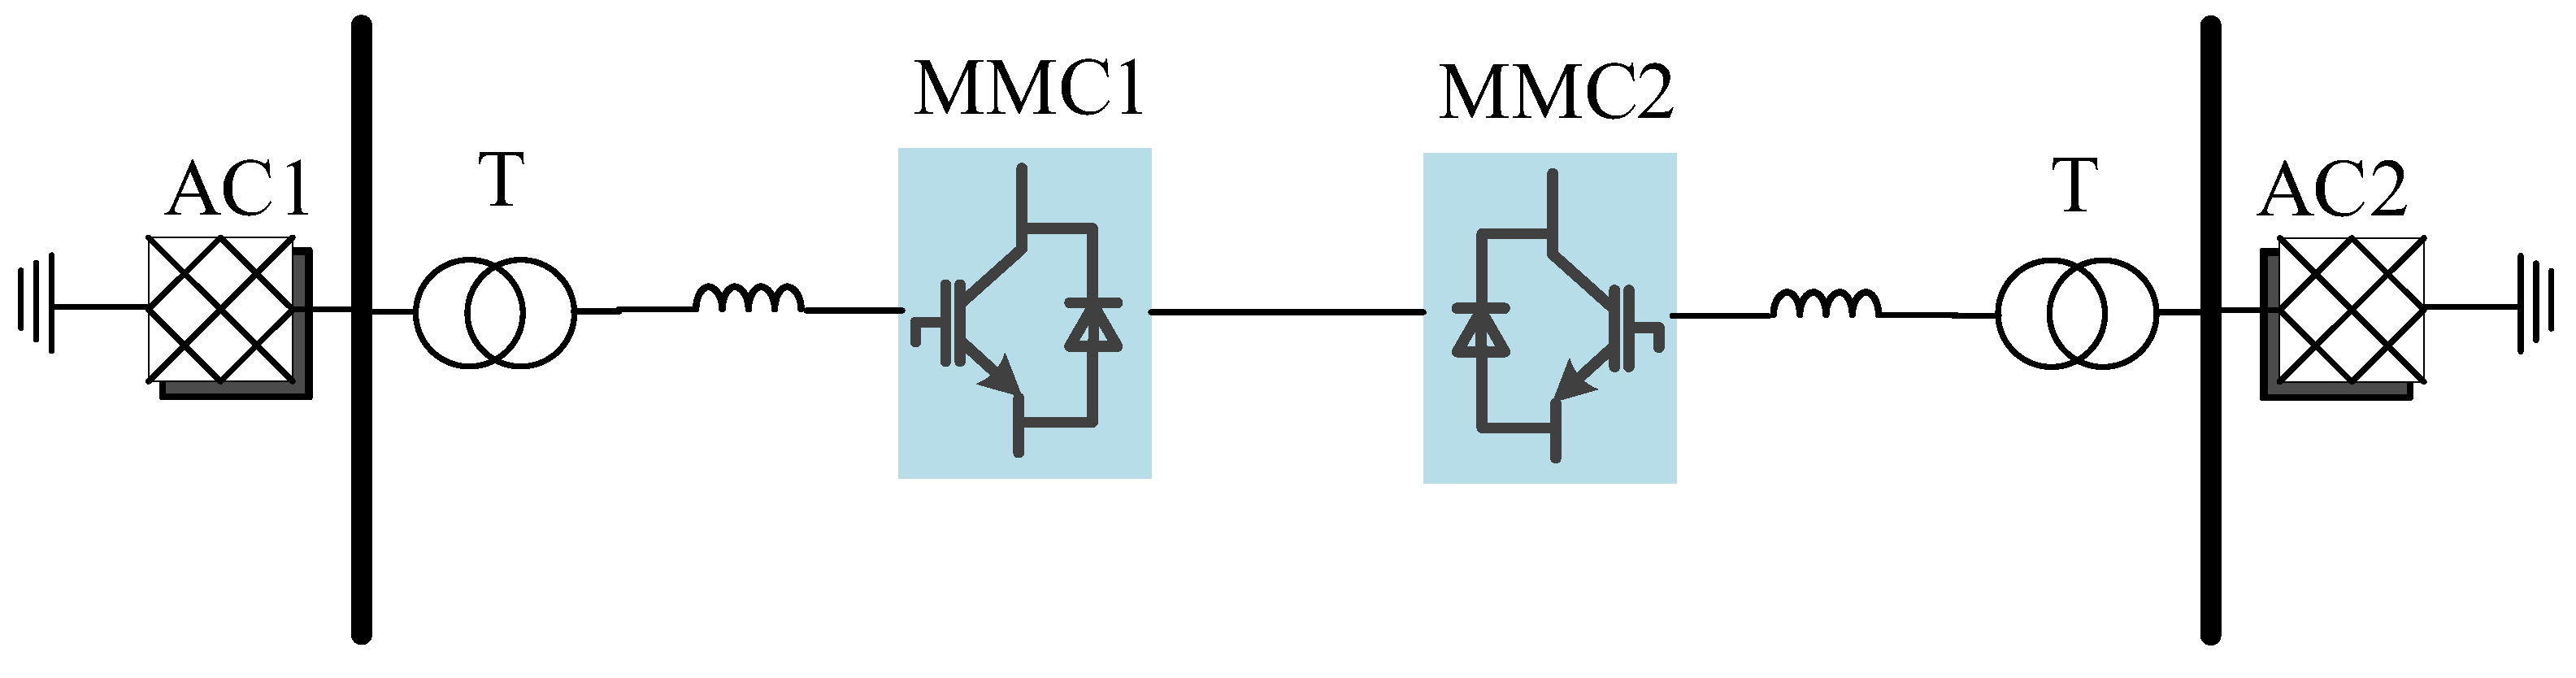
The modular multilevel converter-based high voltage direct current (MMC-HVDC) is an innovative transmission technology that offers several advantages, including independent control over active and reactive power, power support for weak current networks and passive loads, low harmonic levels, and avoidance of commutation failures. As a result, it has found extensive application in areas such as high-voltage DC transmission and new energy grid integration [1,2]. However, MMCs encounter several challenges, with a significant one being high-frequency oscillations (HFOs). The presence of resonance points at specific frequencies between the MMC and the equivalent impedance of the AC system can result in resonance within the AC/DC system. Furthermore, the multi-timescale dynamic characteristics of MMCs amplify the risk of resonance in AC/DC systems. HFO adversely impacts the stability and safety of the system [3,4,5], and in severe cases, it can even result in system runaway.
In resonance analysis, the primary methods used for theoretical analysis are modal analysis and impedance analysis. References [6,7,8] investigated the oscillation mechanism of MMCs using the modal analysis method. However, this approach necessitates the re-derivation of the state matrix to accommodate modifications in system structure, parameters, or control strategies. In practical engineering, communication systems exhibit complex characteristics, posing challenges in obtaining feature matrices. Therefore, the impedance analysis method has garnered significant attention in recent years. In [9], they developed a hybrid interconnected system impedance model between MMCs and a weak AC power grid, analyzing the coupling relationship between MMC impedance and AC power grid impedance. Reference [10] employed the multi-harmonic linearization method to establish a calculation approach for the AC- and DC-side impedances of series-type MMCs, while also presenting a detailed derivation process. To address the issue of neglecting internal dynamics in modeling the high-frequency range of flexible DC transmission stations, the author in [11] developed an MMC DC impedance model that takes into account various control conditions and analyzed the output characteristics of DC ports. Reference [12] introduced a precise impedance model that accounts for the impact of phase-locked loops, power outer loops, and voltage–current inner loops on the impedance characteristics of MMC. This model serves as a crucial theoretical foundation for resolving system stability and HFO issues.
To address the HFO phenomenon in flexible DC transmission technology, reference [13] developed a mathematical model for the high-frequency impedance of MMCs, taking into account link delay. They also proposed a strategy for suppressing HFOs by incorporating a band-stop filter in the voltage feedforward link. The authors in [14,15] uncovered that the negative damping characteristics of MMC impedance in the mid to high frequency range serve as the fundamental cause of HFOs in flexible DC grid-connected systems. Consequently, they proposed an additional damping control strategy to suppress resonance. References [16,17] summarized four strategies for suppressing HFOs using additional damping control. They also analyzed the impact of these four additional damping controls on improving the negative damping characteristics of MMCs and suppressing HFOs. However, the additional damping suppression strategy in [16,17] only focuses on adjusting the reference voltage through voltage or current feedback, resulting in limited effectiveness in suppressing oscillations. Hence, this paper proposes a joint additional damping control strategy that combines voltage feedback and current feedback to address the shortcomings of single additional damping control in suppressing HFOs and enhancing system stability.
This article initially examines the current inner loop control to develop a simplified control model for MMCs. It employs Sobol’s method to analyze the factors influencing the AC side impedance of MMCs. Subsequently, this article introduces a combined approach for additional damping suppression that integrates virtual passive filtering and equivalent current sampling. The proposed method mitigates HFOs by incorporating filters into the voltage feedforward. Lastly, this article employs PSCAD for time-domain simulations to validate the accuracy of the analysis findings regarding the influencing factors and the resonance suppression strategy.
This article introduces an additional damping controller based on impedance analysis method to suppress HFOs in MMC-HVDC systems. In comparison to traditional additional damping controllers, this controller incorporates current feedback during the design process, resulting in a more potent suppression effect. Using the dual-ended flexible DC transmission system as an example, this article presents the following main contributions:
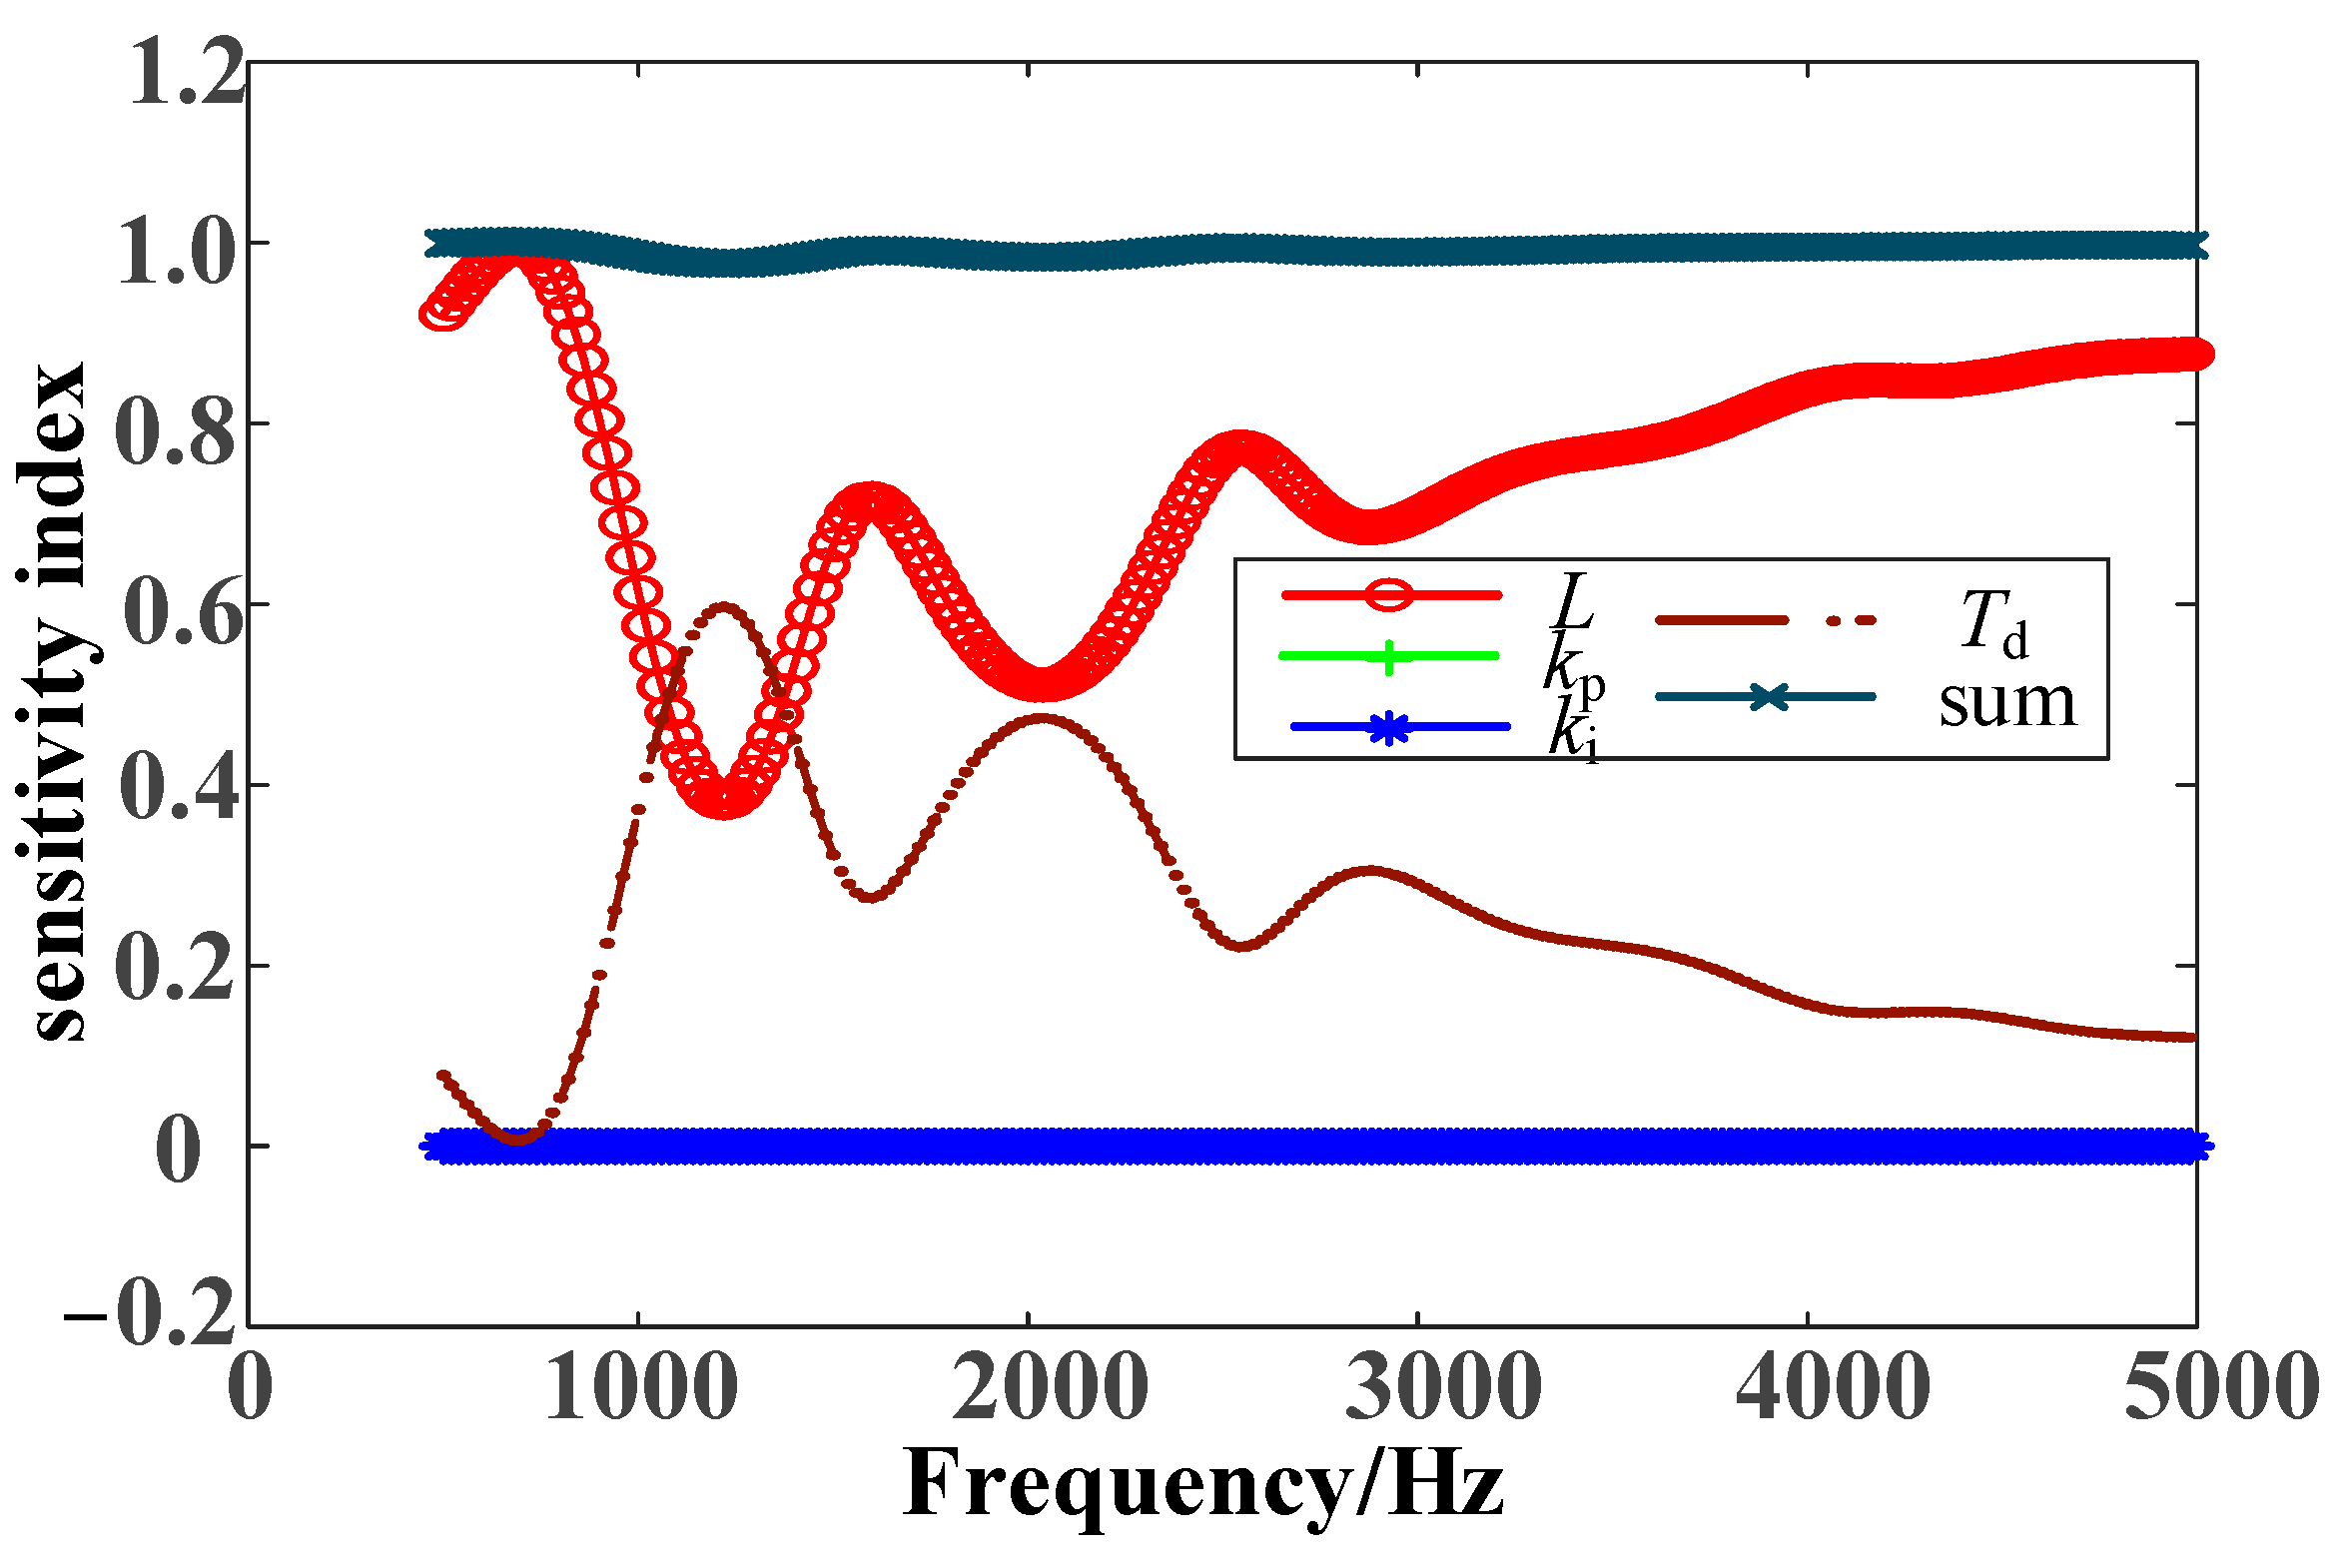
(1) Utilizing the MMC impedance model that accounts for current inner loop control, the Sobol algorithm was employed to analyze the impact of different factors on HFOs, and the significant factors influencing MMC impedance in distinct frequency ranges were identified.
(2) A novel additional damping controller is proposed, which combines the virtual passive filtering method and the equivalent current sampling method. The controller employs output voltage and current as its state variables, resulting in a more potent damping suppression effect.
The remainder of the article is structured as follows: Section 2 presents the impedance model based on a dual-ended flexible DC transmission system. Subsequently, Section 3 employs sensitivity calculations using the Sobol algorithm to analyze the primary factors influencing HFOs in each frequency band. Section 4 introduces an additional damping controller and compares the suppression effects of various damping controllers. The effectiveness of the proposed method for suppressing HFOs is verified through simulation analysis in Section 5. The article concludes with Section 6.

2. Impedance Model of Flexible and Direct Current Grid-Connected System

This article focuses on a typical dual-ended flexible DC transmission system structure, as illustrated in Figure 1. The research object comprises an MMC converter station, connecting transformer, and AC system. The AC system and flexible DC system are interconnected through the common connection point of the AC bus.

2.1. The Mathematical Model of MMC

Figure 2 illustrates the structure of the main circuit of the MMC, which follows a modular design topology. It comprises N sub-modules with identical modular structures and a series bridge arm reactor Lm. Each pair of bridge arms forms a phase unit, and three phase units are connected in parallel to constitute a three-phase MMC.
In Figure 2, Udc denotes the DC-side voltage, idc represents the DC line current, and Rm and Lm correspond to the resistance and inductance of the bridge arm, respectively.
The harmonic linearization method is a small-signal technique that enables direct linearization of periodic time-varying operating trajectories. This method offers the advantages of a simple modeling concept and wide applicability, particularly in MMC impedance modeling [18]. Figure 3 presents the simplified control model used to analyze the high-frequency impedance characteristics of the MMC [15,16].
In Figure 3, Req is the equivalent resistance on the line; Leq is the equivalent inductance of the converter and MMC, which is equal to the sum of 1/2 of the MMC bridge arm reactor Larm and the leakage inductance Lt of the connecting transformer; GTd is the transfer function of the system control delay link; Gi is the current inner loop transfer function; Glv is the voltage feedforward transfer function; idq ref is the inner loop current reference value; Upcc-dq is the dq axis component of the grid point voltage; and idq is the output current dq axis component.
At this point, the high-frequency impedance ZMMC can be obtained as:
Z M M C s = R e q + s L e q + G T d G i 1 G l V G T d
G T d = e s T
G l v = 1 1 + s T m
In Equation (3), Tm is the time constant of the first-order low-pass filter, and the cutoff frequency f satisfies f = 1/(2πTm).

2.2. The Model of Alternating Current System

Considering that in practical engineering, the impedance characteristics of AC systems in the medium to high frequency range (above 300 Hz) may exhibit capacitance, the use of resistor and inductor series branches cannot accurately reflect the characteristics of AC power grids. Therefore, in the modeling process, it is necessary to employ a parallel connection between the resistive and capacitive branches (as depicted in Figure 4) to accurately simulate the capacitive characteristics that the impedance of the AC power grid may exhibit in the mid to high frequency range.
At this point, the impedance Zac (s) of the AC system can be expressed as:
Z a c ( s ) = 1 1 R 1 + s L 1 + s C 1
The corresponding parameters of the AC system are shown in Table 1.

2.3. Resonance Stability Criterion for Flexible DC Grid-Connected Systems

The resonance stability of the flexible DC grid-connected system is related to the ratio of the transfer function of the impedance of AC system to the transfer function of the impedance of the converter MMC. The Nyquist stability criterion indicates that if the difference between the impedance phase angle of the AC system and the equivalent impedance phase angle of the MMC is less than 180°, or if the amplitude of the AC system is less than the amplitude of the MMC impedance, the system is stable [14].
The AC system may have multiple resonance points, and near the resonance peak, the power grid’s impedance amplitude is high, posing a challenge in satisfying the condition where the AC system’s amplitude is lower than the equivalent impedance amplitude of the MMC. Consequently, in order to ensure system stability and suppress HFOs, it is essential to maintain a phase angle difference of less than 180°.

3. Analysis of Factors Influencing Impedance of MMC Converter Station

3.1. Principle of Impedance Sensitivity Method Based on Sobol Algorithm

This article utilizes the Sobol global sensitivity algorithm as the chosen sensitivity analysis method, which is a variance-based approach. The fundamental concept of this method involves decomposing the output variance of the target model into a combination of single parameters and multi-parameter subfunctions. By evaluating the variance of individual input parameters or parameter sets in the model, it becomes possible to quantify the extent of parameter influence and interaction between parameters. A brief overview of the Sobol global sensitivity algorithm is provided below.
The model under analysis is represented as Y = f (X), where X = (x1, x2, x3, …, xn) and its domain is an n-dimensional unit body, with n denoting the number of input parameters for the model. The Sobol method’s concept involves decomposing Y into an individual element in X and the summation of any combination of its components, as shown below:
f ( X ) = f 0 + i = 1 n f i ( x i ) + 1 i < j n f i , j ( x i , x j ) + + f 1 , 2 , n ( x 1 , x 2 , , x n )
Within the equation, the first term, f0, denotes a constant, while the second term represents the effect function resulting from an individual input change. Likewise, the third term indicates the function resulting from simultaneous changes in two inputs, and so forth. At this point, the integration of each decomposed sub-term with any input factor it contains yields a value of 0:
0 1 f i , , i ( x i , x i , , x i ) d x i = 0
The above two equations indicate that the sub-terms in Equation (6) are orthogonal, that is, when (i1, i2, …, is) ≠ (j1, j2, …, js) satisfies the following relationship:
Ω f i 1 , , i s f j 1 , , j s d X = 0
In the equation, Ω represents all value domains of X during continuous integration. From the above theory, all terms to the right of Equation (5) can be obtained. Based on all the above conditions, the total variance of model f(X) can be obtained as follows:
D = Ω f 2 ( X ) d X f 0 2
The S-order deviation is as follows:
D i , , i = 0 1 0 1 f i , , i ( x i , x i , , x i s ) d x i d x i d x i s
The relationship between the total variance and the bias of each order is as follows:
D = i = 1 n D i + 1 i < j n D i , j + + D 1 , 2 , n
And the sensitivity coefficient of a certain order is defined as the deviation of that order divided by the total variance:
S i , , i = D i , , i D
In the context of global sensitivity analysis using the Sobol method, the integrals in Equations (9) and (10) are computed through estimation using Monte Carlo sampling. The Monte Carlo simulation method offers a means to approximate solutions for related technical problems by utilizing experiments and random simulations. With the selection of a sufficiently large number of random samples, the application of this method becomes nearly limitless. The following presents the estimated values of f0 and D obtained through Monte Carlo simulations.
f 0 = 1 N m = 1 N ( X m )
D = 1 N m = 1 N f 2 ( A ) j f 0 2
The first order sensitivity coefficient Si is as follows:
S i = D i D = 1 N j = 1 N f ( B ) j ( f ( A B ( i ) ) j f ( A ) j ) D
The sum of the sensitivities of each order of a parameter is defined as its global sensitivity ST:
S T = 1 2 N j = 1 N ( f ( A ) j f ( A B ( i ) ) j ) 2 D
In Equations (12)–(15), N represents the number of sampling points, A and B are the original sample matrix, and AB(i) signifies the sample matrix obtained by splitting the original sample matrix and replacing its columns.
The first-order sensitivity coefficient quantifies the individual impact of a specific factor on the output, while the global sensitivity coefficient captures the overall contribution of the input factor to the squared difference, encompassing the higher-order effects and interactions with other factors. Furthermore, a notable difference between the first-order sensitivity coefficient and the global sensitivity coefficient for a parameter suggests a substantial interaction between the input factor and other factors, resulting in a joint impact on the output.

3.2. Impedance Sensitivity Calculation

Sensitivity analysis involves using sensitivity algorithms to calculate the impact and trend of various influencing factors on a specific output or indicator, providing insights into the degree of influence when each factor undergoes changes. The calculation results of MMC impedance sensitivity indicate the extent to which different parameter changes affect the characteristics of MMC impedance. As the characteristics of MMC impedance are directly linked to the stability of AC/DC interconnected systems, understanding impedance sensitivity is crucial. Drawing upon the explicit expression of impedance derived from the preceding section, the factors that potentially impact the equivalent impedance ZMMC of the converter station are initially categorized into three groups: control system PI control parameters, system delay parameters, and main circuit parameters, as presented in Table 2.
Prior to conducting impedance sensitivity analysis, it is essential to provide an approximate initial range for each influencing factor based on the ZMMC model and simulation model, taking into account the constraints of control system response speed and stability margin. These ranges are presented in Table 3.
The specific implementation process is as follows: first, determine the input influencing factors as m, with a sampling number of N. Use the Monte Carlo or its variant method to obtain the initial sample matrix AN×m, BN×m with two N rows and m columns. By replacing the i-th column in matrix B with the i-th column in matrix A, m sample matrices AB(i) of N rows and m columns can be obtained. Therefore, a total of m + 2 matrices are obtained, with a total of (m + 2) ∗ N sets of input data. These input data are substituted into the impedance model established earlier, and the first-order sensitivity coefficient and total sensitivity coefficient of each input parameter to MMC impedance are calculated using the common Formulas (15)–(18) in the previous section. The results are shown in Figure 5 and Figure 6.
Observing Figure 5 and Figure 6, it can be observed that the main influencing factors on MMC impedance in the 500–1000 Hz frequency range are equivalent inductance and system control delay. As the frequency increased, the influence of system delay on MMC impedance gradually increased. The influence of current inner loop PI parameters on MMC were maintained at a relatively low level in the 500–1000 Hz frequency band.
A comparison of Figure 5 and Figure 6 reveals a striking similarity between global sensitivity and single sensitivity. Additionally, the greater the disparity between global sensitivity and single sensitivity, the more pronounced the interaction among impedance influencing factors. Hence, the interaction among impedance influencing factors can be considered weak.
By expanding the frequency band to 500–5000 Hz, the first-order sensitivity and global total sensitivity of each influencing factor on the AC side impedance within this frequency range were examined. Figure 7 and Figure 8 illustrate that the dominant factor influencing MMC impedance transitions from equivalent inductance to system delay between 1000 and 1300 Hz, and then back to equivalent inductance between 1300 and 5000 Hz. Furthermore, the first-order sensitivity coefficients of the dominant influencing factors within the 500–5000 Hz range closely aligned with the global total sensitivity coefficient. This consistency indicates a weak interaction between the influencing factors within the 500–5000 Hz range, signifying their relatively independent impact on the system.
Utilizing the partial parameters of the MMC and AC system presented in Table 1 and Table 4, we plotted the impedance characteristic curves of the MMC and AC system based on Equations (1) and (4). Figure 9 illustrates that the frequency at the point where the amplitudes intersect was 820 Hz, and the phase difference at this intersection exceeded 180°. Consequently, the system became unstable, leading to HFOs.

4. Effect of Additional Damping Control on Impedance Characteristics

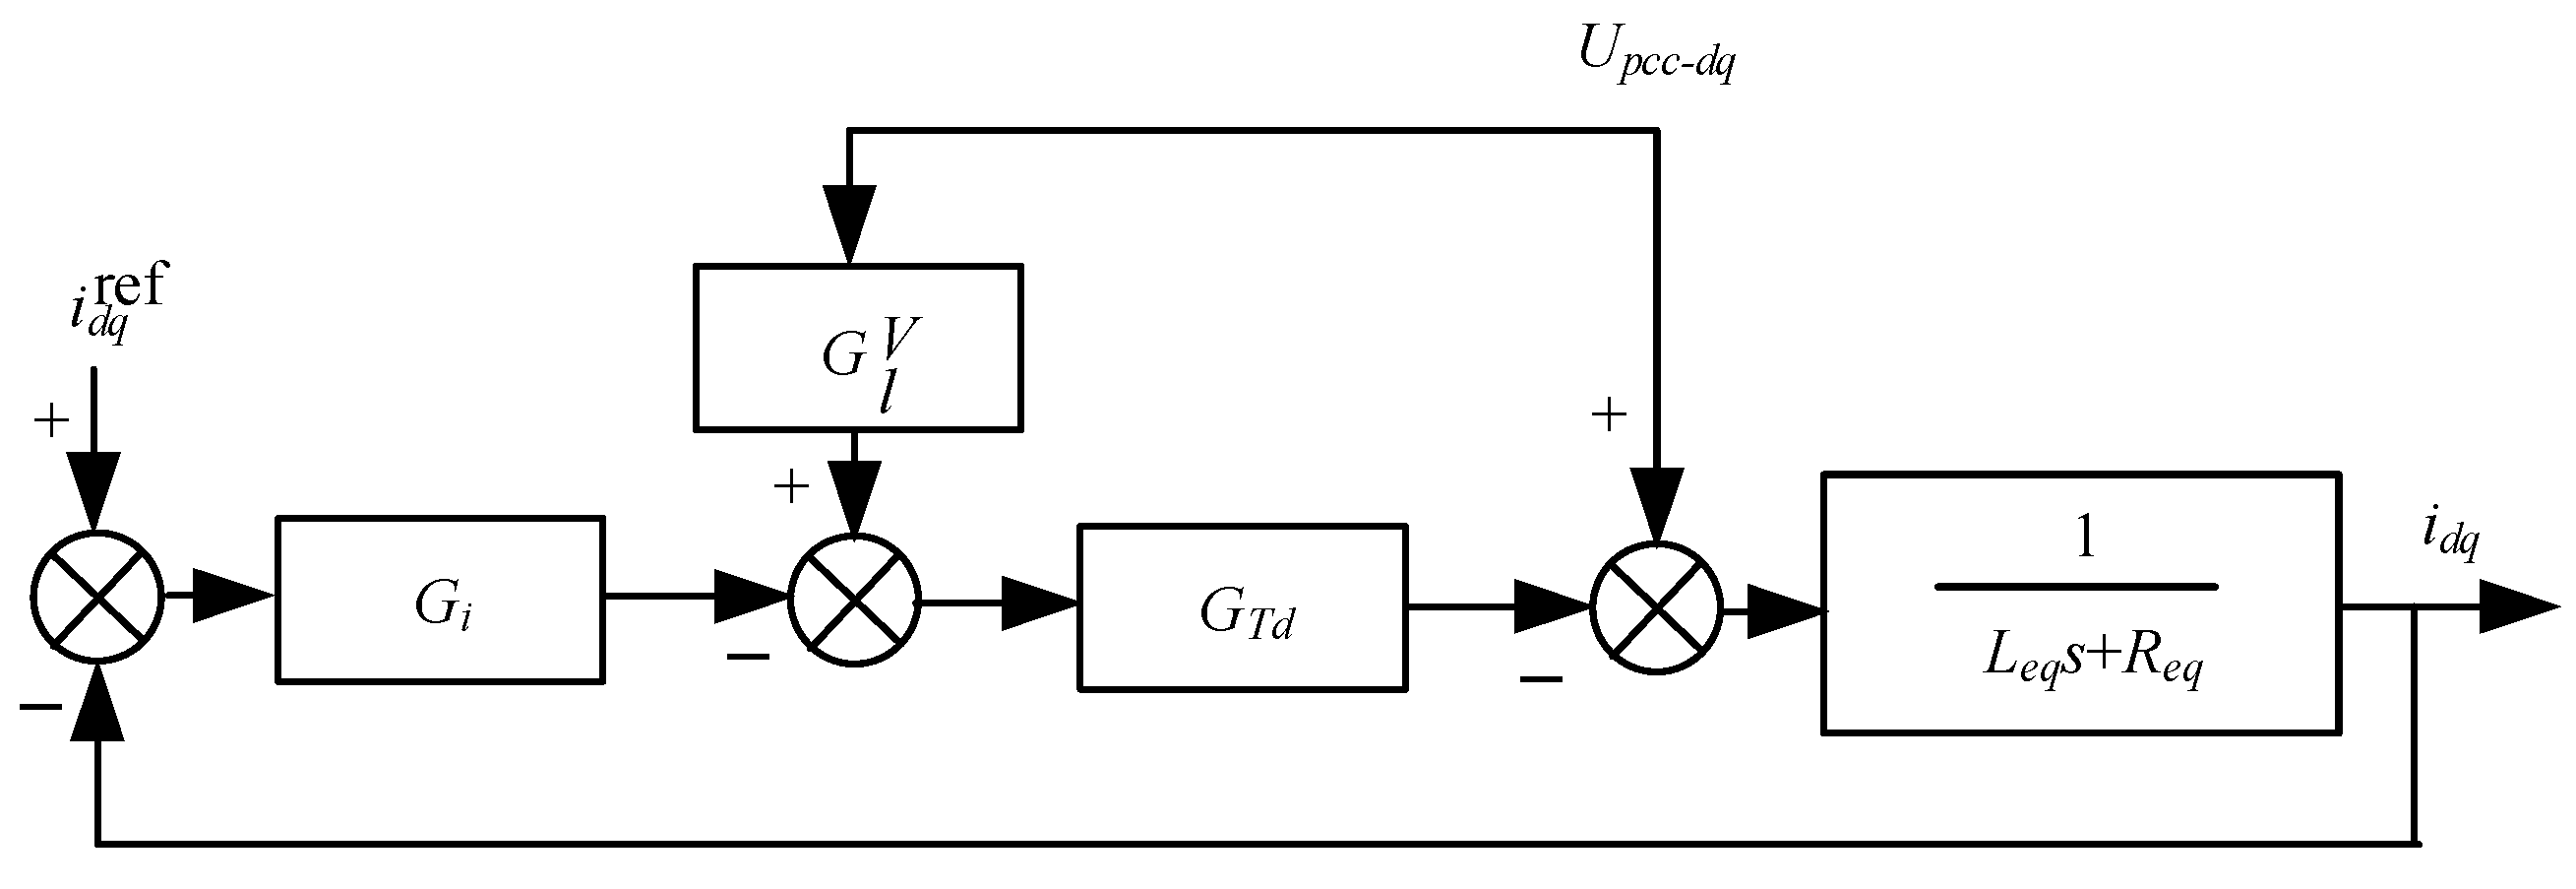
As mentioned previously, the primary factors influencing MMC impedance in the high-frequency range are equivalent inductance and system delay. Adjusting these parameters in existing practical engineering to suppress system oscillation proves challenging. Hence, this study investigated the impact of additional damping control on MMC impedance. The existing additional damping control primarily entails overlaying the instantaneous value of the feedforward voltage onto the reference current via the HFO damping controller G1. It is then added to the reference voltage after undergoing adjustment by the current inner loop [13,15], as depicted in 
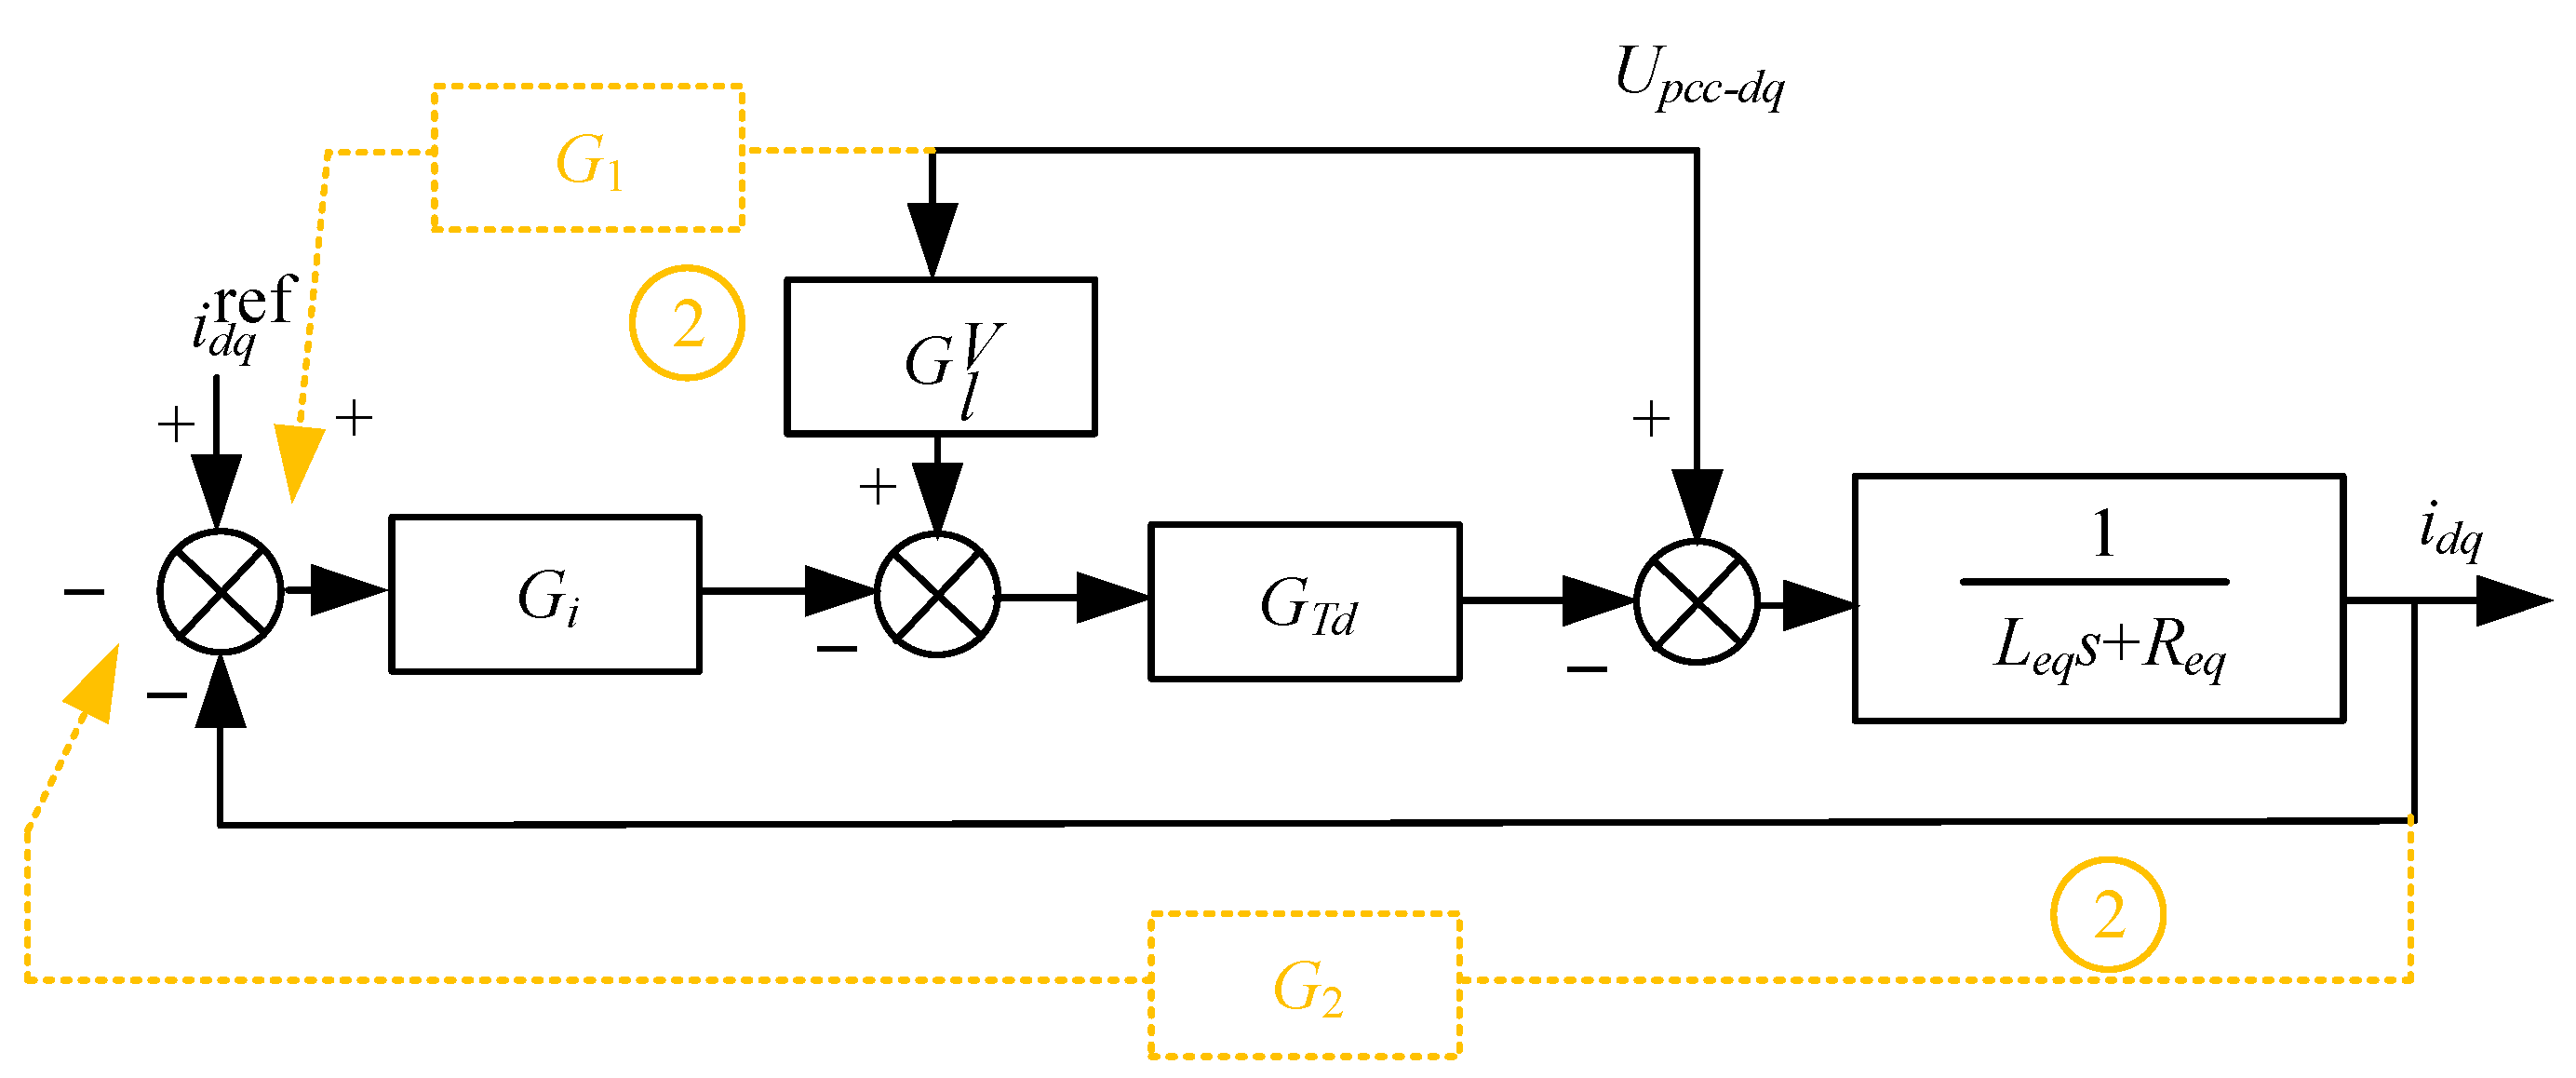
Figure 10. In this article, a novel joint additional damping control method is proposed. This approach combines the instantaneous values of the feedforward voltage and output current with the reference current through HFO damping controllers G1 and G2. Subsequently, they were added to the reference voltage via current inner loop adjustment. The control principle of this method is presented in Figure 11.
In Figure 10 and Figure 11, Req is the equivalent resistance on the line; Leq is the equivalent inductance of the converter and MMC, which is equal to the sum of 1/2 of the MMC bridge arm reactor Larm and the leakage inductance Lt of the connecting transformer; GTd is the transfer function of the system control delay link; Gi is the current inner loop transfer function; GVl is the voltage feedforward transfer function; iref dq is the inner loop current reference value; Upcc-dq is the dq axis component of the grid point voltage; and idq is the output current dq axis component.
Figure 10 presents a simplified control model for the MMC utilizing the pre-existing additional damping control. For the sake of simplicity, this control is denoted as Scheme 1. Figure 11 displays a simplified control model for the MMC featuring combined additional damping control, as depicted in the block diagram. This control variant will be designated as Scheme 2 for the sake of simplicity.

4.1. The Effect of Virtual Passive Filtering Method on the Impedance Characteristics of MMC

According to Figure 10, combining Equation (1), it can be inferred that the high-frequency impedance ZMMC at this time is:
Z M M C s = R e q + s L e q + G T d G i 1 + ( G 1 G i G l V ) G T d
Common filters can be divided into low-pass filters, band-stop filters, and nonlinear filters. This article mainly analyzes second-order damping controllers [15] and band-stop filters [13]. The second-order damping controller mainly consists of a low-pass filter, a high-pass filter, and a gain ks. When using a second-order damping controller, the expression of G1 is:
G 1 ( s ) = k s s s + 2 π f H P F . 2 π f L P F s + 2 π f L P F
In the formula, fHPF and fLPF are the bandwidth frequencies of the high-pass and low-pass filters, respectively. This article takes ks = −0.8, fLPF = 800 Hz, and fHPF = 100 Hz as the initial research objects.
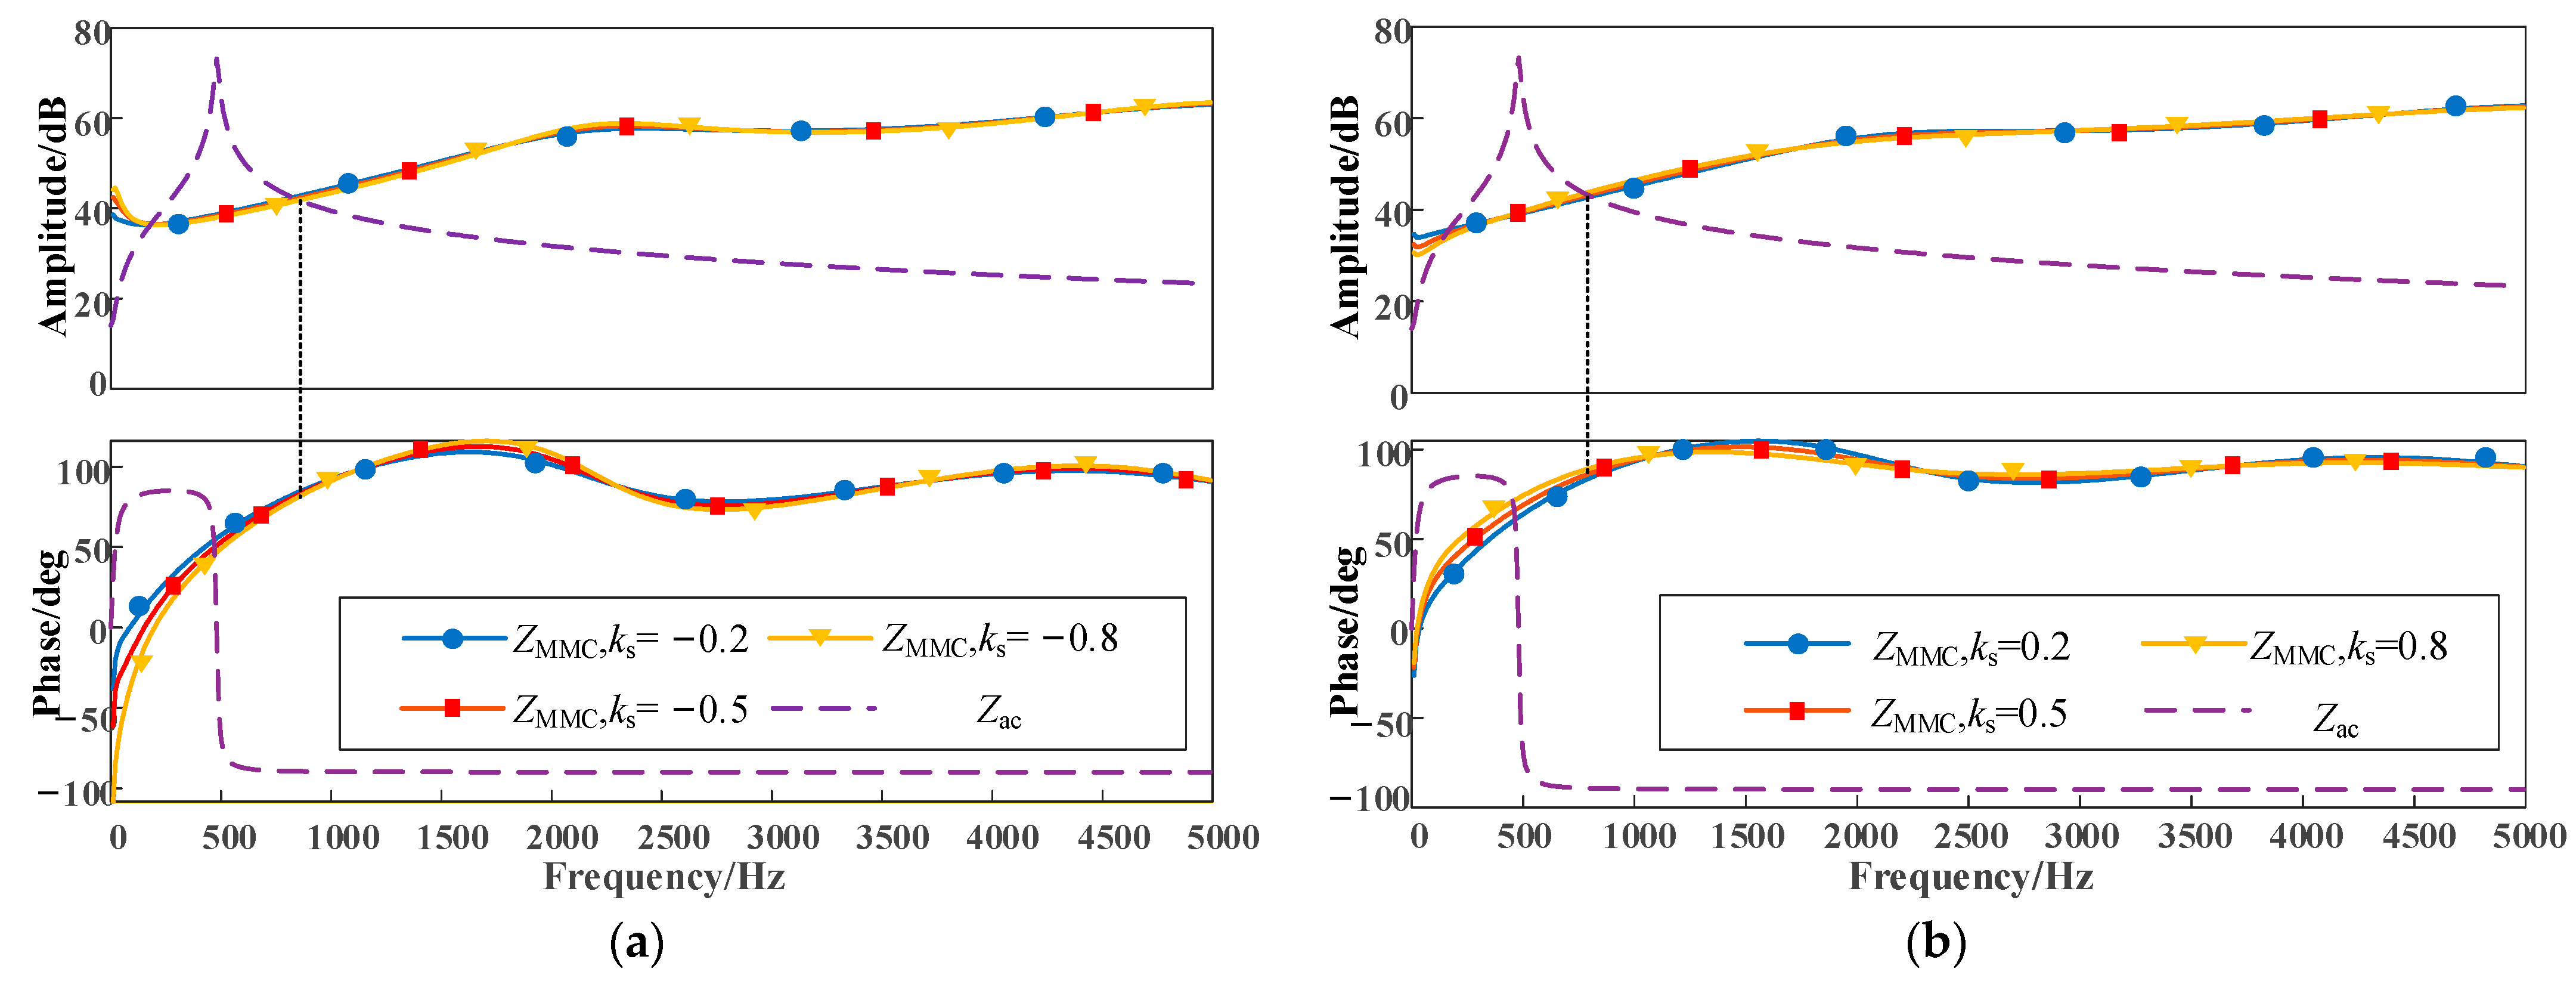
Next, the gain ks of the second-order damping controller is adjusted. The amplitude and phase angle characteristics of the MMC converter station impedance and the AC system impedance when the gains ks are −0.8, −0.5, −0.2, 0.2, 0.5, and 0.8, are shown in Figure 12a,b. Due to the effect of an additional filter, when ks = −0.2, the frequency at the amplitude intersection point was 820 Hz, and the phase difference was 171.6963°. When ks = −0.5, the phase difference was 169.8732°, and when ks = −0.8, the phase difference was 168.25°. When ks = 0.8, the phase difference was 179.5452°, when ks = 0.5, the phase difference was 176.8408°, and when ks = 0.2, the phase difference was 174.4537°, which is lower than when no additional filter was added. Consequently, the inclusion of an additional filter aids in mitigating the negative damping characteristics of the MMC and enhances system stability.
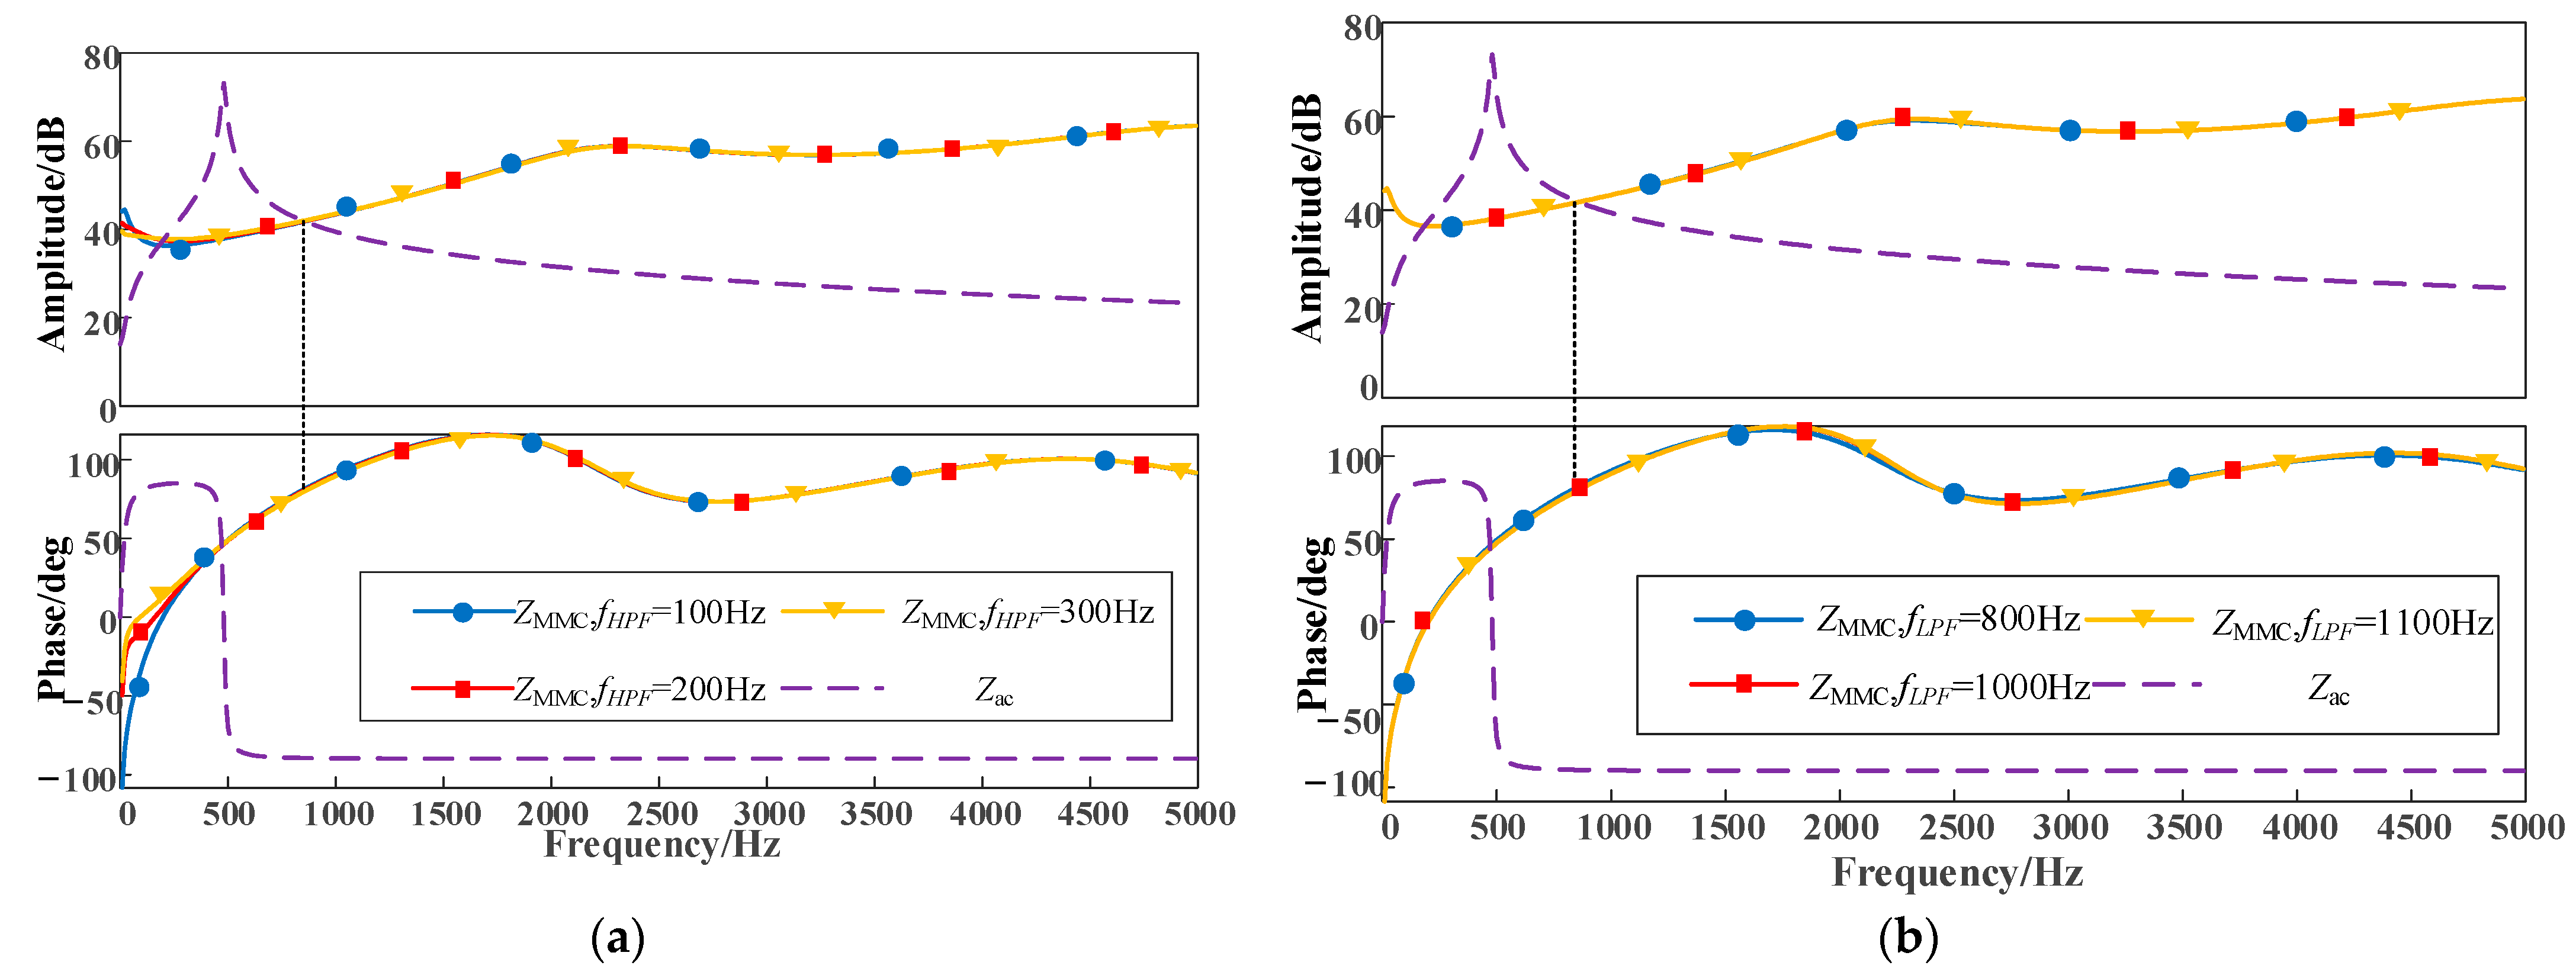
After adjusting the bandwidth frequency of the high-pass and low-pass filters, the amplitude and phase characteristics of the MMC impedance and the AC system impedance are shown in Figure 13a, where the bandwidth frequency of the high-pass filter was 100 Hz, 200 Hz, and 300 Hz. The amplitude and phase characteristics of the MMC impedance and the AC system impedance when the bandwidth frequencies of the low-pass filter were 800 Hz, 1000 Hz, and 1100 Hz are shown in Figure 13b. From Figure 13a, it can be seen that a slight change in the bandwidth frequency of the high-pass filter had little effect on the phase. The frequency at the intersection of the amplitudes was 820 Hz, and the phase difference was 169.7867°. From Figure 13b, it can be seen that a slight change in the bandwidth frequency of the low-pass filter had little effect on the phase, and the frequency at the intersection of the amplitudes was 870 Hz. The phase difference was 170.0786°.
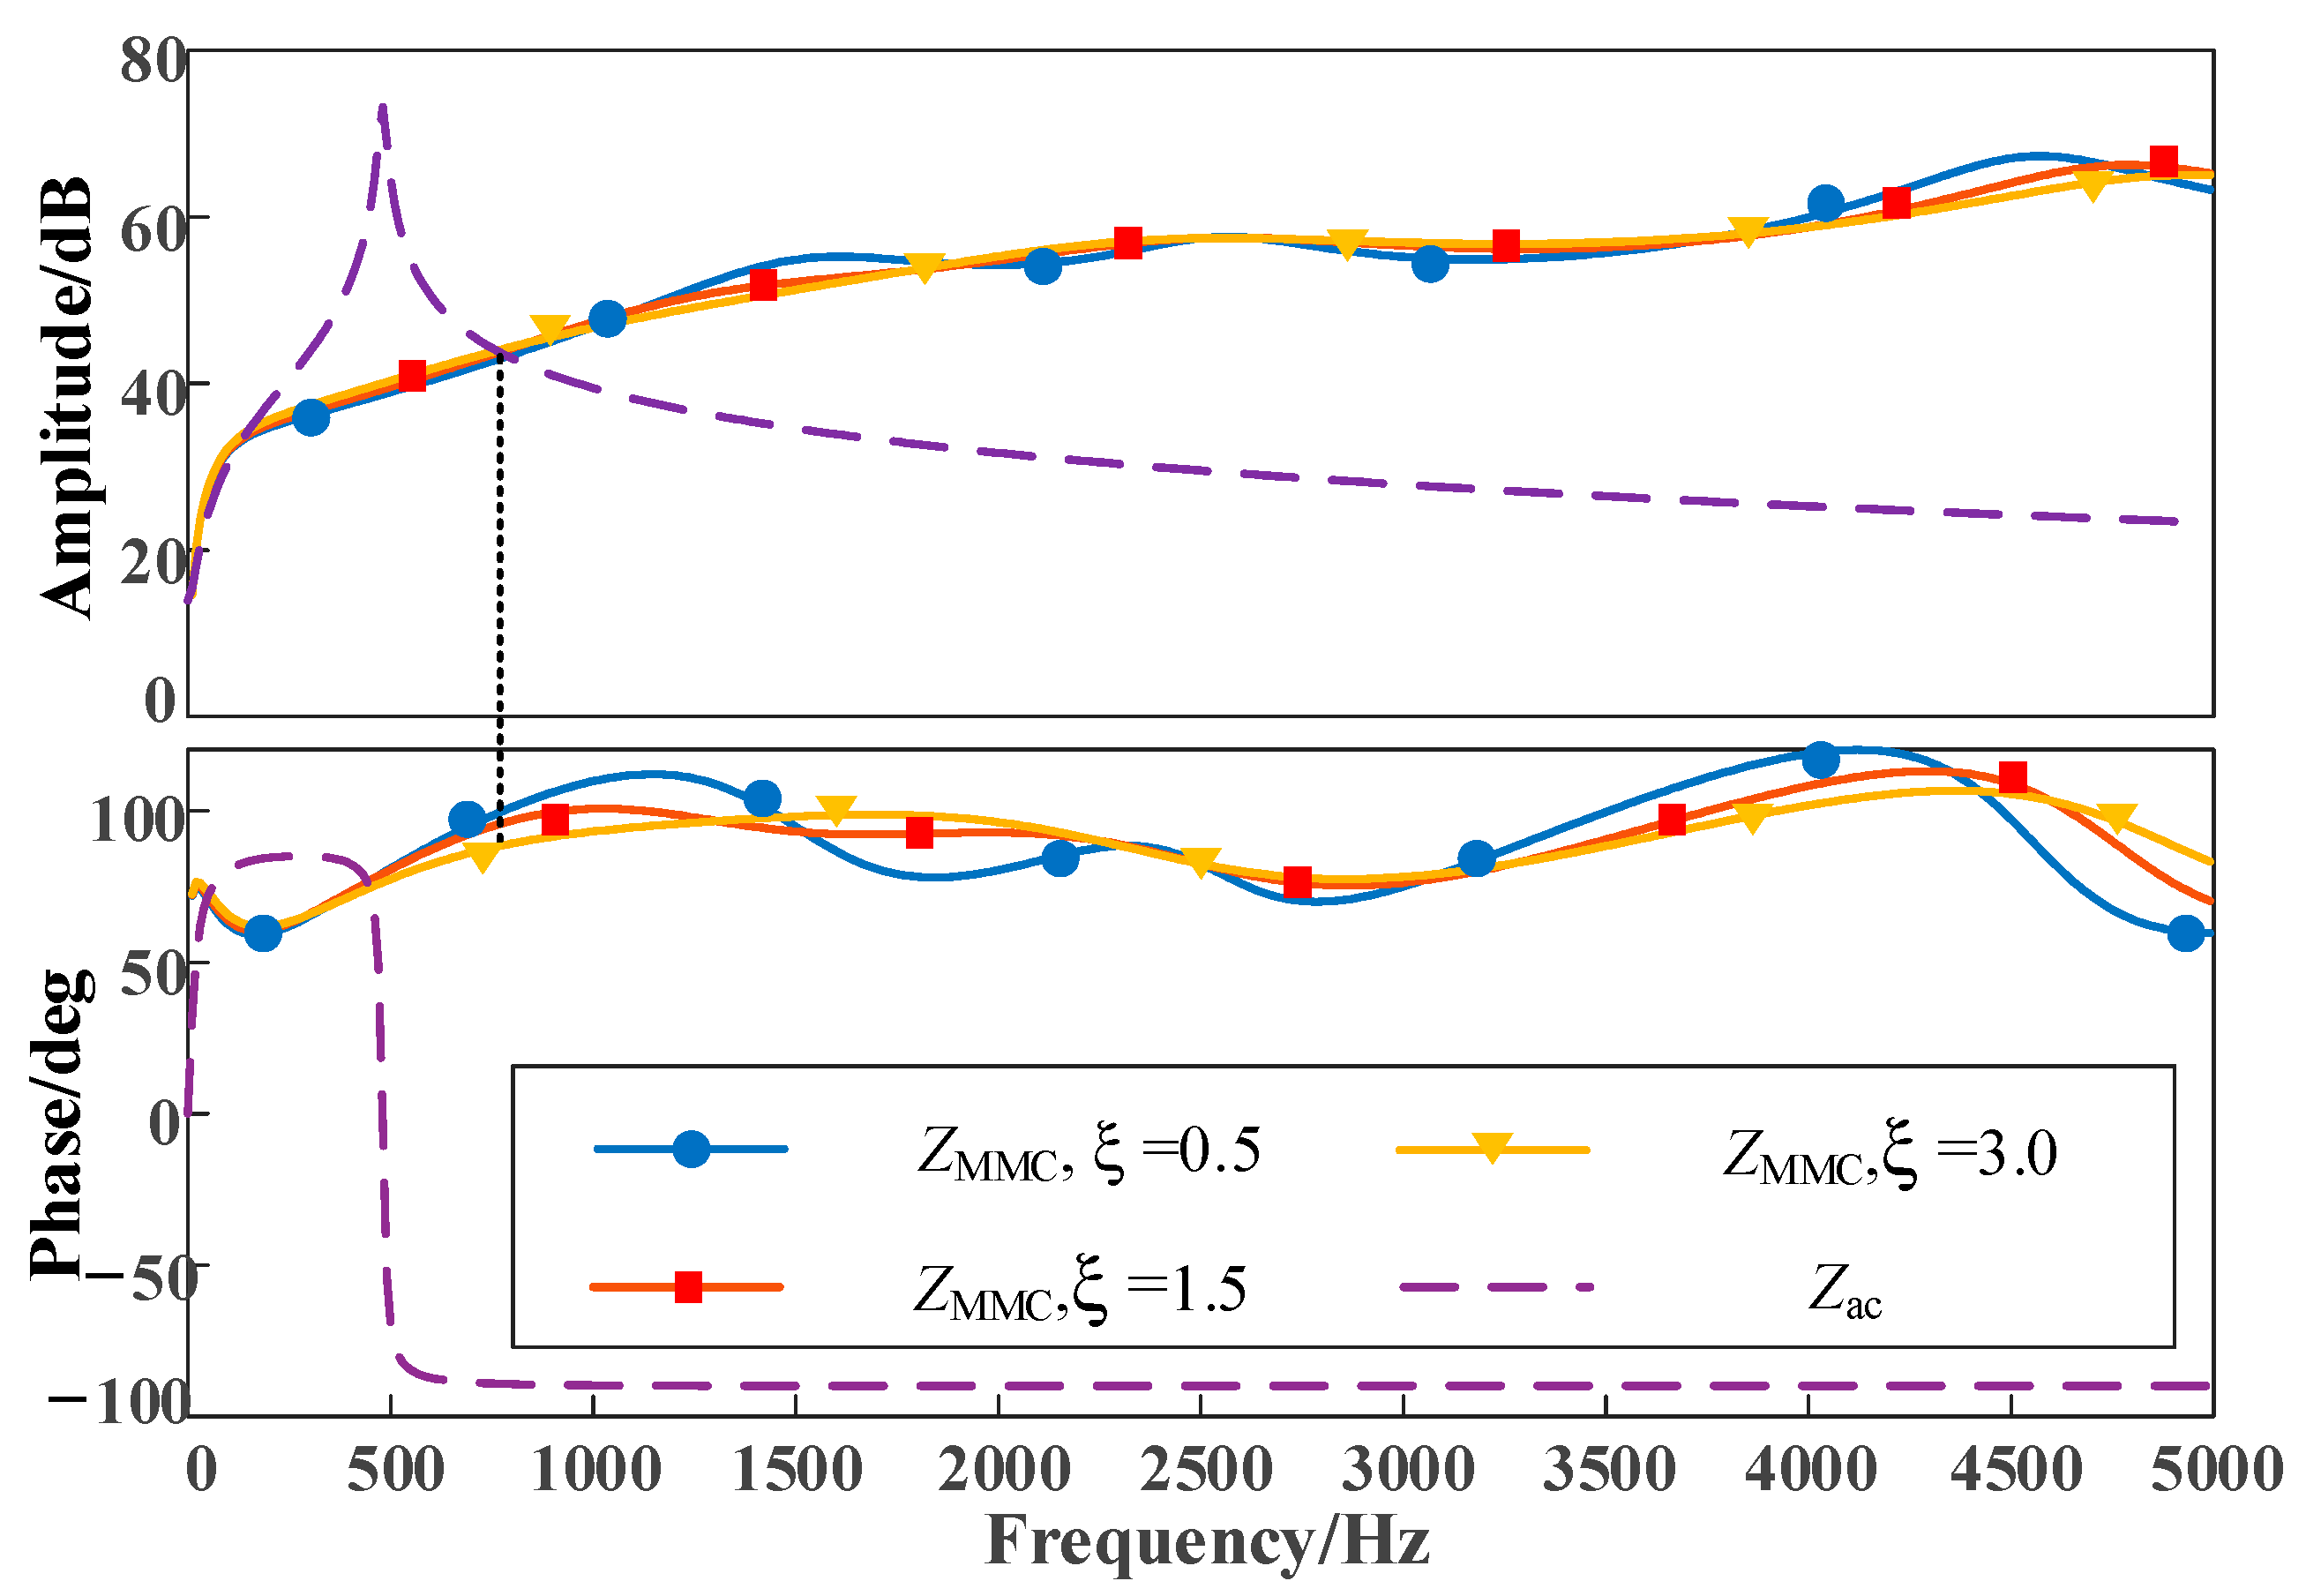
When using a band-stop filter, the expression for G1 is:
G 1 ( s ) = s 2 + ( 2 π f 0 ) 2 s 2 + ξ ( 2 π f 0 ) s + ( 2 π f 0 ) 2
In the formula, ξ represents the damping coefficient of the band-stop filter, while the center frequency f0 is calculated as half the sum of the upper and lower cutoff frequencies of the band-stop filter, denoted as f0 = (f1 + f2)/2. Here, f1 represents the upper cutoff frequency, f2 denotes the lower cutoff frequency, and for this study, the center frequency is fixed at 2500 Hz. The damping coefficient of the band-stop filter was adjusted, and the resulting amplitude and phase characteristics of both the MMC impedance and the AC system impedance are illustrated in Figure 14.
The results depicted in Figure 14 demonstrate that the presence of an additional filter reduced the phase difference between the amplitude intersection at a frequency of 790 Hz. At this point, the maximum phase difference measured 189.9985°, while the minimum phase difference was 178.3057°. Comparing these values to the phase difference observed without an additional filter, it is evident that the inclusion of the filter led to a reduction in phase difference. Consequently, the addition of the filter aided in eliminating the negative damping characteristics of the MMC, thereby enhancing system stability. Moreover, when comparing the two types of filters, it was observed that the second-order damping controller exhibits a smaller phase difference at the amplitude intersection, thereby providing better prospects for eliminating negative damping characteristics, enhancing system stability and suppressing HFOs.

4.2. The Effect of Joint Damping Control on the Impedance Characteristics of MMC

Based on Figure 11 and Equation (1), it can be inferred that the high-frequency impedance ZMMC at this point is:
Z M M C s = R e q + s L e q + ( 1 + G 2 ) G T d G i 1 + ( G 1 G i G l V ) G T d
Based on the previous analysis, it is evident that the use of a second-order damping controller yields superior results. Hence, this section employs a second-order damping controller in the voltage feedback loop and two types of filters in the current feedback loop to compare and analyze the efficacy of joint damping control in suppressing HFOs.
Figure 15 illustrates the amplitude and phase characteristics of the MMC converter station impedance and the AC system impedance when employing a second-order damping controller with specific parameters: ks = −0.55, fLPF = 1050 Hz, and fHPF = 80 Hz.
Figure 15 reveals that the frequency at the amplitude intersection was 820 Hz. Using only Method 1 resulted in a phase difference of 168.25° at the amplitude intersection. However, when employing Method 2, which incorporates both the output current and feedforward voltage to adjust the reference current, the phase difference at the amplitude intersection decreased to 167.4411°, remaining below 180°. Consequently, Method 2 demonstrated superior capability in mitigating the negative damping frequency band of MMC impedance and effectively suppressing HFOs, surpassing the effectiveness of Method 1.
Figure 16 illustrates the amplitude and phase characteristics of MMC impedance and AC system impedance when a band-stop filter with a center frequency of 2000 Hz is employed.
The amplitude intersection frequency in Figure 16 was observed to be 810 Hz. For Method 1 alone, the phase difference at the amplitude intersection was 168.25°. However, when employing Method 2, the output current and feedforward voltage are simultaneously introduced to modify the reference current. In this case, the phase difference at the amplitude intersection was measured to be 167.5309°, which is below 180°. Figure 15 and Figure 16 represent the MMC impedance characteristics when utilizing low-pass filters and bandpass filters, respectively. Under the simulation conditions described in this article, the two types of filters exhibited similar filtering effects, resulting in the relatively similar impedance characteristic curves in Figure 15 and Figure 16. But no matter which filter is used, Method 2 proved to be more efficient in eliminating the negative damping frequency range of MMC impedance and effectively suppressing HFOs when compared to Method 1.

5. Simulation Verification

In this section, a flexible DC grid connection system was constructed using PSCAD to validate the accuracy and effectiveness of the proposed additional damping controller discussed in Section 4.

5.1. Scheme 1 Validation

Passive resonance in flexible DC transmission systems primarily arises due to variations in the structure and parameters of the AC system, MMC control parameters, or system control delay. In this simulation, the system delay was intentionally modified to induce HFOs in the flexible DC system.
Figure 17 presents the simulation results of passive resonance in the flexible DC system. Initially, the system delay was set to 0, and at t = 2 s, it was adjusted to 350 μs. The three-phase voltage and current at the PCC point, along with the dq axis current component, displayed a harmonic oscillation phenomenon (Figure 17).
As shown in Figure 18, FFT decomposition was performed on the resonant wave data.
The resonance observed was a HFO centered at 797 Hz. At t = 2.2 s, the additional damping controller implemented for Scheme 1 (virtual passive filtering) was activated, and the outcomes are depicted in Figure 19.
From Figure 19, it can be seen that after the introduction of Scheme 1 (virtual passive filtering) damping controller, the three-phase voltage, current, and d-axis current components at the PCC point were reduced compared to those without the introduction of damping controller. Additionally, the oscillation was weakened. However, it could not recover to the level before changing the system delay, and the system still experienced HFOs. This indicates that Scheme 1 cannot completely eliminate the negative damping frequency band and can only weaken the negative damping frequency band of the MMC, which is consistent with the previous theoretical analysis results.

5.2. Scheme 2 Validation

Similar to the validation process of Scheme 1, when t = 2 s, the system delay was switched to 350 μs. Due to the effect of system delay, resonance occurred in the system. The additional damping controller designed in Scheme 2 was put into operation at 2.2 s, and the results are shown in Figure 20. When the system delay was switched to 350 μs before adding an additional damping controller, the system experienced resonance. After the additional damping controller designed in Scheme 2 was put into operation, the three-phase voltage, current, and dq axis current components at the PCC point gradually recovered to the levels before the system delay was changed. The system gradually regained stability and resonance disappeared, indicating the effectiveness of the additional damping controller in Scheme 2.

6. Conclusions

This article addressed the issue of HFOs resulting from delay in flexible DC grid-connected systems. It established a simplified control model for MMCs and a high-frequency impedance model for the AC system. The key factors that contribute to HFOs in flexible DC grid-connected systems were analyzed using the Sobol algorithm. To mitigate HFOs, a suppression strategy was proposed, which combines virtual passive filtering and equivalent current sampling filtering. The effectiveness of this suppression strategy was verified through simulations conducted in the PSCAD electromagnetic transient model. The following conclusions can be drawn:
(1) The stability of the system is affected by system delay, equivalent inductance, and filter cutoff frequency. Therefore, fluctuations in the operating mode of the AC power grid and filter parameters may lead to changes in the resonance frequency of the system.
(2) The HFO suppression strategy based on joint additional damping control proposed in this article is effective. Compared to the virtual passive filtering method, it can suppress the occurrence of HFOs within a certain delay range and improve the stability margin of the system to a certain extent.

Author Contributions

Conceptualization, W.C., J.L. and Y.W.; methodology, C.D. and J.H.; software, Z.T. and H.W.; validation, W.C. and J.L.; formal analysis, C.D. and L.D.; investigation, L.D.; resources, L.D.; data curation, Z.T. and J.L.; writing—original draft preparation, Y.C. and Z.T.; writing—review and editing, W.C. and Z.T.; visualization, J.H. and L.D.; supervision, J.L. and Y.W.; project administration, W.C. and Y.W.; funding acquisition, W.C. and Y.W. All authors have read and agreed to the published version of the manuscript.

Funding

This research was supported by the Science and Technology Project of State Grid Fujian Power Co., Ltd. of China (52130422000Y) which is named as Study on Mechanism and Suppression Strategy of DC Oscillation in MMC-HVDC.

Data Availability Statement

All data are contained within the article.

Conflicts of Interest

The authors declare no conflict of interest. The funders had no role in the design of the study; in the collection, analyses, or interpretation of data; in the writing of the manuscript; or in the decision to publish the results.

References

  1. Xiang, W.; Yang, R.; Lin, C.; Zhou, J.; Wen, J.; Lin, W. A Cascaded Converter Interfacing Long-Distance HVdc and Back-to-Back HVdc Systems. IEEE J. Emerg. Sel. Top. Power Electron. 2020, 8, 4109–4121. [Google Scholar] [CrossRef]
  2. Li, X.; Song, Q.; Liu, W.; Zhu, Z.; Xu, S. Experiment on DC-fault Ride Through of MMC Using a Half-Voltage Clamp Submodule. IEEE J. Emerg. Sel. Top. Power Electron. 2018, 6, 1273–1279. [Google Scholar] [CrossRef]
  3. Zhu, J.; Hu, J.; Lin, L.; Wang, Y.; Wei, C. High-Frequency Oscillation Mechanism Analysis and Suppression Method of VSC-HVDC. IEEE Trans. Power Electron. 2020, 35, 8892–8896. [Google Scholar] [CrossRef]
  4. Chi, Y.; Tang, B.; Hu, J.; Tian, X.; Tang, H.; Li, Y.; Sun, S.; Shi, L.; Shuai, L. Overview of mechanism and mitigation measures on multi-frequency oscillation caused by large-scale integration of wind power. CSEE J. Power Energy Syst. 2019, 5, 433–443. [Google Scholar]
  5. Zou, C.; Rao, H.; Xu, S.; Li, Y.; Li, W.; Chen, J.; Zhao, X.; Yang, Y.; Lei, B. Analysis of Resonance Between a VSC-HVDC Converter and the AC Grid. IEEE Trans. Power Electron. 2018, 33, 10157–10168. [Google Scholar] [CrossRef]
  6. Sun, J.; Liu, H. Sequence Impedance Modeling of Modular Multilevel Converters. IEEE J. Emerg. Sel. Top. Power Electron. 2017, 5, 1427–1443. [Google Scholar] [CrossRef]
  7. Lin, L.; Zeng, Q.; Zhu, J.; Shi, X.; Hu, J. High-Frequency Oscillation Mechanism Analysis and Suppression Strategy of Grid-Forming Control MMC-HVDC. IEEE Trans. Power Deliv. 2023, 38, 1588–1600. [Google Scholar] [CrossRef]
  8. Zhu, J.; Shen, Z.; Bu, S.; Li, X.; Booth, C.D.; Qiu, W.; Jia, H.; Wang, C. Coordinated Flexible Damping Mechanism With Inertia Emulation Capability for MMC-MTDC Transmission Systems. IEEE J. Emerg. Sel. Top. Power Electron. 2021, 9, 7329–7342. [Google Scholar] [CrossRef]
  9. Xu, Z.; Li, B.; Han, L.; Hu, J.; Wang, S.; Zhang, S.; Xu, D. A Complete HSS-Based Impedance Model of MMC Considering Grid Impedance Coupling. IEEE Trans. Power Electron. 2020, 35, 12929–12948. [Google Scholar] [CrossRef]
  10. Wang, C.; Xu, J.; Pan, X.; Gong, W.; Zhu, Z.; Xu, S. Impedance Modeling and Analysis of Series-Connected Modular Multilevel Converter (MMC) and its Comparative Study With Conventional MMC for HVDC Applications. IEEE Trans. Power Deliv. 2022, 37, 3270–3281. [Google Scholar] [CrossRef]
  11. Li, Z.; Wang, Z.; Wang, Y.; Yin, T.; Mei, N.; Yue, B.; Lei, W. Accurate Impedance Modeling and Control Strategy for Improving the Stability of DC System in Multiterminal MMC-Based DC Grid. IEEE Trans. Power Electron. 2020, 35, 10026–10049. [Google Scholar] [CrossRef]
  12. Yin, T.; Wang, Y.; Wang, X.; Yue, B.; Zhao, D.; Sun, J.; Li, P.; Liu, Y. Modeling and Analysis of High-Frequency MMC Impedance Considering Different Control Modes and Voltage Feedforward. IEEE Access 2020, 8, 218575–218584. [Google Scholar] [CrossRef]
  13. Zhang, Y.; Hong, C.; Tu, L.; Zhou, T.; Yang, J. Research on High-frequency Resonance Mechanism and Active Harmonic Suppression Strategy of Power Systems with Power Electronics. In Proceedings of the 2018 International Conference on Power System Technology (POWERCON), Guangzhou, China, 6–8 November 2018; pp. 2350–2356. [Google Scholar]
  14. Chen, W.; Wang, J.; Ye, Y.; Liu, Y.; Feng, J.; Fu, C. Additional damping measures for high-frequency resonance on the AC side of flexible DC transmission systems. Power Syst. Autom. 2021, 45, 151–161. [Google Scholar]
  15. Guo, X.; Liu, Z.; Li, Y.; Lu, Y. Analysis of high-frequency oscillation characteristics and research on suppression strategies for flexible DC transmission systems. Chin. J. Electr. Eng. 2020, 40, 19–29+370. [Google Scholar]
  16. Hou, Y.; Liu, C.; Wang, Y.; Kong, W. Research on high-frequency oscillation suppression strategies for flexible DC transmission systems. Chin. J. Electr. Eng. 2021, 41, 3741–3751. [Google Scholar]
  17. Li, Y.; An, T.; Zhang, D.; Pei, X.; Ji, K.; Tang, G. Analysis and Suppression Control of High Frequency Resonance for MMC-HVDC System. IEEE Trans. Power Deliv. 2021, 36, 3867–3881. [Google Scholar] [CrossRef]
  18. Lv, J.; Cai, X. Impedance modeling of modular multilevel converters based on harmonic linearization. Power Syst. Autom. 2017, 41, 136–142. [Google Scholar]
Figure 1. Configuration of flexible DC transmission system.
Electronics 12 02825 g001
Figure 2. Configuration of three-phase MMC.
Electronics 12 02825 g002
Figure 3. Simplified control model of MMC.
Electronics 12 02825 g003
Figure 4. Equivalent model of AC system.
Electronics 12 02825 g004
Figure 5. First order sensitivity of various influencing factors on AC side impedance in the 500–1000 Hz frequency band.
Electronics 12 02825 g005
Figure 6. Global total sensitivity of various influencing factors on AC side impedance in the 500–1000 Hz frequency band.
Electronics 12 02825 g006
Figure 7. First-order sensitivity of various influencing factors on AC side impedance in the 500–5000 Hz frequency band.
Electronics 12 02825 g007
Figure 8. Global total sensitivity of various influencing factors on AC side impedance in the 500–5000 Hz frequency band.
Electronics 12 02825 g008
Figure 9. The impedance characteristic curves of the MMC and AC system.
Electronics 12 02825 g009
Figure 10. Schematic diagram of additional damping control for Scheme 1.
Electronics 12 02825 g010
Figure 11. Schematic diagram of additional damping control for Scheme 2.
Electronics 12 02825 g011
Figure 12. Impedance characteristics of MMC at different gains. (a) Gain ks is negative, (b) Gain ks is positive.
Electronics 12 02825 g012
Figure 13. Impedance characteristics of MMC at different filter bandwidths. (a) Different high-pass filter bandwidths, (b) Different low-pass filter bandwidths.
Electronics 12 02825 g013
Figure 14. Impedance characteristics of MMC at different damping coefficients.
Electronics 12 02825 g014
Figure 15. Impedance characteristics of MMC under low−pass joint damping control.
Electronics 12 02825 g015
Figure 16. Impedance characteristics of MMC under combined band resistance damping control.
Electronics 12 02825 g016
Figure 17. Stability analysis of flexible and direct grid connection system after changing MMC link delay. (a) Three phase voltage at PCC point, (b) Three phase current at PCC point, (c) dq axis current component.
Electronics 12 02825 g017
Figure 18. Spectrum analysis of resonance wave.
Electronics 12 02825 g018
Figure 19. Simulation results with the first additional damping control scheme. (a) Three phase voltage at PCC point, (b) Three phase current at PCC point, (c) d axis current component.
Electronics 12 02825 g019
Figure 20. Simulation results with the second additional damping control scheme. (a) Three phase voltage at PCC point, (b) Three phase current at PCC point, (c) dq axis current component.
Electronics 12 02825 g020
Table 1. Some parameters of AC power grid.
ParametersValues
Capacitance (C1)5 μF
Inductance (L1)50 mH
Resistance (R1)5 Ω
Table 2. Summary of impedance influencing factors.
TypeParameters
PI control parametersCurrent inner loop PI parameters kp, ki
System delay parametersControl and communication delay Td
Main circuit parametersEquivalent inductance Leq
Table 3. Value range of input parameters.
ParametersValue range
Current inner loop PI parameter kp[0.5–1.5]
Current inner loop PI parameters ki[5–10]
Control and communication delay Td[350–650] μs
Equivalent inductance Leq[40–80] mh
Table 4. Partial parameters of flexible and straight system.
ParametersValue range
Current inner loop PI parameter kp0.5
Current inner loop PI parameter ki10
Control and communication delay Td350 μs
Equivalent inductance Leq40 mh
Equivalent resistance Req1 Ω
Cut-off frequency1000 Hz
Disclaimer/Publisher’s Note: The statements, opinions and data contained in all publications are solely those of the individual author(s) and contributor(s) and not of MDPI and/or the editor(s). MDPI and/or the editor(s) disclaim responsibility for any injury to people or property resulting from any ideas, methods, instructions or products referred to in the content.

