Article

Explainable Feature Extraction and Prediction Framework for 3D Image Recognition Applied to Pneumonia Detection

by
Emmanuel Pintelas
*,
Ioannis E. Livieris
and
Panagiotis Pintelas
Department of Mathematics, University of Patras, GR 265-00 Patras, Greece
*
Author to whom correspondence should be addressed.
Electronics 2023, 12(12), 2663; https://doi.org/10.3390/electronics12122663
Submission received: 22 April 2023 / Revised: 3 June 2023 / Accepted: 12 June 2023 / Published: 14 June 2023
(This article belongs to the Special Issue Emerging E-health Applications and Medical Information Systems)

Abstract

:
Explainable machine learning is an emerging new domain fundamental for trustworthy real-world applications. A lack of trust and understanding are the main drawbacks of deep learning models when applied to real-world decision systems and prediction tasks. Such models are considered as black boxes because they are unable to explain the reasons for their predictions in human terms; thus, they cannot be universally trusted. In critical real-world applications, such as in medical, legal, and financial ones, an explanation of machine learning (ML) model decisions is considered crucially significant and mandatory in order to acquire trust and avoid fatal ML bugs, which could disturb human safety, rights, and health. Nevertheless, explainable models are more than often less accurate; thus, it is essential to invent new methodologies for creating interpretable predictors that are almost as accurate as black-box ones. In this work, we propose a novel explainable feature extraction and prediction framework applied to 3D image recognition. In particular, we propose a new set of explainable features based on mathematical and geometric concepts, such as lines, vertices, contours, and the area size of objects. These features are calculated based on the extracted contours of every 3D input image slice. In order to validate the efficiency of the proposed approach, we apply it to a critical real-world application: pneumonia detection based on CT 3D images. In our experimental results, the proposed white-box prediction framework manages to achieve a performance similar to or marginally better than state-of-the-art 3D-CNN black-box models. Considering the fact that the proposed approach is explainable, such a performance is particularly significant.

1. Introduction

The concept of explainable machine learning (ML) has recently attracted a lot of interest [1,2,3] because it is considered as a very significant and essential property for every ML model applied to real-world applications [4], especially in medical [5,6] and social–human-involved applications [7], which can affect human health, finance, and safety. Therefore, it is becoming necessary to invent and develop state-of-the-art, explainable ML models. However, there is a trade-off between explainability and accuracy, meaning that explainable models are often less accurate compared to non-explainable ones [8,9]. This means that the invention of explainable prediction models being almost as accurate as non-explainable ones is a very challenging task.
ML classification models can be separated into two main categories: black-box (uninterpretable) (BB) and white-box (interpretable) (WB) models [10]. In general, a BB model is an ML model, the decision function of which is not transparent and not interpretable in contrast to a WB model. A WB ML model can be considered any model that is intrinsically interpretable, meaning that its decision function is totally transparent, such as a linear or a decision tree model.
Nevertheless, a WB model is not necessarily explainable by default; an explainable model must also be able to make reasoning and explain its predictions relying on reasons/features, which are also understandable to humans. Explaining a WB prediction model’s decision relying on BB features (non-explainable features) is obviously meaningless. The term, BB features, means that the extraction procedure of these features is not transparent, while they are also not understandable by humans. In contrast, WB features (explainable features) can be considered features whose extraction procedure is transparent, while they are also understandable and meaningful in human terms. For example, the features “SEX”, “AGE”, and “GENDER” can be considered as WB features. Therefore, an explainable ML model can be considered any WB model that relies on WB features.
The initial features (initial representation) of an image instance are single-pixel points; thus, a feature extraction procedure leading to a new robust representation (latent representation) is essential. In recent years, convolutional neural networks (CNNs) [11] have flourished in many real-world image processing applications [12,13,14], mainly because of their ability to learn features during training (the concept of deep representation learning), achieving remarkable classification performance [15,16]. However, the features extracted by a CNN model are BB features and, thus, meaningless in human terms, while their extraction and creation procedure is not interpretable and transparent because this process is too complicated computationally.
The explanations of CNN models rely on pixel-based post hoc local explanations [3,17], highlighting the most significant regions of the input image. However, such explanations are incomplete and cannot be fully trustworthy [1,2]. The main problematic issue of CNN models lies in the fact that they create non-explainable representations (BB features), while they also utilize, in their output, a non-explainable fully connected neural network component. This implies that current state-of-the-art CNN classification models can be considered as BB predictors that rely on BB features in order to make predictions, leading to the fact that they are doomed to be non-explainable.
Furthermore, even if a CNN model is used as a feature extractor [18] (by removing the output black-box neural network component) for feeding a white-box model, such as decision tree (DT), such an approach is still considered as non-explainable because a DT will make predictions based on BB features, which are meaningless in human terms. Therefore, in order to build a totally explainable model in image recognition tasks, it is essential to create a WB predictor that will rely only on WB features.
For this task, it is necessary to invent transparent feature extraction functions leading to human-meaningful features. Such transparent latent image representations are mainly created based on hand-crafted (HC) feature extraction approaches [1,2,19,20]. However, applying a white-box model to WB HC features rarely leads to a higher classification performance [2] compared to an end–end CNN approach. Thus, the invention of a WB feature extraction approach that leads to accuracy performance similar to a CNN is a very difficult and challenging task.
Additionally, another significant disadvantage regarding CNN models concerns the rotation invariance property. CNNs, in general, are not invariant to image rotations [21], which can lead to unstable prediction outcomes and poor performance when the input is rotated. By the term “rotation invariance”, we refer to the property of a feature extraction model to maintain unchanged the output representation (final extracted features) of input images due to rotation operations.
In this work, we propose a new hand-crafted transparent feature extraction framework, which creates explainable-to-human features, for 3D image classification [18]. It is worth mentioning that our methodology was initially inspired by a recent HC feature extraction approach [2], where the authors introduced a set of explainable features based on simple mathematical concepts such as average and standard deviation values of pixels’ intensity. However, we drastically augmented their proposed feature extraction framework by introducing a new set of explainable features, which are mainly based on fundamentally explainable mathematical and geometric concepts, such as vertices, lines, curves, contours’ areas, and perimeters, which are extracted via the object’s contours of an image. Furthermore, these features are also fundamentally rotation invariant due to the fact that they rely on the geometric properties of the extracted contours, and thus, rotations would not affect these ones (for example, the number of lines and the shape of contours will remain invariant). These features can then be fed into a common WB ML model, such as logistic regression (LR), resulting in a totally explainable and transparent prediction model (feature extraction component and output prediction model).
In order to demonstrate the generalization efficiency of our proposed framework, we applied it to the pneumonia detection problem (3D spatial images based on CT scans). The pneumonia detection problem has recently attracted very high interest [22,23], mainly due to the COVID-19 [24] pandemic. ML decisions, applied to such crucial real-world applications, can affect human health, safety, and financial situations; thus, the property of explainability is of high significance in those application cases.
The main contributions of this research work are described as follows:
  • We propose an interpretable rotation-invariant feature extraction framework, formally defining and introducing a set of explainable features for 3D images.
  • This contributes to explainable ML by providing an interpretation for ML decisions in critical real-world applications, such as pneumonia detection, through the incorporation of efficient and explainable latent image representations in order to build interpretable, trustful, and accurate prediction models.
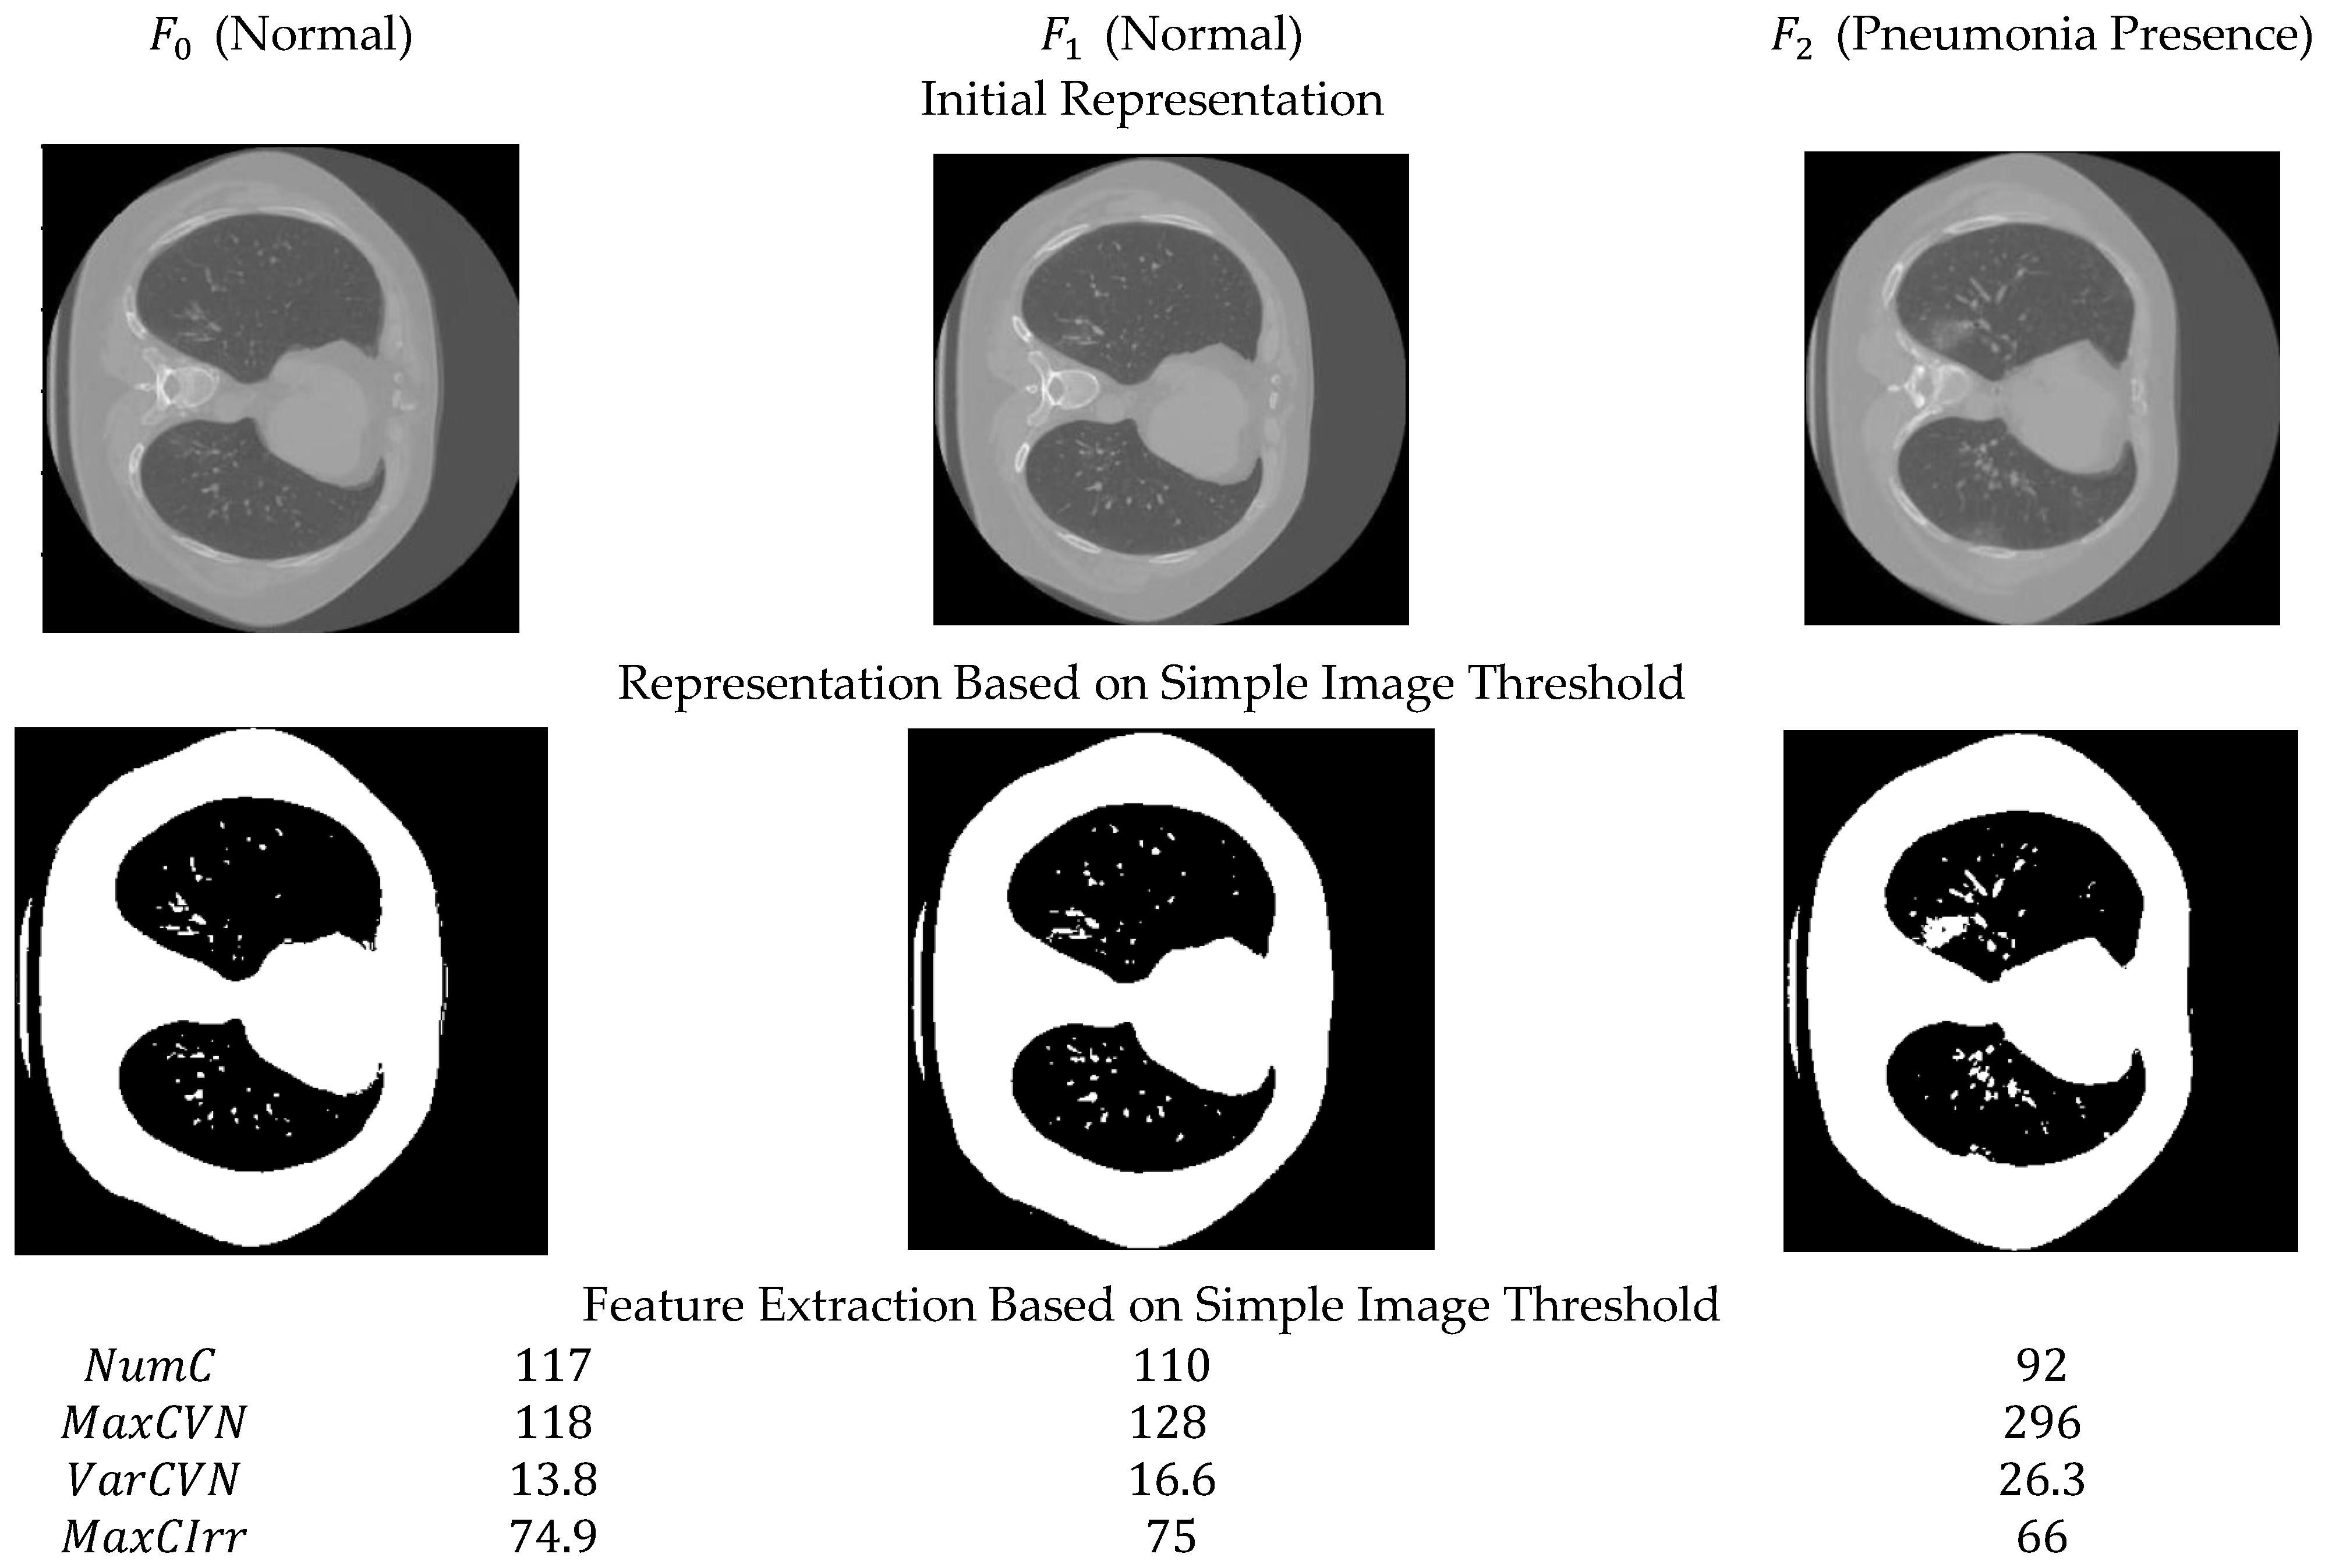
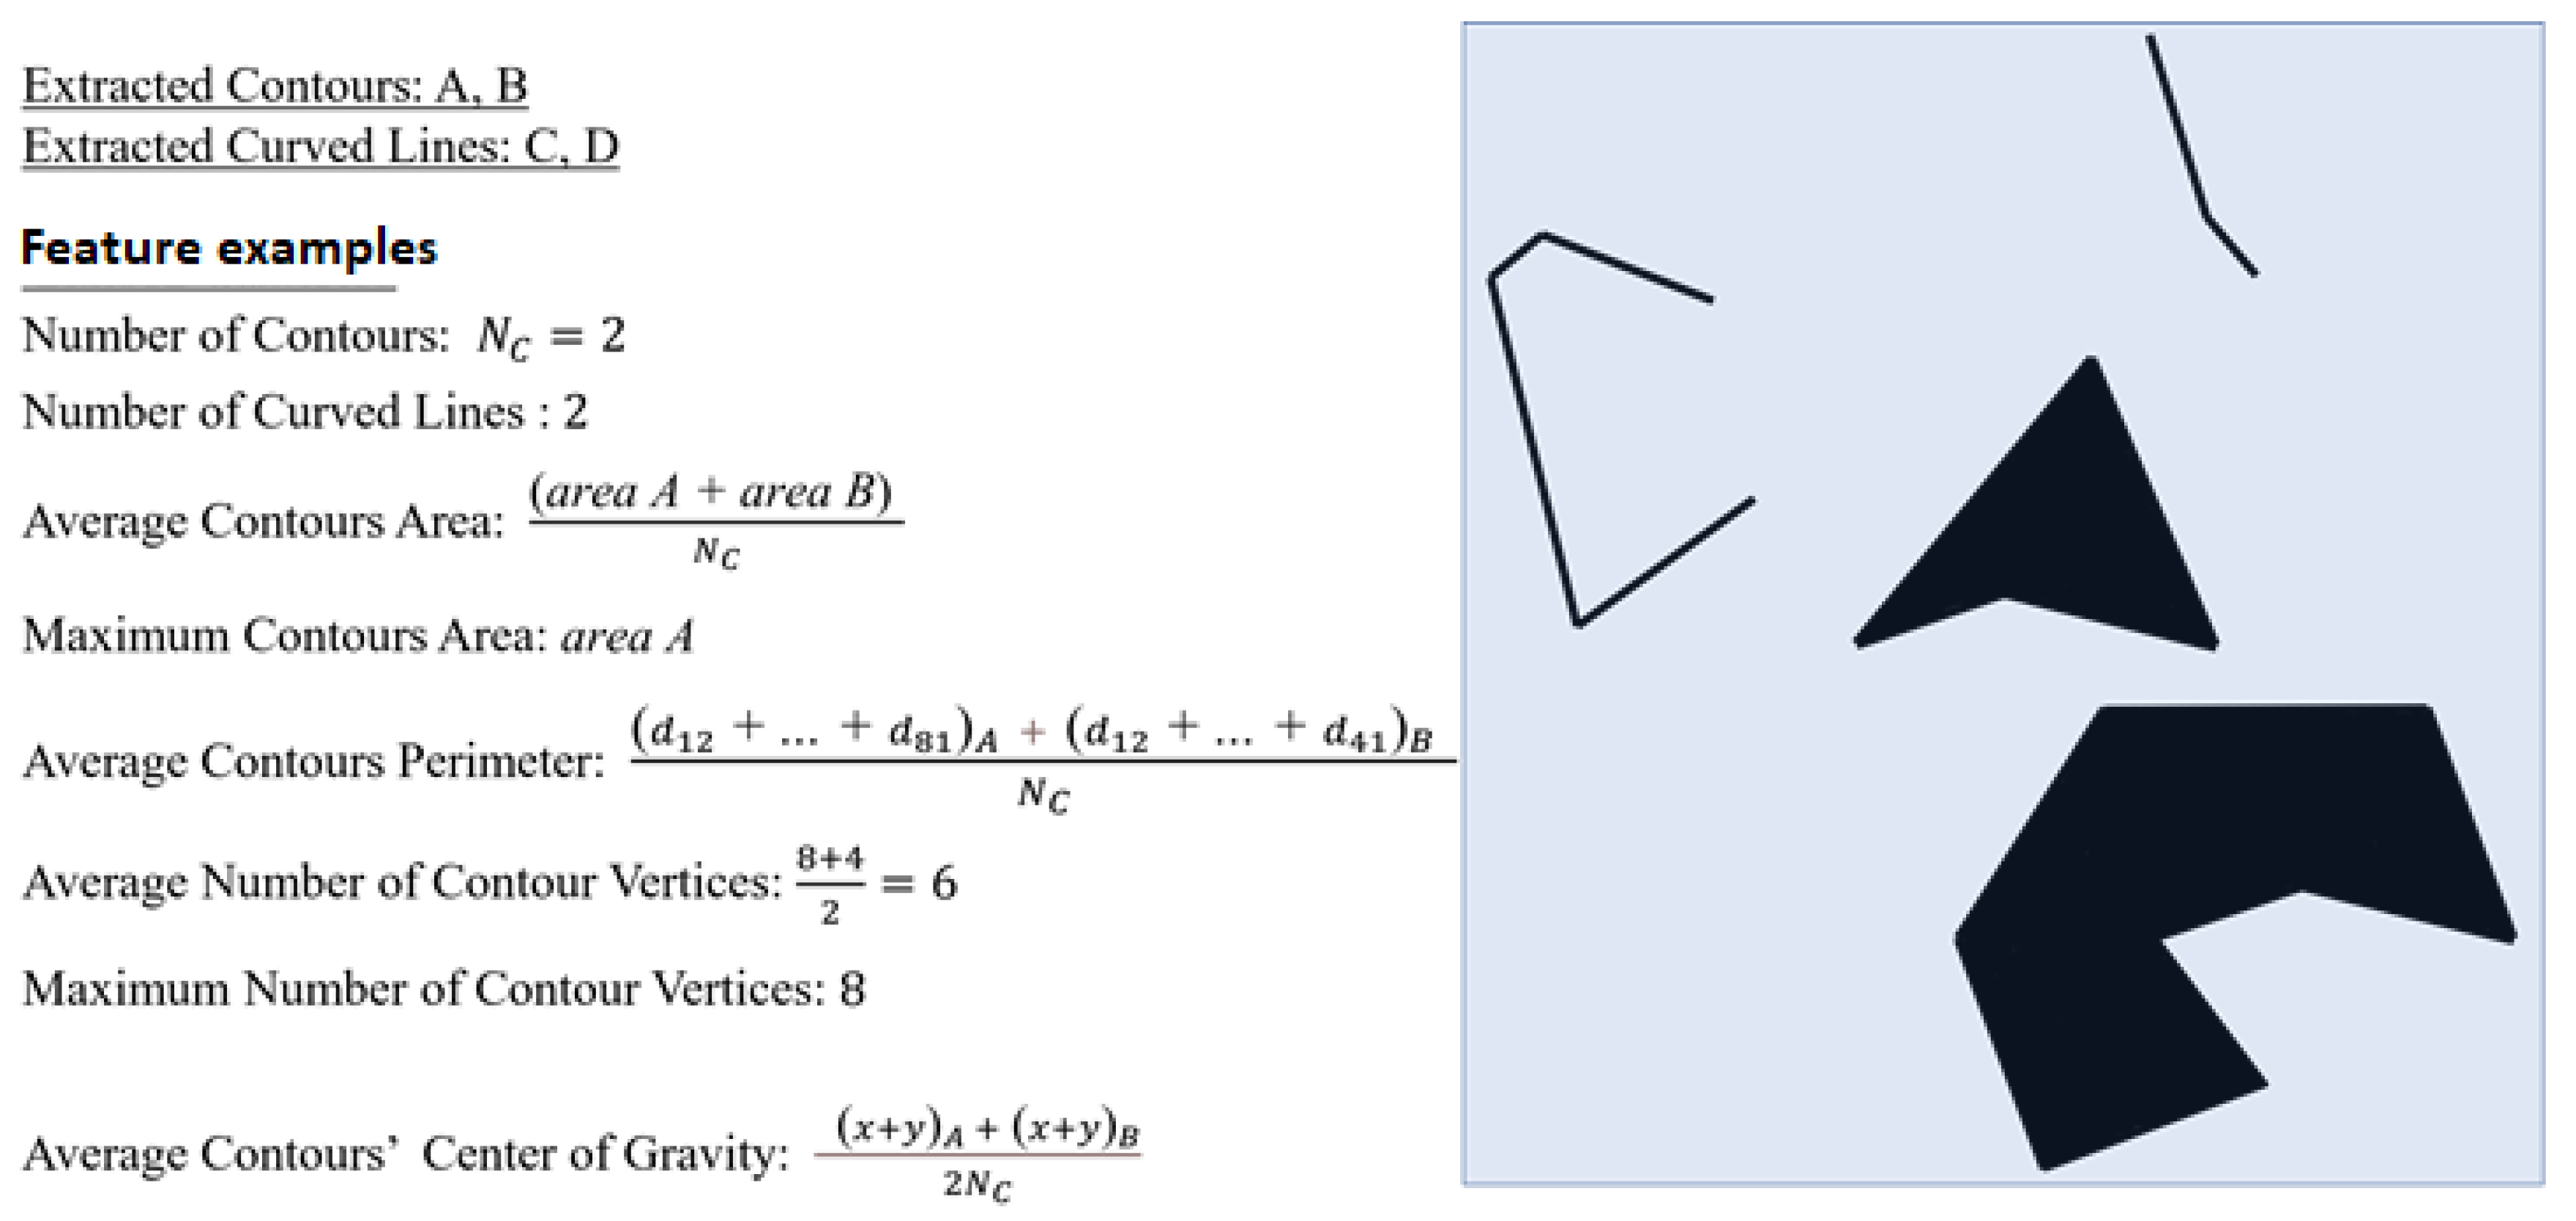
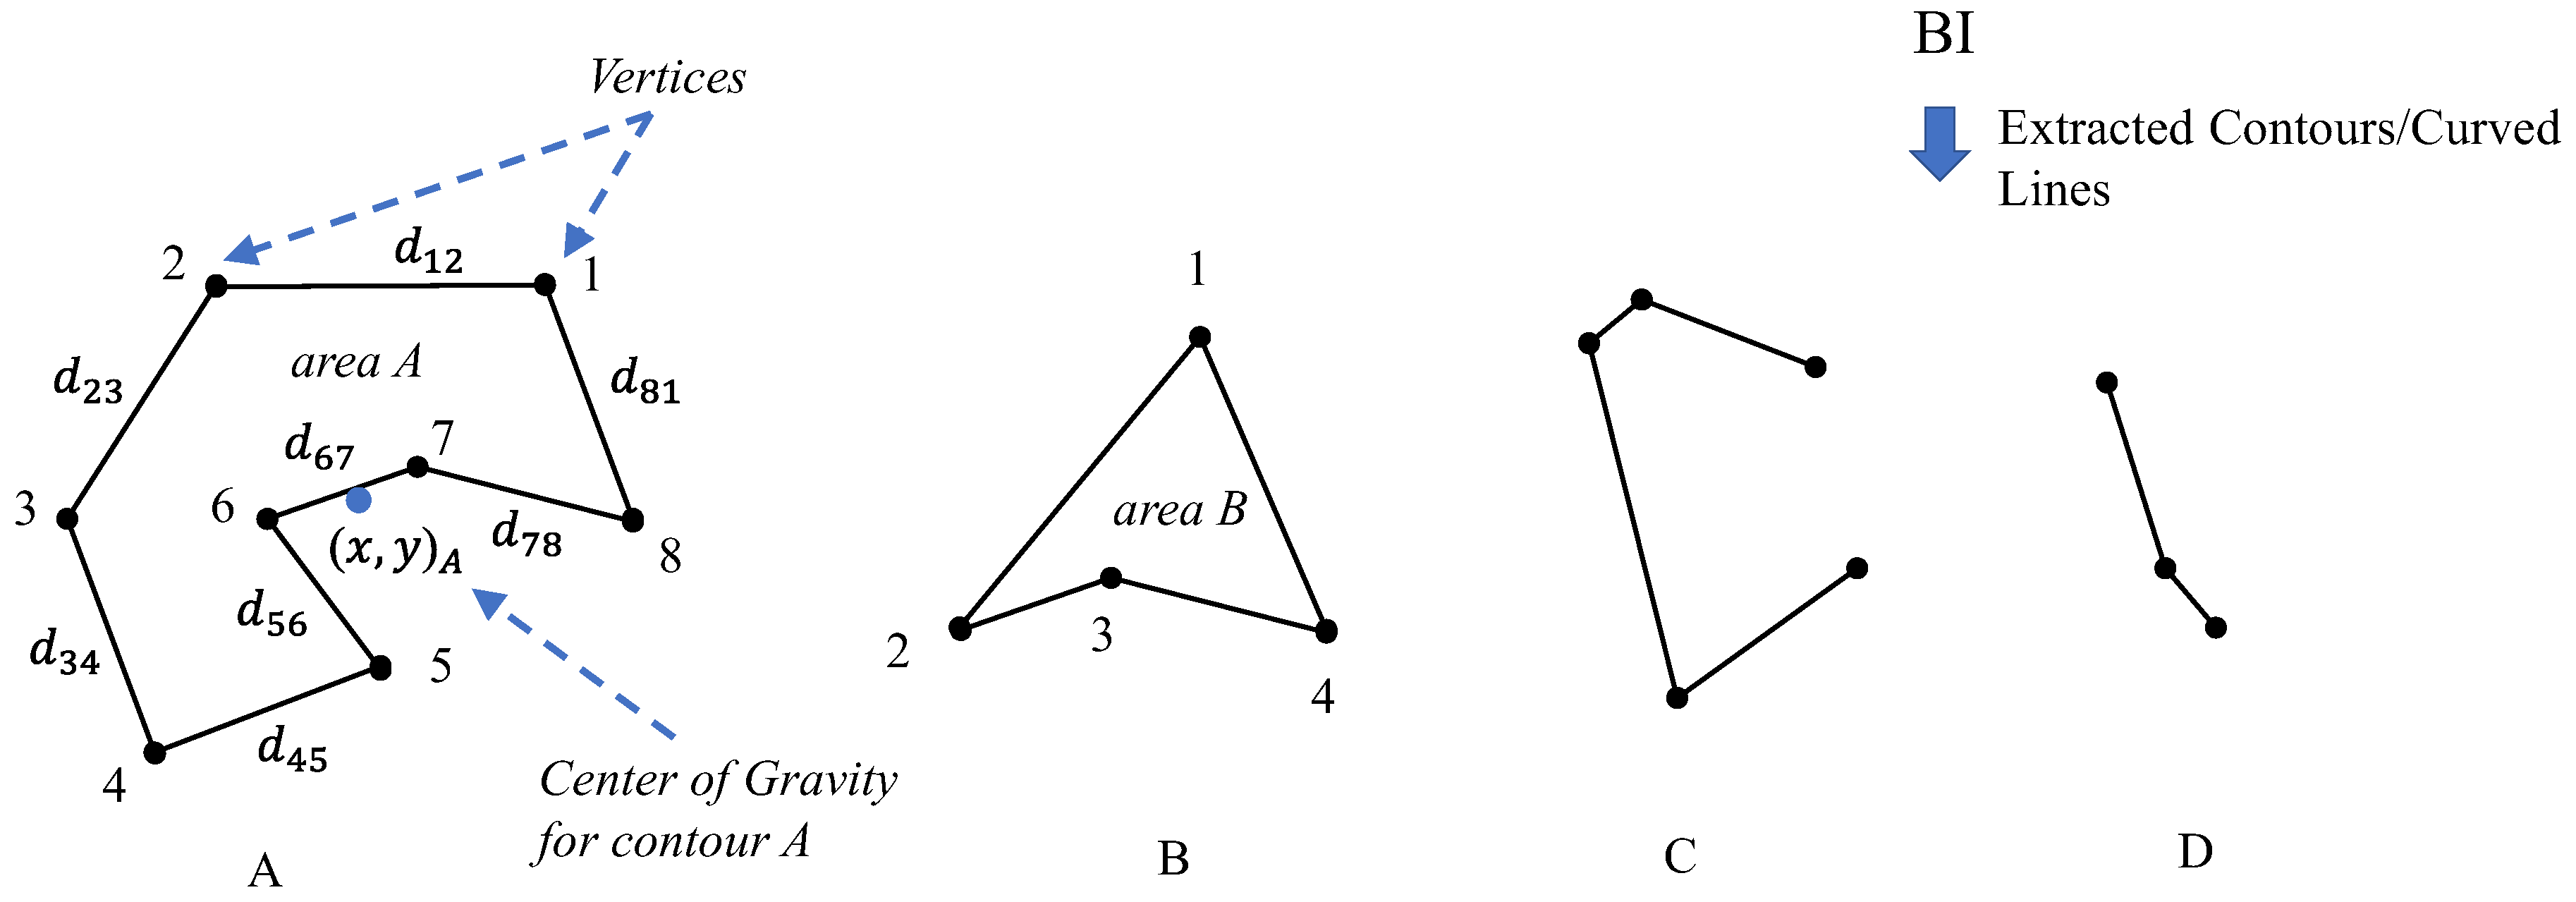
  • We propose the idea of extracting contours in order to create and employ features, which are based on mathematical and geometric concepts, such as the number of contours, average contour area, average perimeter, the contour center of gravity, vertices, and edges. Such features are universally easy to understand and accepted as explainable.
  • We propose an explainable 3D image classification framework that exhibits high performance when applied to pneumonia detection, managing to achieve a performance similar to or marginally better than state-of-the-art 3D-CNN black-box models. Considering the fact that the proposed approach is explainable, such a performance is particularly significant and noteworthy.
It is worth mentioning that, in this work, we only emphasize creating WB features for 3D images. The creation of an efficient and explainable feature extraction framework on 3D images is much more complicated compared to 2D images because of the increased complexity that is due to the extra dimension. To the best of our knowledge, such an accurate and interpretable feature extraction and prediction framework for 3D image recognition applications does not exist in the literature.
The rest of this paper is organized as follows: Section 2 presents the main approaches in 3D image recognition; Section 3 describes the proposed framework in detail; Section 4 presents our application case study scenarios; Section 5 reports and discusses our experimental results and conclusive remarks.

2. Related Work

Image classification is an area in machine learning and computer vision in which deep convolutional neural networks (CNNs) have flourished [15,16,25], mainly because they have achieved exceptional classification performance. Deep learning (DL) models are trained on millions of images and composed of a large variety of various CNN architecture combinations, such as ResNet [26] and Inception [27], which constitute state-of-the-art approaches for solving image recognition problems. In fact, these networks are utilized as pretrained feature extraction models, transferring their knowledge into new smaller untrained networks (the main transfer learning approach) in order to specialize in new specific image classification problems.
In 3D image classification, the initial volumetric image can be sliced into discrete 2D image slices. Next, a 2D convolutional (2D-CNN) neural network model can extract features [28] for every image slice, and finally, these features are aggregated in order to train an ML model, such as SVM [29] or LSTM [30]. However, the main disadvantage of these approaches lies in the fact that they initially process each image slice independently; thus, they cannot correlate volumetric context from adjacent slices. On the other hand, 3D-CNN models utilize 3D convolutional kernels in order to extract volumetric feature context from the initial 3D image at once. Thus, the state-of-the-art approach to address 3D image recognition tasks is based on the development of 3D convolutional neural networks adjusting well-known 2D topologies (such ResNet and Inception) into 3D ones [31].
The 3D ResNet (R3D) is based on traditional 2D ResNet topology. ResNet networks utilize identity connections that take the input directly to the end of each residual block. The main contribution of these connections is that they manage to address the degradation problem. The degradation problem is caused when setting an overly large network depth, such as for over 20 layers. In fact, as the network depth increases, accuracy becomes saturated and highly degraded. However, based on experimental results, setting an exceedingly high number of layers (over 1000), the residual network starts to exhibit low performance, which is probably caused due to overfitting, as stated in [26]. In the R3D model, the 2D convolutional kernels, and every other 2D operation, such as max pooling, are replaced with the corresponding 3D operations.
The 3D Inception (I3D) [31] is based on the traditional 2D Inception topology. Inception is a network whose main architectural topology philosophy is based on finding an optimal local construction and repeating it spatially. This network is capable of exploiting its computing resources in an efficient way by a crafted design that allows an increase in the depth and width of the network, maintaining, at the same time, the computational cost constant. Furthermore, in order to further improve the model, the architectural decisions were based on the intuition of multi-scale processing. Similar to R3D, the I3D replaces every 2D operation with the corresponding 3D ones.
Nevertheless, as already mentioned, the main disadvantages of CNN approaches are their lack of interpretability and explainability. Instead, an HC feature extraction approach [2,19,32] can be considered as explainable because it relies on human-interpretable features based on well-known mathematical concepts. However, the quality of explanation depends heavily on the utilized mathematical formulae [1]; thus, an HC approach cannot be considered widely explainable to every human. For instance, an HC approach that relies on discrete Fourier transform (DFT) [19] can be interpreted only by an audience familiar with the specific knowledge domain. Instead, in our approach, we create features that are based on widely known mathematical and geometric concepts, such as vertices and edges characteristics of input image objects, which are universally accepted as explainable.

3. Proposed Methodology

A high-level architectural description of the proposed 3D image feature extraction framework is depicted in Figure 1. The proposed framework is described as follows:
In the first step (Image Threshold Filters component), we apply simple thresholding and Otsu and Canny algorithms [33,34] to every image slice of the initial 3D input image. This step is essential in order to simplify the initial complicated input into a binary image (BI) and then extract the contour objects and spatial features. The BI is a 1-channel image, composed of two intensity pixel values, 0 or 1. The reason for choosing these filters is because we envisioned creating an interpretable and transparent feature extraction framework. Every algorithm utilized in our framework has to be interpretable. The algorithms used in this step are interpretable because they are based on well-defined transparent mathematical formulae. In the second step (Feature Vectors Extraction), based on the extracted contours of every BI, we extract the proposed explainable features. These features are initially extracted for every BI slice, creating sequence feature vectors. Finally, we average every feature sequence and create the final WB feature vector, which can be used as input for WB ML models, such as LR and DT.

3.1. Proposed Framework Mathematical Description

To describe the functionality of our framework in more detail, assume a 3D input image I D × H × W × C h , where H and W are the number of pixels corresponding to the height and width of every 2D image slice, respectively; D (depth) corresponds to the total number of slices; and C h is the number of channels of every image slice ( C h = 3 , in common RGB images). It is essential to mention that in order to apply the specific filters (simple thresholding, Otsu, and Canny), the initial multi-channel image I has to be transformed into a one-channel image (gray image: GI). This is simply performed by averaging the pixel values of all channels; thus, the G I D × H × W is created.
Next, the filters are applied to every G I ’s image slice given by the following general formulae:
B I i H × W = F G I i H × W ,
where G I i and B I i are the gray and binary image slices, respectively, i 1 , , D ; F is the corresponding function of the applied filter. G I i is represented as:
G I i   =   p 11 p 1 w p 1 W p h 1 p h w p h W p H 1 p H w p H W i ,
where p h w represents the pixel intensity values. The general filter function is defined as follows:
F ( p h w ) = 1 , p h w > t h F 0 , p h w t h F
where t h F represents the thresholding function regarding the applied filter F (simple, Otsu, or Canny).
Assume, in general, M totals 3D binary images, B I j D × H × W j [ 1 , , Μ ] , which are created after applying M total filters. In the next step, we extract the contours, C i , j , for every B I i , j H × W slice. C i , j is the set of pixel coordinates for every identified object in each B I i , j H × W slice (the term “object” refers to the image’s sub-regions, which form a discrete area of pixels with a value of 1 ). Then, based on the extracted contours, the proposed features:
X i , j = [ x 1 , x 2 , , x k ] i , j
as presented in Equations (8)–(26), are extracted for every B I i , j H × W slice; thus, a set of sequence feature vectors, X j D × k , is created and represented as:
X j D × k = X 1 , j , , X i , j , , X D , j T .
This feature extraction can be formalized as follows:
X j D × k = F E ( B I j D × H × W , C j ) , C j = C 1 , j , , C i , j , , C D , j , B I j D × H × W = B I 1 , j H × W , , B I i , j H × W , , B I D , j H × W ,
where the term F E represents the set of feature extraction formulae, as presented in Equations (8)–(26). Lastly, the final feature vector is computed by averaging the sequence vector, as described below:
X A v , j = 1 D i = 0 D X i , j , X A v , j = [ x A v 1 , x A v 2 , , x A v k ] j

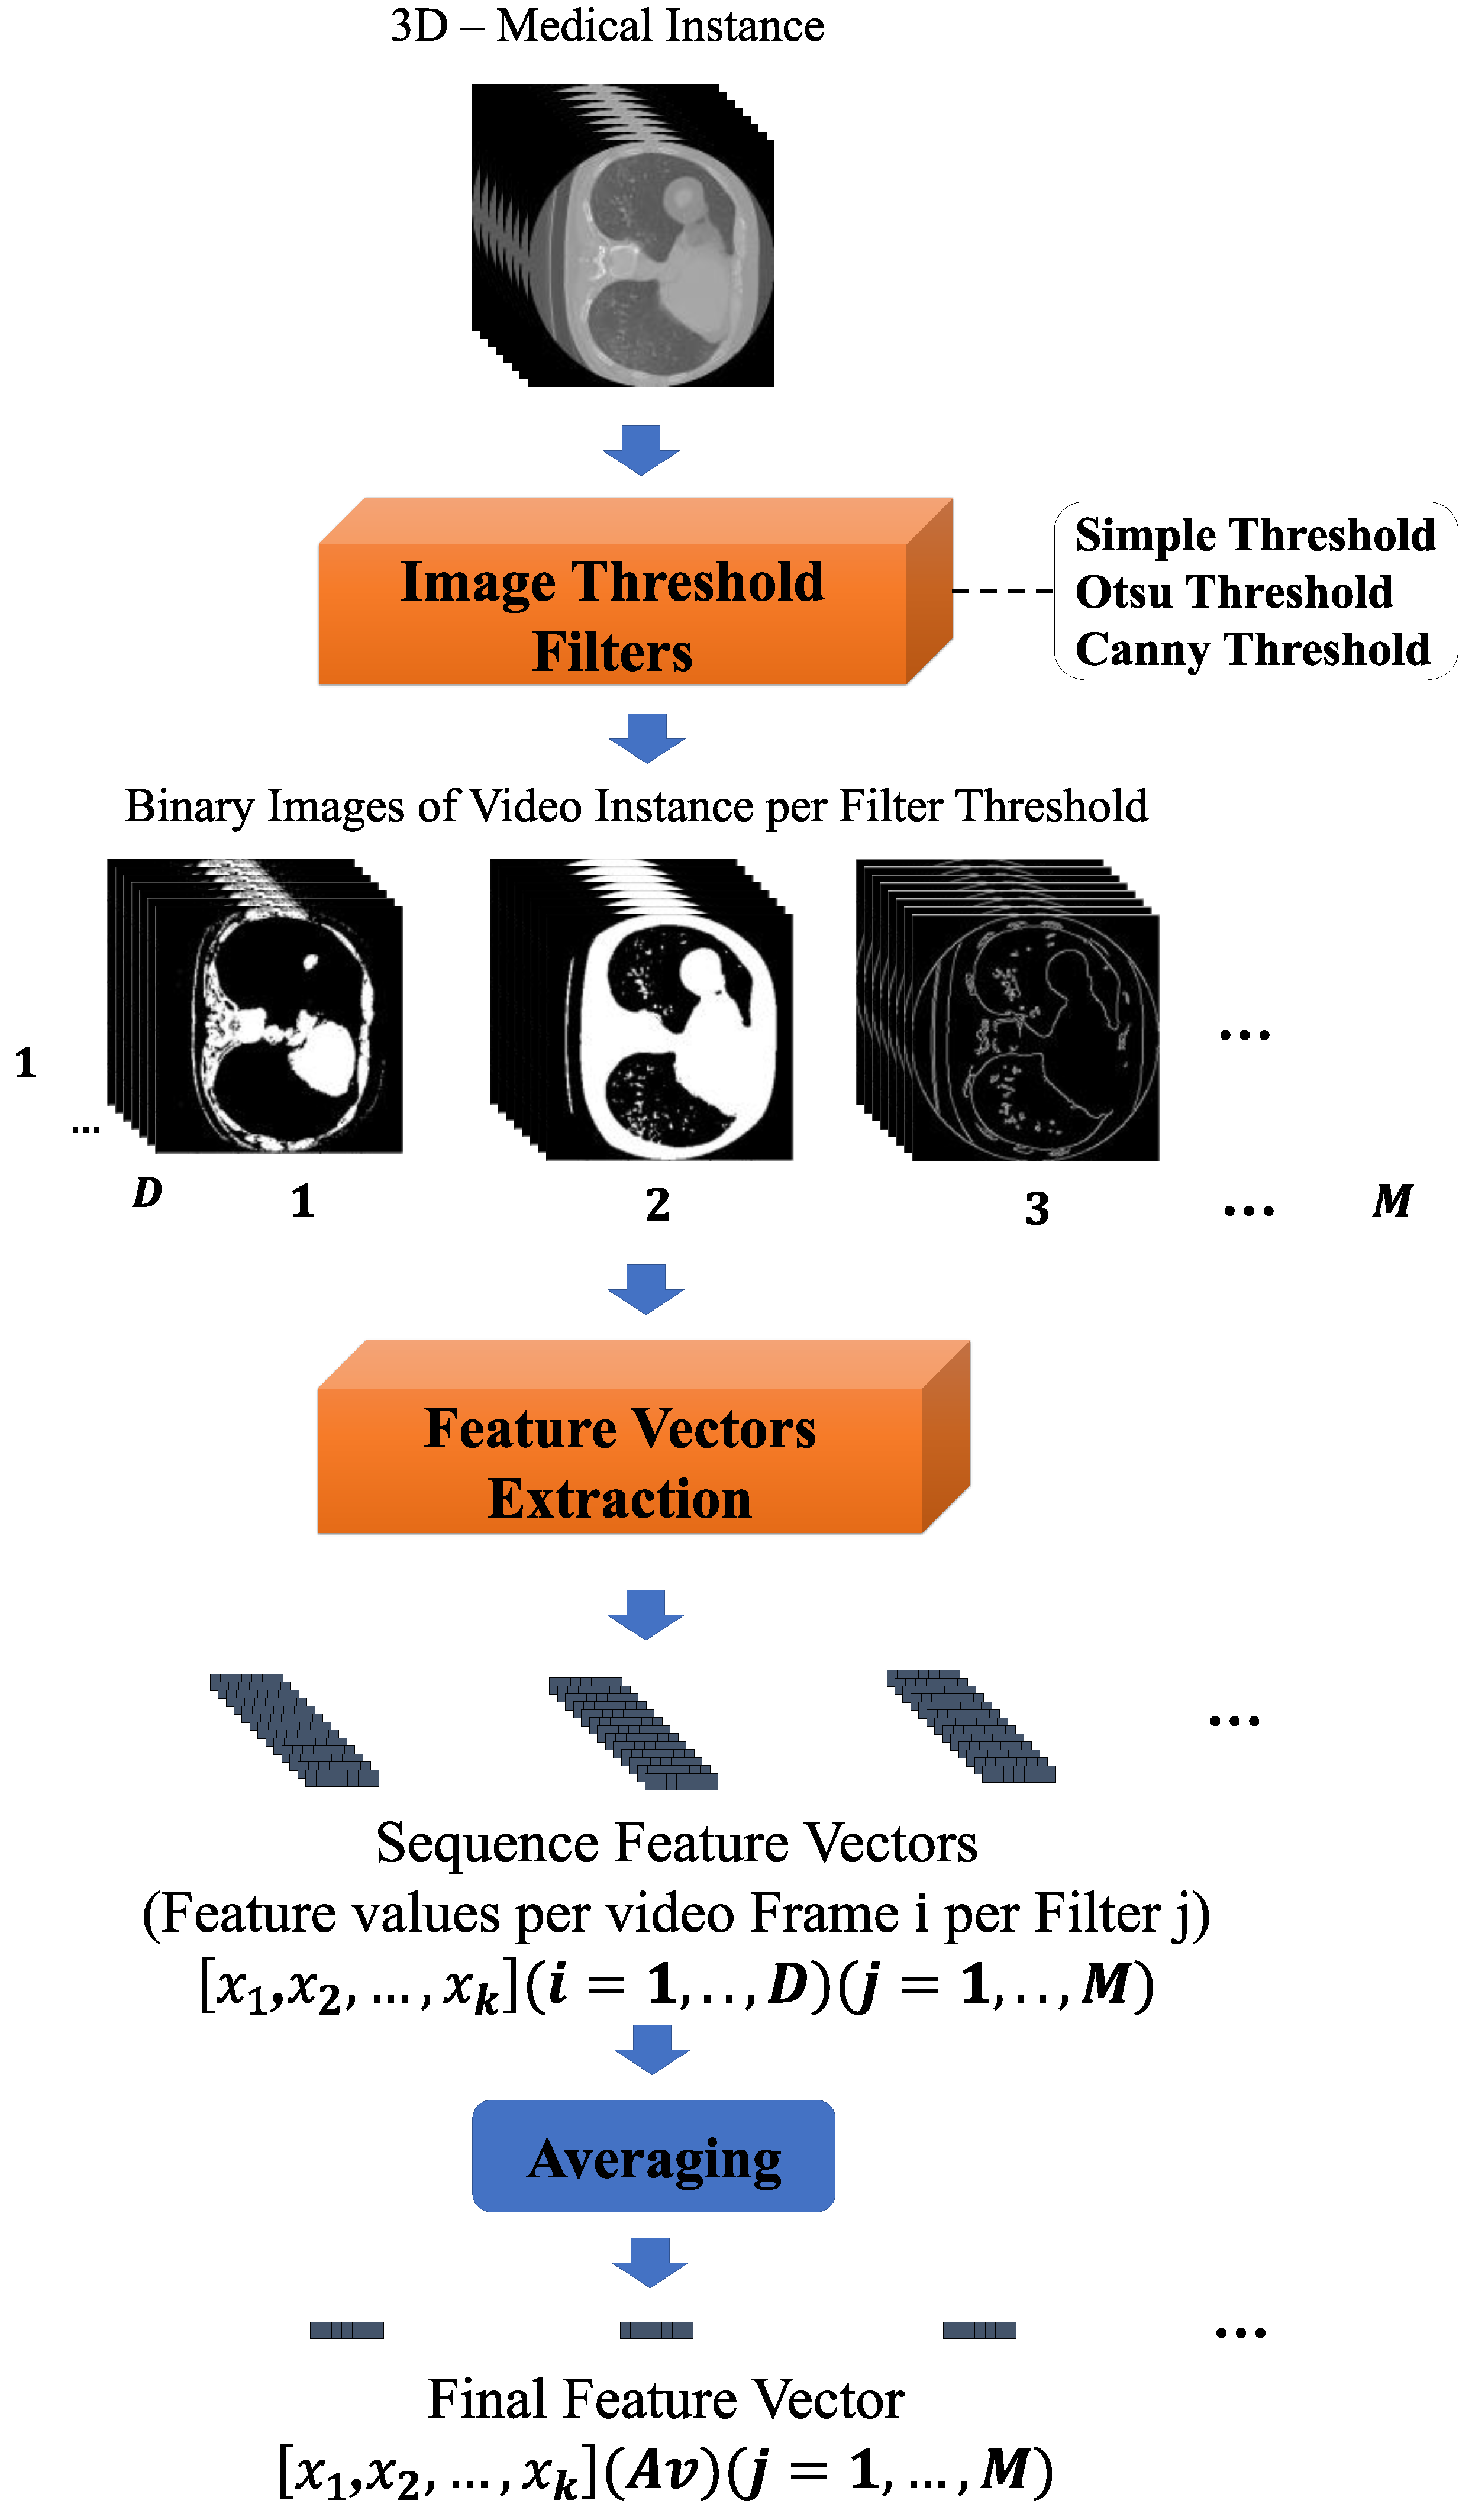
3.2. Feature Vectors Extraction Component

The following proposed mathematical formulae, (8)–(26), are applied to every binary image ( B I ) slice, which extracts the X j D × k -explainable features. A B I is a 1 -channel image, composed of intensity pixel values, 0 or 1 (a toy example is presented in Figure 2). We have also distinguished the proposed explainable features via six feature families/categories regarding the type of the extracted feature characteristics, namely, “Whole Image”, “Contours Number”, “Contours Perimeter Size”, “Contours Area Size”, “Contours Vertices Number”, and “Contours’ Gravity”. These feature categories were carefully selected and created in order to guarantee explainability, and the rotation invariance properties of the proposed framework were also followed by a high final accuracy performance. These categories are described as follows:
The Whole Image category extracts features based on the whole BI region and, thus, provides very abstract and compact total information.
The Contours Number category concerns features based on the number of extracted contours of each BI. This category fundamentally provides an easily explainable set of features, exploiting information regarding the population of the objects within the BI.
The Contours Perimeter Size category extracts shape characteristics of the extracted contours based on their perimeter size, providing information regarding the boundary region size of the underlying contours. The Contours Area Size category extracts shape attributes of the extracted contours based on their area size, providing information regarding the inner region size of the underlying contours.
The Contours Vertices Number category creates features based on the number of vertices of every extracted contour of each BI. These features provide more specific information regarding the objects’ morphology and also lead to more synthetic contour representation (combined with the “size” family features). For instance, a large in size contour followed by a small number of vertices number leads to the fact that the contour has few angles, reaching square contour types, and, in general, indicates a less complicated shape morphology object. In contrast, a large in size contour followed by also a large number of vertices number indicates that the underlying contour has a more complicated and complex shape morphology.
Finally, the Contours’ Gravity extracts feature is based on the center of gravity of every contour. These features provide a robust and compact representation of the BI’s objects, exploiting information regarding the mass of the underlying objects.
All these feature categories are also fundamentally invariant to rotations. For instance, the rotation of an image will not affect the number of vertices and the size of contours. The proposed feature extraction is mathematically described as follows:
The first feature family is the “Whole Image” category, where the features are extracted by utilizing all the pixel values of the BI, which are described as follows:
E B I = 1 H × W h , w = 1,1 H , W p h w
V A R B I = E B I 2 - E B I 2
where E B I measures the average intensity value of the B I slice. A high value indicates that the extracted contour objects are compact and cover a higher area compared to the image’s background. V A R B I measures the variance of the intensity values of the BI. A high value indicates that the extracted contour objects are very irregular.
The second feature family is the “Contours Number” category constituted by the features, the number of contours ( N u C s ), and the number of lines ( N u L s ). These features measure the total number of extracted contour objects and the total number of extracted lines, respectively (a toy example is presented in Figure 2).
The third feature family is the “Contours Perimeter Size” category constituted by the features, average contours’ perimeter ( A v C P e r ), variance of contours’ perimeter ( V a r C P e r ), and max/min of contours’ perimeter ( M a x , M i n C P e r ) defined as:
A v C P e r = 1 N u C i = 0 N u C P i
V a r C P e r = 1 N c i = 0 N u C P i - A v C P e r 2
M a x , M i n C P e r = M A X , M I N ( P i )
where A v C P e r measures the representative/average perimeter size of the identified contours of the B I . The term P i represents the perimeter size of contour i . V a r C P e r measures the variance of the perimeter’s sizes for the identified contours. M a x , M i n C P e r measures the maximum/minimum perimeter size of the identified contours.
The fourth feature family is the “Contours Area Size” constituted by the features, average Contours’ Area ( A v C A r ), variance of Contours’ Area ( V a r C A r ), and max/min of Contours’ Area ( M a x , M i n C A r ) defined as:
A v C A r = 1 N u C i = 0 N u C A i
V a r C A r = 1 N u C i = 0 N u C A i - A v C A r 2
M a x , M i n C A r = M A X , M I N ( A i )
where A v C A r measures the representative/average area size of the identified contours of the B I . The term A i represents the area size of every contour i . V a r C A r measures the variance of the area sizes for the identified contours. M a x , M i n C A r measures the maximum/minimum area size of the identified contours.
The fifth feature family is the “Contours Vertices Number” constituted by the features, average of Contours’ Vertices Number ( A v C V N u ), variance of Contours’ Vertices Number ( V a r C V N u ), and max/min of Contours’ Vertices Number ( M a x , M i n C V N u ) defined as:
A v C V N u = 1 N u C i = 0 N u C N u V i
V a r C V N u = 1 N u C i = 0 N u C N V i - A v C V N u 2
M a x , M i n C V N u = M A X , M I N ( N u V i )
where A v C V N u measures the average value of the number of vertices of every identified contour of the B I . The term N u V i represents the total number of vertices of contour i . V a r C V N u measures the variance of the N u V i values, and M a x , M i n C V N u measures the maximum/minimum of the N u V i values.
The sixth and final feature family is “Contours’ Gravity” constituted by the features, average contours’ center of gravity ( A v C C G ), variance of contours’ center of gravity ( V a r C C G ), max/min of contours’ center of gravity ( M a x , M i n C C G ), average contours’ irregularity ( A v C I r r ), variance contours’ irregularity ( V a r C I r r ), and max/min of contours’ irregularity ( M a x , M i n C I r r ) defined as:
C G i = 1 2 N u V j = 0 N u V ( X j + Y j ) i
A v C C G = 1 N u C i = 0 N u C C G i
V a r C C G = 1 N u C i = 0 N u C C G i - A v C C G 2
M a x , M i n C C G = M A X , M I N ( C G i )
I r r i = j = 0 N u V X j - C G i 2 + ( Y j - C G i ) 2 2 N u V
A v C I r r = 1 N u C i = 0 N u C I r r i
V a r C I r r = 1 N u C i = 0 N u C I r r i - A v C I r r 2
M a x , M i n C I r r = M A X , M I N ( I r r i )
where the terms X j   a n d   Y j represent the vertices’ coordinates. The term C G i represents the center of gravity of every contour i .
Figure 2 presents a toy example in order to further explain, in a more understandable way, some of the proposed features. Assume the following extracted contours (A, B) and curved lines (C, D), given a BI, as presented in Figure 2. In this specific toy example, one can easily observe and understand the calculation and the meaning of some feature examples based on the proposed formulae.

4. Experimental Setup and Results

4.1. Pneumonia Detection Problem

The pneumonia detection problem has recently attracted very high interest [22,23], mainly due to the COVID-19 [24] pandemic. Therefore, early and accurate detection of pneumonia cases and healthy patients is of vital significance.
The dataset used in our experiments is based on the MosMedData dataset [35], which was provided by medical hospitals in Moscow, Russia, and collected at the Center of Diagnostics and Telemedicine. It is composed of 3D-CT lung volumes from anonymized human lung computer tomography (CT) scans with COVID-19-related findings.
More specifically, the dataset includes 44% males and 56% females of ages between 18 and 97 years old with a median of 47 years old. The utilized dataset is constituted of 425 CT scans, comprising 254 healthy and 171 ill patient subjects, respectively. Each scan instance has 80 image slices in total, while each slice has 300×300 height and width pixel resolution.

4.2. Presentation of Results

In this section, we present and discuss our experimental results (Table 1) regarding the proposed framework, applying it to the pneumonia detection dataset. Table A1 in Appendix A presents a comprehensive summary of the main characteristics of all prediction frameworks utilized in our experimental simulations. Finally, in Figure A1 in Appendix A, we present an application of the proposed features for a case study pneumonia instance example. The whole implementation code can be found in the following link: https://github.com/EmmanuelPintelas/Novel-Explainable-Feature-Extraction-from-3D-Images-applied-on-Pneumonia-Detection (accessed on 1 June 2023).
The validation of our experimental simulations was based on the geometric mean (GM) [36] performance metric. Compared to the common accuracy metric, GM is more suitable in unbalanced datasets and biased predictions because it is based on the multiplication of the true positive and true negative prediction values. Thus, it can be considered as a reliable and robust validation metric, in general. In addition, we have also included the validation metrics: sensitivity (Sen) and specificity (Spe). It is worth mentioning that GM, along with the balance of Sen and Spe, highlights the information provided by a confusion matrix in compact form [37,38]; thus, they constitute the proper performance metrics to evaluate a classification model, especially in the case of imbalanced data.
In both 3D topologies, the 2D operations (convolutions and pooling layers) are replaced with the corresponding 3D operations and initialized based on ImageNet and Kinetics weights [31]. The CNN models’ output feature maps were vectorized based on the global averaging pooling (GAP) operation followed by the output block. All CNN models were implemented in Keras and fine-tuned regarding the new case study datasets. Moreover, the specifications of the CNN output blocks’ technical parameters (such as fully connected (FC) and dropout components) were set in order to gain maximum performance results. During the training procedure, the Adam optimizer [39] was used with a small initial learning rate ( 10 - 4 ). The reason for choosing a small initial learning rate is that we already used pretrained CNN models; hence, it is not appropriate to drastically change and “destroy” the initially saved weights of every model. Additionally, we used a reduce-learning-rate-on-plateau scheduler during the training phase in order to upgrade the learning rate with respect to the validation score. In particular, for every three epochs in which there was no validation accuracy improvement, learning was decreased by a factor of 0.5 until a minimum learning rate ( 10 - 7 ) was achieved.
The main observations of our experimental results can be summarized as follows:
  • Overall, the proposed framework exhibits better performance compared to other WB approaches when applied to the pneumonia detection problem.
  • It also managed to outperform most of the other BB approaches. In particular, it slightly outperformed the best-identified BB approach (the I3D-SVM model managed to deliver the best results among the other BB approaches). However, it also managed to achieve the best geometric mean score of 0.883 , surprisingly surpassing the I3D-SVM model. Considering the fact that the proposed approach is interpretable, such a performance is particularly significant.
  • The Inception model produced the best results compared to ResNet for both their 2D and 3D versions.
  • Among the ML models, the SVM classifier achieved, on average, the best results for all feature representation approaches.
  • The best results, in general, were achieved for high compression sizes for the pneumonia dataset, while for lower compression sizes, rapid performance degradation was observed.

5. Discussion and Conclusions

In this work, we proposed an advanced explainable feature extraction and prediction framework for 3D image recognition applied to pneumonia detection. Based on our experimental results, our method outperformed every other utilized 3D prediction approach (both white- and black-box approaches), validating the efficiency and effectiveness of the proposed approach. Considering the fact that the proposed model is a white-box model and interpretable, such a performance can be considered particularly noteworthy and remarkable. In summary, the advantages of the proposed feature extraction and classification framework are presented as follows:
  • The whole feature extraction and classification procedure of the entire ML framework is totally transparent and interpretable.
  • The final extracted features are explainable and meaningful in human terms.
  • Last but not least, the final extracted features are invariant to image rotations.
Nevertheless, because the proposed features are computed independently for every image slice of a given 3D image, the main limitation of the proposed framework inevitably lies in the long feature extraction computation time. Therefore, a parallel implementation that simultaneously computes the proposed explainable feature set for batches of image slices instead would be essential in order to drastically boost the total computation speed performance. On the other hand, the main advantage of the proposed framework (except for the explainability/interpretability one) is that it requires extremely low memory resources because only the final extracted features and the weights of an LR white-box model have to be stored, which is in contrast to CNN models, where millions of weight parameters have to be stored.
In future work, further investigation and experimentations should be performed. In particular, we aim to further improve the proposed framework by inventing even more interpretable and explainable features that are meaningful in human terms. Moreover, we also intend to apply our proposed methodology to other, more image-intensive application tasks, such as image segmentation and image similarity problems, in order to further investigate its feature extraction efficacy in a much wider range of image representation tasks.
Additionally, we intend to explore dependencies between adjacent slices of the extracted features in order to remove possible redundant features and further improve the reliability of the proposed framework.
Finally, we intend to upgrade the proposed framework by incorporating ensemble-based methods [10] based on XGBoost and random forest models in order to further improve the final prediction performance.

Author Contributions

Conceptualization, E.P.; methodology, E.P.; software, E.P.; validation, I.E.L. and P.P.; formal analysis, I.E.L.; investigation, E.P. and I.E.L.; resources, E.P. and I.E.L.; data curation, E.P. and I.E.L.; writing—original draft preparation, E.P.; writing—review and editing, E.P., I.E.L., and P.P.; visualization, I.E.L. and P.P.; supervision, I.E.L. and P.P. All authors have read and agreed to the published version of the manuscript.

Funding

This research received no external funding.

Data Availability Statement

Not applicable.

Conflicts of Interest

The authors declare no conflict of interest.

Appendix A

Table A1. Summary of the key characteristics of the 3D prediction frameworks utilized in our experimental setup.
FrameworksBrief DescriptionAbstract Architecture
HC Features
(Explainable/WB)
HC1 (Proposed), HC2 [19],
HC3 [2]
In the first phase, an HC approach extracts features for every 2D image frame of the 3D image input. In the second phase, the extracted feature vectors are averaged and finally fed into an ML model, which performs the classification task.
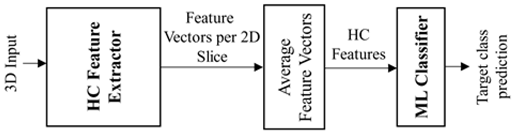
 Electronics 12 02663 i001
2D CNN Features
(Non-Explainable/BB)
2D-CNN–ML [28]In the first phase, a 2D-CNN model extracts features for every 2D image frame/slice of the 3D image input. In the second phase, the extracted features are aggregated and fed into an ML model, which performs the classification task.
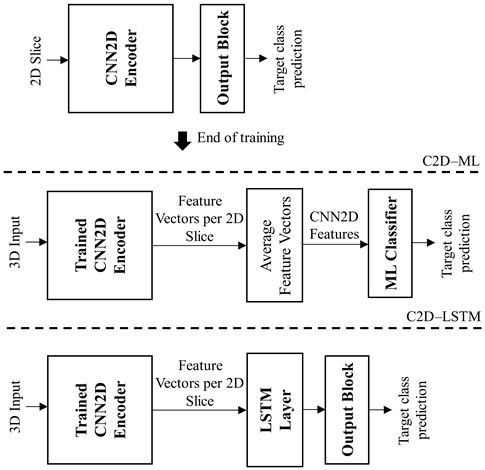
Electronics 12 02663 i002
2D-CNN-LSTM [30]Similar to the above approach, in the first phase, a trained 2D-CNN model extracts features for every 2D image frame/slice of the 3D image input. However, in the second phase, an LSTM layer is fed with the 2D-CNN features ordered in the time/spatial domain, followed by the final output layer, which performs the classification task.
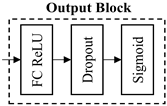
3D CNN Features
(Non-Explainable/BB)
3D-CNN E-E [31]End–end (E-E) CNN approach. A 3D-CNN model, such as I3D and R3D, followed by an output block is trained with respect to a 3D classification task.
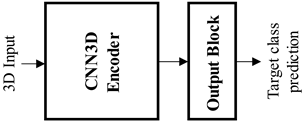
Electronics 12 02663 i003
3D-CNN-ML [29,31]The output block is discarded, while the 3D-CNN features are used for training a ML classification model, such as SVM.
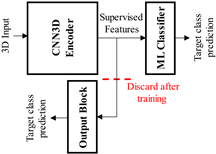
Electronics 12 02663 i004
Electronics 12 02663 i005
Table A2. List of main acronyms and abbreviations.
MLMachine Learning
CNNConvolutional Neural Network
HCHand Crafted
WBWhite Box
BBBlack Box
LRLogistic Regression
DTDecision Tree
I3D3D Inception
R3D3D ResNet
GAPGlobal Averaging Pooling
FCFully Connected
BIBinary Image
As presented in Figure A1, in the frames F 0 and F 1 , the instance seems to appear normal; however, in frame F 2 , the pneumonia signs seem to appear. It can be easily observed that our proposed explainable features for this case study instance possess distinguishable values between the “normal” F 0 and F 1 frames and the F 3 one, detecting the pneumonia presence and, thus, revealing the efficiency of the proposed features for this case study instance.
Figure A1. Application of proposed features in a case study on 3D pneumonia instance. For practical reasons, we demonstrate the feature extraction procedure for three consecutive image frames of the whole instance.
Electronics 12 02663 g0a1

References

  1. Pintelas, E.; Liaskos, M.; Livieris, I.E.; Kotsiantis, S.; Pintelas, P. Explainable Machine Learning Framework for Image Classification Problems: Case Study on Glioma Cancer Prediction. J. Imaging 2020, 6, 37. [Google Scholar] [CrossRef]
  2. Pintelas, E.; Liaskos, M.; Livieris, I.E.; Kotsiantis, S.; Pintelas, P. A novel explainable image classification framework: Case study on skin cancer and plant disease prediction. Neural Comput. Appl. 2021, 33, 15171–15189. [Google Scholar] [CrossRef]
  3. Selvaraju, R.R.; Cogswell, M.; Das, A.; Vedantam, R.; Parikh, D.; Batra, D. Grad-CAM: Visual Explanations from Deep Networks via Gradient-Based Localization. In Proceedings of the 2017 IEEE International Conference on Computer Vision (ICCV), Venice, Italy, 22–29 October 2017; pp. 618–626. [Google Scholar]
  4. Atkinson, K.; Bench-Capon, T.; Bollegala, D. Explanation in AI and law: Past, present and future. Artif. Intell. 2020, 289, 103387. [Google Scholar] [CrossRef]
  5. Xing, X.; Rafique, M.U.; Liang, G.; Blanton, H.; Zhang, Y.; Wang, C.; Jacobs, N.; Lin, A.-L. Efficient Training on Alzheimer’s Disease Diagnosis with Learnable Weighted Pooling for 3D PET Brain Image Classification. Electronics 2023, 12, 467. [Google Scholar] [CrossRef]
  6. Thandapani, S.; Mahaboob, M.I.; Iwendi, C.; Selvaraj, D.; Dumka, A.; Rashid, M.; Mohan, S. IoMT with Deep CNN: AI-Based Intelligent Support System for Pandemic Diseases. Electronics 2023, 12, 424. [Google Scholar] [CrossRef]
  7. da Cruz, H.F.; Pfahringer, B.; Martensen, T.; Schneider, F.; Meyer, A.; Böttinger, E.; Schapranow, M.-P. Using interpretability approaches to update “black-box” clinical prediction models: An external validation study in nephrology. Artif. Intell. Med. 2020, 111, 101982. [Google Scholar] [CrossRef]
  8. Molnar, C. Interpretable Machine Learning: A Guide for Making Black Box Models Explainable; Leanpub: Victoria, BC, Canada, 2018. [Google Scholar]
  9. Setzu, M.; Guidotti, R.; Monreale, A.; Turini, F.; Pedreschi, D.; Giannotti, F. GLocalX—From Local to Global Explanations of Black Box AI Models. Artif. Intell. 2021, 294, 103457. [Google Scholar] [CrossRef]
  10. Pintelas, E.; Livieris, I.E.; Pintelas, P. A Grey-Box Ensemble Model Exploiting Black-Box Accuracy and White-Box Intrinsic Interpretability. Algorithms 2020, 13, 17. [Google Scholar] [CrossRef] [Green Version]
  11. Gao, Q.; Lim, S. Classification of hyperspectral images with convolutional neural networks and probabilistic relaxation. Comput. Vis. Image Underst. 2019, 188, 102801. [Google Scholar] [CrossRef]
  12. Mishra, R.K.; Urolagin, S.; Jothi, J.A.A.; Gaur, P. Deep hybrid learning for facial expression binary classifications and predictions. Image Vis. Comput. 2022, 128, 104573. [Google Scholar] [CrossRef]
  13. Chen, S.; Liu, D.; Pu, Y.; Zhong, Y. Advances in deep learning-based image recognition of product packaging. Image Vis. Comput. 2022, 128, 104571. [Google Scholar] [CrossRef]
  14. Ye, X.; Bilodeau, G.-A. Video prediction by efficient transformers. Image Vis. Comput. 2023, 130, 104612. [Google Scholar] [CrossRef]
  15. Lu, L.; Wang, X.; Carneiro, G.; Yang, L. (Eds.) Deep Learning and Convolutional Neural Networks for Medical Imaging and Clinical Informatics; Springer International Publishing: Berlin/Heidelberg, Germany, 2019. [Google Scholar]
  16. Hemanth, D.J.; Estrela, V.V. (Eds.) Deep Learning for Image Processing Applications; IOS Press: Amsterdam, The Netherlands, 2017; Volume 31. [Google Scholar]
  17. Kenny, E.M.; Ford, C.; Quinn, M.; Keane, M.T. Explaining black-box classifiers using post-hoc explanations-by-example: The effect of explanations and error-rates in XAI user studies. Artif. Intell. 2021, 294, 103459. [Google Scholar] [CrossRef]
  18. Pintelas, E.; Pintelas, P. A 3D-CAE-CNN model for Deep Representation Learning of 3D images. Eng. Appl. Artif. Intell. 2022, 113, 104978. [Google Scholar] [CrossRef]
  19. Durall, R.; Keuper, M.; Pfreundt, F.J.; Keuper, J. Unmasking deepfakes with simple features. arXiv 2019, arXiv:1911.00686. [Google Scholar]
  20. Hejazi, S.M.; Abhayaratne, C. Handcrafted localized phase features for human action recognition. Image Vis. Comput. 2022, 123, 104465. [Google Scholar] [CrossRef]
  21. Esteves, C.; Allen-Blanchette, C.; Zhou, X.; Danilidis, K. Polar transformer networks. In Proceedings of the ICLR, Vancouver, BC, Canada, 30 April–3 May 2018. [Google Scholar]
  22. Harmon, S.A.; Sanford, T.H.; Xu, S.; Turkbey, E.B.; Roth, H.; Xu, Z.; Yang, D.; Myronenko, A.; Anderson, V.; Amalou, A.; et al. Artificial intelligence for the detection of COVID-19 pneumonia on chest CT using multinational datasets. Nat. Commun. 2020, 11, 4080. [Google Scholar] [CrossRef]
  23. Ko, H.; Chung, H.; Kang, W.S.; Kim, K.W.; Shin, Y.; Kang, S.J.; Lee, J.H.; Kim, Y.J.; Kim, N.Y.; Jung, H.; et al. COVID-19 pneumonia diagnosis using a simple 2d deep learning framework with a single chest ct image: Model development and validation. J. Med. Internet Res. 2020, 22, e19569. [Google Scholar] [CrossRef]
  24. Comito, C.; Pizzuti, C. Artificial intelligence for forecasting and diagnosing COVID-19 pandemic: A focused review. Artif. Intell. Med. 2022, 128, 102286. [Google Scholar] [CrossRef]
  25. Ciocca, G.; Napoletano, P.; Schettini, R. CNN-based features for retrieval and classification of food images. Comput. Vis. Image Underst. 2018, 176–177, 70–77. [Google Scholar] [CrossRef]
  26. He, K.; Zhang, X.; Ren, S.; Sun, J. Deep residual learning for image recognition. In Proceedings of the IEEE Conference on Computer Vision and Pattern Recognition, Las Vegas, NV, USA, 27–30 June 2016; pp. 770–778. [Google Scholar]
  27. Szegedy, C.; Liu, W.; Jia, Y.; Sermanet, P.; Reed, S.; Anguelov, D.; Erhan, D.; Rabinovich, A. GoogLeNet/Inception Going deeper with convolutions. In Proceedings of the CVPR, Boston, MA, USA, 7–12 June 2015. [Google Scholar]
  28. Karpathy, A.; Toderici, G.; Shetty, S.; Leung, T.; Sukthankar, R.; Li, F.-F. Large-scale video classification with convolutional neural networks. In Proceedings of the IEEE Conference on Computer Vision and Pattern Recognition, Columbus, OH, USA, 24–27 June 2014; pp. 1725–1732. [Google Scholar]
  29. Niu, X.-X.; Suen, C.Y. A novel hybrid CNN–SVM classifier for recognizing handwritten digits. Pattern Recognit. 2012, 45, 1318–1325. [Google Scholar] [CrossRef]
  30. Güera, D.; Delp, E.J. Deepfake video detection using recurrent neural networks. In Proceedings of the 2018 15th IEEE International Conference on Advanced Video and Signal Based Surveillance (AVSS), Auckland, New Zealand, 27–30 November 2018; pp. 1–6. [Google Scholar]
  31. Carreira, J.; Zisserman, A. Quo vadis, action recognition? a new model and the kinetics dataset. In Proceedings of the IEEE Conference on Computer Vision and Pattern Recognition, Honolulu, HI, USA, 21–26 July 2017; pp. 6299–6308. [Google Scholar]
  32. Vernikos, I.; Mathe, E.; Spyrou, E.; Mitsou, A.; Giannakopoulos, T.; Mylonas, P. Fusing Handcrafted and Contextual Features for Human Activity Recognition. In Proceedings of the 2019 14th International Workshop on Semantic and Social Media Adaptation and Personalization (SMAP), Larnaca, Cyprus, 9–10 June 2019; pp. 1–6. [Google Scholar]
  33. Senthilkumaran, N.; Vaithegi, S. Image Segmentation by Using Thresholding Techniques For Medical Images. Comput. Sci. Eng. Int. J. 2016, 6, 1–13. [Google Scholar]
  34. Savant, S. A review on edge detection techniques for image segmentation. Int. J. Comput. Sci. Inf. Technol. 2014, 5, 5898–5900. [Google Scholar]
  35. Morozov, S.P.; Andreychenko, A.E.; Blokhin, I.A.; Gelezhe, P.B.; Gonchar, A.P.; Nikolaev, A.E.; Pavlov, N.A.; Chernina, V.Y.; Gombolevskiy, V.A. MosMedData: Chest CT Scans with COVID-19 Related Findings Dataset. Preprint 2020. [Google Scholar] [CrossRef]
  36. Livieris, I.E.; Pintelas, P. A novel multi-step forecasting strategy for enhancing deep learning models’ performance. Neural Comput. Appl. 2022, 34, 19453–19470. [Google Scholar] [CrossRef]
  37. Livieris, I.E.; Kiriakidou, N.; Stavroyiannis, S.; Pintelas, P. An Advanced CNN-LSTM Model for Cryptocurrency Forecasting. Electronics 2021, 10, 287. [Google Scholar] [CrossRef]
  38. Livieris, I.E.; Kiriakidou, N.; Kanavos, A.; Vonitsanos, G.; Tampakas, V. Employing constrained neural networks for forecasting new product’s sales increase. In Artificial Intelligence Applications and Innovations; Springer International Publishing: Berlin/Heidelberg, Germany, 2019; pp. 161–172. [Google Scholar]
  39. Zhang, Z. Improved ADAM optimizer for deep neural networks. In Proceedings of the 2018 IEEE/ACM 26th International Symposium on Quality of Service (IWQoS), Banff, AB, Canada, 4–6 June 2018; pp. 1–2. [Google Scholar]
Figure 1. High-level presentation of the proposed explainable feature extraction framework.
Electronics 12 02663 g001
Figure 2. Presentation of feature extraction for a toy example.
Electronics 12 02663 g002aElectronics 12 02663 g002b
Table 1. Performance results for the pneumonia detection dataset.
3D Image
Dimension Sizes
Val.
Metrics
HC Features
(Explainable)
2D-CNN Features
(Non-Explainable)
3D-CNN Features
(Non-Explainable)
HC1
(Proposed)
HC2 HC3 R2D I2D R3D I3D
LR DT LR DT LR DT LSTM SVM LSTM SVM E-E SVM E-E SVM
80 × 300 × 300 GM0.8160.728 0.5860.5190.706 0.6730.707 0.737 0.807 0.7900.7550.7670.8350.840
Sen0.8240.765 0.4710.4120.647 0.5880.7650.7060.706 0.7060.7060.7650.8240.706
Spe0.8080.6920.7310.6540.769 0.7690.6540.7690.923 0.8850.8080.6540.8461.0
80 × 150 × 150 GM0.8830.737 0.6690.6380.6050.6890.6380.6880.8040.8220.6730.7070.8400.824
Sen0.8820.706 0.6470.5880.5290.8240.5880.6470.6470.7650.5880.7650.706 0.706
Spe0.8850.7690.6920.6920.6920.5770.6920.7311.0000.8850.7690.6541.0000.962
80 × 75 × 75 GM0.7230.6220.6200.6380.6380.6560.6880.6730.7610.7370.723 0.7730.7370.761
Sen0.6470.5290.5880.5290.5880.5880.6470.5880.9410.8820.647 0.7060.8820.941
Spe0.8080.7310.6540.7690.6920.7310.7310.7690.6150.6150.8080.8460.6150.615
80 × 50 × 50 GM0.8040.6880.6420.6380.6540.6590.7550.7400.7600.8070.7370.7900.7900.822
Sen0.7650.6470.7650.7060.5290.4710.7060.6470.8820.7060.7060.7060.7060.765
Spe0.8460.7310.5380.5770.8080.9230.8080.8460.6540.9230.7690.8850.8850.885
40 × 50 × 50 GM0.8220.712 0.6420.6590.6310.6020.6730.7060.7060.6880.7180.7180.7400.721
Sen0.7650.824 0.8240.7060.4710.5880.5880.6470.6470.6470.7060.824 0.6470.588
Spe0.8850.6150.5000.6150.8460.6150.7690.7690.7690.7310.7310.6150.8460.846
Disclaimer/Publisher’s Note: The statements, opinions and data contained in all publications are solely those of the individual author(s) and contributor(s) and not of MDPI and/or the editor(s). MDPI and/or the editor(s) disclaim responsibility for any injury to people or property resulting from any ideas, methods, instructions or products referred to in the content.

