Article

An AR Application for the Efficient Construction of Water Pipes Buried Underground

1
Toyohashi University of Technology, Toyohashi 441-8580, Japan
2
Japan Advanced Institute of Science and Technology, Nomi 923-1292, Japan
3
National Institute of Technology, Asahikawa College, Asahikawa 079-8501, Japan
*
Author to whom correspondence should be addressed.
Electronics 2023, 12(12), 2634; https://doi.org/10.3390/electronics12122634
Submission received: 31 March 2023 / Revised: 24 May 2023 / Accepted: 1 June 2023 / Published: 12 June 2023

Abstract

:
Unlike other civil engineering works, water pipe works require digging out before construction because the construction site is buried. The AR application is a system that displays buried objects in the ground in three dimensions when users hold a device such as a smartphone over the ground, using images from the smartphone. The system also registers new buried objects when they are updated. The target of this project is water pipes, which are the most familiar of all buried structures. The system has the following functions: “registration and display of new water pipe information” and “acquisition and display of current location coordinate information.” By applying the plane detection function to data acquired from a camera mounted on a smartphone, the system can easily register and display a water pipe model horizontally to the ground. The system does not require a reference marker because it uses GPS and the plane detection function. In the future, the system will support the visualization and registration of not only water pipes but also other underground infrastructures and will play an active role in the rapid restoration of infrastructure after a large-scale disaster through the realization of a buried-object 3D MAP platform.

1. Introduction

1.1. Background

Social infrastructures built during the period of rapid economic growth are aging. Social infrastructures are closely related to the public, and as they deteriorate, there is an increasing risk of accidents that may have long-term, widespread, and significant effects on daily life and economic activities. Water supply and sewerage systems, which are water-related infrastructures among social infrastructures, are also aging in the same way, with water supply and sewerage lines that were laid decades ago [1]. The legal service life of water pipes is 40 years. Many of the current water pipes were installed during the period of rapid economic growth and have exceeded their legal service life. However, due to the financial difficulties of local governments, they are unable to raise enough money to renew all of their water pipes. The water pipeline construction work that is the subject of this study differs significantly from other civil engineering works. In “civil engineering works such as roads and bridges,” the construction site is exposed and can be easily checked visually. In addition, the areas that are not visible are exposed by cutting them out. In the case of “water pipe work,” the work area is buried and cannot be visually confirmed before construction. The major difference is that the work site is buried and must be excavated. Therefore, there is a need for a system that can confirm the location of water pipes without digging. By minimizing the digging work, it would be possible to shorten the construction period and reduce the construction cost.

1.2. Research Objectives

This research aims to realize an AR-based visualization system for buried water pipes. The AR application system realized in this research is a system that displays buried objects on the ground in three dimensions by holding a smartphone or other device over the ground in relation to the acquired video image. This research targets water pipes, which are the most familiar of all buried objects in the ground. This system will greatly contribute to solving a major problem that the current water pipe infrastructure faces, which is that it is impossible to know what is buried until it is dug up at the time of construction. Among water pipes, many of the installed water pipes targeted in this study have passed their legal service life and are used as if they were patched, while water leakage points are being sealed. In addition, many of the pipes are old, and there are many water pipes that are not digitally managed. For this reason, this study adds a function that allows new water pipe data to be added at the construction site. This problem can be solved from the viewpoint of DX with an AR application using mobile devices to support safer and more efficient construction work [2]. DX is defined as the transformation of people’s lives for the better through the penetration of digital technology into society. By using the AR application for the visualization of water pipes in this research, it is expected to “reduce construction costs” by implementing pinpoint construction and “drastically reduce the time and cost” of creating new digital data. In addition, while conventional research on infrastructure requires annotation on paper or digital maps, this system can be used without difficult operations by workers because it automatically performs plane detection on roads in the field [3].

2. System Configuration

The flow of the smartphone side application constructed is shown in Figure 1, and Figure 2 shows the application screen. The application has two functions: “registering and displaying new water pipes” and “acquiring and displaying current location coordinate information. The “New water main registration and display” function allows workers to check for buried water pipes by holding a device such as a smartphone over the ground. When a new water pipe is laid, the information can be instantly updated on site. The water pipes to be registered are registered by having workers operate the device, determine the location of the water pipe, and set the depth of the pipe. The system is designed to store and accumulate data on water pipes that have already been buried and those that have been renewed and registered at the time of installation by building and managing a cloud computing system. The “Obtain and display current location coordinate information” function is intended to assist workers in knowing their current location, registering new water pipes, and displaying the information. As shown in Figure 3, this application is intended for outdoor use. The “Water main input and conversion” system, which operates on a PC and handles existing water main data, is designed to import existing GIS data using a camera or scanner, so it is a system intended for use on a PC. The flow of water pipe data input and conversion is shown in Figure 4.

2.1. Development Environment

The devices used were a PC “GALERIA GR2060RGF-T, OS: Windows 10 Pro” and a smartphone “SONY Xperia XZ1 (SO1-01K), OS: Android 9. The development environment used was Android Studio and Unity (2020.3.23f1). C# was used as the development language. For the library used, “ARCore for Unity” was selected. The smartphone device used was an Android device, which is suitable for application development using Windows. Android Studio was used for Android application development, and AR display using ARCore was developed in Unity. The library “ARCore for Unity” was used because it enables the development of ARCore applications on Android smartphones released by Google. Google Maps “API” was used to implement the system’s function of “acquiring and displaying current location information.

2.2. Implementation of New Registration and Display Functions for Water Pipes

In order to implement a function for registering and displaying new 3D water and sewer pipes in the field, we created a water pipe model, a ground detection function for registering and displaying new water pipes, and a UI for selecting water pipes [4].

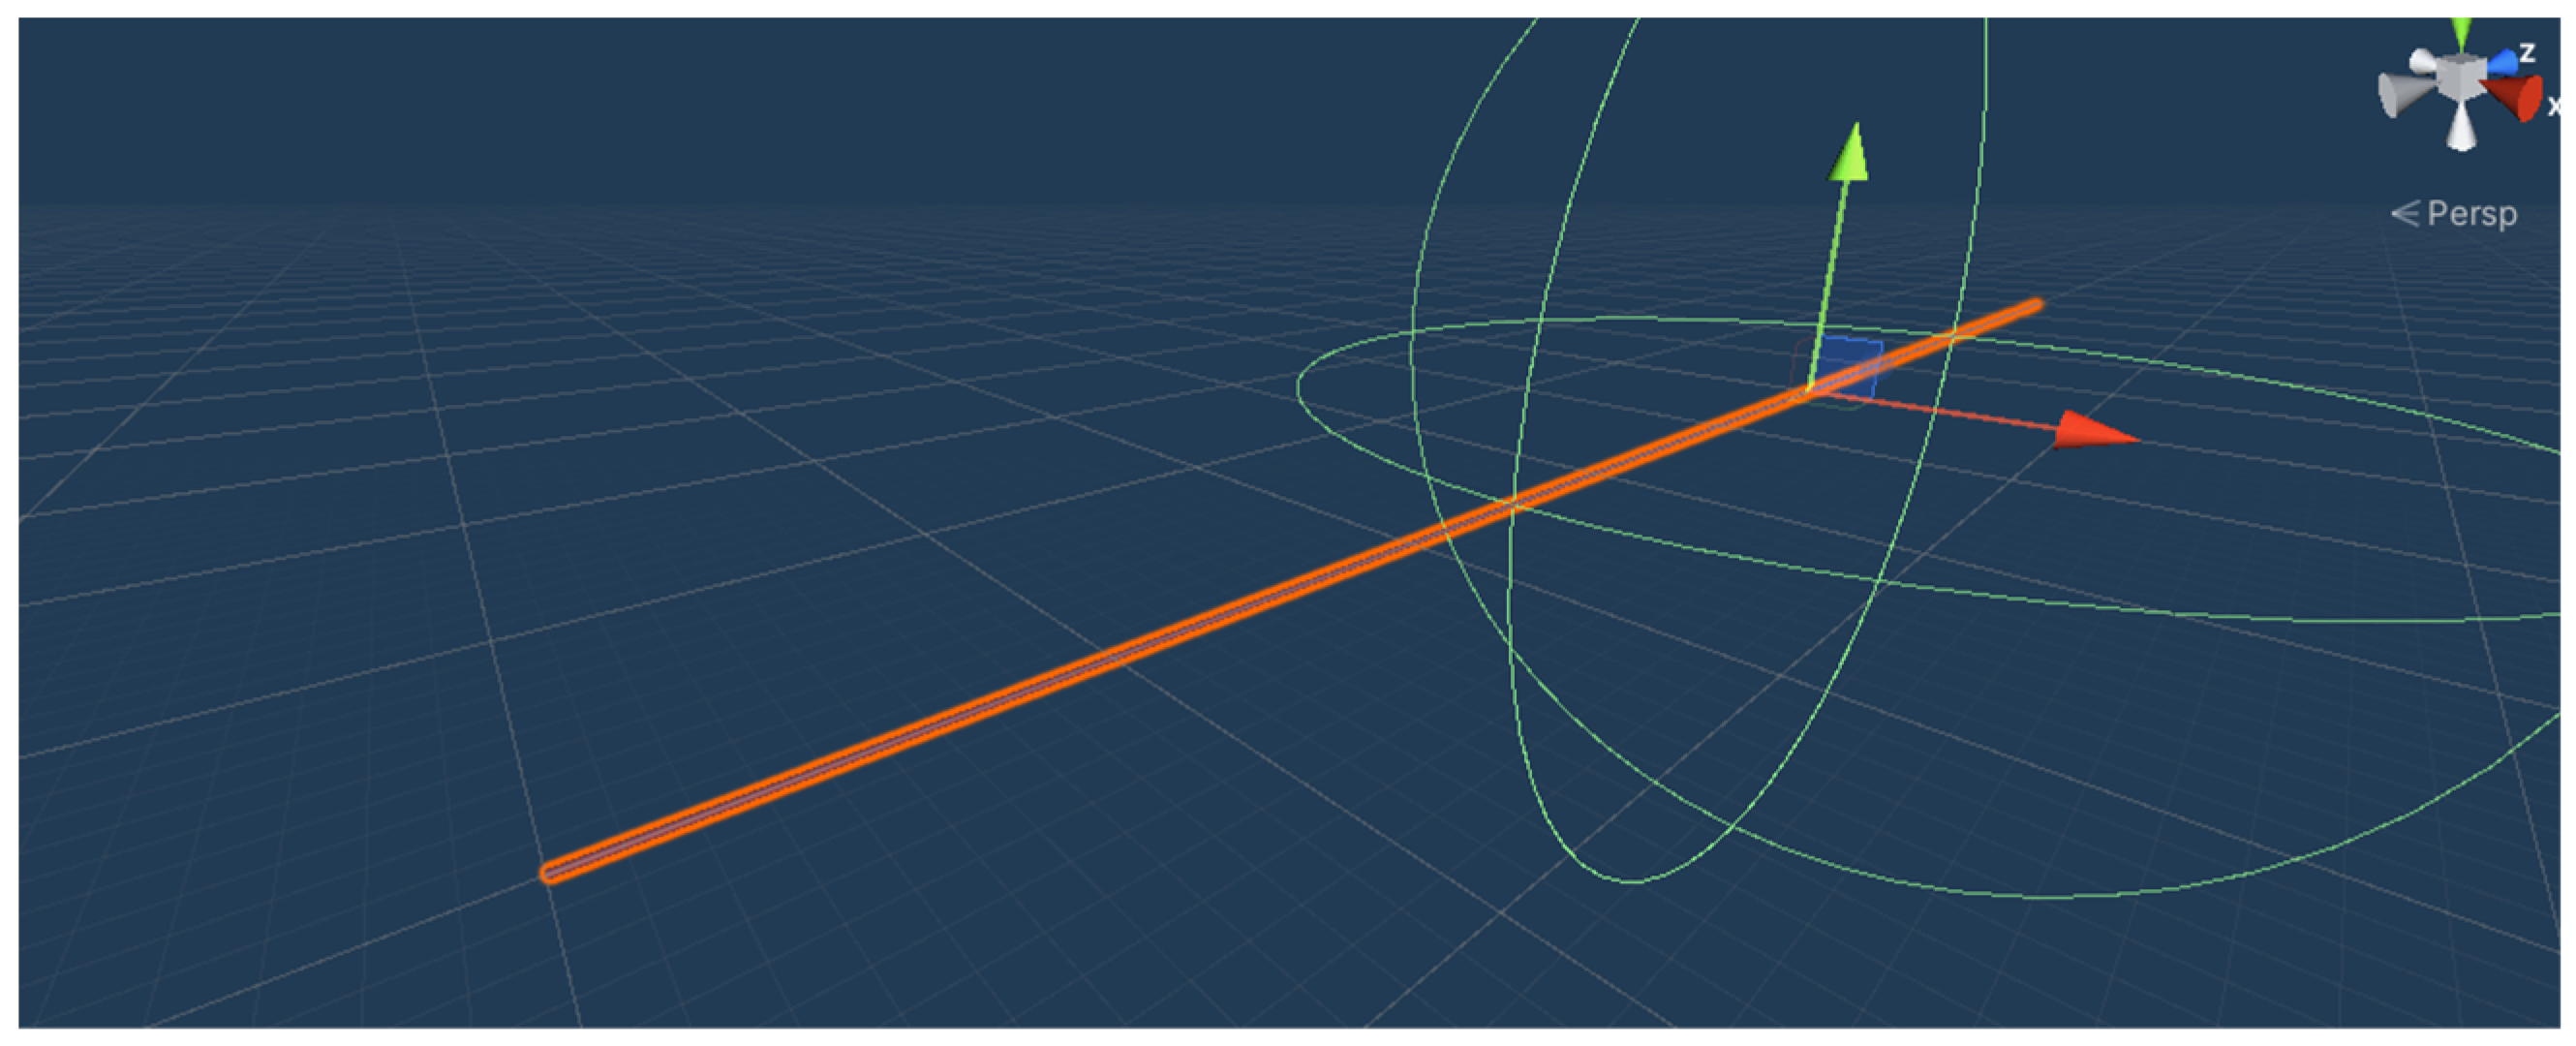
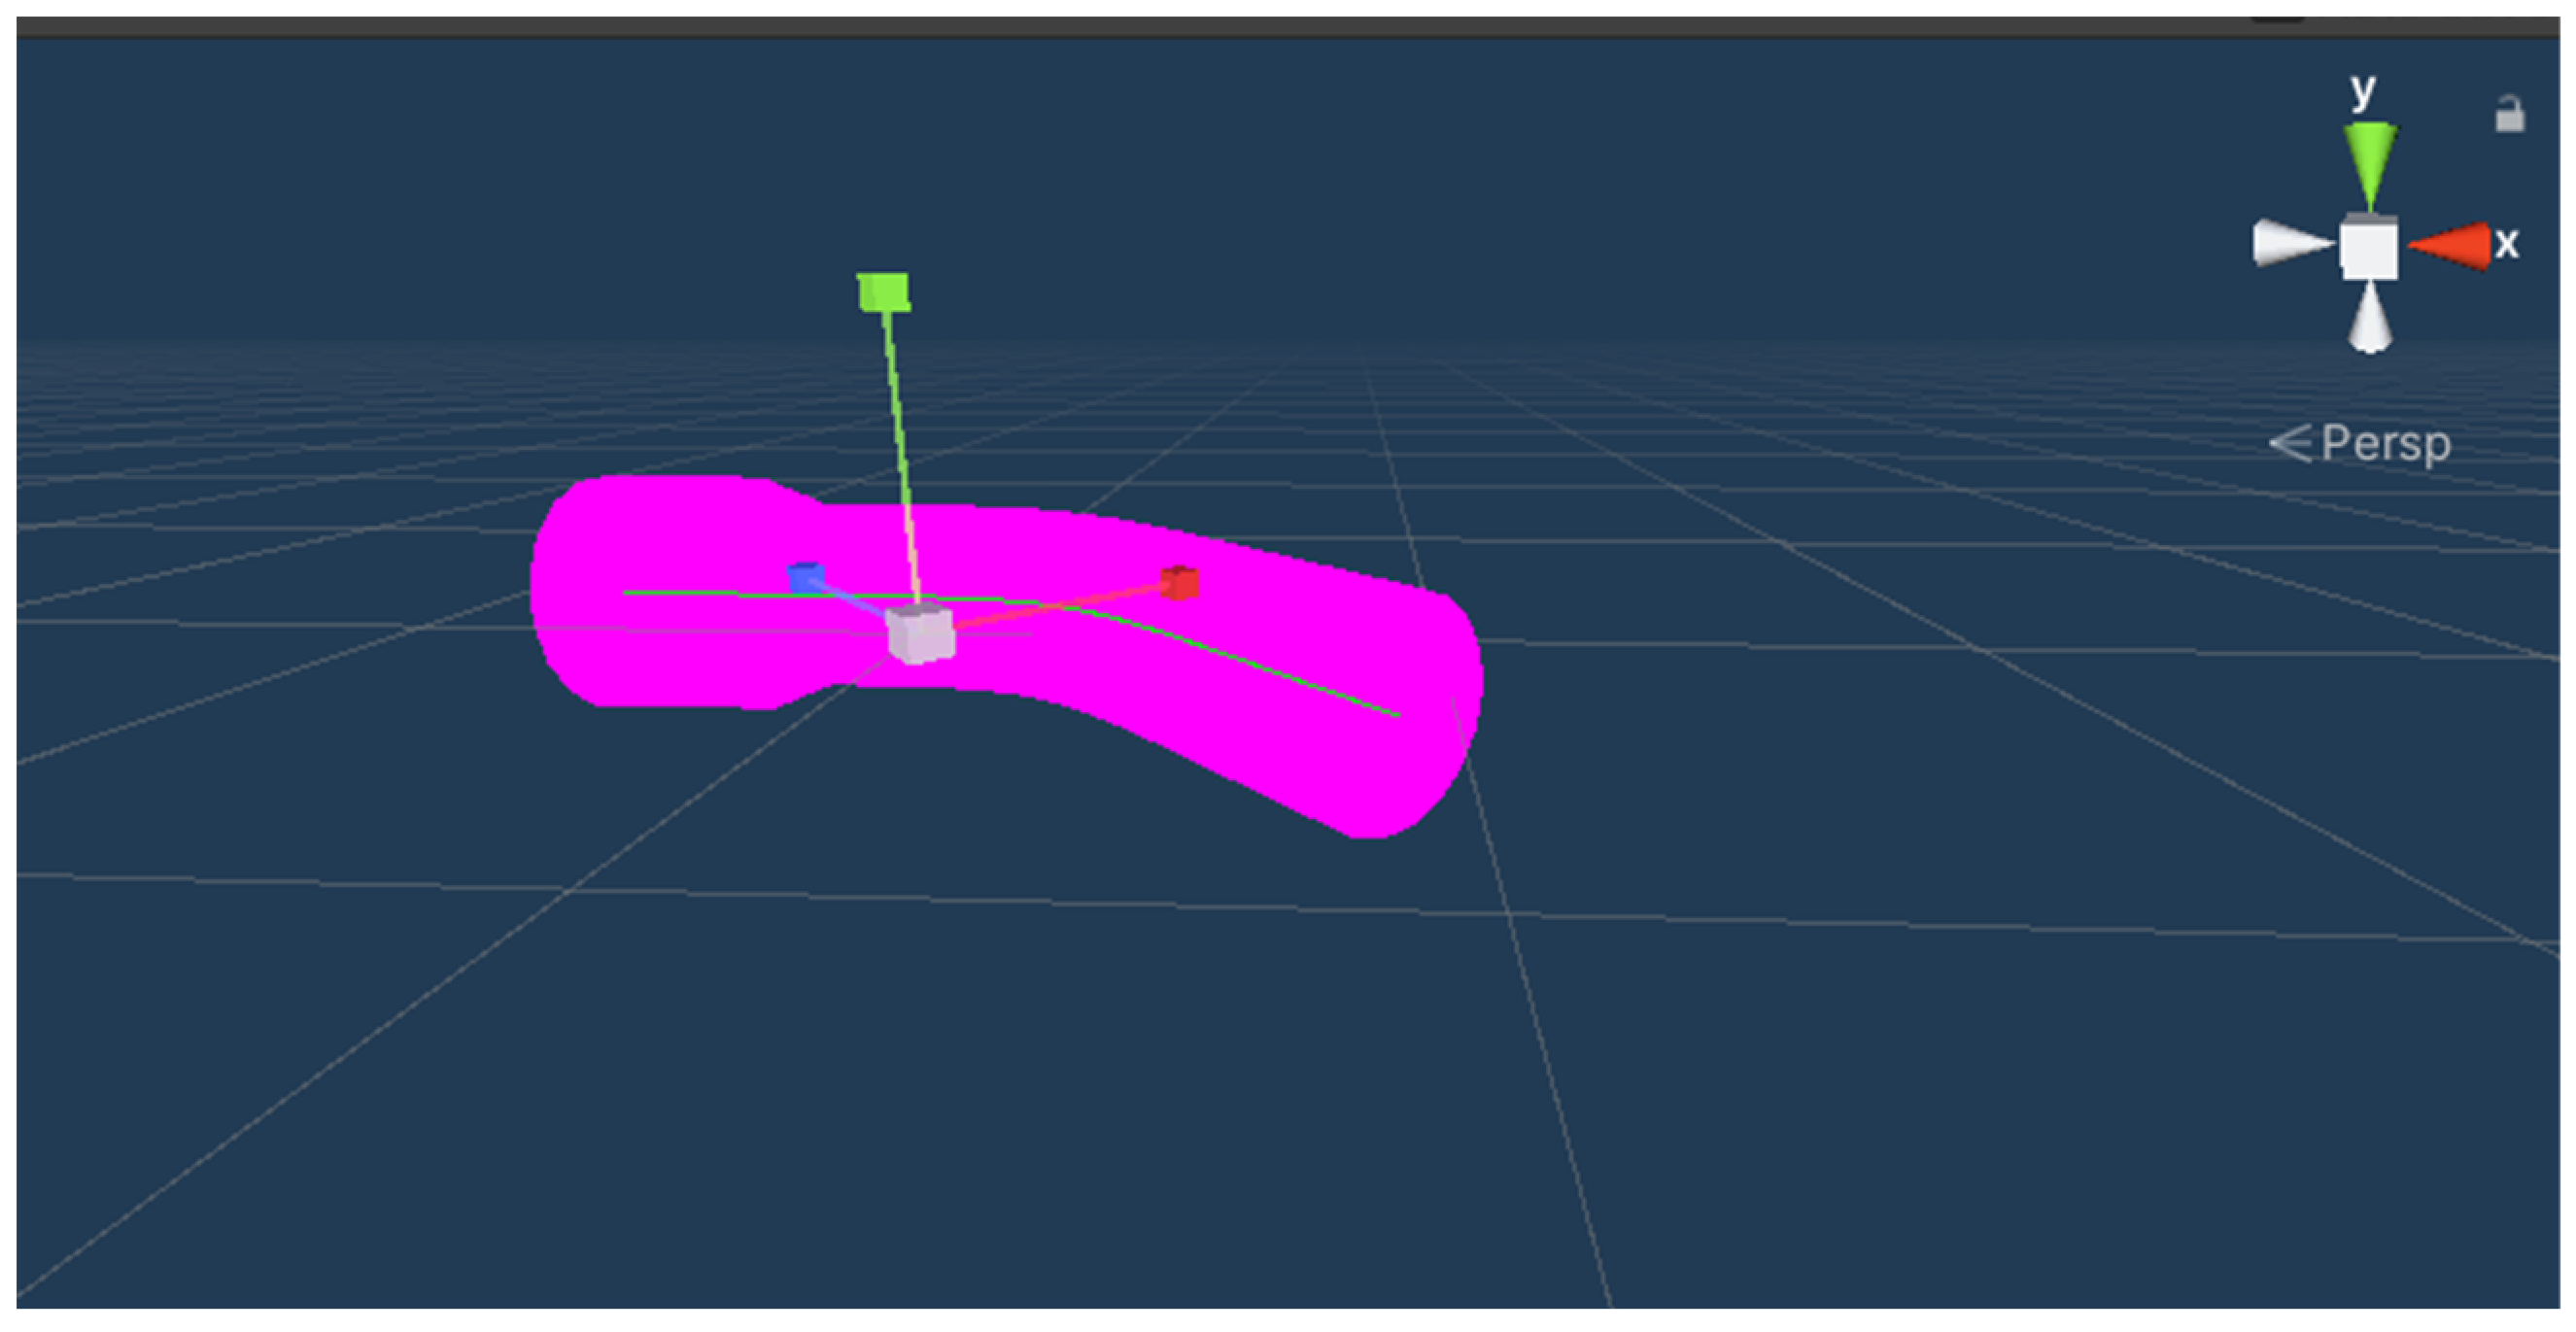
2.2.1. Creation of Water Pipe Model

The water pipe models used in this system are 3D objects created using Metamesh, a package that allows the creation of simple 3D models in Unity, and Probuilder, a package that allows more detailed editing than Metamesh. The 3D objects created with Metamesh used in this system were created from Cylinder, a cylindrical 3D model in Metamesh, in order to simply show a water pipe. The height and thickness of the Cylinder used to create the water pipe model are specified according to the required water pipe, the color is changed, and the object is set as the object to be manipulated. Figure 5 and Figure 6 show a 3D model of a water pipe model created with Metamesh. Three-dimensional models of water pipes created with Probuilder can now include curved pipes, such as those shown in Figure 7, which could not be created with Metamesh. By associating appropriate information with the created water pipe model, information corresponding to the selected water pipe model can be displayed on the application screen. Figure 8 shows the result of importing a curved pipe created with Probuilder into the development environment Unity [5,6]

2.2.2. Plane Detection Function

ARCore’s plane detection function is used to virtually set up a plane for displaying and registering a new water pipe model. To use the plane detection function, the ARCore SDK for Unity must be installed in the Unity project. In this case, we used “arcore-unity-sdk-v*. *. *.unitypackage” from GitHub and imported the files in the package into the Unity project. The XR Legacy Input Helpers was installed from the package manager since the Unity version is 2019.1 or later. The plane detection function was added to the application using Plane Generator, an asset of ARCore. After completing the plane detection, a screen similar to that shown in Figure 9 is displayed on the smartphone [7,8].

2.2.3. Application UI Creation

This system can register and display multiple types of water pipes by setting a button area in the Canvas to display multiple types of water pipes and by installing multiple water pipe models. By touching the screen in the area where the plane detection is performed, the water pipe model to be registered is displayed horizontally in relation to the ground, and a new water pipe can be registered by placing the water pipe model in the location where it is to be registered. Figure 10 shows the created UI. Figure 11 shows the water pipe with the changed material placed after pressing the Change Button.

2.3. Acquisition and Display of Current Coordinates and Orientation

This system uses Google Maps and latitude and longitude obtained from GPS to display location information. To use Google Maps, it is necessary to use Google API, which requires location information obtained from the GPS function of a smartphone.

2.3.1. Google API Settings

To use Google API, create a project, activate the API, and create an API key. To use Google Maps in this system, it is necessary to activate the Maps Static API in the created project. After creating an API key, select “Restrict Key” from the API creation modal to use only the Maps Static API required to display Google Maps, or select “Restrict Key” from “Restrict and Rename API Key” after selecting the API key that you created from the authentication information page, select “Maps Static API” from “Restrict and Rename API Key”, and save it [9].

2.3.2. Display of Google Map Corresponding to Your Current Location

This system obtains the latitude and longitude information necessary for using Google Maps from the smartphone’s GPS information. To add latitude and longitude information to the screen, text is added to the Canvas and displayed by placing it on the Canvas. To display a Google Map, the latitude and longitude obtained from GPS are given to the Google Maps Static API, and the resulting PNG-format image is placed in the Canvas. The latitude, longitude, and Google Map are placed as shown in Figure 12.

2.4. Input and Conversion of Water Pipe Information

Currently, most water pipe information is managed digitally as GIS data, but there exist cases where only the administrator has such information for small water systems that are not managed by a municipality or other entity. In the case of digital data, water pipe location and conduit information are read from GIS SHP files and converted to CSV files. We also attempted to convert analog data to digital data in order to accommodate small-scale waterworks.

2.4.1. GIS (Geographic Information System)

A geographic information system (GIS) is a system for creating, managing, analyzing, and mapping data of all kinds; it connects data to maps and integrates location data (where things are) with all kinds of descriptive information (what things are like there). This provides the basis for mapping and analysis used in science and almost every industry. It helps users understand patterns, relationships, and geographic context using a GIS improves communication and efficiency, as well as management and decision making.

2.4.2. SHP File

A shapefile is a GIS data format that can store vector data (points, lines, polygons) with position, shape, and attribute information on targets such as hospitals, roads, and buildings. A shapefile consists of several files. If any one of these files is missing, the GIS application cannot recognize it as a shapefile. Each of the files that make up a shapefile has a size limit of 2 GB. Field names are limited to 5 characters for Japanese, which are 2-byte characters, and 10 characters for alphanumeric characters. If the file size exceeds 2 GB, or if you wish to use more advanced editing functions, we recommend using a geodatabase, one of the standard data formats in Esri’s ArcGIS, which is suitable for data management.

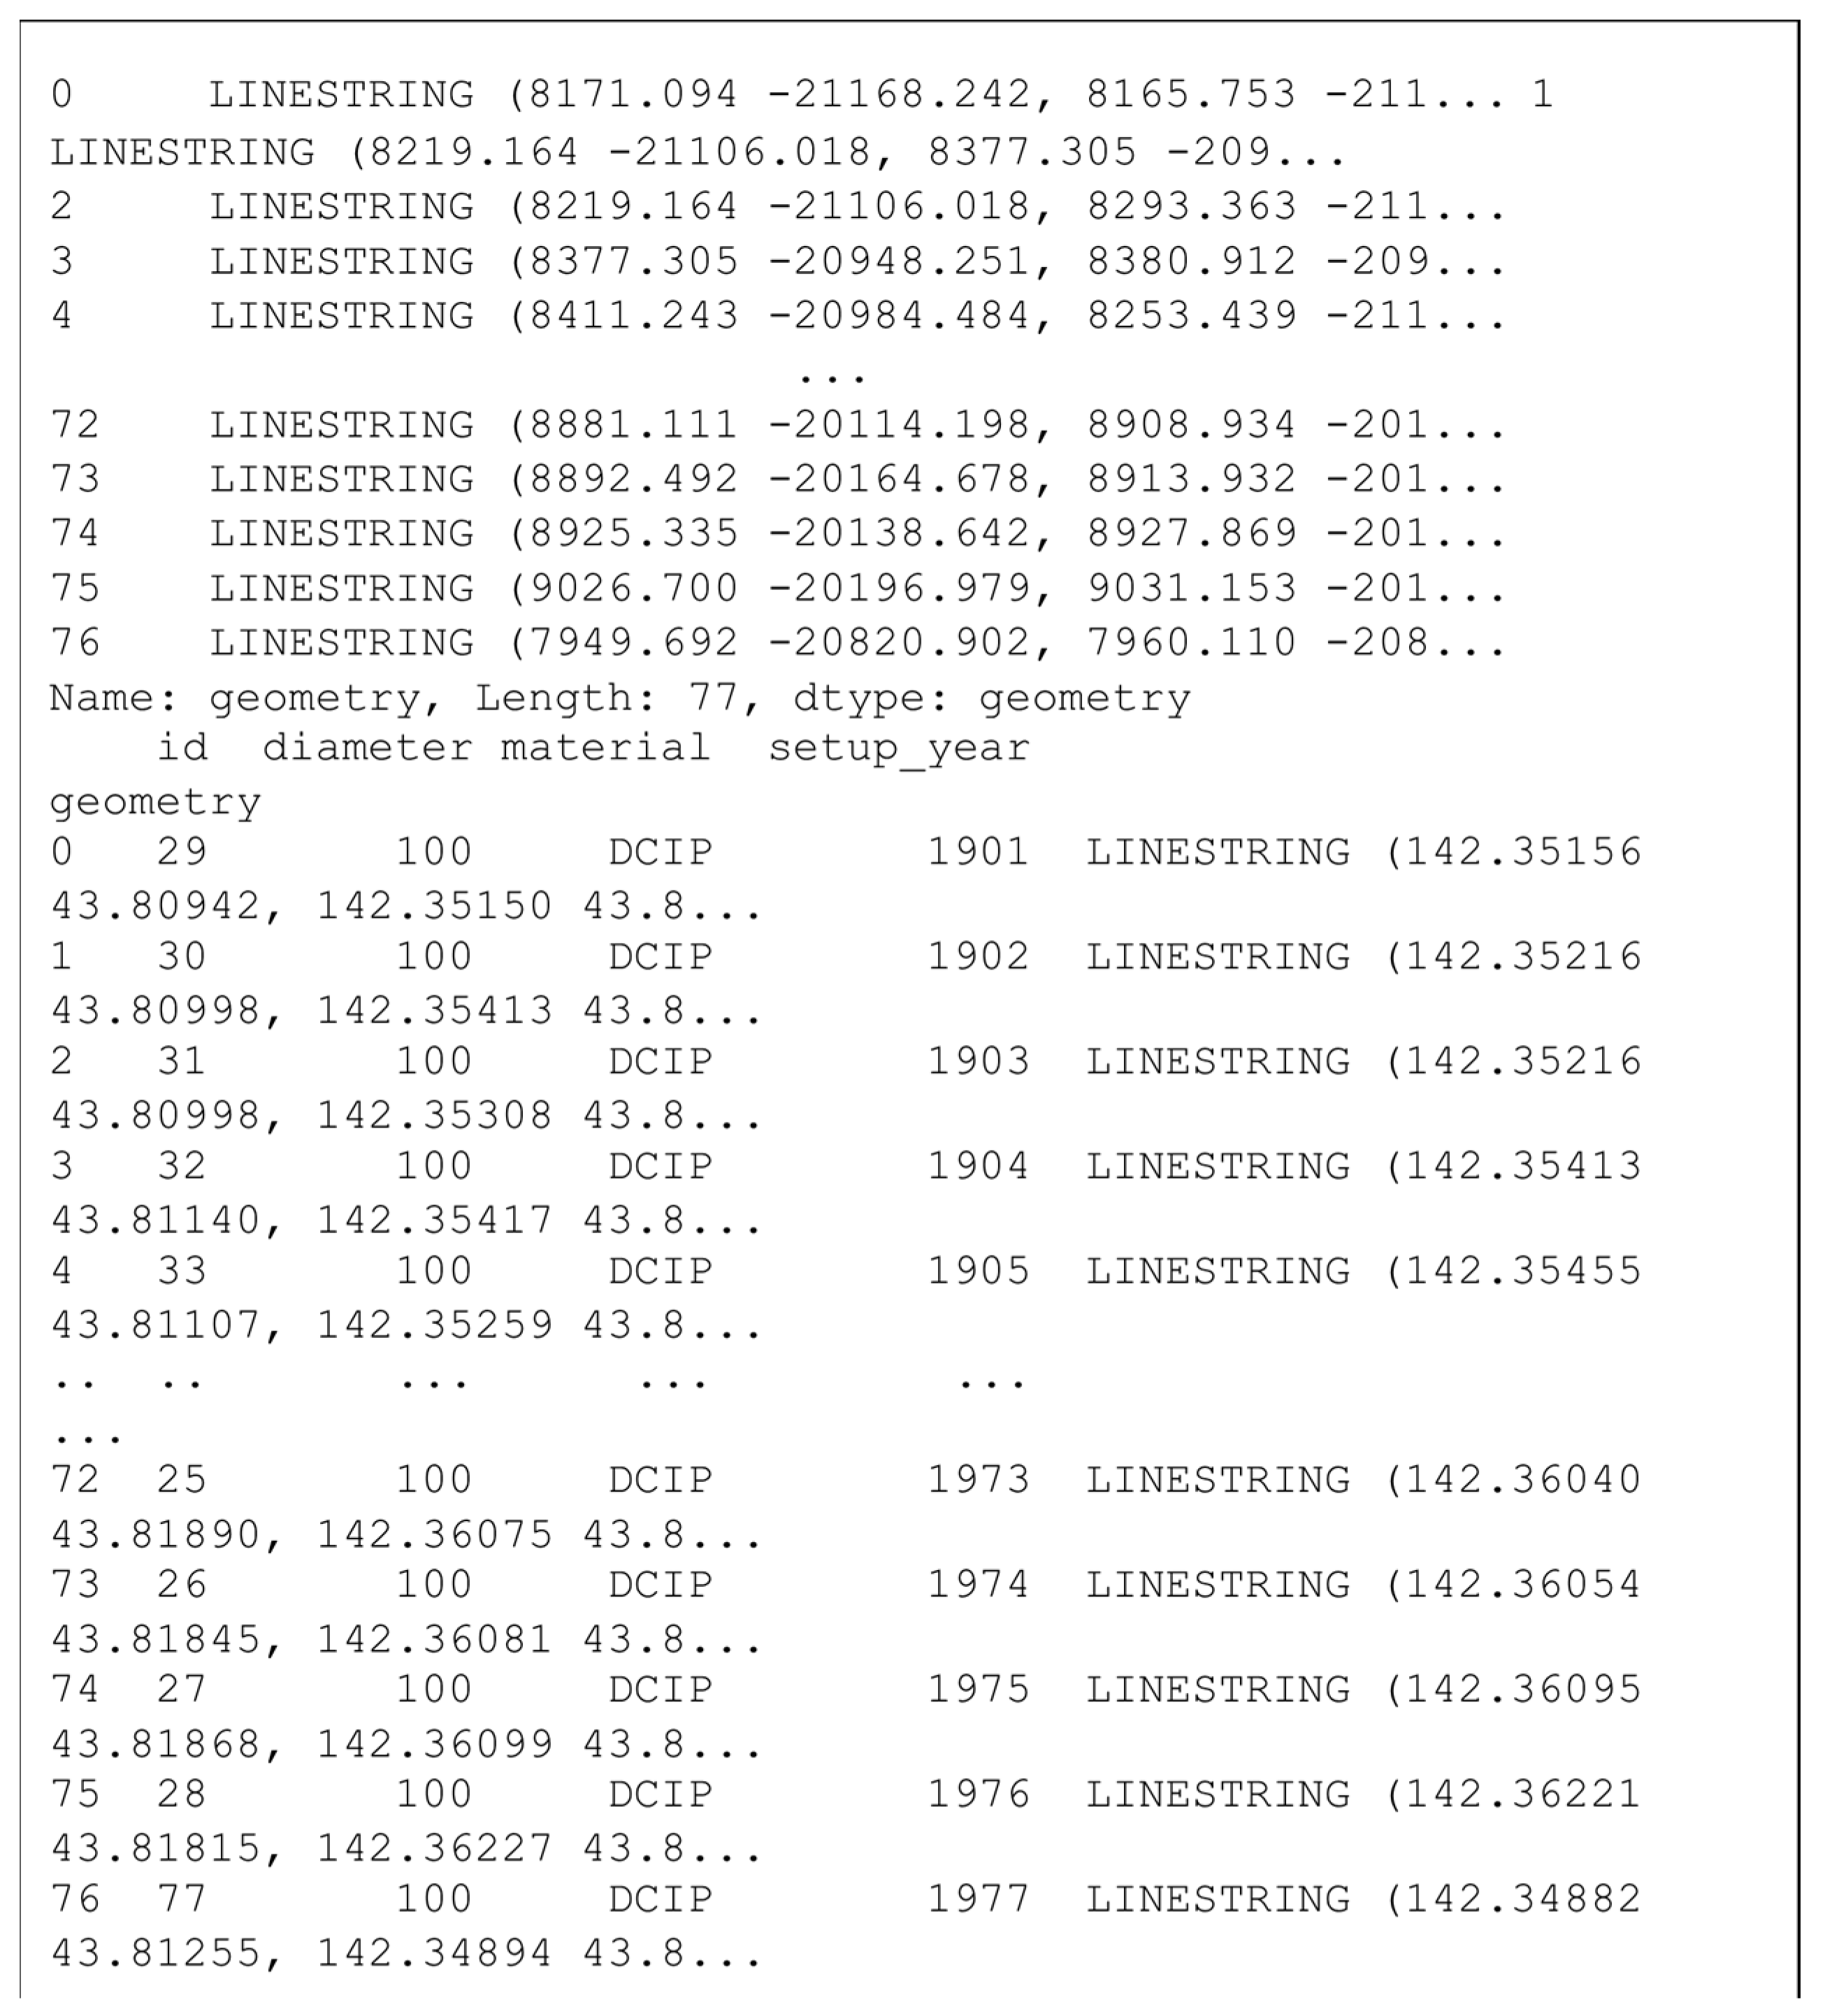
2.4.3. Reading Location Information from GIS Data

The programming language used to read the location information was Python. The GeoPandas library was used to read the SHP files containing the locations of the water pipes, and the pandas and CSV libraries were used to edit the location information of the water pipes and output it to an Excel file. The program reads the latitude and longitude of the water pipes and the Kan information on the type of water pipes, which are necessary for this system, and converts them to CSV files.

2.4.4. Conversion from Paper Drawings to Digital Data

The function of converting water pipe location information from analog maps to digital location information is necessary to collect, visualize, and digitally manage information on locally managed water pipes that are outside the jurisdiction of the government, such as simple dedicated water pipes and small water pipes for small-scale water systems. In particular, when collecting water main location information from local administrators, the system collects water main location information by directly writing the location of installed water pipes on a map so that even system users unfamiliar with digital technology can use the system. The system converts the location information into variable digital data by importing the map with the collected water pipe location information into the system.
The map shown In Figure 13 was captured by a camera or scanner and converted to digital data using image processing. To calculate the latitude and longitude from the map, two points are plotted on the map that can be used to identify the location information. A program was created to measure the hand-drawn red line shown in Figure 14 and the two reference points from the map. The language used was Python, the OpenCV library was used to import the map images into the program, and the Numpy extension module was used to efficiently perform numerical calculations. The program binarizes the imported image based on grayscale in order to search for conduits and reference points, and it identifies the location of each pixel. The latitude and longitude information of the water pipe is calculated by comparing the position coordinates of the identified pixels with the position coordinates of a previously plotted reference point. The acquired water pipe location information is output to a CSV file along with the type of water pipe, to be input separately from the information to be written on the map. Figure 15 shows the acquired water pipe location information. It stores the latitude, longitude, and direction of the water pipe as location information.

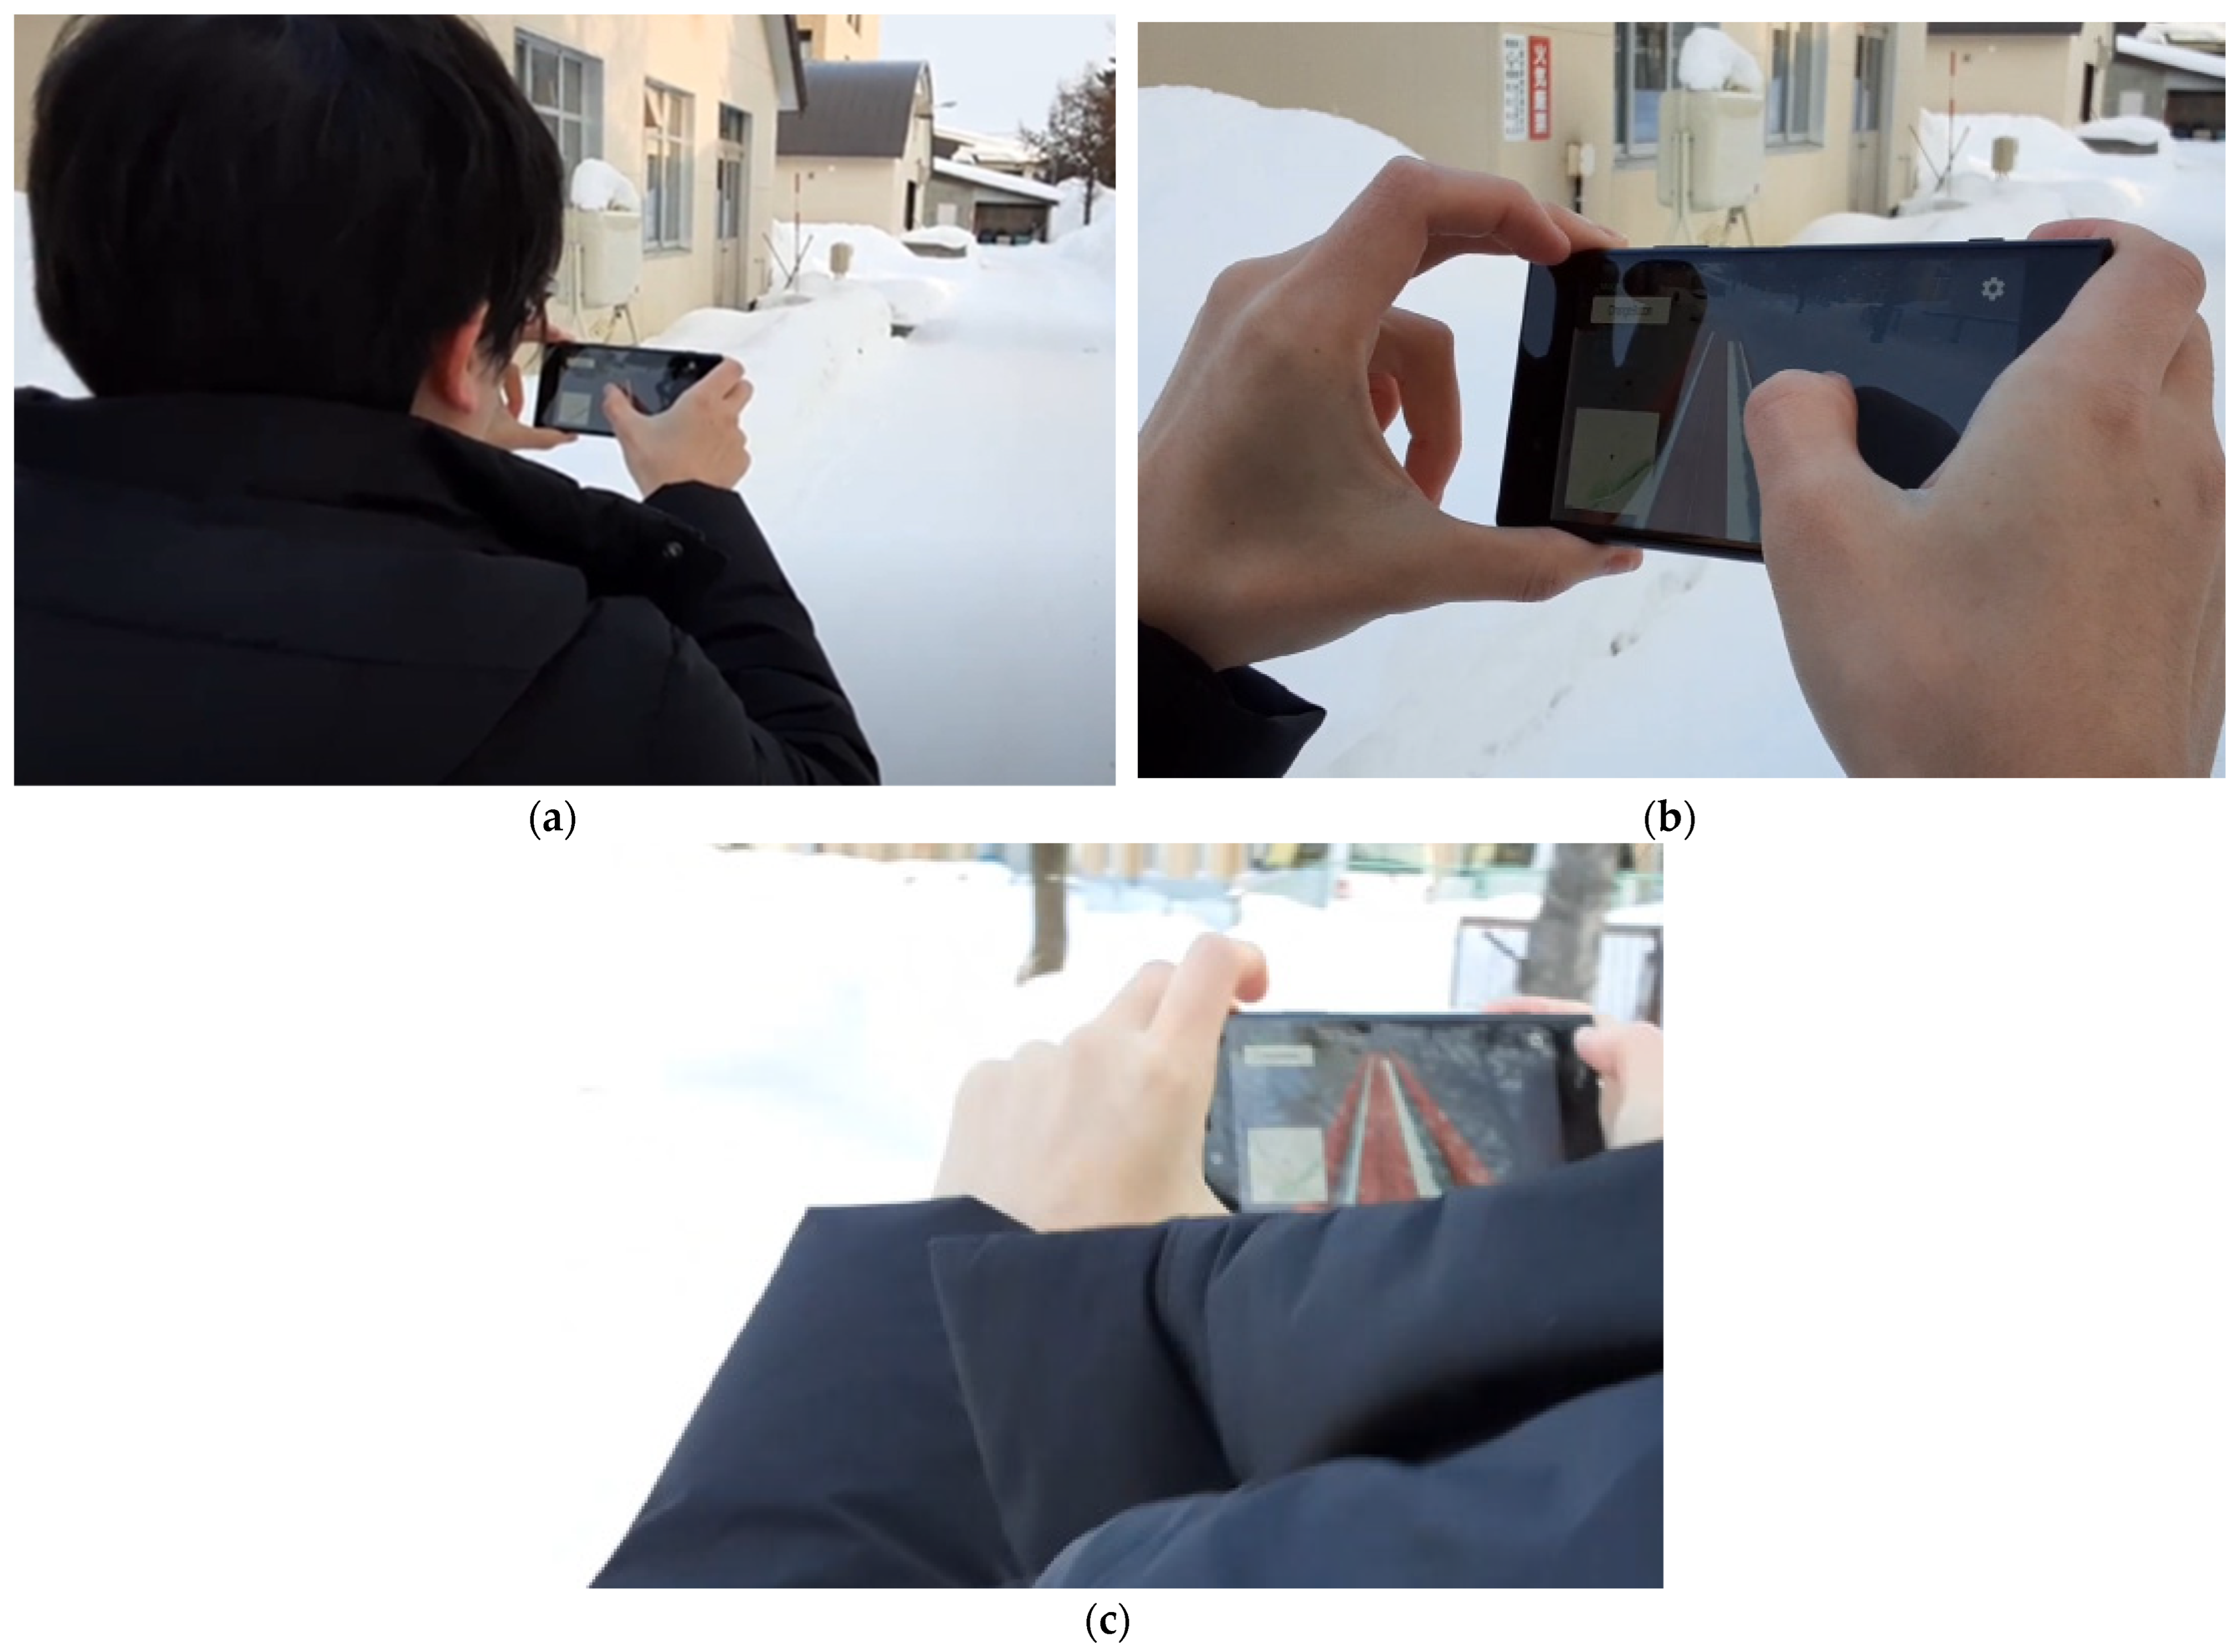
3. System Evaluation

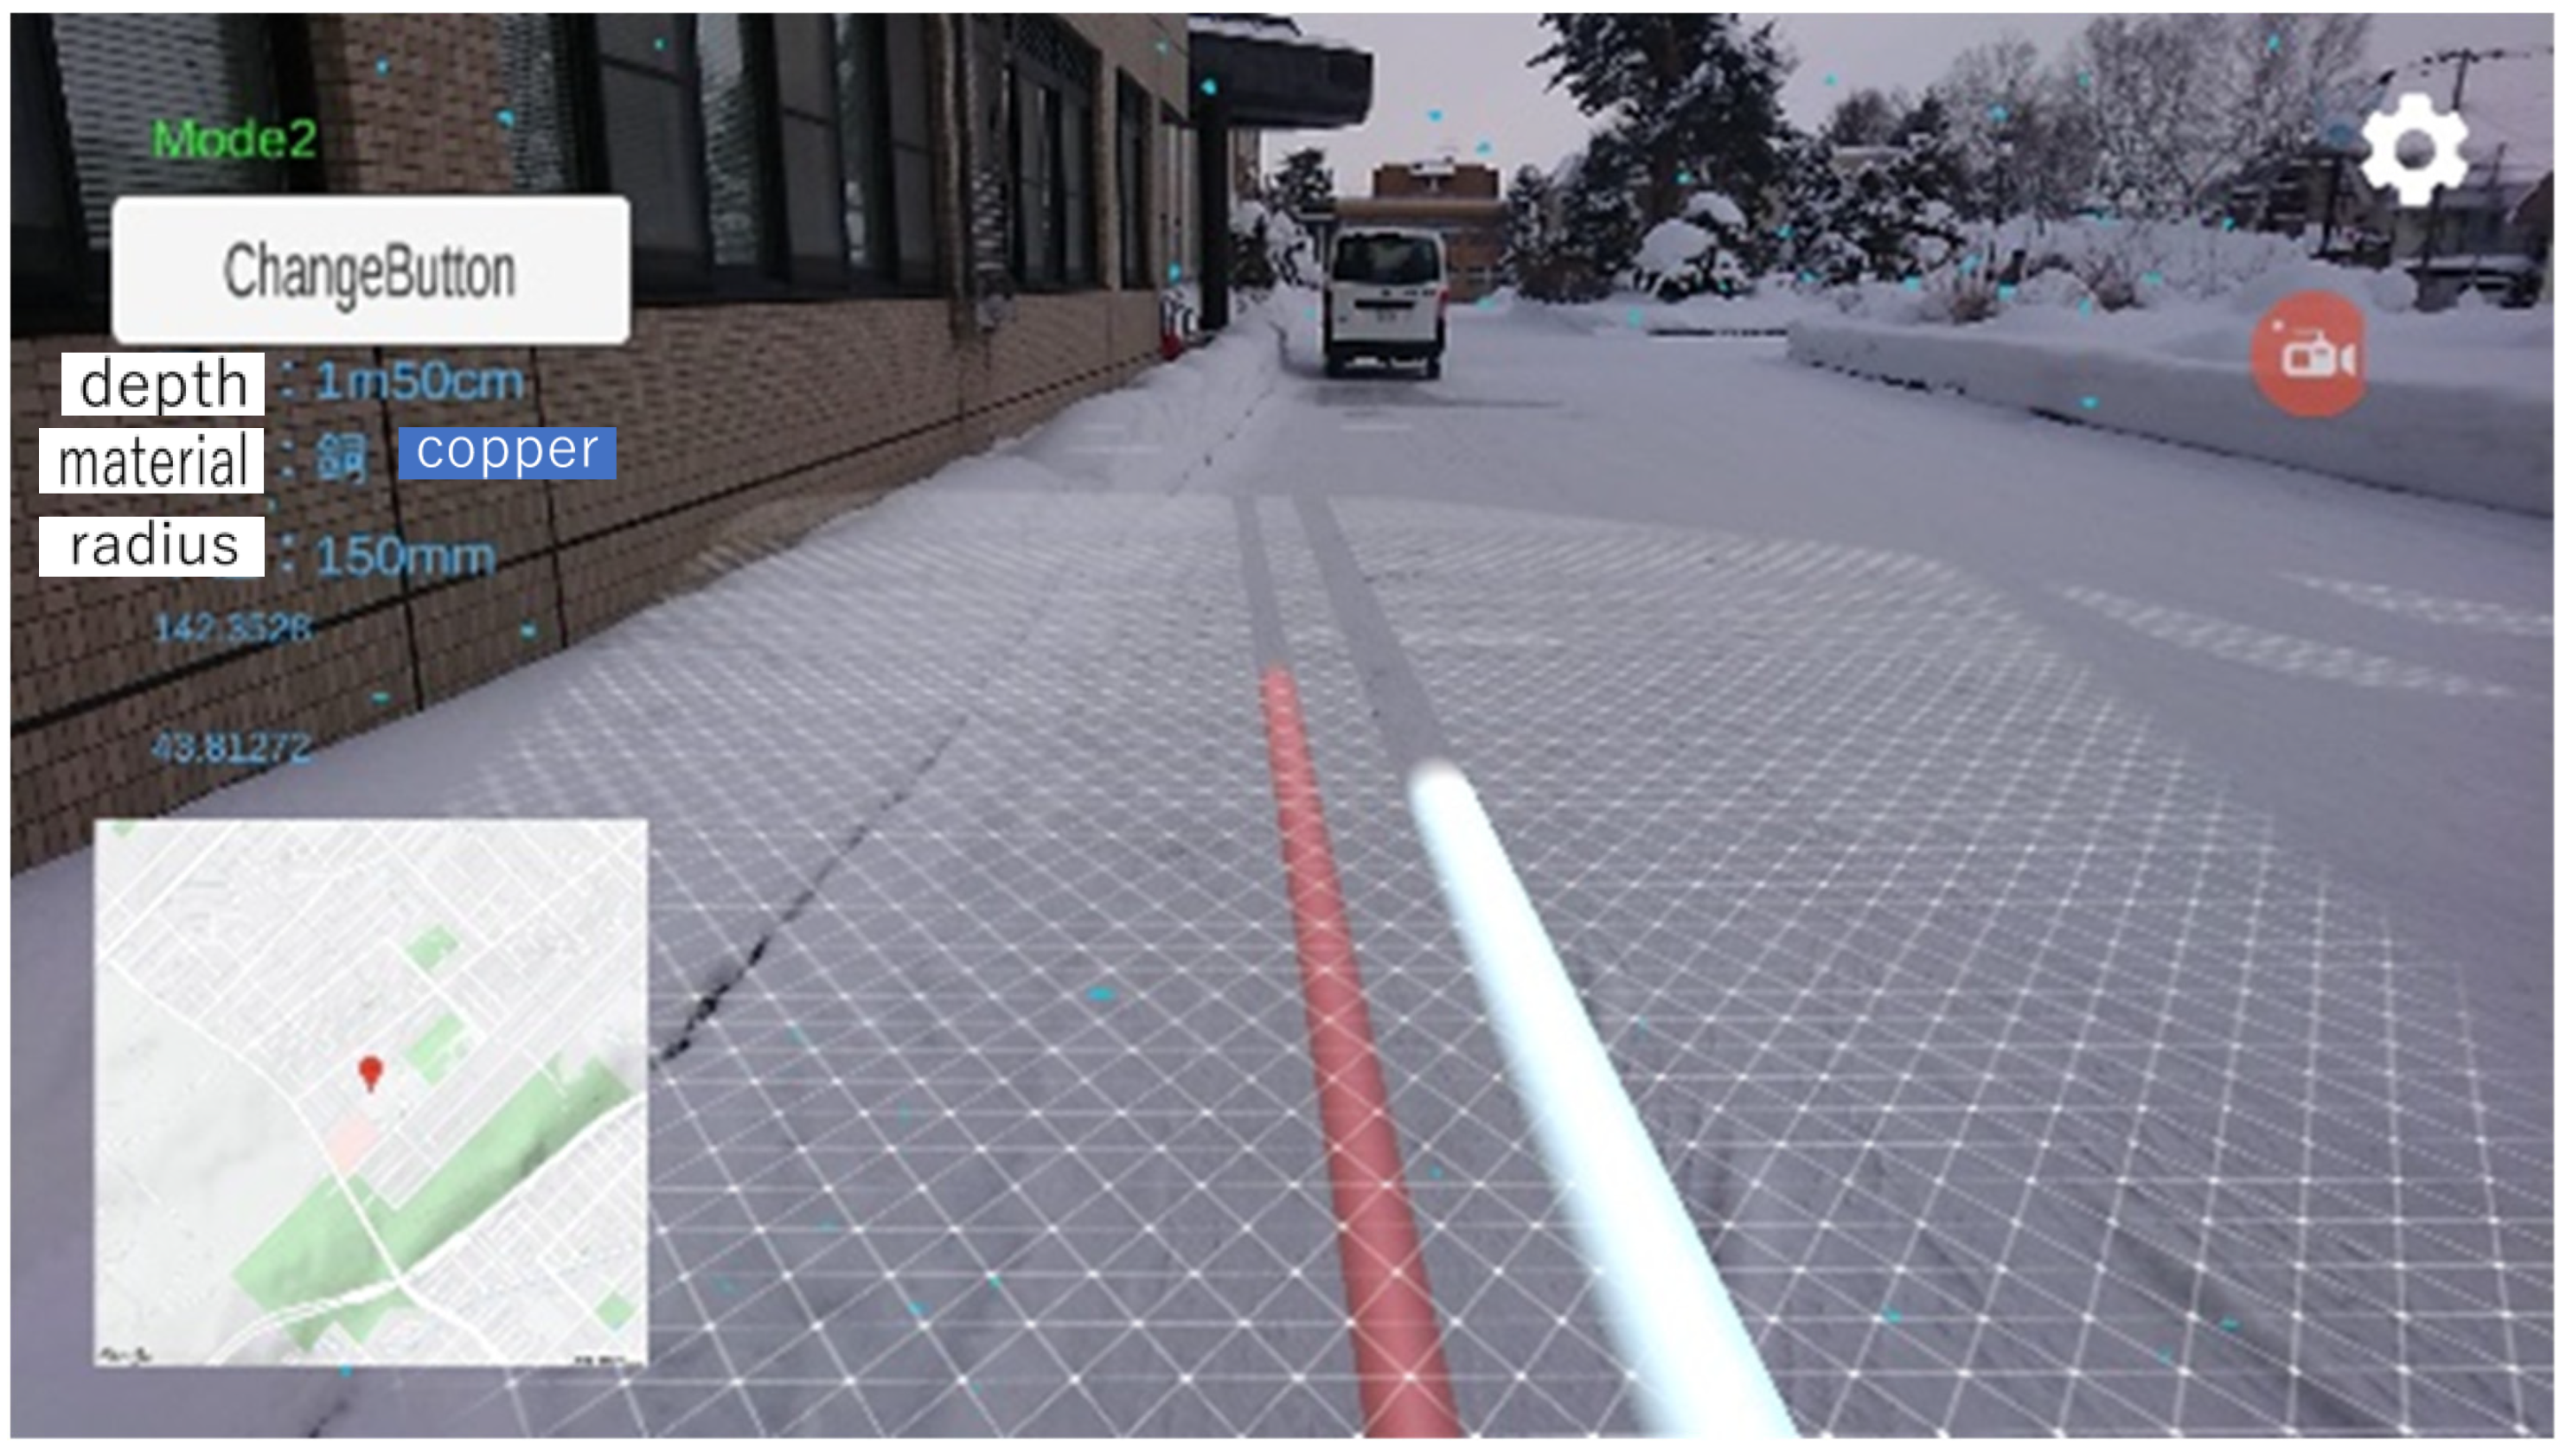
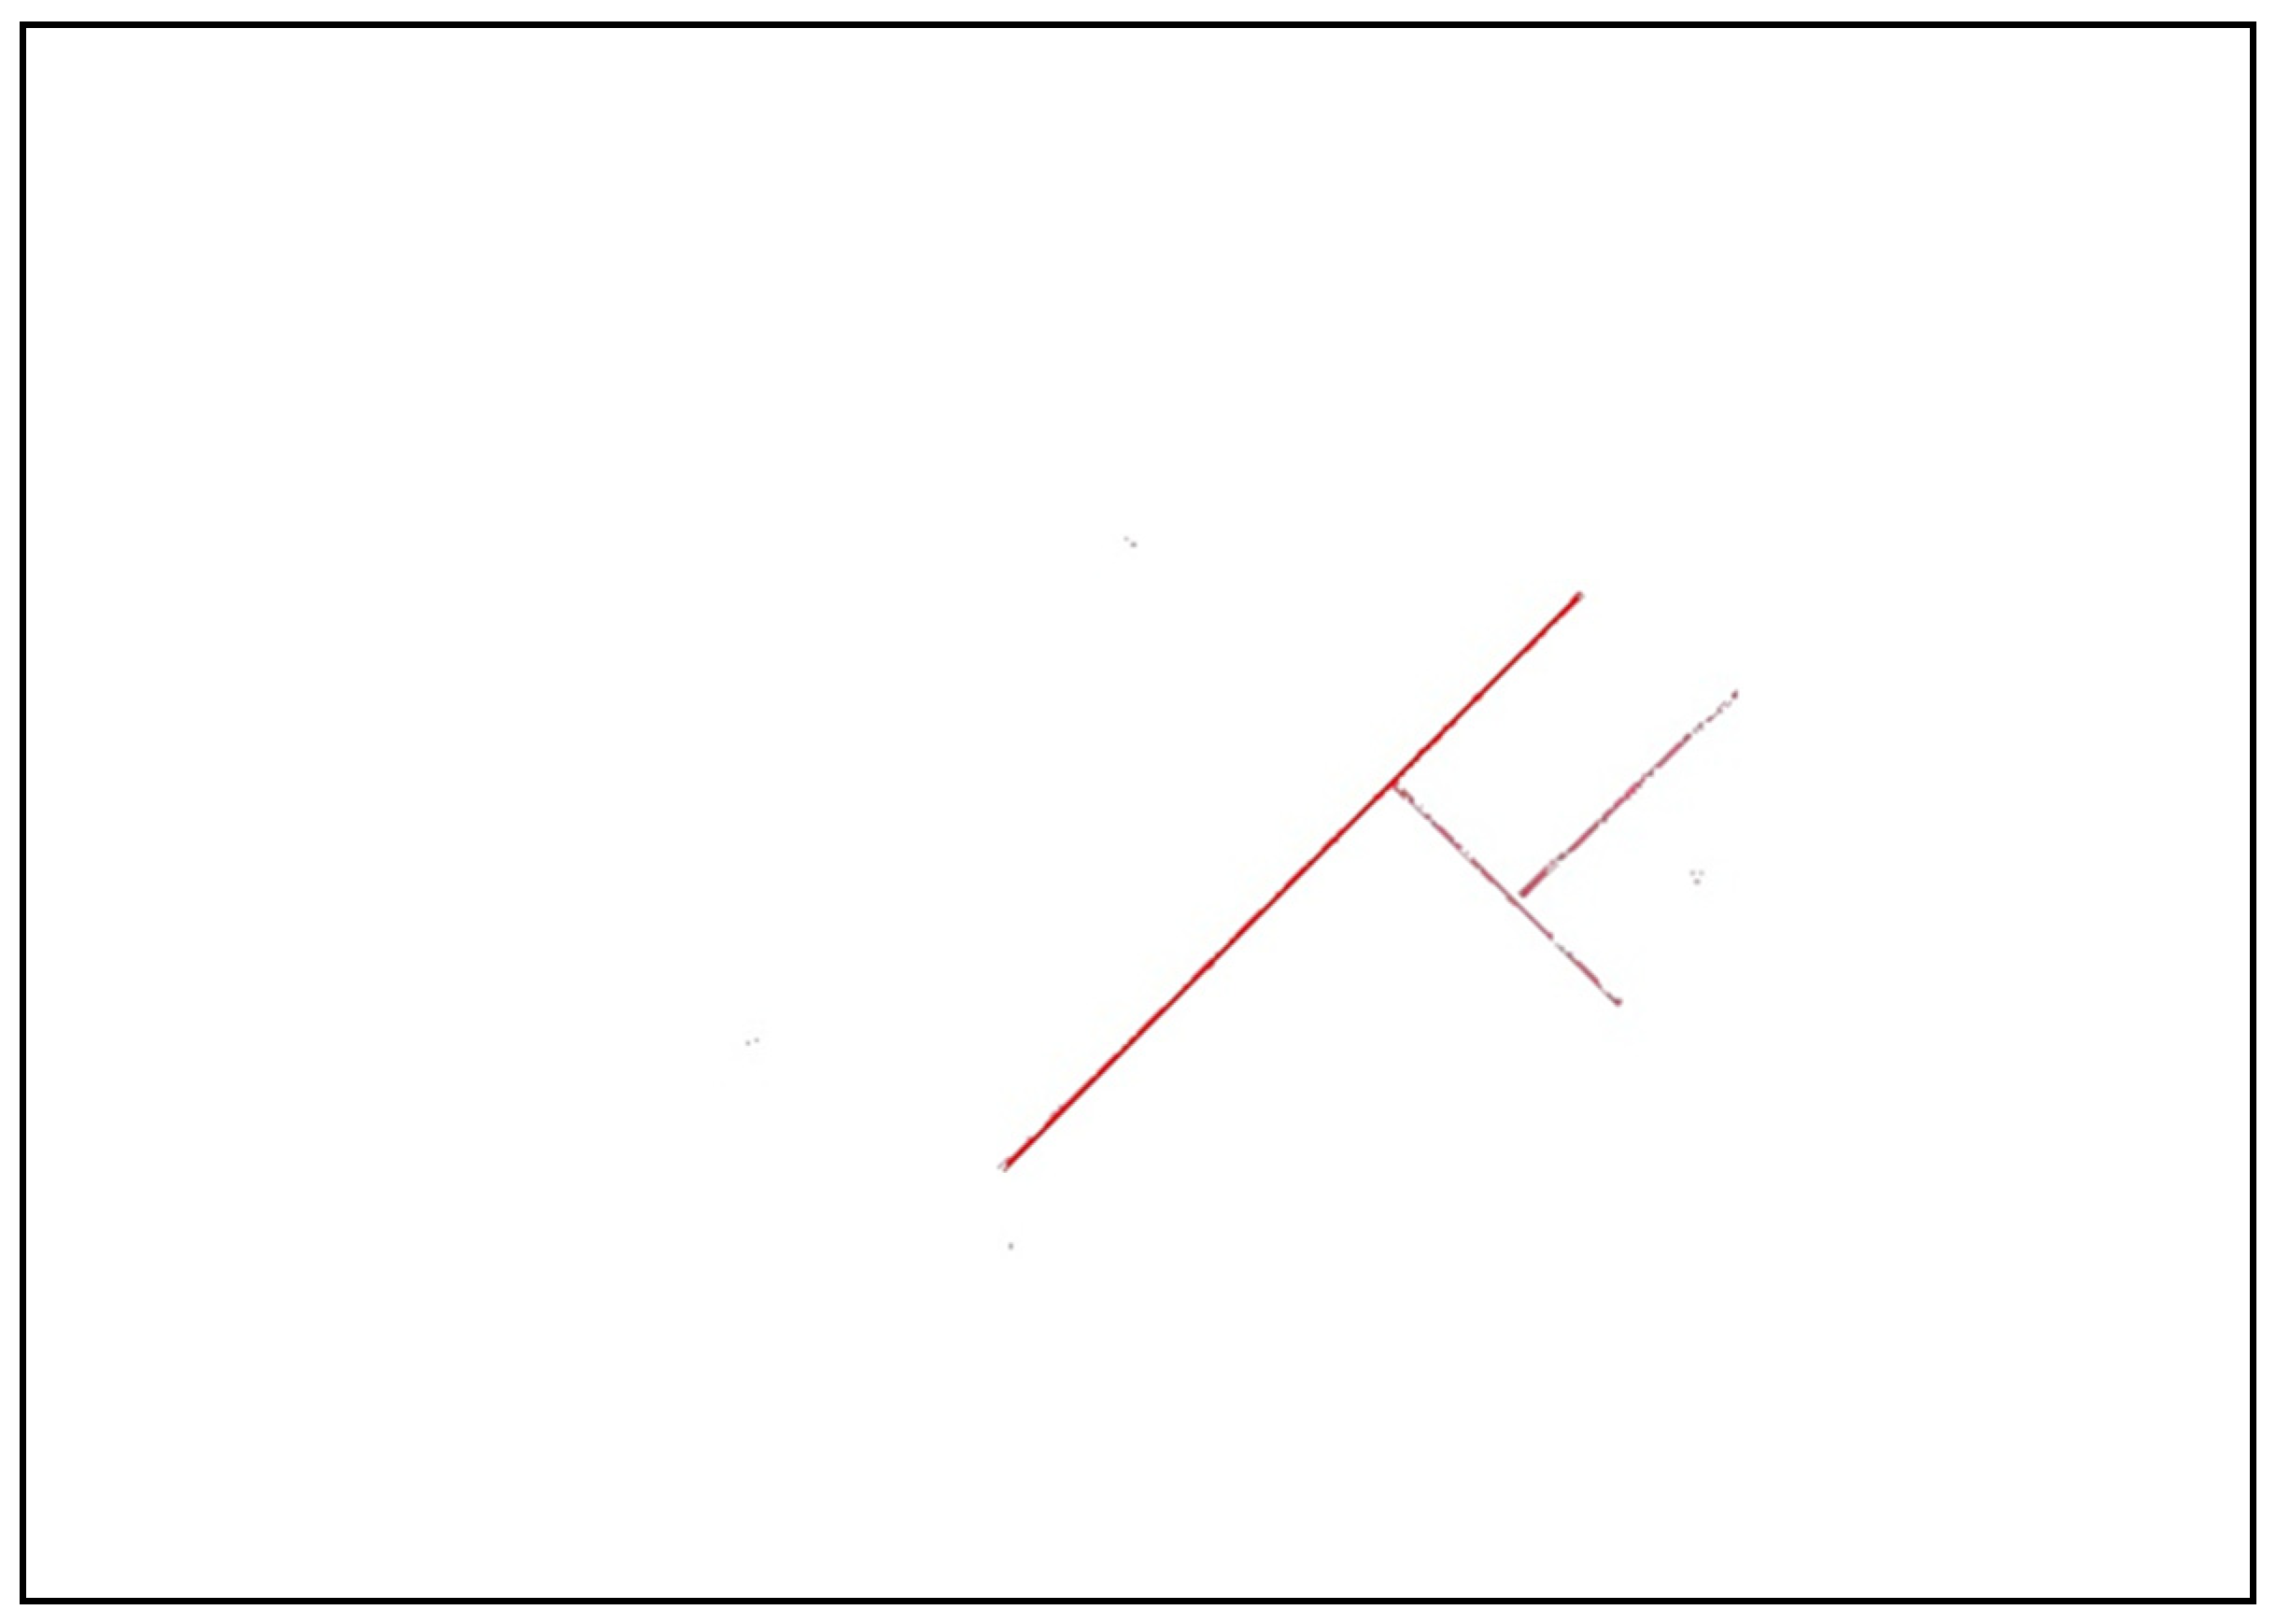
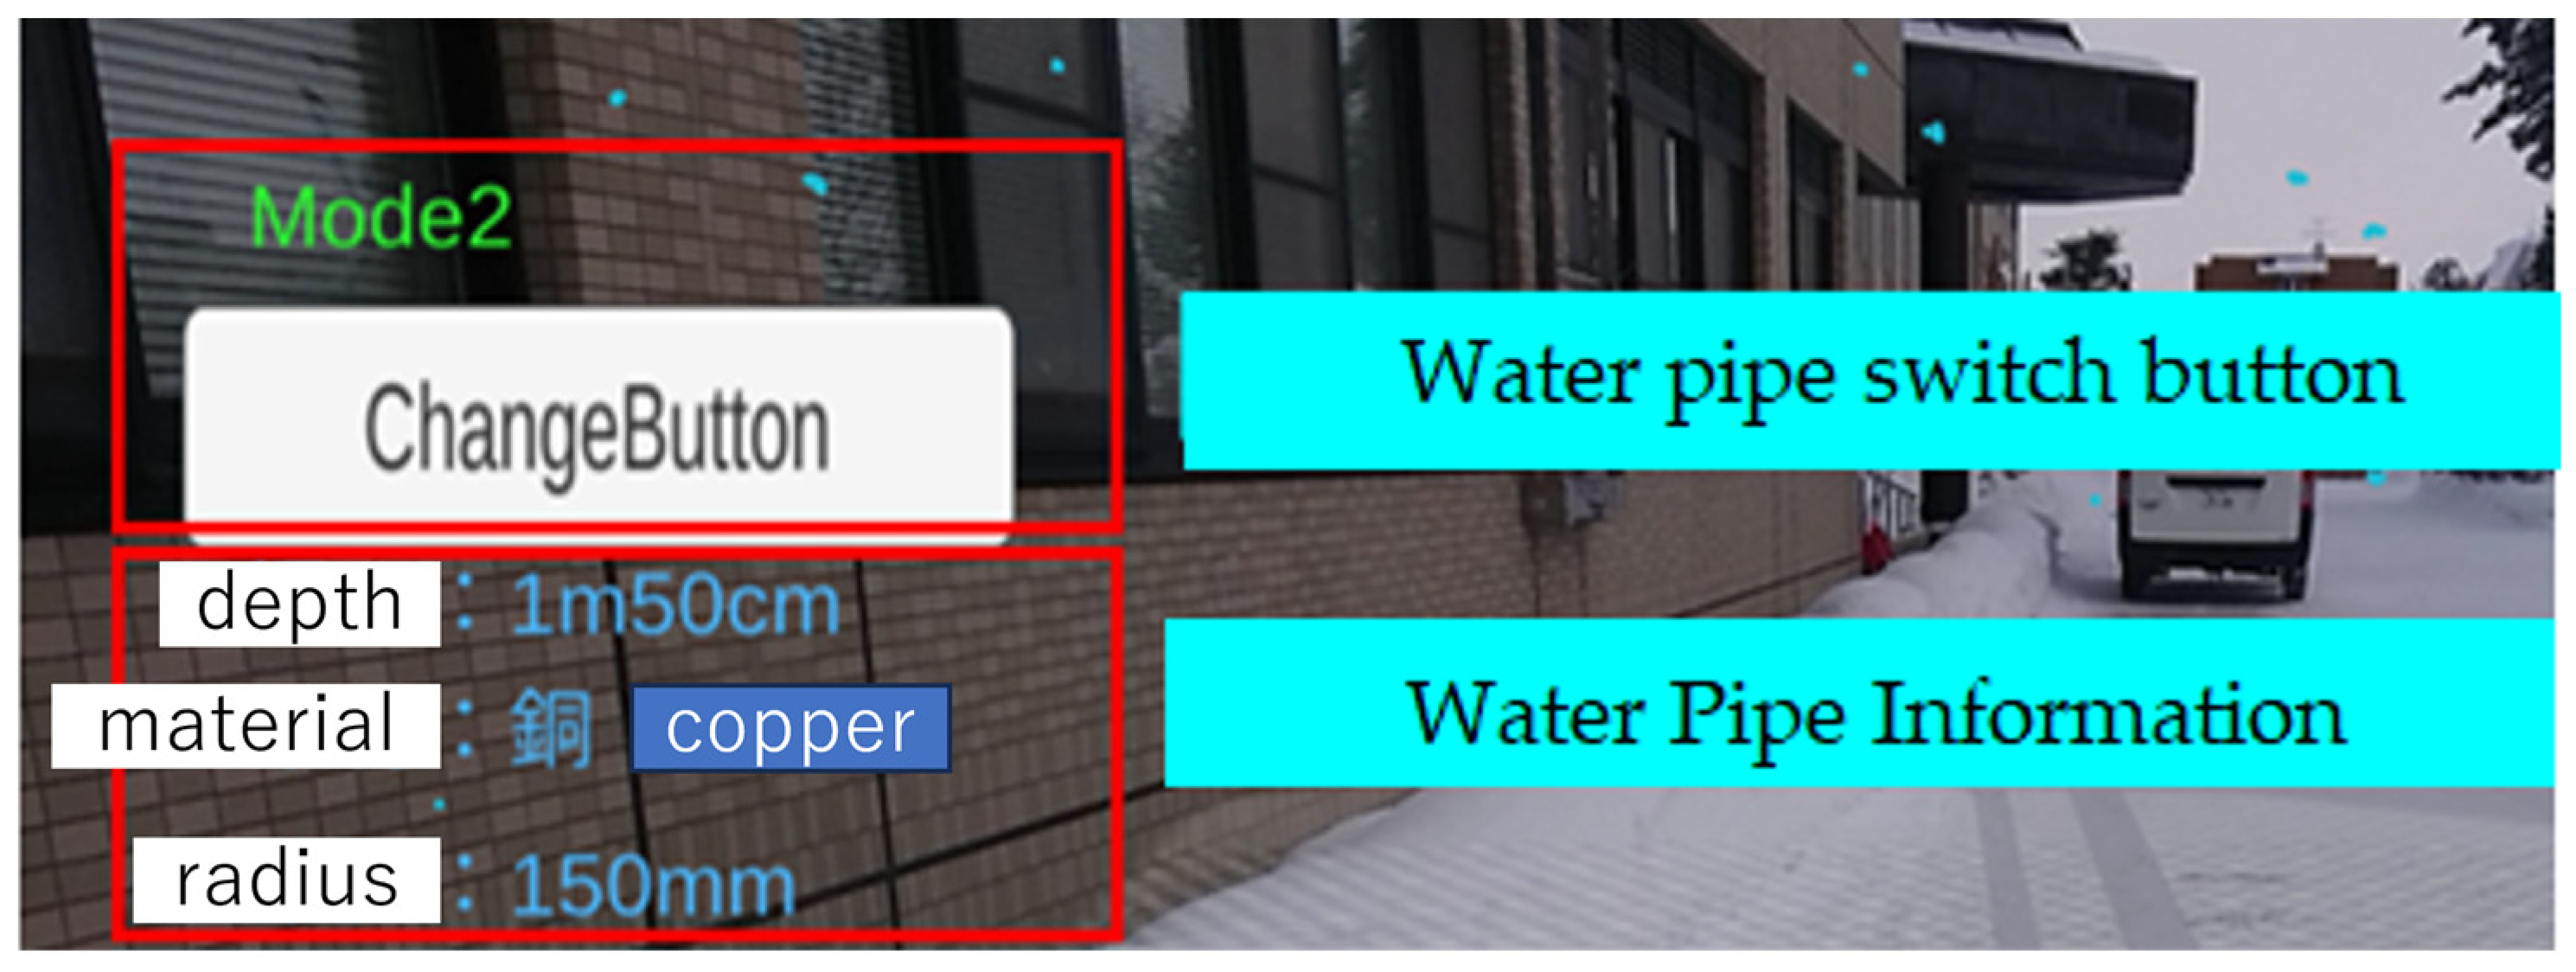
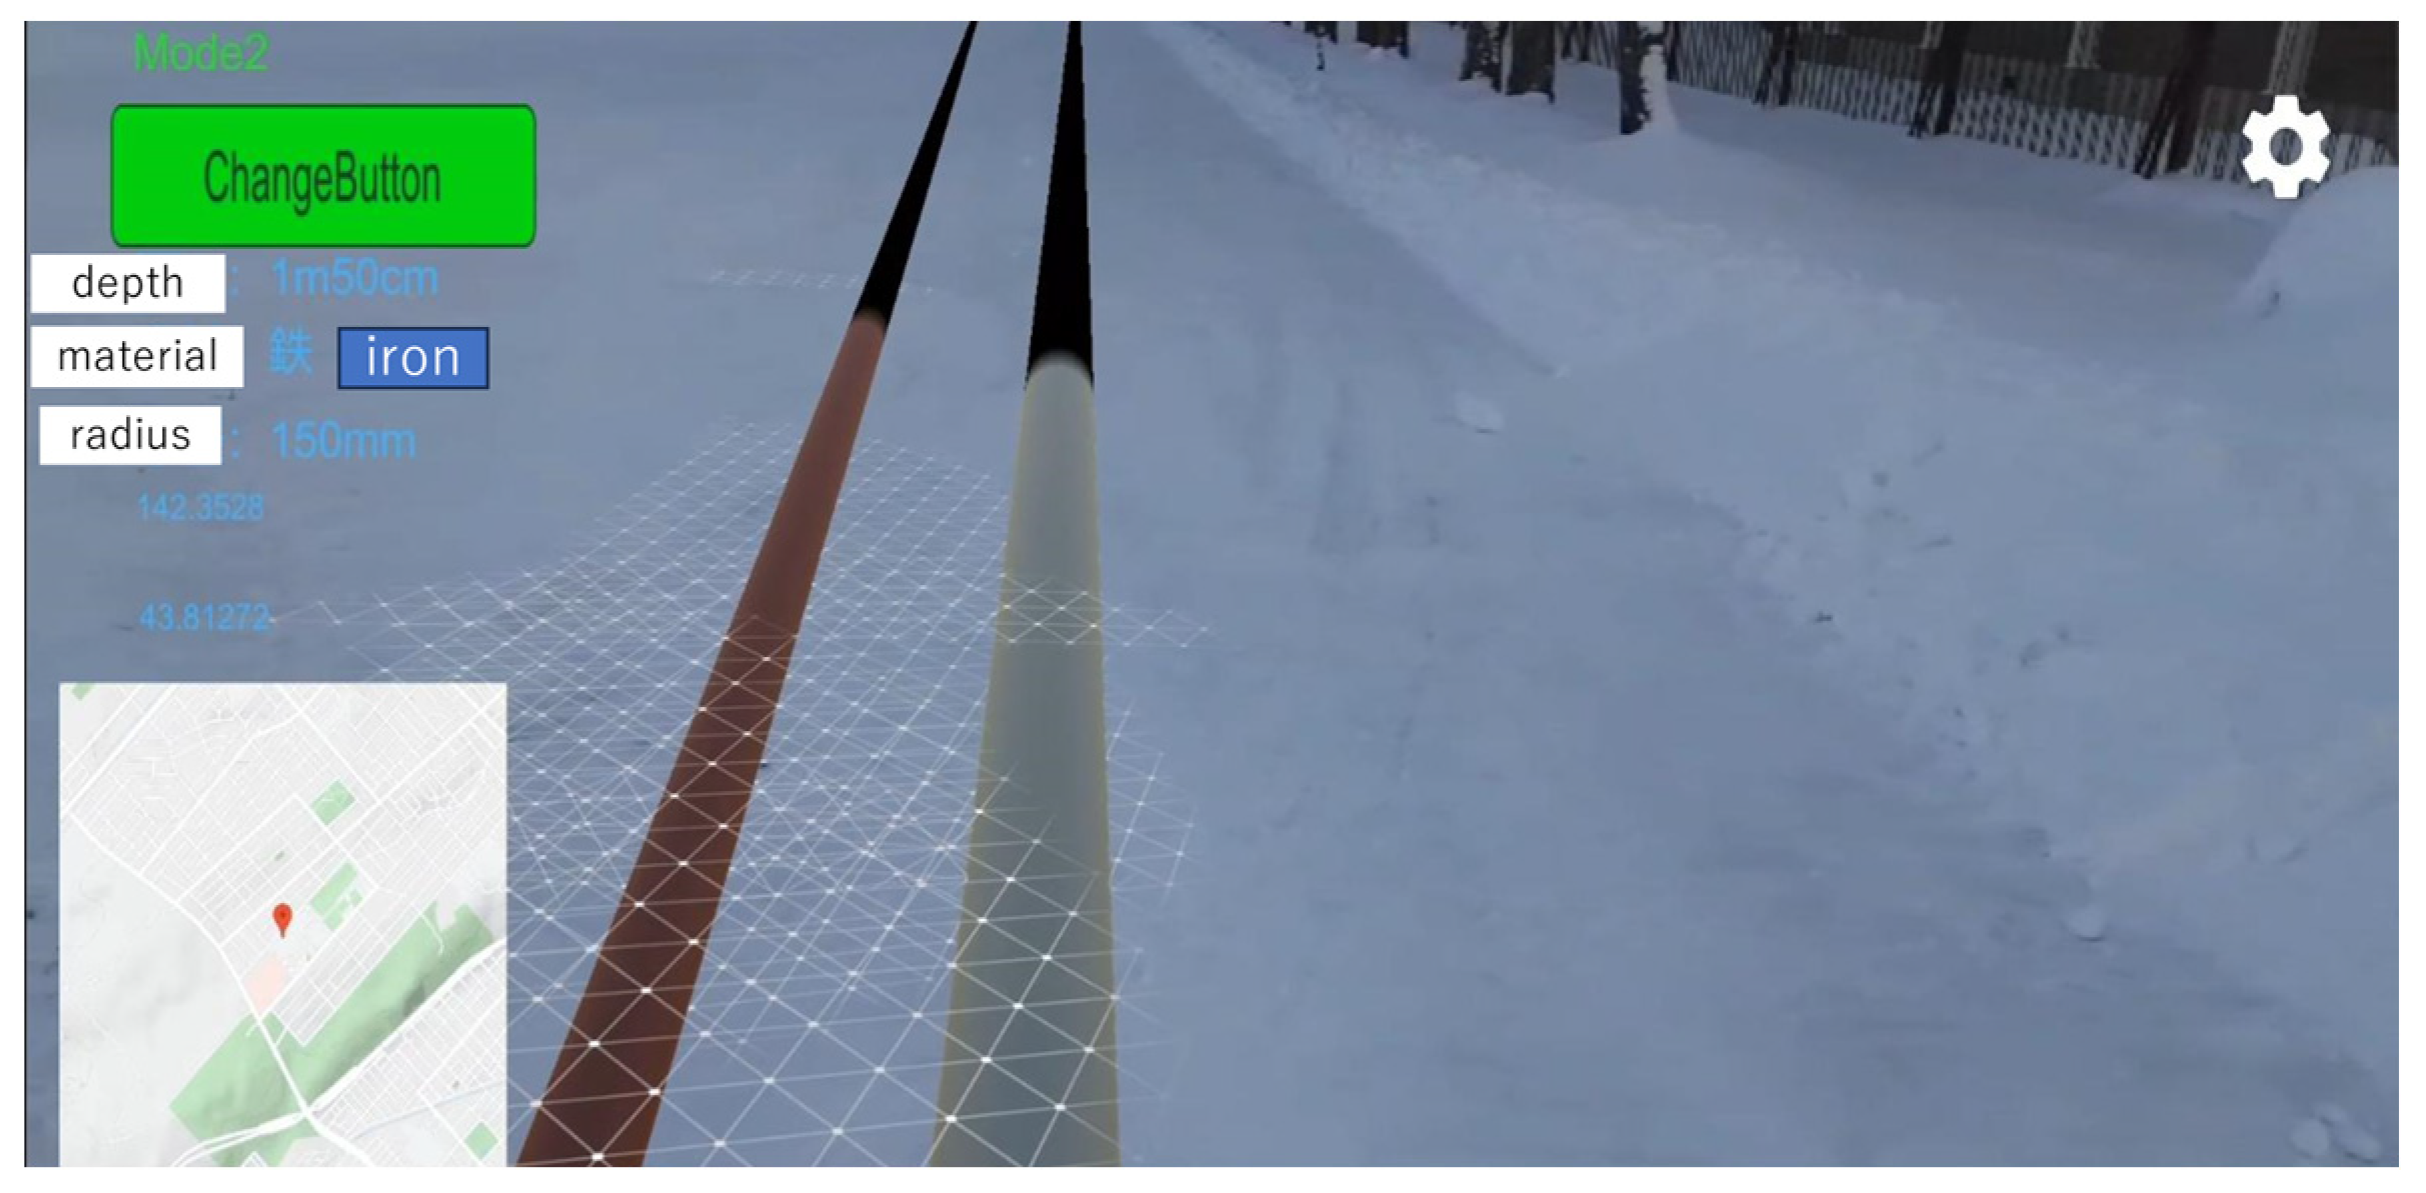
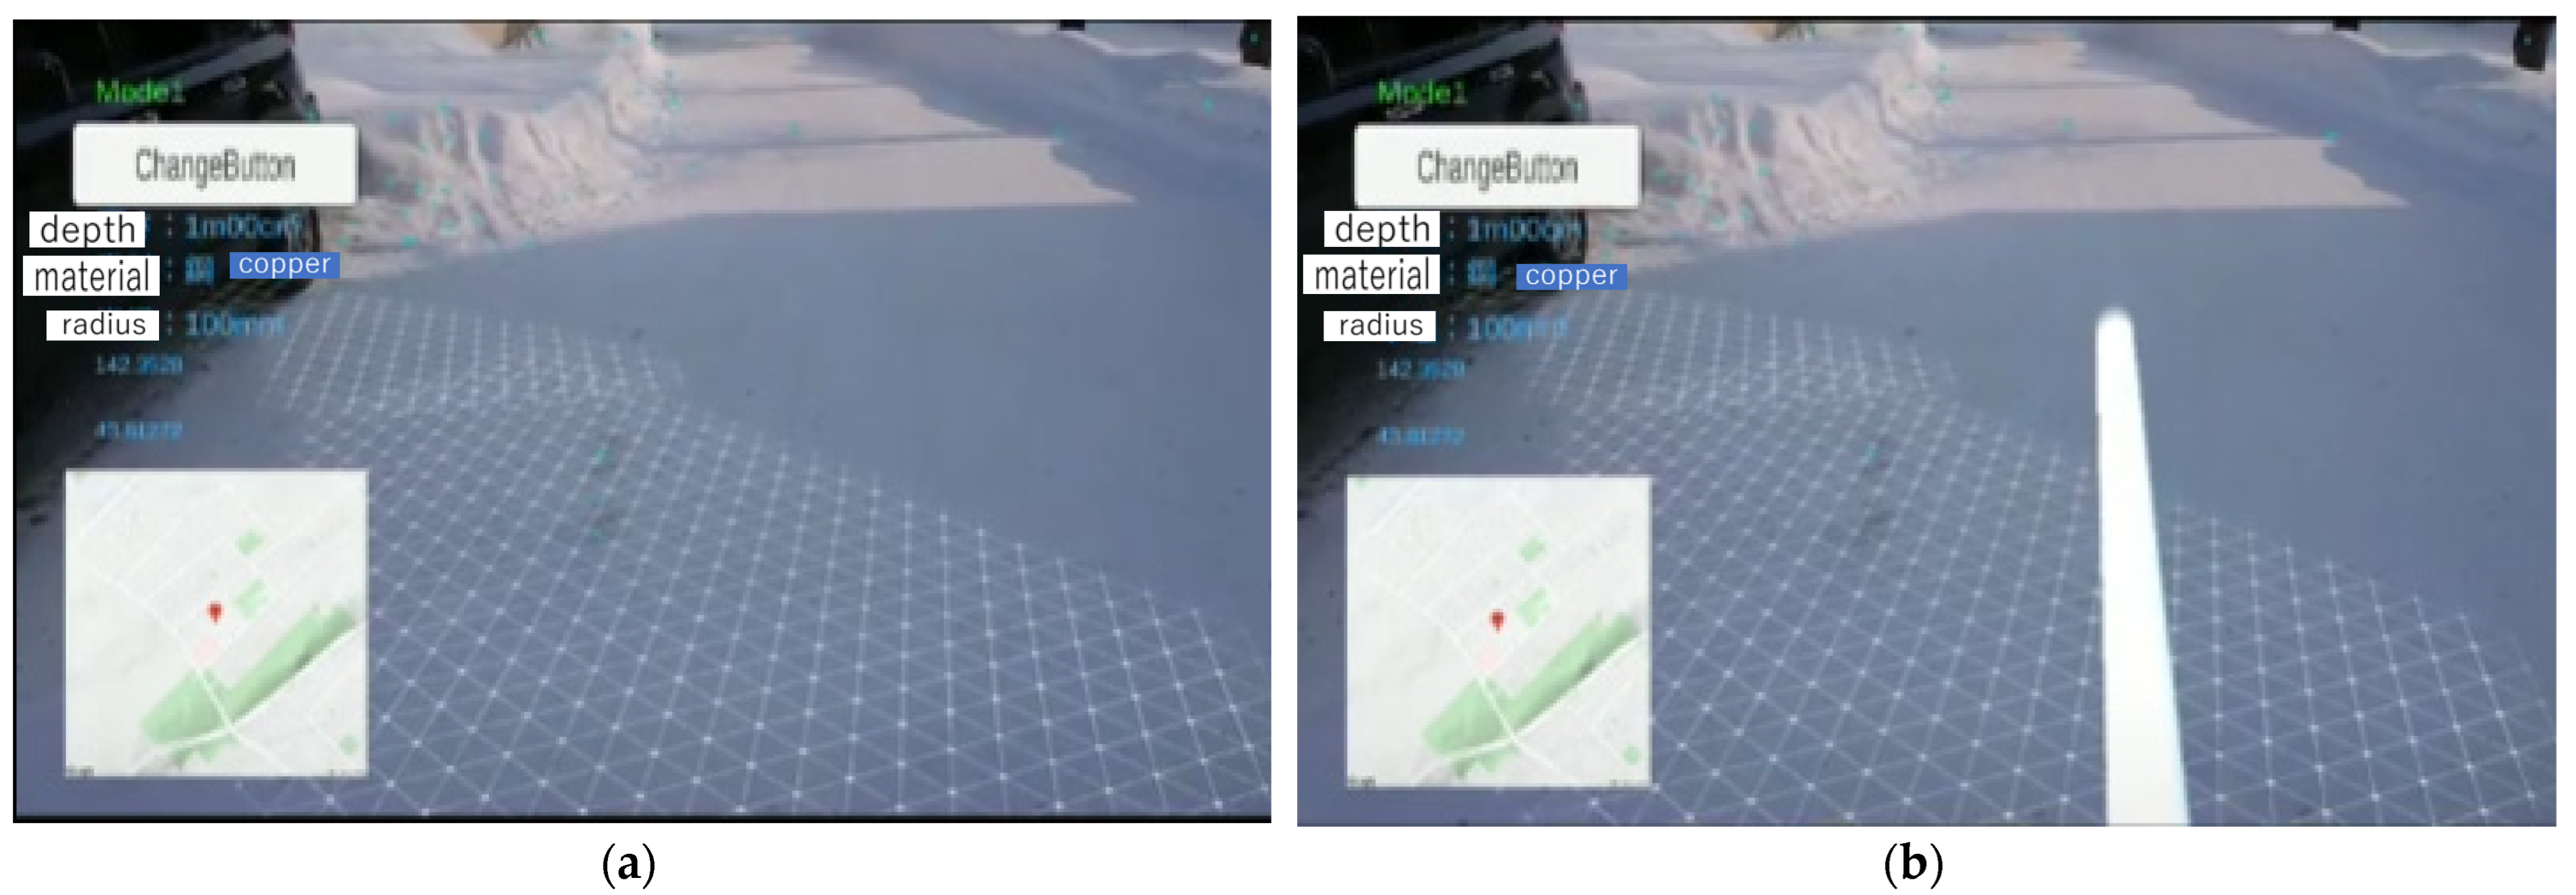
3.1. Water Pipe Visualization Results

Figure 16 shows the actual operation experiment of the system. The number of experimenters is two. Experiments were conducted to see if the system could actually work outdoors. The system is able to automatically identify the ground surface by using the plane detection function. By specifying the plane generated by the plane detection, as shown in Figure 17, the water pipe model can be easily placed horizontally in relation to the ground. The water pipe model is constructed using the latitude and longitude information of the starting point, the latitude and longitude information of the ending point, the depth information, the pipe diameter information, and the pipe material information. Figure 18 shows a comparison between before and after the placement of the water pipe with plane detection.
By selecting a pre-registered water pipe model and realizing the placement of the selected water pipe model and the display of information, AR display with multiple water pipe models became possible. The application was tested in the winter season on the campus of the school where the application was installed, and while the application worked well indoors where GPS information could be obtained, outside, when the temperature was below 10 degrees below zero, the operation of the smartphone became unstable. This is thought to be because the performance of the smartphone’s battery declined in the low-temperature environment, and the necessary power was not supplied to the CPU and other devices.
The advantage of this research is that it does not require markers, which are necessary for displaying buried underground objects, in contrast to conventional research that uses AR and MR [10]. In conventional research, special markers need to be placed at predetermined locations in the field to indicate buried-underground objects. If the markers are incorrectly positioned, it is difficult to accurately indicate buried-underground structures. The system in this study can be used without the need for markers by using GPS and plane detection.

3.2. Result of Displaying Water Pipe Model

Figure 19 shows the straight water pipe 3D model created by Metamesh and Figure 20 shows the curved water pipe 3D model created by Probuilder. The water pipe 3D model created by Metamesh is displayed in the color specified in the registration process, but the water pipe 3D model created by Probuilder is displayed in the color specified at the stage when the model was created by Probuilder.

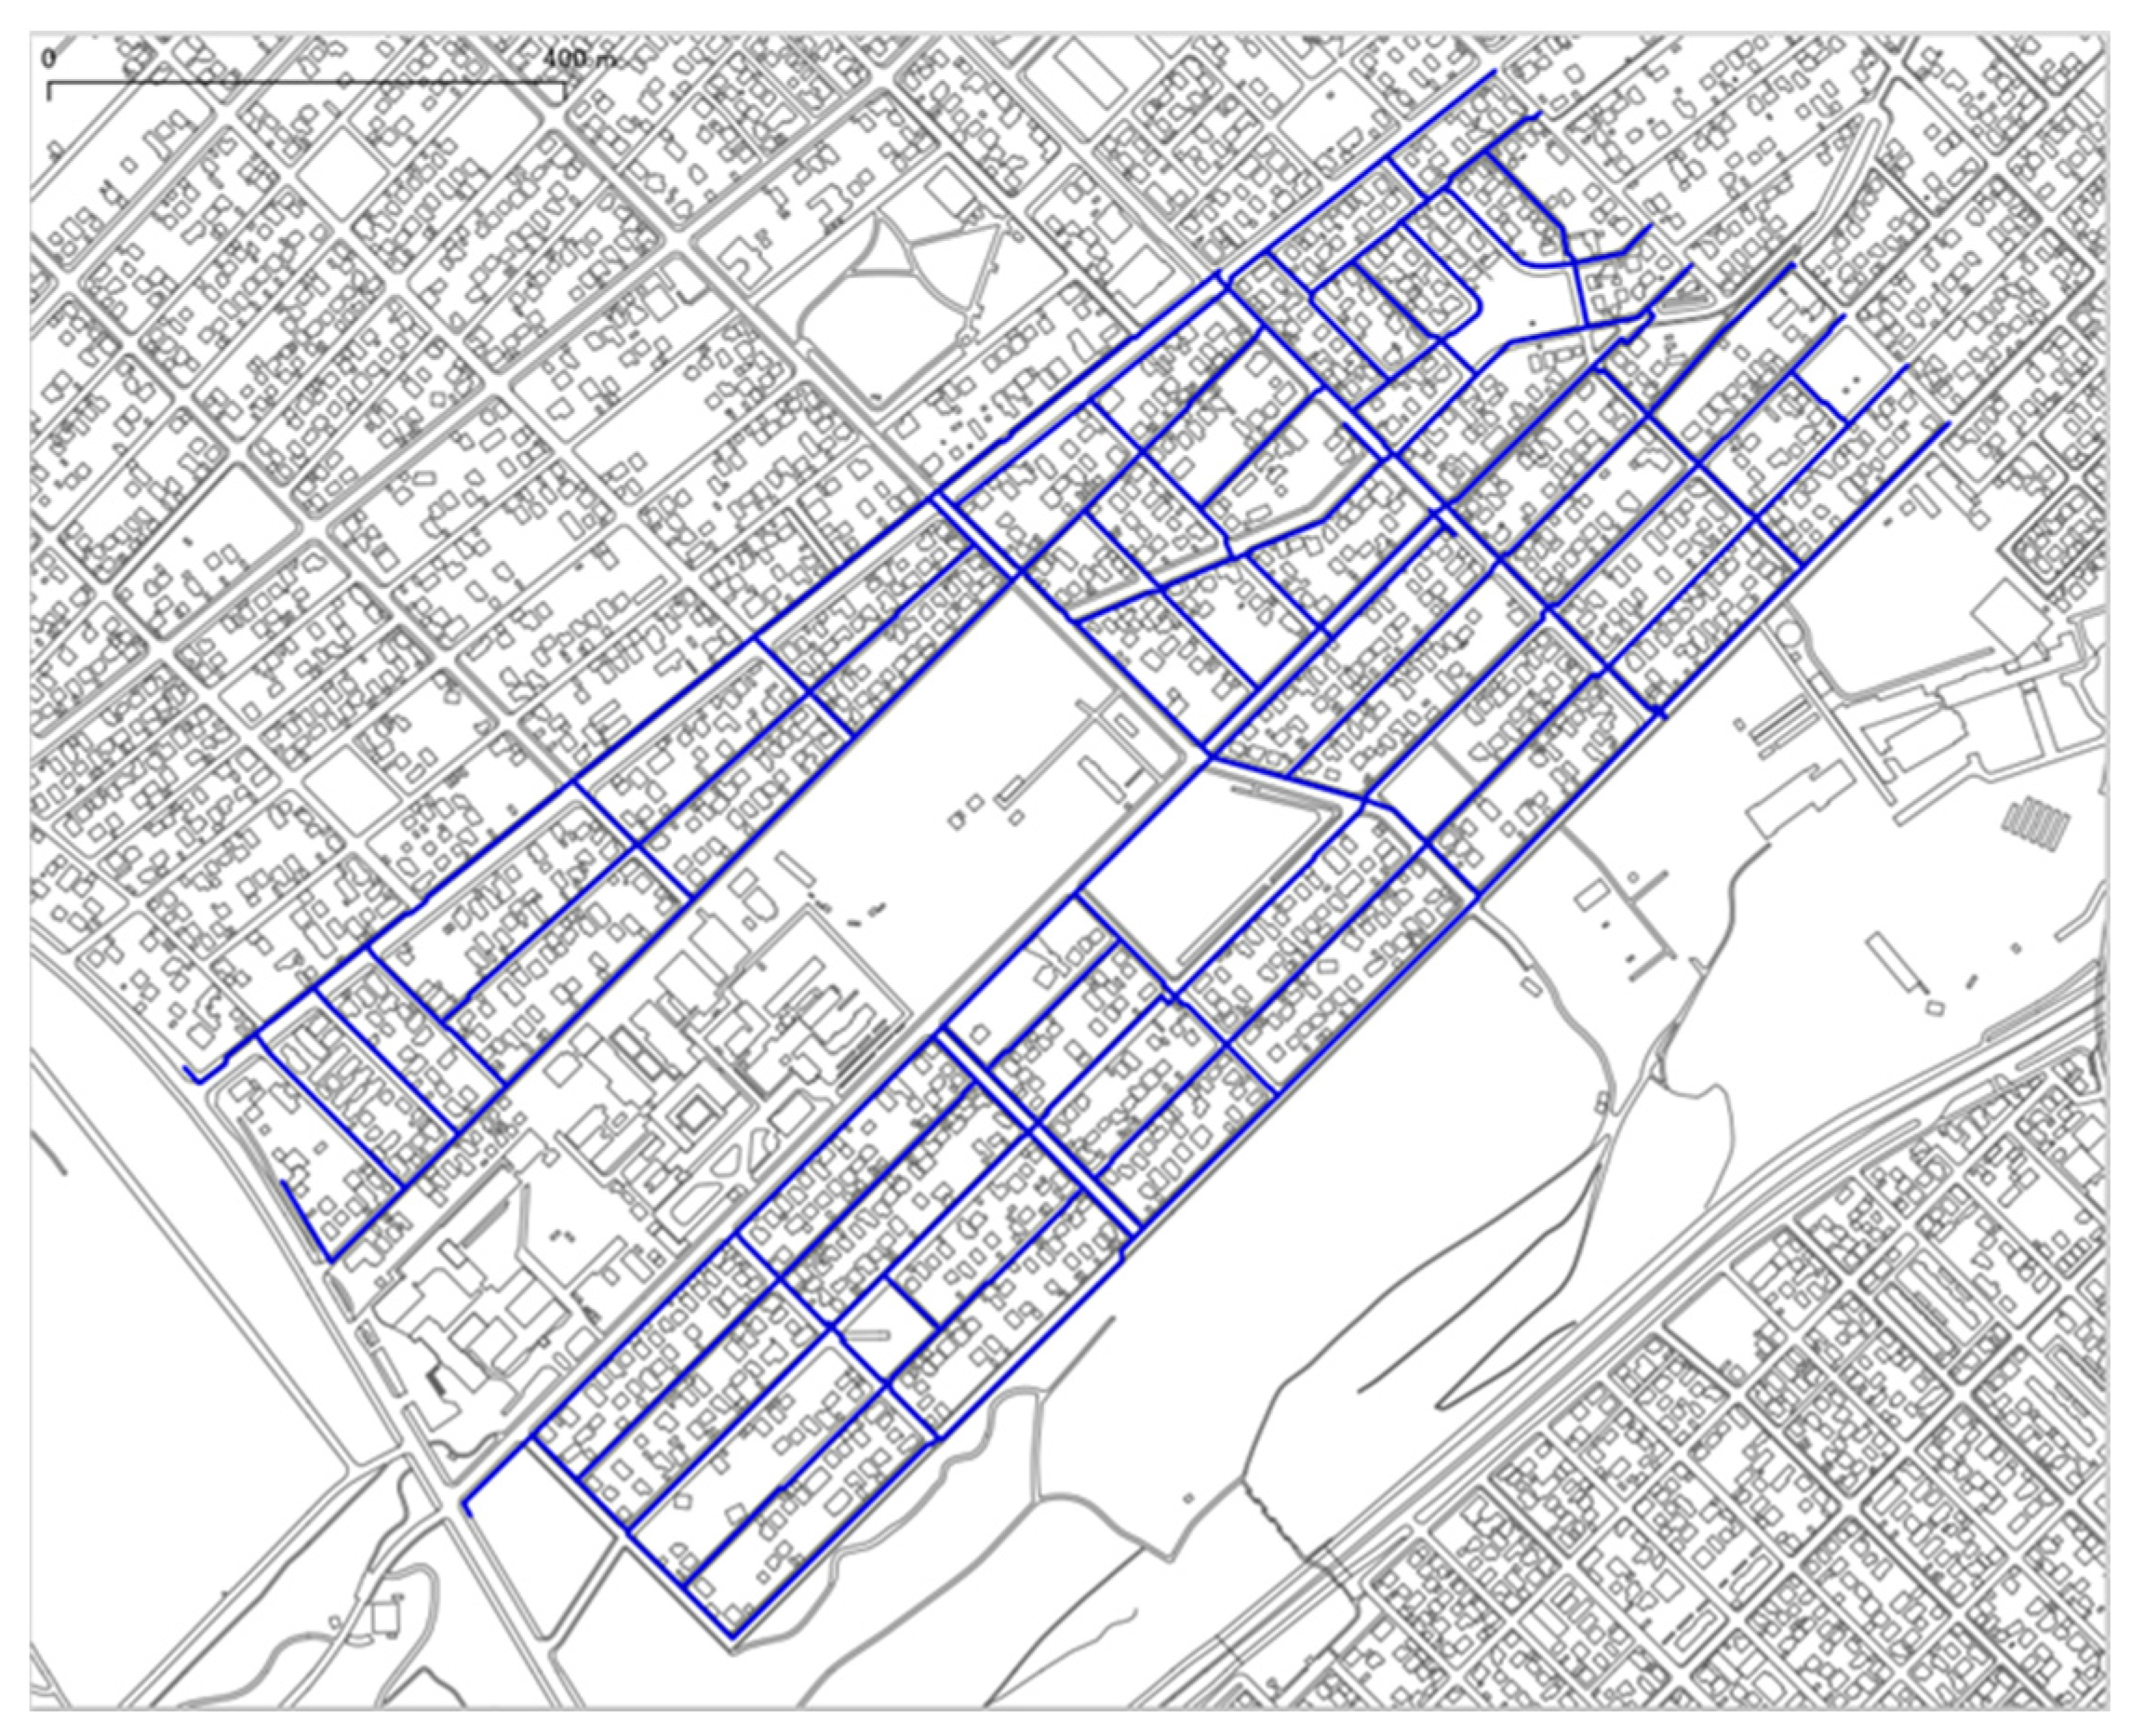
3.3. Results of the Conversion Function from Digital Water Pipe Information to Location Information

We conducted an experiment to output the location information of a water pipe to a CSV file from an SHP file containing the location information of water pipes around the Asahikawa National College of Technology, as shown in Figure 21. Since the location information of the water pipe read from the SHP file contains the starting and ending points, as shown in Figure 22, the location information was divided into dots at regular intervals based on the location information and output to a CSV file. Figure 23 shows a part of the output CSV file.

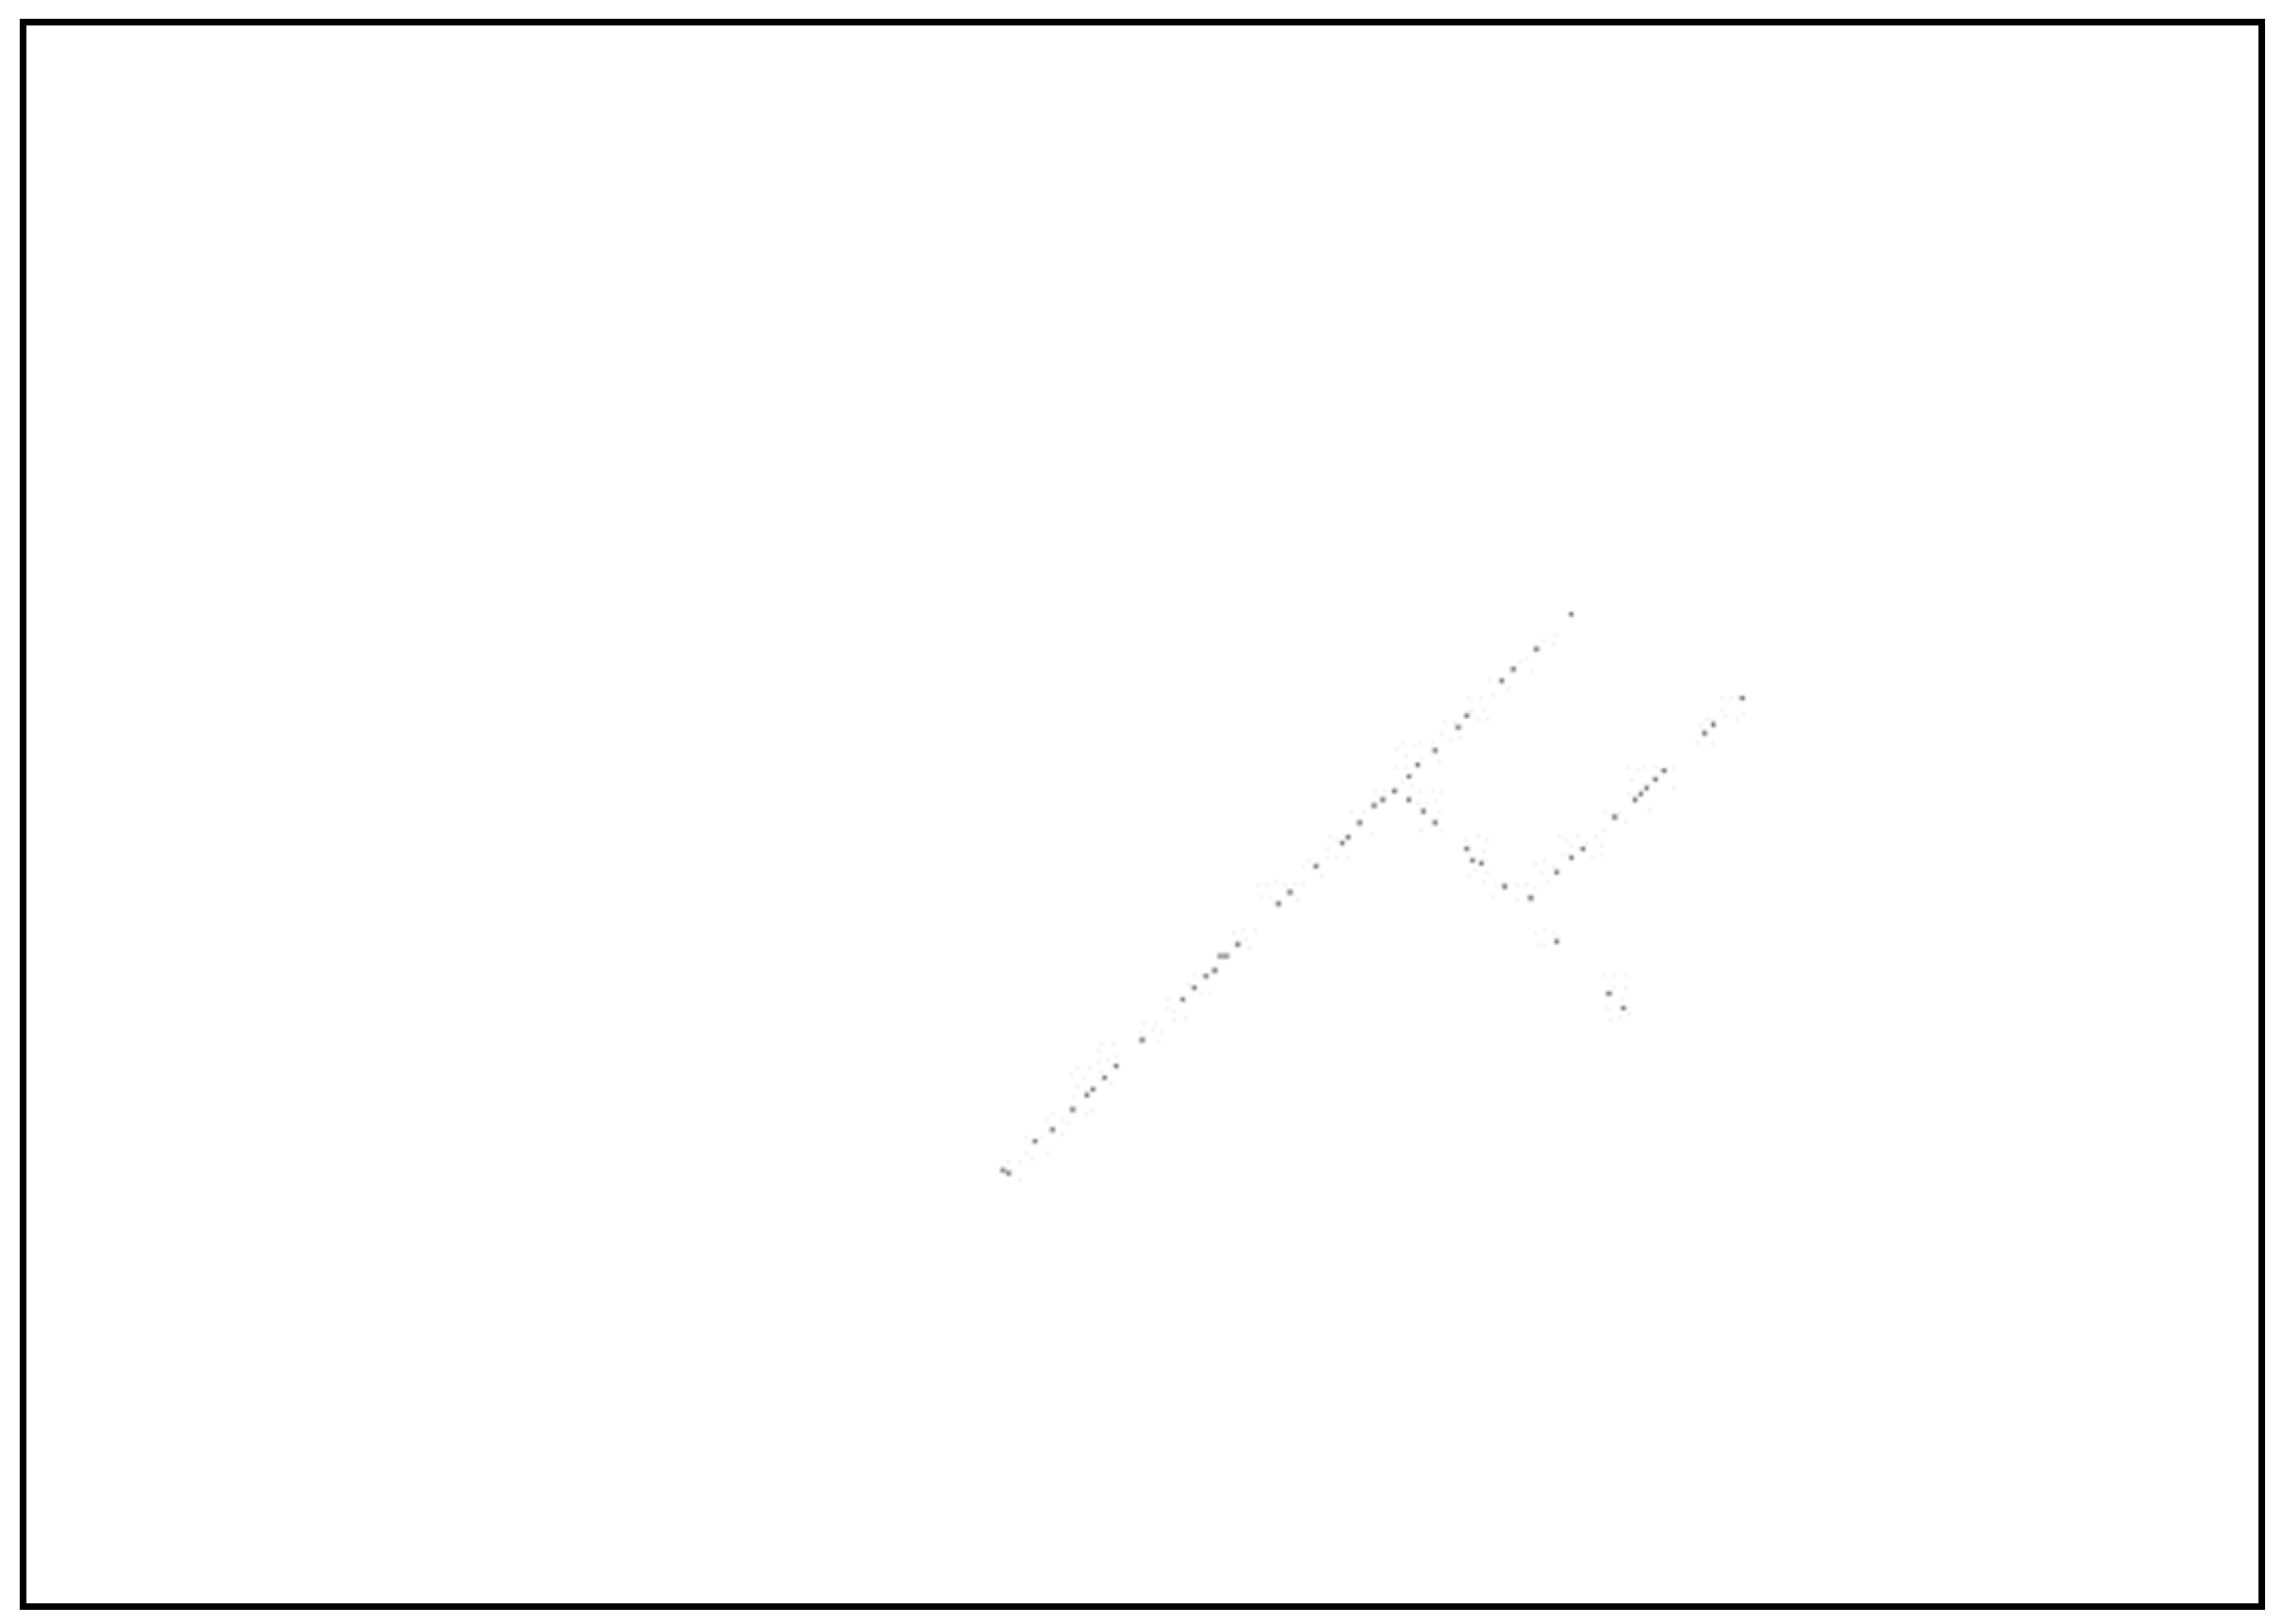
3.4. Results of the Conversion Function from Analog Water Pipe Information to Location Information

As shown in Figure 24, the locations of water pipes were handwritten with red lines on a map of the area around the school, with reference points marked in advance. This map was imported into the program, and the locations of the water pipes were extracted based on the reference points, as shown in Figure 25. Based on the location information shown in Figure 25, the water pipe location information was converted onto the points with linear information plotted at equal intervals, as shown in Figure 26, and output as a CSV file.

3.5. Improvement of Location Information Acquisition

This system relies on the location information obtained by the smartphone using the system. Therefore, the accuracy of the system’s functions, such as “registering and displaying new water pipes” and “acquiring and displaying current location coordinates,” also depends on the location information acquired by the smartphone. The accuracy of GPS location information from current smartphones varies greatly depending on the model used, location, and timing. In terms of the model used, more expensive models are able to receive more satellite signals, which increases the accuracy of location estimation. In terms of location, the accuracy of location estimation decreases in areas with many high-rise buildings, such as urban areas where the smartphone user’s sky is blocked, and in areas with many trees and thick foliage. In the timing of location estimation, the closer the location of satellites communicating for location estimation by GPS to the sky above the smartphone user, and the more satellites that can communicate, the higher the location estimation accuracy [11,12]. Based on the above facts about the accuracy of location estimation, in order to enable high-precision location estimation, it is necessary to “use a model that can communicate with more satellites” and “apply a location estimation method that is appropriate for the location where the smartphone is used” in order to obtain more accurate location information. The number of satellites that a smartphone can communicate with increases with the version of the model, so the problem of the number of satellites can be solved by using the latest model of smartphone. In particular, to obtain location information in urban areas in Japan, it is necessary to use a model that is compatible with the Quasi-Zenith Satellite System (QZSS), a positioning satellite launched by Japan. In urban areas and areas with many trees, location estimation is performed not only by GPS but also by combining the Inertial Measurement Unit (IMU), which is an inertial measurement unit installed in the smartphone, with a multi-sensor Kalman filter. A method using a multi-sensor Kalman filter is also available [13,14,15]. In this system, automatic planar detection was used to assist the AR display, but we believe that this alone is insufficient. We believe that it would be better to use not only planar detection but also vertical detection since planar detection alone provides only two-dimensional assistance.

3.6. Improvement of Water Pipe AR Display

In the AR display of water pipes, the position of the ground is estimated by plane detection, and a 3D model of a water pipe is displayed on the estimated ground. This method has a problem in that the position of the water pipe on the smartphone screen is different from the actual position due to an error caused by the height of the smartphone used by the application user. To solve this problem, it is necessary to estimate the altitude of the smartphone and reflect the height of the smartphone in real time when displaying AR. In addition, when an application user sees a 3D model of a water pipe displayed in AR, he/she may feel uncomfortable because the water pipe is buried underground and the 3D model, which should be invisible, is displayed aboveground, making it difficult to convey a sense of distance from the ground surface. It is necessary to design auxiliary displays and UI so that application users can visually perceive underground buried objects without any sense of discomfort. In addition, the distance from the ground surface and the sense of discomfort for users can be reduced by detecting reference points buried beneath actual roads and sidewalks and combining them with the arrangement of the 3D model.

4. Conclusions

In this study, we aimed to realize an AR-based visualization system for buried water pipes. The realized system uses a simple user interface to easily register water pipes by selecting water pipes and using plane detection.
In the AR display, when the water pipe is displayed corresponding to the actual depth, the difference between the actual position of the plane-detected surface and the position of the water pipe corresponding to the actual depth may cause discomfort in the depth that can be seen. This problem requires improvement in the accuracy of plane detection. In addition, since this system is intended for use at construction sites, it is necessary to stabilize the operation of the system using a smartphone at low temperatures, such as in Hokkaido during the winter.
In actual water pipe construction sites, when the ground is actually dug up, there are situations where the pipes are laid in different locations from the remaining drawings. In such cases, the system implemented in this research can easily correct the 3D data to match the current situation at the site. Similarly, if it becomes necessary to lay pipes differently from the drawings during actual construction work, the 3D data can be easily modified on the spot. In addition, many water pipes were laid long ago, and there are cases where only paper drawings remain or no drawings exist at all. In such cases, the system developed in this study enables anyone to easily create three-dimensional data on water pipes at the construction site and digitize information on old water pipes. Therefore, this research can greatly contribute to the digital transformation (DX) of water pipe infrastructure.
Although the system realized in this research targets underground water pipes, it will lead to the realization of a “buried object 3D MAP platform” by supporting the visualization and registration of infrastructure such as gas pipes, electric cables, and telephone lines laid underground. The realization of a 3D MAP platform for buried structures will enable the system to play an active role in the rapid restoration of infrastructure in the event of large-scale disasters such as earthquakes.

Author Contributions

Conceptualization, K.I., S.O., T.T. and N.I.; methodology, K.I., K.K., S.M. and T.S.; software, K.I., S.O., T.T. and N.I.; writing—original draft preparation, K.I., S.O. and N.I.; writing—review and editing, K.I., K.K., T.S. and N.I.; supervision, K.K., T.T., S.M. and T.S.; project administration, N.I. All authors have read and agreed to the published version of the manuscript.

Funding

This research received no external funding.

Conflicts of Interest

The authors declare no conflict of interest.

References

  1. Watanabe, M. Technologies for reconstruction and repair of water and sewage pipelines and facilities. Concr. Eng. 2016, 54, 111–116. [Google Scholar] [CrossRef] [PubMed]
  2. Kawamura, T.; Kawada, M.; Kawura, K. Improving efficiency of social infrastructure facility maintenance management using AR technology. Mitsubishi Electr. Tech. J. 2015, 89, 105–108. [Google Scholar]
  3. Chen, J.; Dong, S.; Hou, X.; Ma, X.; Yan, Y. Research and Application of Immersive Virtual Reality System Based on 3D Geographic Information System. In Proceedings of the 2022 IEEE Sustainable Power and Energy Conference (ISPEC), Chengdu, China, 23–25 November 2020; pp. 1730–1735. [Google Scholar]
  4. Muthalif, M.Z.A.; Shojaei, D.; Khoshelham, K. Resolving Perceptual Challenges of Visualizing Underground Utilities in Mixed Reality. Int. Arch. Photogramm. Remote Sens. Spat. Inf. Sci. 2022, 101–108. [Google Scholar] [CrossRef]
  5. Lanham, M. Learn ARCore—Fundamentals of Google ARCore; Packt Publishing Ltd.: Birmingham, UK, 2018. [Google Scholar]
  6. El Barhoumi, N.; Hajji, R.; Bouali, X.; Brahim, Y.B.; Kharroubi, A. Assessment of 3D Models Placement Methods in Augmented Reality. Appl. Sci. 2022, 12, 10620. [Google Scholar] [CrossRef]
  7. Manni, A.; Oriti, D.; Sanna, A.; De Pace, F.; Manuri, F. Snap2cad: 3D indoor environment reconstruction for AR/VR applications using a smartphone device. Comput. Graph. 2021, 100, 116–124. [Google Scholar] [CrossRef]
  8. Broll, W.; Lindt, I.; Herbst, I.; Ohlenburg, J.; Braun, A.-K.; Wetzel, R. Toward Next-Gen Mobile AR Games. IEEE Comput. Graph. Appl. 2008, 28, 40–48. [Google Scholar] [CrossRef]
  9. Svennerberg, G. Beginning Google Maps API 3; Apress: New York, NY, USA, 2010. [Google Scholar]
  10. Suzaki, F.; Kashiyama, K.; Kotoura, T.; Ishida, H.; Yoshinaga, T. Construction of AR visualization system for underground buried structures using ARKit and investigation of superimposition with high accuracy. Proc. JSCE F3 Civ. Eng. Inform. 2021, 77, I_131–I_139. [Google Scholar]
  11. Gikas, V.; Perakis, H. Rigorous Performance Evaluation of Smartphone GNSS/IMU Sensors for ITS Applications. Sensors 2016, 16, 1240. [Google Scholar] [CrossRef] [PubMed]
  12. Wang, C.; Xu, H.; Lin, S.; Deng, W.; Zhou, J.; Zhang, Y.; Shi, Y.; Peng, D.; Xue, Y. GPS 5.0: An Update on the Prediction of Kinase-specific Phosphorylation Sites in Proteins. Genom. Proteom. Bioinform. 2020, 18, 72–80. [Google Scholar] [CrossRef] [PubMed]
  13. Caron, F.; Duflos, E.; Pomorski, D.; Vanheeghe, P. GPS/IMU data fusion using multisensor Kalman filtering: Introduction of contextual aspects. Inf. Fusion 2006, 7, 221–230. [Google Scholar] [CrossRef]
  14. Friedemann Smith, C.; Drew, S.; Ziebland, S.; Nicholson, B.D. Understanding the role of GPs’ gut feelings in diagnosing cancer in primary care: Systematic review and meta-analysis of existing evidence. Br. J. Gen. Pract. 2000, 70, e612–e621. [Google Scholar] [CrossRef] [PubMed]
  15. Yang, C.; Zheng, J.; Ren, X.; Yang, W.; Shi, H.; Shi, L. Multi-sensor Kalman filtering with intermittent measurements. IEEE Trans. Autom. Control. 2017, 63, 797–804. [Google Scholar] [CrossRef]
Figure 1. System flow on the smartphone side.
Electronics 12 02634 g001
Figure 2. Entire application screen.
Electronics 12 02634 g002
Figure 3. Using the application on an Android device outdoors.
Electronics 12 02634 g003
Figure 4. System flow on PC side.
Electronics 12 02634 g004
Figure 5. A 3D model of an enlarged water pipe.
Electronics 12 02634 g005
Figure 6. A 3D model of a water pipe seen in its entirety.
Electronics 12 02634 g006
Figure 7. A 3D model of curved pipe and B-shaped pipe created by Probuilder.
Electronics 12 02634 g007
Figure 8. Importing song tubes created with Probuilder into Unity.
Electronics 12 02634 g008
Figure 9. Virtual plane generated by plane detection.
Electronics 12 02634 g009
Figure 10. UI with Change Button in place.
Electronics 12 02634 g010
Figure 11. Water pipe with changed material placed after pressing the Change Button.
Electronics 12 02634 g011
Figure 12. Latitude and longitude and Google Map placement.
Electronics 12 02634 g012
Figure 13. Example of input for water pipe information conversion.
Electronics 12 02634 g013
Figure 14. Map before reference point and conduit information.
Electronics 12 02634 g014
Figure 15. CSV file of acquired water pipe location information.
Electronics 12 02634 g015
Figure 16. Outdoor applications in use: (a) Overall image; (b) Enlarged image of the hand from the left side; (c) Enlarged image of the hand from the right side.
Electronics 12 02634 g016
Figure 17. Display screen when using the application outdoors: (a) When there are few buildings around; (b) When surrounded by buildings.
Electronics 12 02634 g017
Figure 18. System screen comparison of before and after placement of water pipe model: (a) System screen before model placement but after plane detection; (b) System screen after placement of water pipe model.
Electronics 12 02634 g018
Figure 19. Display of a straight water pipe created in Metamesh: (a) Straight water pipe 1; (b) Straight water pipe 2.
Electronics 12 02634 g019
Figure 20. Display of a 3D model of a curved water pipe created with Probuilder: (a) Curved water pipe 1; (b) Curved water pipe 2.
Electronics 12 02634 g020
Figure 21. Water pipe information around Asahikawa National College of Technology.
Electronics 12 02634 g021
Figure 22. Location of water pipes read from SHP file.
Electronics 12 02634 g022
Figure 23. Result of converting water pipe location information from SHP file to CSV file.
Electronics 12 02634 g023
Figure 24. Map of the surrounding area with standards noted: (a) Handwritten description of the location of water pipes; (b) Photographing an analog map.
Electronics 12 02634 g024
Figure 25. Image of water pipe location information around the school, extracted from a map.
Electronics 12 02634 g025
Figure 26. Image of water pipe location information converted to a point shape.
Electronics 12 02634 g026
Disclaimer/Publisher’s Note: The statements, opinions and data contained in all publications are solely those of the individual author(s) and contributor(s) and not of MDPI and/or the editor(s). MDPI and/or the editor(s) disclaim responsibility for any injury to people or property resulting from any ideas, methods, instructions or products referred to in the content.

