Article

A Hybrid Ensemble Model for Solar Irradiance Forecasting: Advancing Digital Models for Smart Island Realization

1
Department of ICT Convergence, Soonchunhyang University, Asan 31538, Republic of Korea
2
Department of AI and Big Data, Soonchunhyang University, Asan 31538, Republic of Korea
3
Department of Medical Science, Soonchunhyang University, Asan 31538, Republic of Korea
4
LG Energy Solution, Ltd., Cheongju 28122, Republic of Korea
*
Author to whom correspondence should be addressed.
Electronics 2023, 12(12), 2607; https://doi.org/10.3390/electronics12122607
Submission received: 13 April 2023 / Revised: 5 June 2023 / Accepted: 7 June 2023 / Published: 9 June 2023
(This article belongs to the Special Issue Digital Twins in Industry 4.0)

Abstract

:
This study introduces HYTREM, a hybrid tree-based ensemble learning model conceived with the sustainable development of eco-friendly transportation and renewable energy in mind. Designed as a digital model, HYTREM primarily aims to enhance solar power generation systems’ efficiency via accurate solar irradiance forecasting. Its potential application extends to regions such as Jeju Island, which is committed to advancing renewable energy. The model’s development process involved collecting hourly solar irradiance and weather-related data from two distinct regions. After data preprocessing, input variables configuration, and dataset partitioning into training and testing sets, several tree-based ensemble learning models—including extreme gradient boosting, light gradient boosting machine, categorical boosting, and random forest (RF)—were employed to generate prediction values in HYTREM. To improve forecasting accuracy, separate RF models were constructed for each hour. Experimental results validated the superior performance of HYTREM over state-of-the-art models, demonstrating the lowest mean absolute error, root mean square error (RMSE), and normalized RMSE values across both regions. Due to its transparency and efficiency, this approach suits energy providers with limited computational resources. Ultimately, HYTREM is a stepping stone towards developing advanced digital twin systems, highlighting the importance of precise forecasting in managing renewable energy.

1. Introduction

Jeju Island in South Korea has embarked on the ambitious journey of building a digital-model-based smart island emphasizing sustainable growth and environmental stewardship [1,2]. This initiative involves a broad spectrum of stakeholders, from technology companies to governmental organizations, collaborating to foster innovation and incorporate emerging technologies. The collaborative approach has engendered a conducive ecosystem where the exchange of ideas and expertise thrives, creating advanced solutions tailored to address the island’s unique challenges. Both public and private entities have proactively invested resources in research and development, forging strategic partnerships, and launching pilot projects. These concerted efforts aim to ensure the seamless integration of digital modeling technology into the island’s existing infrastructure. This infrastructure is envisaged to be further augmented and enhanced with the help of these digital models. In the initial phase, the digital models have been largely employed in energy management, weather information analysis, and performance optimization of renewable energy systems [3]. Employing these models aims to improve the predictability and efficiency of energy production and distribution, optimize the use of renewable energy sources (RESs), and make informed decisions based on accurate weather forecasts. Implementing digital models reinforces Jeju Island’s commitment to sustainable growth and environmental protection.
The application of digital modeling technology in virtual power plants (VPPs) provides a pertinent example of its transformative potential. VPPs, which manage multiple distributed energy resources through a centralized control system via an energy management system (EMS), have seen marked enhancements in efficiency and stability due to integrating these digital models [4,5]. One of the primary features of these digital models is their ability to facilitate real-time monitoring and analysis of the virtual representations of renewable energy facilities. This capability enables operators to promptly identify and address potential issues such as a decline in power generation or equipment failure, thereby mitigating the potential for disruption in energy supply [6,7]. Another compelling advantage of these models is their ability to simulate outcomes based on various input factors. By doing so, they provide crucial insights that can be used to regulate energy demand and supply more effectively, thereby enhancing power stability. Additionally, these digital models facilitate the development of optimized operational strategies to improve power generation efficiency and reduce energy waste [8]. This capability is especially relevant given the growing global emphasis on resource conservation and efficiency. Ultimately, successfully deploying digital models is a stepping stone toward achieving sustainable energy transitions. By improving the performance and efficiency of renewable energy facilities, these models contribute to reducing the reliance on fossil fuels, thereby supporting a shift towards more sustainable energy sources [9,10].
Photovoltaic (PV) technology represents a significant avenue for renewable energy, contributing significantly towards sustainable growth and environmental protection [11]. PV technology harnesses the sun’s radiant energy, transforming it into electricity, emitting minimal carbon emissions, thus mitigating the environmental impact [12]. There have been marked advancements in renewable energy technologies, particularly in PV systems. These developments, combined with improvements in solar modules, have significantly reduced installation costs and increased power generation efficiency per unit area [13,14]. Such attributes make PV technology an attractive choice for densely populated nations such as South Korea, where space availability for large-scale energy generation facilities is limited. However, despite these significant strides, PV power generation faces an inherent challenge—its heavy dependence on weather conditions. This dependence introduces unpredictability that can be difficult to manage [15]. The potential variability in solar irradiance, the primary energy source for PV power generation, can impact the efficiency and output of PV power plants. Therefore, accurate prediction of future solar irradiance is essential for effectively managing PV systems and optimizing their power output. Harnessing this energy resource to its maximum potential requires sophisticated forecasting models capable of anticipating solar irradiance fluctuations and adjusting PV power plants’ operations [16].
However, achieving such precise forecasts presents substantial challenges, largely due to the variable temporal characteristics of solar irradiance and the complex, nonlinear interdependencies between different weather factors [16,17]. Researchers have concentrated on improving solar irradiance prediction methodologies in response to these challenges and acknowledging the burgeoning demand for RESs. Table 1 complements this aim, examining the state-of-the-art techniques used in renewable energy forecasting studies. The scope of the methods explored in this overview is broad and includes traditional machine learning (ML), ensemble learning (EL), deep learning (DL), and a host of hybrid models. These technological tools represent the forefront of methodological advancement, each contributing to improving the accuracy and efficiency of solar irradiance forecasts, enabling better utilization of PV power systems.
Chaibi et al. [18] compared the performance of the light gradient boosting machine (LightGBM) in global solar irradiance forecasting to other ML models, namely, support vector machine (SVM), random forest (RF), and adaptive boosting (AdaBoost). This study also used permutation feature importance (PFI) and Shapley additive explanations (SHAP) to understand the importance of various input features and provide model interpretability. Ghimire et al. [19] proposed a hybrid DL convolutional neural network (CNN)-stacked regression (REGST) method for predicting daily global solar irradiation. Using a meta-heuristic method, they used data from six solar energy farms in Queensland, Australia and selected features. The proposed REGST model was compared with other DL and conventional ML approaches, showing that the hybrid model performed significantly better in global solar irradiation predictions. Ghimire et al. [20] also introduced a new hybrid DL model called CSVR, which combined CNN with support vector regression (SVR) for global solar irradiation predictions. The model was developed using meteorological variables from Global Climate Model and ground-based observations, and the optimal features were selected through a metaheuristic atom search optimization method. The performance of the CSVR model was compared with other DL and ML methods, demonstrating that it offered several predictive advantages over alternative models.
Santos et al. [21] investigated ensemble-based dynamic selection methods with various base models, such as SVM, RF, and multilayer perceptron (MLP), for solar irradiance prediction. The authors showed that the dynamic selection approach could improve forecasting accuracy by combining the strengths of multiple base models and adaptively selecting the most suitable model for a given situation. Park et al. [22] proposed a domain hybrid solar irradiation prediction model that combined LightGBM, wavelet transform, complete ensemble empirical mode decomposition with adaptive noise, and MLP. The hybrid approach improved the accuracy of solar irradiance forecasting by taking advantage of the strengths of each technique. Moon et al. [23] proposed recurrent neural network (RNN)-based DL models, namely, long short-term memory (LSTM), bidirectional LSTM (Bi-LSTM), and gated recurrent unit (GRU), for time-series forecasting of hourly solar irradiance for Seoul, Busan, and Incheon. The proposed models were evaluated against baseline regression models and their variants. The results showed that attention mechanism-based Bi-LSTM and GRU models trained with the scaled exponential linear unit activation function provided the best multistep-ahead solar irradiance forecasting performance.
In previous research, several studies were conducted to predict solar irradiance on Jeju Island. Jung et al. [24] proposed an attention mechanism-based LSTM network model for short-term solar irradiance prediction, utilizing historical solar irradiance and weather data from two different regions in Jeju Island. Park et al. [25] developed a multistep-ahead solar irradiance forecasting model using the LightGBM, outperforming other EL and DL models. Moon et al. [26] compared tree-based EL methods and discovered that the Cubist model provided better day-ahead hourly solar irradiance prediction than others. However, the Cubist model’s longer training time led to the RF model’s consideration of the ranger package [27] as a more suitable option due to its significantly faster training process in low-performance computing environments. Incorporating multiple hybrid models can enhance solar irradiance predictions, ultimately optimizing PV power generation and supporting smart island initiatives. Although improvements were observed with the single EL model, there remains room for increased accuracy, highlighting the importance of using multiple hybrid models in solar irradiance prediction [28].
This research introduces a novel model, HYTREM (short for hybrid tree-based ensemble learning model), which improves the prediction of hourly solar irradiance on Jeju Island. HYTREM offers an innovative solution by combining the strengths of previous studies and contemporary trends in the field, effectively addressing the limitations of DL models that demand high-performance computing resources and single-tree-based EL models that may lack robustness. By generating separate learning datasets for each hour, HYTREM’s performance is significantly enhanced, leading to more accurate solar irradiance predictions. This innovative approach promotes interdisciplinary collaboration and drives progress in renewable energy management. Moreover, this research provides insights into potential advancements towards digital twin technology, significantly contributing to renewable energy forecasting. With HYTREM, the reliability of solar irradiance predictions can be improved, thereby increasing the practical applicability of renewable energy management strategies.
The main contributions of this study are as follows:
  • The novel model HYTREM is developed to accurately predict solar irradiance hourly on Jeju Island. Leveraging a variety of input variables and EL techniques, the model can effectively adapt to unique hourly patterns of solar irradiance.
  • Ranger-based RF models are utilized separately for each hour of the day, recognizing temporal variations in solar irradiance. This strategy accommodates the limited computational resources of energy providers and enhances the accuracy of predictions.
  • An online learning model incorporating time-series cross-validation (TSCV) with input variables is introduced. This approach allows the model to capture the latest solar irradiance trends and patterns for each specific hour, ensuring its relevancy to real-world conditions.
  • Transparent decision-making is emphasized through a variable importance analysis, visualizing crucial factors impacting the model’s prediction accuracy. This transparency fosters a data-driven approach to renewable energy management.
  • Although the present study primarily introduces a robust digital model for accurate solar irradiance prediction, it also lays the groundwork for future advancements toward digital twin technology. Despite current limitations, such as the lack of real-time communication and synchronization between the digital twin and physical twin, this digital model is a crucial step toward realizing a comprehensive digital twin in future research.
The structure of this paper unfolds as follows: Section 2 and Section 3 provide detailed descriptions of data preprocessing and the construction process of HYTREM. Section 4 presents the experimental results, validating HYTREM’s performance. Section 5 discusses HYTREM’s broader applicability across various geographical regions and its limitations and suggests potential future research directions. Finally, Section 6 concludes by summarizing findings and highlighting prospects in solar irradiance forecasting.

2. Data Preprocessing

In this study, the aim was to construct a solar irradiance forecasting model using date/time, meteorological data, and historical solar irradiance data provided by the Korea Meteorological Administration (KMA). The focus was on two regions, Ildo 1-dong (latitude: 33.51411 and longitude: 126.52969) and Gosan-ri (latitude: 33.29382 and longitude: 126.16283), located on Jeju Island, the largest island in South Korea. Jeju Island is actively implementing various measures to transition into a smart island by shifting from conventional fossil fuels to RESs. The data collection period spanned eight years, from 2011 to 2018, between 8 a.m. and 6 p.m. During this period, data on sky condition, temperature, humidity, wind speed, and solar irradiance were collected, along with other meteorological observation data such as soil temperature, total cloud volume, ground-surface temperature, and sunshine amount. However, the analysis was limited to sky condition, temperature, humidity, and wind speed, provided by KMA’s short-term weather forecasts [29], as shown in Figure 1. By considering the solar irradiance and weather conditions of these two regions, the aim was to assess the applicability of PV systems in South Korea, given Jeju Island’s commitment to energy independence through RESs.
In this study, the issue of needing more data in the collected meteorological information was addressed. Approximately 0.1% of the total data for each category, including temperature, humidity, wind speed, and solar irradiance, had missing values indicated as −1. To estimate these missing values, linear interpolation was employed due to their continuous data characteristics. Logistic regression was utilized to approximate missing values for sky condition data, which were presented as categorical values ranging from 1 to 4. To effectively reflect the periodicity of the date and maintain consistency with the previous study [25,26], a day-ahead hourly solar irradiance forecasting was performed using the same independent variables as shown in Table 2. The date information was converted to Julian dates, ranging from 1 to 365 for common years or 366 for leap years, where January 1 corresponded to 1 and December 31 to 365, or 366 in leap years.
Subsequently, one-dimensional (1D) date data were transformed into a two-dimensional (2D) continuous space using a sinusoidal transformation (Equations (1) and (2)), following the method detailed in [30,31]. The transformation used sine and cosine functions to map each day of the year onto a point in a unit circle, a standard practice when dealing with cyclic or periodic data, as it preserved the natural continuity between the endpoints of the cycle (i.e., 31 December and 1 January).
Daysin = sin(360° × Julian Date/365 (common years) or 366 (leap years),
Daycos = cos(360° × Julian Date/365 (common years) or 366 (leap years),
where Daysin and Daycos represent the coordinates of the point on the unit circle for the given Julian Date.
A significant improvement in the multiple correlation coefficients and the coefficient of determination, with solar irradiance as the dependent variable, was observed when the date data were transformed from 1D to 2D, as shown in Table 3. In the 2D space, the multiple correlation coefficients for Ildo 1-dong and Gosan-ri increased from 0.061 to 0.424 and from 0.059 to 0.379, respectively. Similarly, the coefficients of determination also showed substantial improvement, increasing from 0.004 to 0.180 in Ildo 1-dong and from 0.003 to 0.144 in Gosan-ri.
The enhancement can be attributed to the 2D transformation, allowing for better capturing of the cyclical nature of time data. Time data are intrinsically circular (i.e., after 31 December comes 1 January), and a linear representation (i.e., Julian dates) may not effectively capture this cyclical characteristic [32]. In contrast, a 2D representation, such as the sinusoidal transformation used here, maps time onto a circle, thereby maintaining the cyclical continuity of the data [33,34]. This enhanced representation of the data’s cyclical nature contributes to the higher correlation and determination coefficients observed in the 2D space, providing a more accurate and efficient representation of the periodicity in the collected meteorological data [34].
The sky condition comprises four categories on an interval scale from one to four: clear, partly cloudy, mostly cloudy, and cloudy, with the cloud amount represented by eleven scales according to the climatology 1/10 method used by the KMA. To effectively represent these categorical data, one-hot encoding was employed. A value of 1 was assigned to the binary variable representing a specific sky condition, and 0 was assigned to the other conditions. Similarly, one-hot encoding was used to represent the hour factor on an interval scale from 8 (8 a.m.) to 18 (6 p.m.), taking into consideration that solar irradiance typically peaked between 12 p.m. and 2 p.m. [25,26]. To account for recent trends in solar irradiance, historical weather conditions from one day before the prediction time, including sky condition, temperature, humidity, wind speed, and solar irradiance, were incorporated as independent variables. This comprehensive representation of sky conditions, time intervals, and recent weather trends allowed for more accurate and adaptable predictions of intermittent solar irradiance in the model.

3. Model Construction

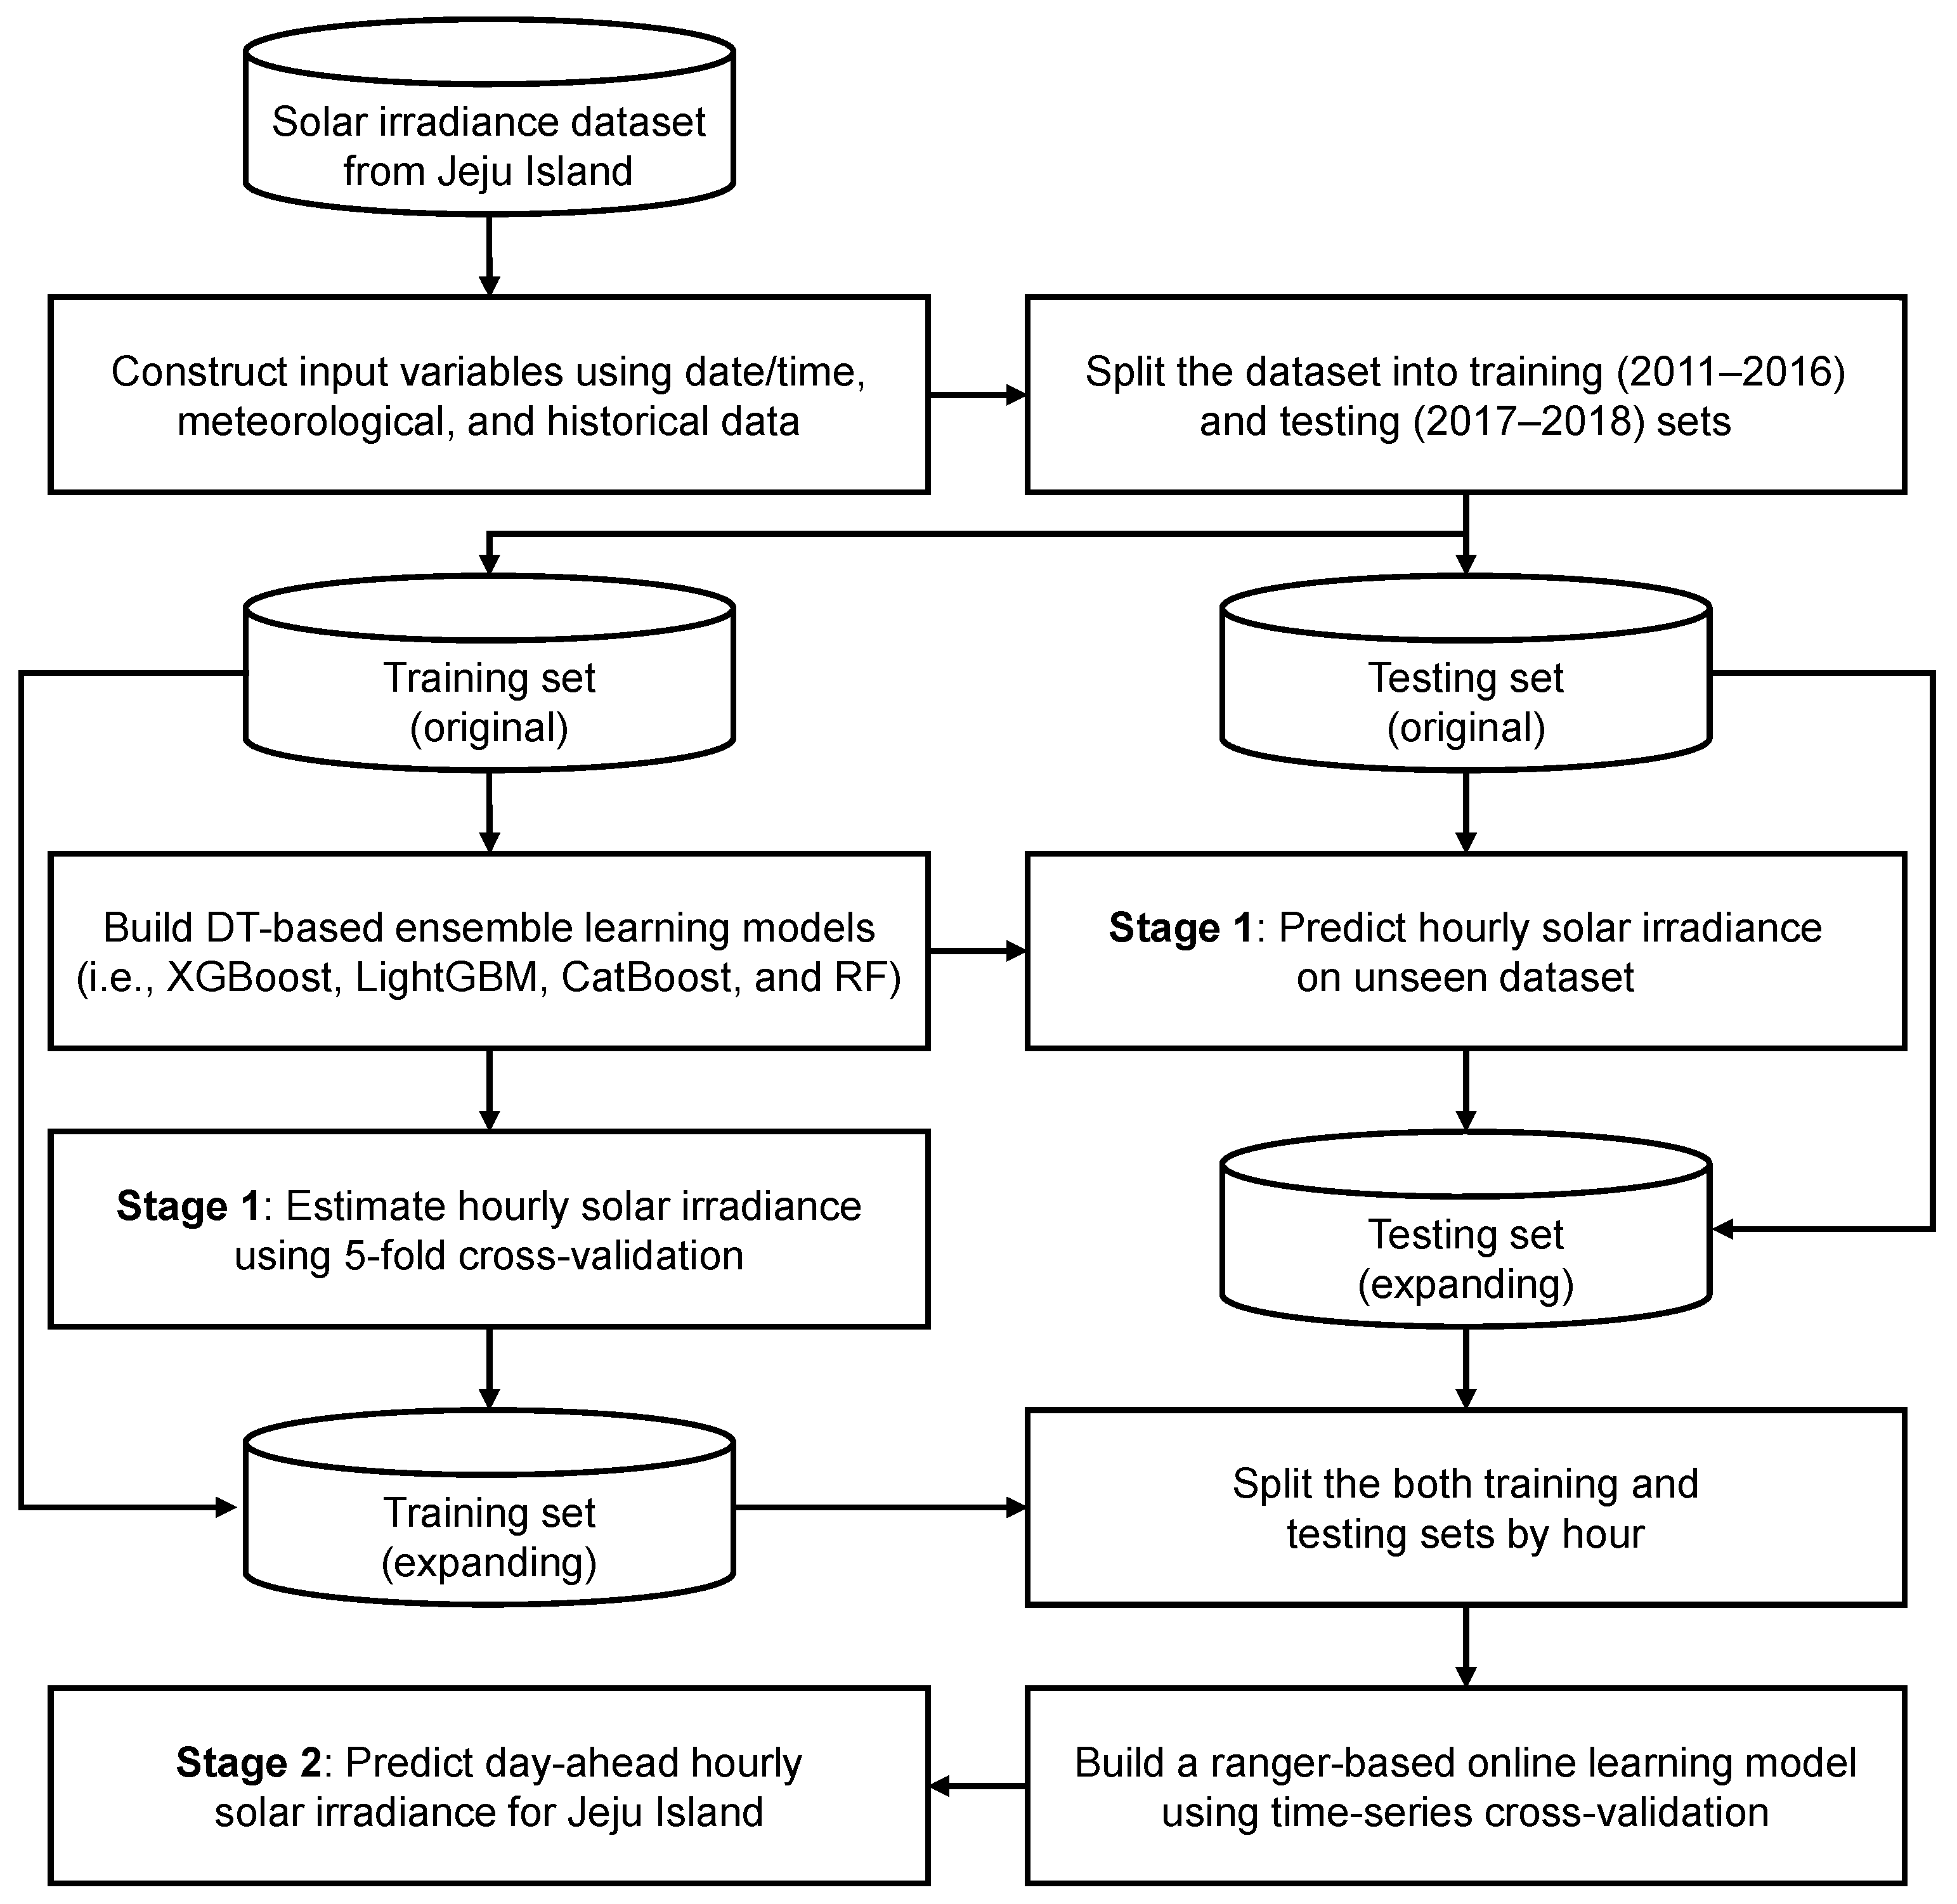
In this section, the construction of HYTREM, a tree-based EL approach focused on day-ahead hourly solar irradiance forecasting in Jeju Island, is introduced. The overall architecture of the HYTREM procedure is presented in Figure 2. The dataset was divided into a training set (in-sample) and a testing set (out-of-sample), covering the periods 2011–2016 and 2017–2018, respectively, with an approximate ratio of 75:25. Tree-based EL approaches are powerful ML techniques for regression and classification problems [35,36]. These approaches enable the development of high-accuracy prediction models with satisfactory performance and easily interpretable results. Unlike linear models, such as multiple linear regression (MLR), tree-based EL approaches can effectively capture nonlinear relationships between input and output variables and apply them to various ML applications in the energy sector [37,38].
For the HYTREM procedure, four tree-based EL approaches were utilized: XGBoost, LightGBM, CatBoost, and RF. Tree-based methods are well-suited for capturing the nonlinear characteristics of intermittently collected solar irradiance data, enabling them to address various problems in the ML domain [39]. This study proposes an innovative approach by constructing a hybrid tree-based EL model that uses the highly correlated output values from XGBoost, LightGBM, CatBoost, and RF with solar irradiance as input variables instead of employing a stacking EL method using each model’s forecasting values. This approach aims to forecast hourly solar irradiance accurately for the previous day. Each model’s functionality and advantages are briefly summarized below.
XGBoost [40] is a gradient boosting algorithm suitable for various classification and regression problems. With the integration of several optimization techniques into the fundamental boosting algorithm, XGBoost attains high performance and efficiency. It sequentially adds new models to minimize prediction errors. This process is elaborated mathematically in Equation (3)
L(y, ŷ) = Σl(yi, ŷi),
where for a given objective function L, indicating the algorithm’s emphasis on minimizing loss, thereby ensuring high forecasting accuracy. XGBoost includes L1 and L2 regularization and offers an early stopping feature to prevent over-fitting, improving the model’s generalization performance. With parallel processing capabilities utilizing multiple central processing unit (CPU) cores during tree construction, XGBoost achieves fast training speeds, ideal for large datasets [40,41]. It also features an automatic missing value handling mechanism, allowing model training without separate preprocessing steps [41].
LightGBM [42] is an efficient and high-performance focused gradient boosting-based algorithm. It employs a leaf-wise tree construction method, enhancing efficiency and learning speed and making it suitable for large-scale datasets. LightGBM incorporates multiple optimization techniques based on gradient boosting to enhance forecasting performance, as expressed in Equation (4):
ΔL = −(GL/(HL + λ)) − (GR/(HR + λ)) + (G/H + λ),
which formulates the leaf-wise tree growth algorithm used. LightGBM also provides regularization, pruning, and early stopping features to prevent overfitting and supports GPU acceleration for faster training speeds. It accommodates various objective functions and evaluation metrics, enabling its application to classification, regression, and other problems using custom objective functions. LightGBM includes an automatic missing value handling feature, allowing model training without separate preprocessing steps.
CatBoost [43] is a gradient-boosting-based algorithm demonstrating high performance in datasets with numerous categorical features and applies to various classification and regression problems. CatBoost employs a proprietary categorical feature handling method, eliminating the need for separate one-hot or label encoding steps and shortening data preprocessing time. It delivers high forecasting performance by utilizing multiple optimization techniques based on gradient boosting. Additionally, CatBoost supports various loss functions, enabling its application to classification and regression problems. CatBoost is also designed to be less sensitive to hyperparameter settings, making it more user-friendly and easier to fine-tune for optimal performance.
RF [44] is an ensemble learning method applicable to various classification and regression problems. By generating multiple decision trees (DTs) and aggregating their forecasting results, RF attains higher accuracy than individual DTs. The mathematical representation of this process can be illustrated using Equation (5):
H(x) = 1/K × Σh(x, Θk, γk),
where h(x, Θk, γk) symbolizes the kth tree’s decision function, and the RF combines these individual trees. Data and variables are randomly sampled during tree construction to create diverse tree structures, effectively mitigating the overfitting issue associated with DTs [44,45]. RF is known for its robust performance even without extensive hyperparameter tuning, as the application of several established methods (e.g., setting the number of features to p/3 for regression or sqrt(p) for classification, where p is the number of predictors [45]; or the number of trees to a sufficiently large value such as 128 or higher [46]) often yields satisfactory results. Additionally, RF can handle variables with missing values, reducing the data preprocessing burden. Due to its advantages of accuracy, simplicity, and flexibility, RF is widely used in various fields.
The selection of the RF model as the final model in this study stemmed from its compatibilities with the specific requirements and constraints of the study rather than a universal claim of superiority. A key attribute distinguishing RF from other boosting algorithms was its unique ability to evenly learn from all features, a characteristic enabled by handling the number of features during model training [37,47]. This hyperparameter provided a more balanced learning approach. Another strength was RF’s strong performance, even without extensive hyperparameter tuning, contrasting gradient boosting machine (GBM)-based models [28,48]. These models often necessitate meticulous adjustments of hyperparameters for optimal performance. Additionally, RF models inherently mitigate overfitting issues common with individual DTs [47,48]. While boosting algorithms can also handle overfitting, it often involves additional hyperparameter tuning and a nuanced understanding of the bias-variance trade-off. Thus, the selection of RF considered its balanced learning capability and alignment with the needs and constraints of the study.
Furthermore, whereas XGBoost, LightGBM, and CatBoost models are primarily implemented in Python, RF requires online learning for applying time-series cross-validation, necessitating an alternative library. Python’s scikit-learn and R’s randomForest libraries offer excellent options for implementing RF; however, they present certain limitations, such as insufficient optimization for high-dimensional datasets and slow model implementation speeds. The R’s ranger (RANdom Forest GEneRator) package [27], an efficient and rapid RF algorithm implementation, was employed to address these challenges in constructing the RF model. The ranger package significantly improves the speed and memory usage of the original RF algorithm, ensuring enhanced performance when processing large datasets [26,37].
This study employed XGBoost, LightGBM, CatBoost, and RF models to forecast day-ahead solar irradiance for the Jeju region. For the ranger model training, 34 input variables were used, including four prediction values from the XGBoost, LightGBM, CatBoost, and RF models, as well as the existing 30 input variables known to generate fluctuations in the current trends and patterns for solar irradiance [28]. To generate the required prediction values of XGBoost, LightGBM, CatBoost, and RF as input variables for training the ranger model during both training and testing sets, the prediction values were first generated for the training set using five-fold cross-validation. Using traditional methods, the XGBoost, LightGBM, CatBoost, and RF models were then constructed and trained with the existing 30 input variables. Day-ahead hourly solar irradiance predictions were performed on the testing set. The training and testing sets were restructured using the prediction values as input variables, resulting in 34 variables. Table 4 and Table 5 display Pearson correlation coefficients (PCCs) and p-values, reflecting the relationships between solar irradiation and each of the 34 independent (input) variables included in the study.
In Table 4 and Table 5, the PCCs and p-values quantify the degree and significance of the correlation between each of the 34 variables and solar irradiance, measuring their linear association. The correlation coefficients vary between −1 and +1. A positive value indicates a direct relationship, whereas a negative value indicates an inverse relationship. For instance, in the Ildo 1-dong dataset (Table 4), Temp has a positive correlation (0.307), suggesting that solar irradiance also tends to increase as temperature increases. On the other hand, Daycos has a negative correlation (−0.417), with low values in summer and high values in winter, indicating an inverse relationship with solar irradiance. The accompanying p-values indicate the statistical significance of these correlations. A lower p-value suggests a more statistically significant relationship. For instance, Temp in the Ildo 1-dong dataset (Table 4) shows a p-value of less than 0.001, implying a statistically significant relationship with solar irradiance. This correlation analysis uncovers potential linear relationships between each input variable and the output variable solar irradiance in the given datasets. It highlights their independent considerations within the model while acknowledging possible real-world interdependencies.
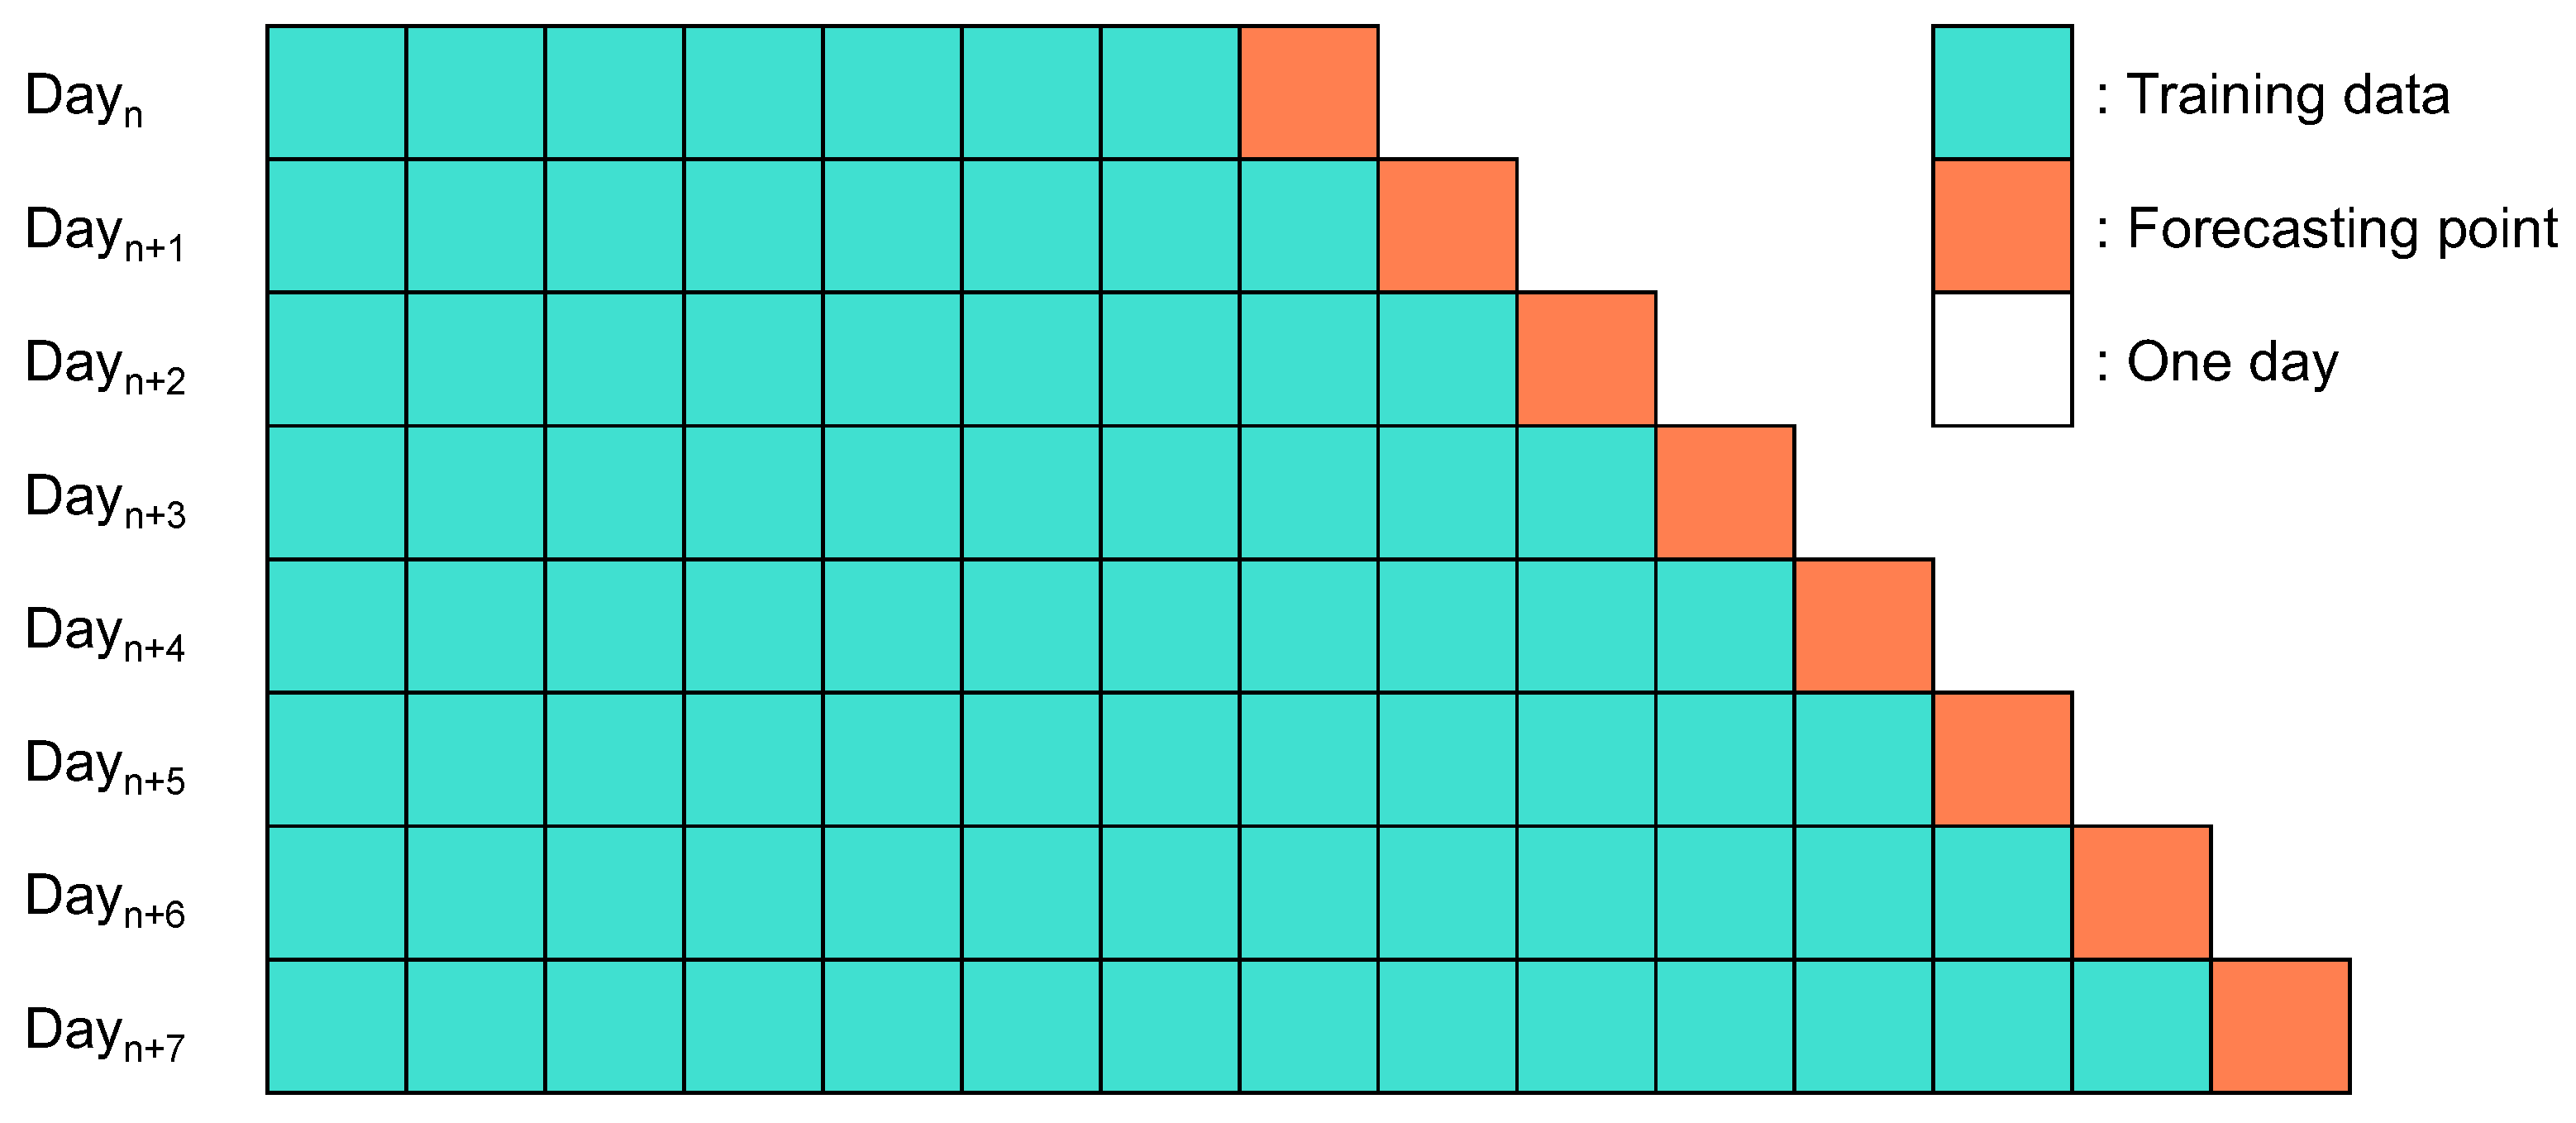
TSCV was applied to the ranger model for implementing an online learning approach, addressing data shortage issues, reflecting recent solar irradiance patterns, and adjusting the weights of input variables [49,50]. TSCV concentrates on multiple forecast horizons for each testing set, as shown in Figure 3. Different training sets were used, depending on the scheduled period, including one observation not used in the initial training set. To effectively combine the strengths of XGBoost, LightGBM, CatBoost, and RF models in the final ranger model trained with TSCV, the prediction values from these models were incorporated as input variables. To capture the temporally distinct characteristics of solar irradiance, the data were divided by the hour of the day, and the input variables for the model were adjusted accordingly. During this process, hour-related variables such as T8 (8 a.m.) to T18 (6 p.m.) were removed to focus better on unique features and patterns of specific hours.
In response to the divided dataset, 11 separate RF models were constructed using the ranger package and TSCV, each tailored to a specific hour of the day. This approach allowed for a better account of the unique characteristics of solar irradiance at each hour, resulting in more accurate predictions of fluctuations and patterns associated with different times of the day. By customizing the models to accommodate these hourly variations, the predictions’ overall forecasting accuracy and reliability can be improved [34]. Furthermore, variable importance values were extracted for each model to ensure the approach’s credibility, providing insights into the factors driving solar irradiance patterns at different hours and periods. This process series is called the hybrid-tree-based ensemble model (HYTREM). By leveraging the hour-dependency dataset and the combined strengths of the XGBoost, LightGBM, CatBoost, and RF models, accurate solar irradiance predictions were efficiently and effectively achieved through HYTREM.

4. Experimental Results

4.1. Experimental Disign

In this study, an experimental environment was designed to develop the HYTREM for day-ahead hourly solar irradiance predictions. The hardware used in the experiment included an Intel(R) Core(TM) i7-9700 CPU @3.00 GHz and 64 GB RAM. For software, data preprocessing was performed using Anaconda 22.9.0 and Python 3.8.0. Additionally, RStudio version R-4.2.2 and R version 4.2.2 (2022-10-31 UCRT) were employed for further data preprocessing and tree-based model construction. This experimental setup facilitated the performance evaluation and optimization of the solar irradiance prediction model.
To compare the prediction performance of the forecasting models, three metrics were employed: mean absolute error (MAE), root mean square error (RMSE), and normalized RMSE (NRMSE), defined by Equations (6)–(8), respectively.
MAE = ∑|PtAt|/n,
RMSE = √(∑(PtAt)2)/n,
NRMSE = RMSE/Aavg × 100,
where At and Pt represent the actual and predicted values at time t, whereas n and Aavg denote the number of observations and the average of actual values, respectively.
In this study, the random state was set to 42 to ensure the reproducibility of the experiments and facilitate comparisons between models trained in the same environment [34]. The optimal hyperparameter values for XGBoost and LightGBM were applied based on previous literature [25]. These values were determined through an extensive grid search experiment conducted on the same dataset, justifying their direct application in this study. For CatBoost, default values were chosen, as the authors stated that they could already yield robust performance [51].
In training the ranger-based RF model, the number of trees was determined based on the study by Oshiro et al. [46], which recommended a value of 128 considering the balance between performance and complexity of the RF. This value had consistently provided high predictive accuracy and stable performance. Additionally, the number of features for RF was specified as 10, considering there were 30 input variables. The random seed was set to 1234 to ensure consistency in the experimentation process, yielding an efficient and accurate RF model.

4.2. Performance Comparison

In this study, experiments were meticulously conducted using the Ildo 1-dong and Gosan-ri testing sets (2017–2018) from Jeju Island as unseen data to assess the performance of the proposed model HYTREM. The primary objective was to compare HYTREM with a range of baseline models that had previously demonstrated remarkable performance in predicting solar irradiance in South Korea. Initially, deep learning models designed for multistep-ahead forecasting were contrasted with HYTREM. These baseline models, some of which were based on attention mechanisms, demonstrated their effectiveness across a wide variety of domains [52,53]. To establish a comparable environment for day-ahead solar irradiance prediction, 11th time points were employed from these models. Subsequently, HYTREM was assessed against tree-based models, specifically, Cubist and LightGBM. For LightGBM, the model incorporated 30 input variables per time point (1 h to 11 h ahead), resulting in a total of 330 input variables. Additionally, Persistence was integrated as a supplementary baseline model, which was a statistical analysis technique frequently used in solar irradiance forecasting studies.
The baseline models comprise:
  • Persistence: A statistical analysis technique employed as a baseline model in various solar irradiance forecasting studies, predicting hourly solar irradiance utilizing historical data from the previous day at the corresponding prediction time point.
  • Att-LSTM [24]: A network amalgamating an attention mechanism (Att) and LSTM, directing the model to focus on specific vectors, yielding superior prediction performance compared to traditional ANN and LSTM networks. The configuration included a sequence length of 11, two hidden layers, a scaled exponential linear unit (SELU) activation function, a Huber loss function, an RMSProp optimizer, a batch size of 11, a learning rate of 0.000001, 5000 epochs, and a single attention layer. The dropout method was implemented to regulate the weight of hidden layers and avoid overfitting.
  • Att-Bi-LSTM [23]: A Bi-LSTM variant utilizing a sequential model with SELU activation function and 11 time steps in length. The model featured two hidden layers and 14 neurons per layer, trained over 150 epochs with a batch size of 11. The loss function, optimizer, and learning rate were Huber loss, Adam, and 0.001, respectively. This variant employed a sequential model with a singular attention layer.
  • Att-GRU [23]: A GRU variant with an identical configuration as the Att-Bi-LSTM model, substituting the GRU architecture for the bidirectional LSTM.
  • Cubist [26]: A model optimized via grid search on the same dataset and implemented on the testing set, demonstrating superior prediction performance compared to other solar irradiance forecasting models, such as DT, bagging, RF, GBM, and XGBoost, across both regions, rendering it suitable for South Korean PV systems.
  • LightGBM [25]: A model encompassing 330 input variables, considering time and weather information supplied by KMA to forecast solar irradiance at various time points within the next 24 h. The model employed a LightGBM-based forecasting approach with dropouts meeting multiple additive regression tree (DART) boosting, substantiated to exhibit enhanced forecasting performance compared to other ensemble-based and deep-learning-based models.
Table 6 presents a detailed comparison of the performance of HYTREM and various baseline models in predicting solar irradiance for the Ildo 1-dong and Gosan-ri testing sets. The table shows the MAE, RMSE, and NRMSE for each model. These metrics provide an overview of the accuracy and reliability of each model in predicting solar irradiance. The table shows that HYTREM significantly outperforms all baseline models, including deep learning models (i.e., Att-LSTM with and without dropout, Att-Bi-LSTM, and Att-GRU), tree-based models (i.e., Cubist and LightGBM), and the Persistence model. The results indicate that HYTREM substantially improves MAE, RMSE, and NRMSE, making it a highly suitable model for day-ahead solar irradiance prediction. The superior performance of HYTREM highlights its potential applicability and effectiveness in solar energy forecasting. This comprehensive comparison provides valuable insights into the capabilities of the proposed model and its potential to enhance solar irradiance predictions in real-world applications.
To showcase the efficacy of the proposed methodology, experiments were carried out on a few distinct scenarios.
  • Case One: Time-based data segregation with original input variables—the data were separated based on time points while retaining the original input variables. The output values from RF, XGBoost, LightGBM, and CatBoost models were not included as input variables. TSCV was implemented using the ranger model.
  • Case Two: Hybrid approach without TSCV—this case utilized a hybrid approach, incorporating the output values from RF, XGBoost, LightGBM, and CatBoost models as input variables. However, TSCV was not applied.
  • Case Three: The proposed HYTREM—this case represented the proposed model, which combined the strengths of the methods in the previous cases and leveraged the HYTREM approach for optimal results.
Table 7 and Table 8 display the performance comparison of the three cases for the Ildo 1-dong and Gosan-ri regions. The performance metrics used for comparison are MAE, RMSE, and NRMSE. Table 7 shows the performance of the three cases compared for Ildo 1-dong across different hours. Case Three (the proposed HYTREM) generally outperforms Cases One and Two regarding MAE, RMSE, and NRMSE. The average values at the bottom of the table further illustrate that HYTREM provides better accuracy and prediction reliability. Similar to Table 7, Table 8 presents the performance comparison of the three cases for the Gosan-ri region. Again, HYTREM (Case Three) demonstrates improved performance over the other cases. The average values at the end of the table indicate that the proposed model offers more accurate predictions and greater reliability for the Gosan-ri region. In summary, both Table 7 and Table 8 show that HYTREM generally outperforms the other cases, making it a more effective approach for solar irradiance prediction in both Ildo 1-dong and Gosan-ri regions.

4.3. Model Interpretation

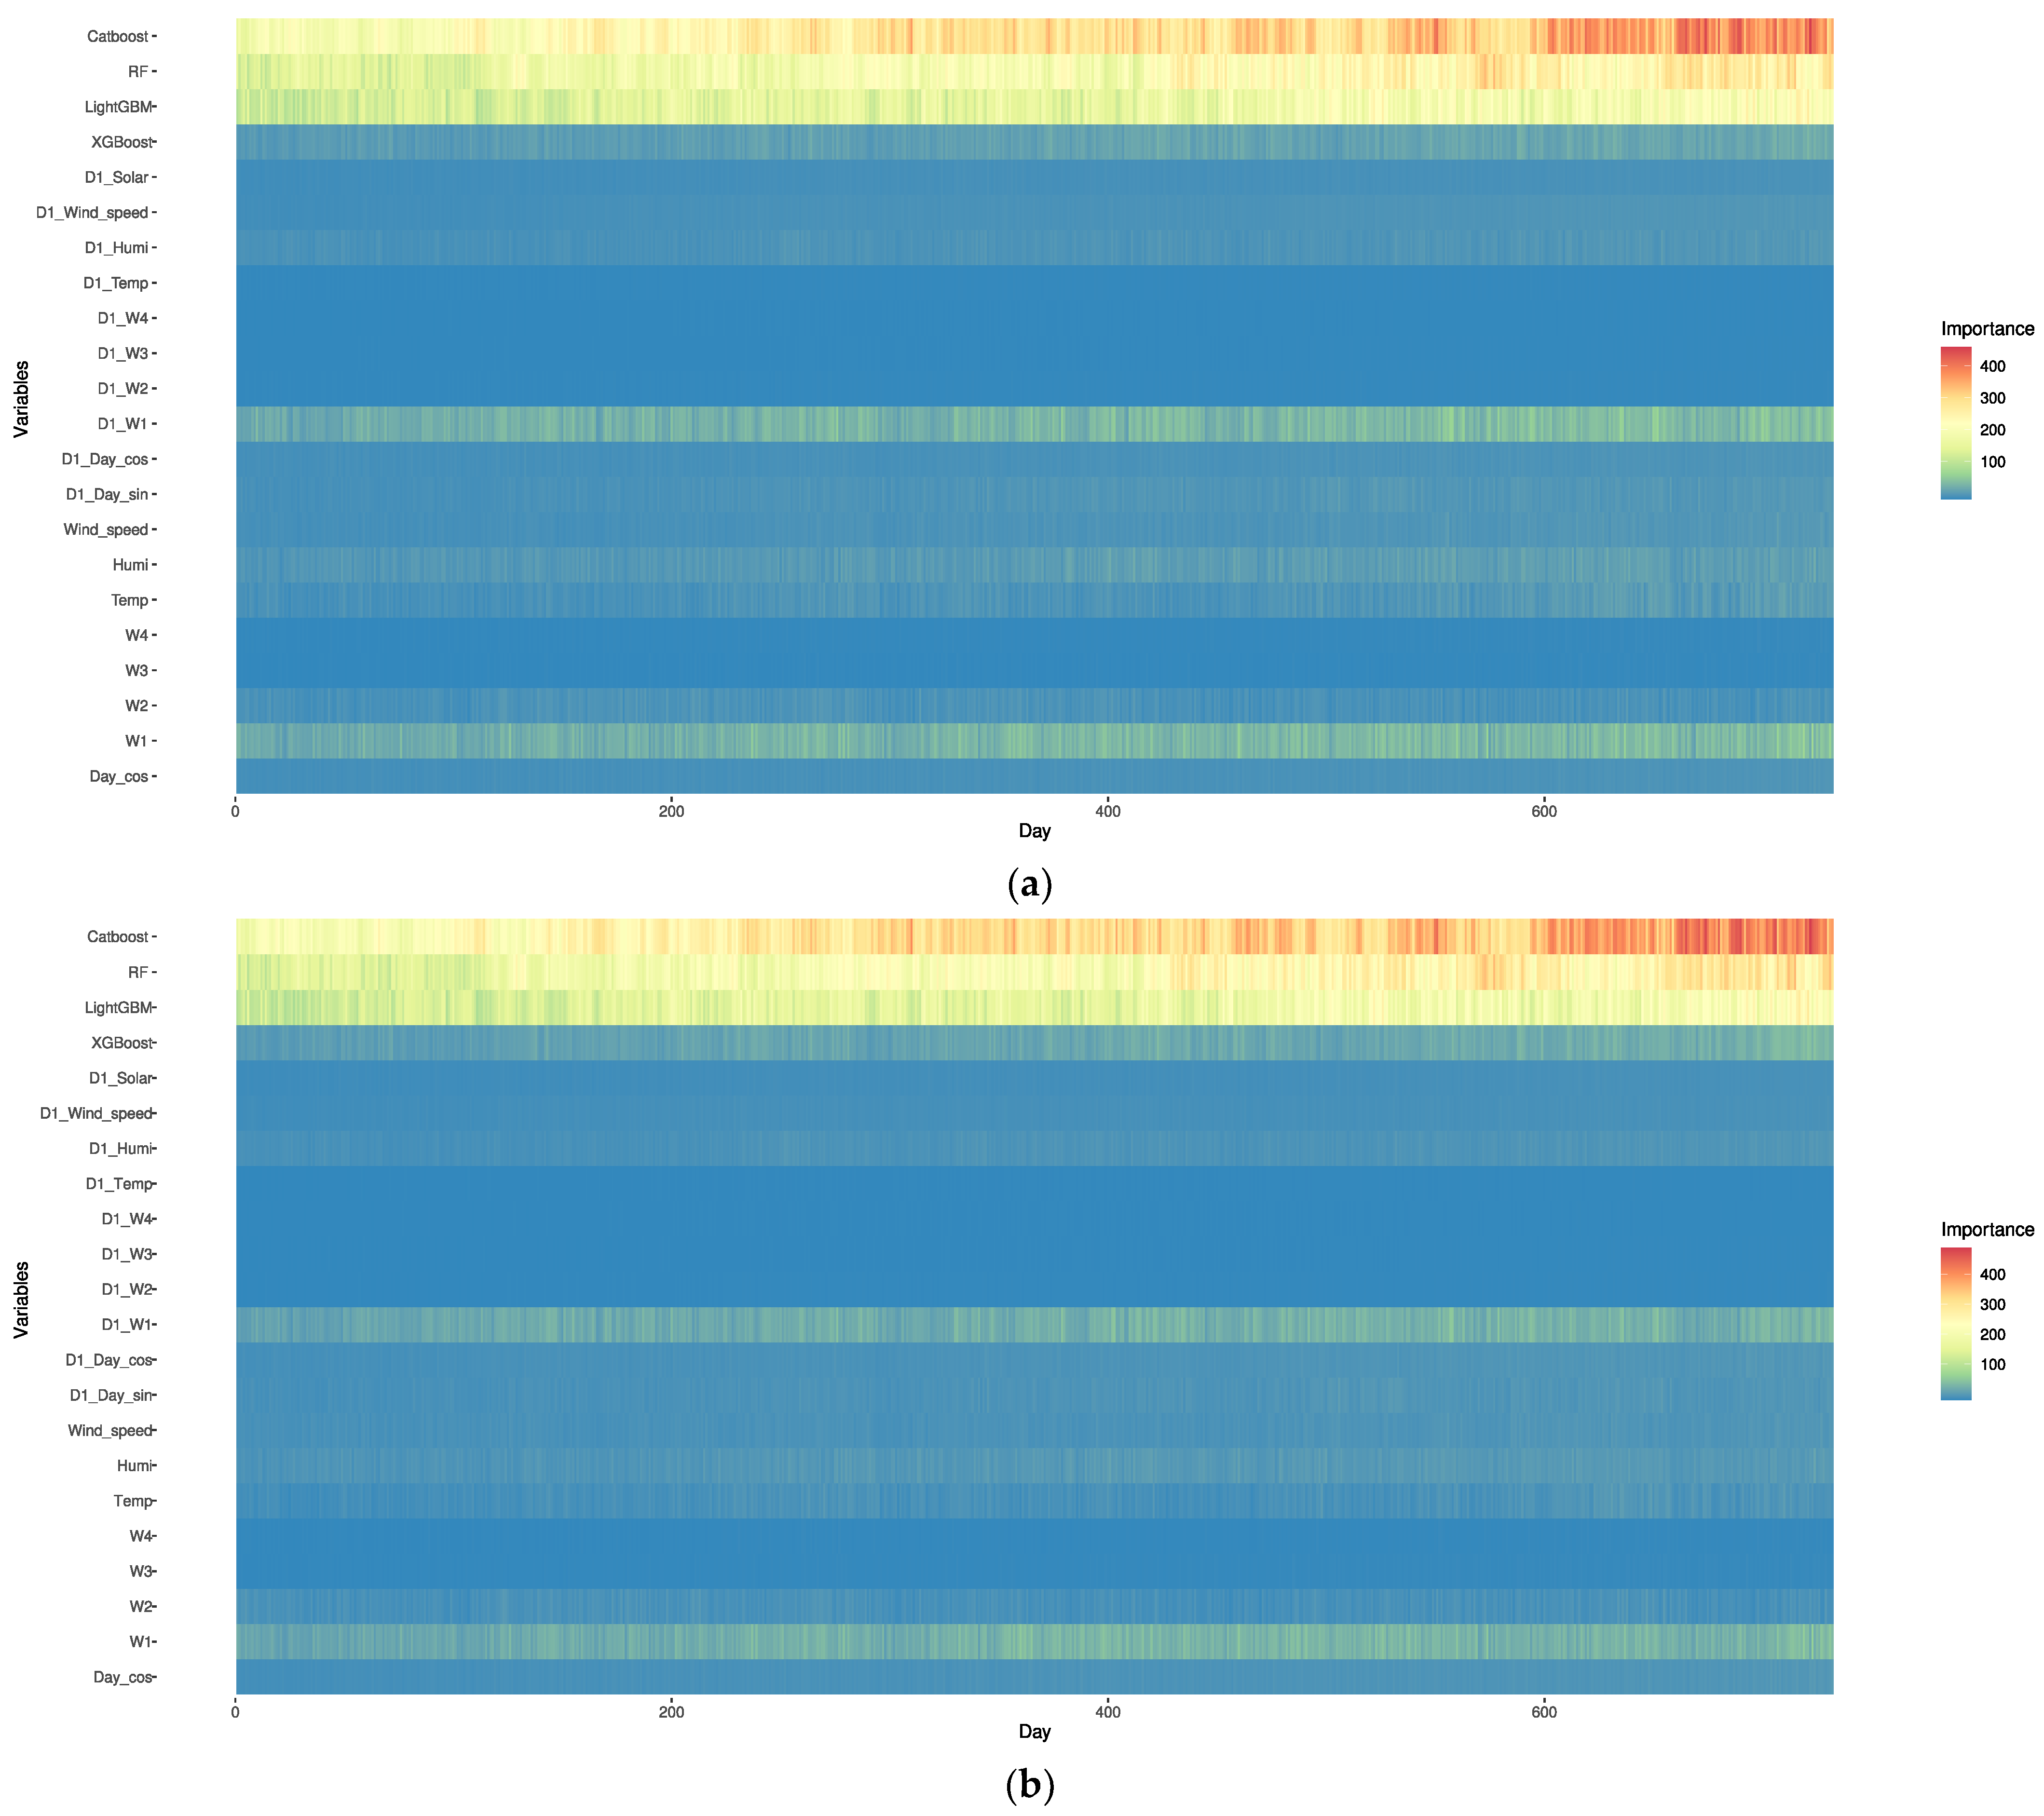
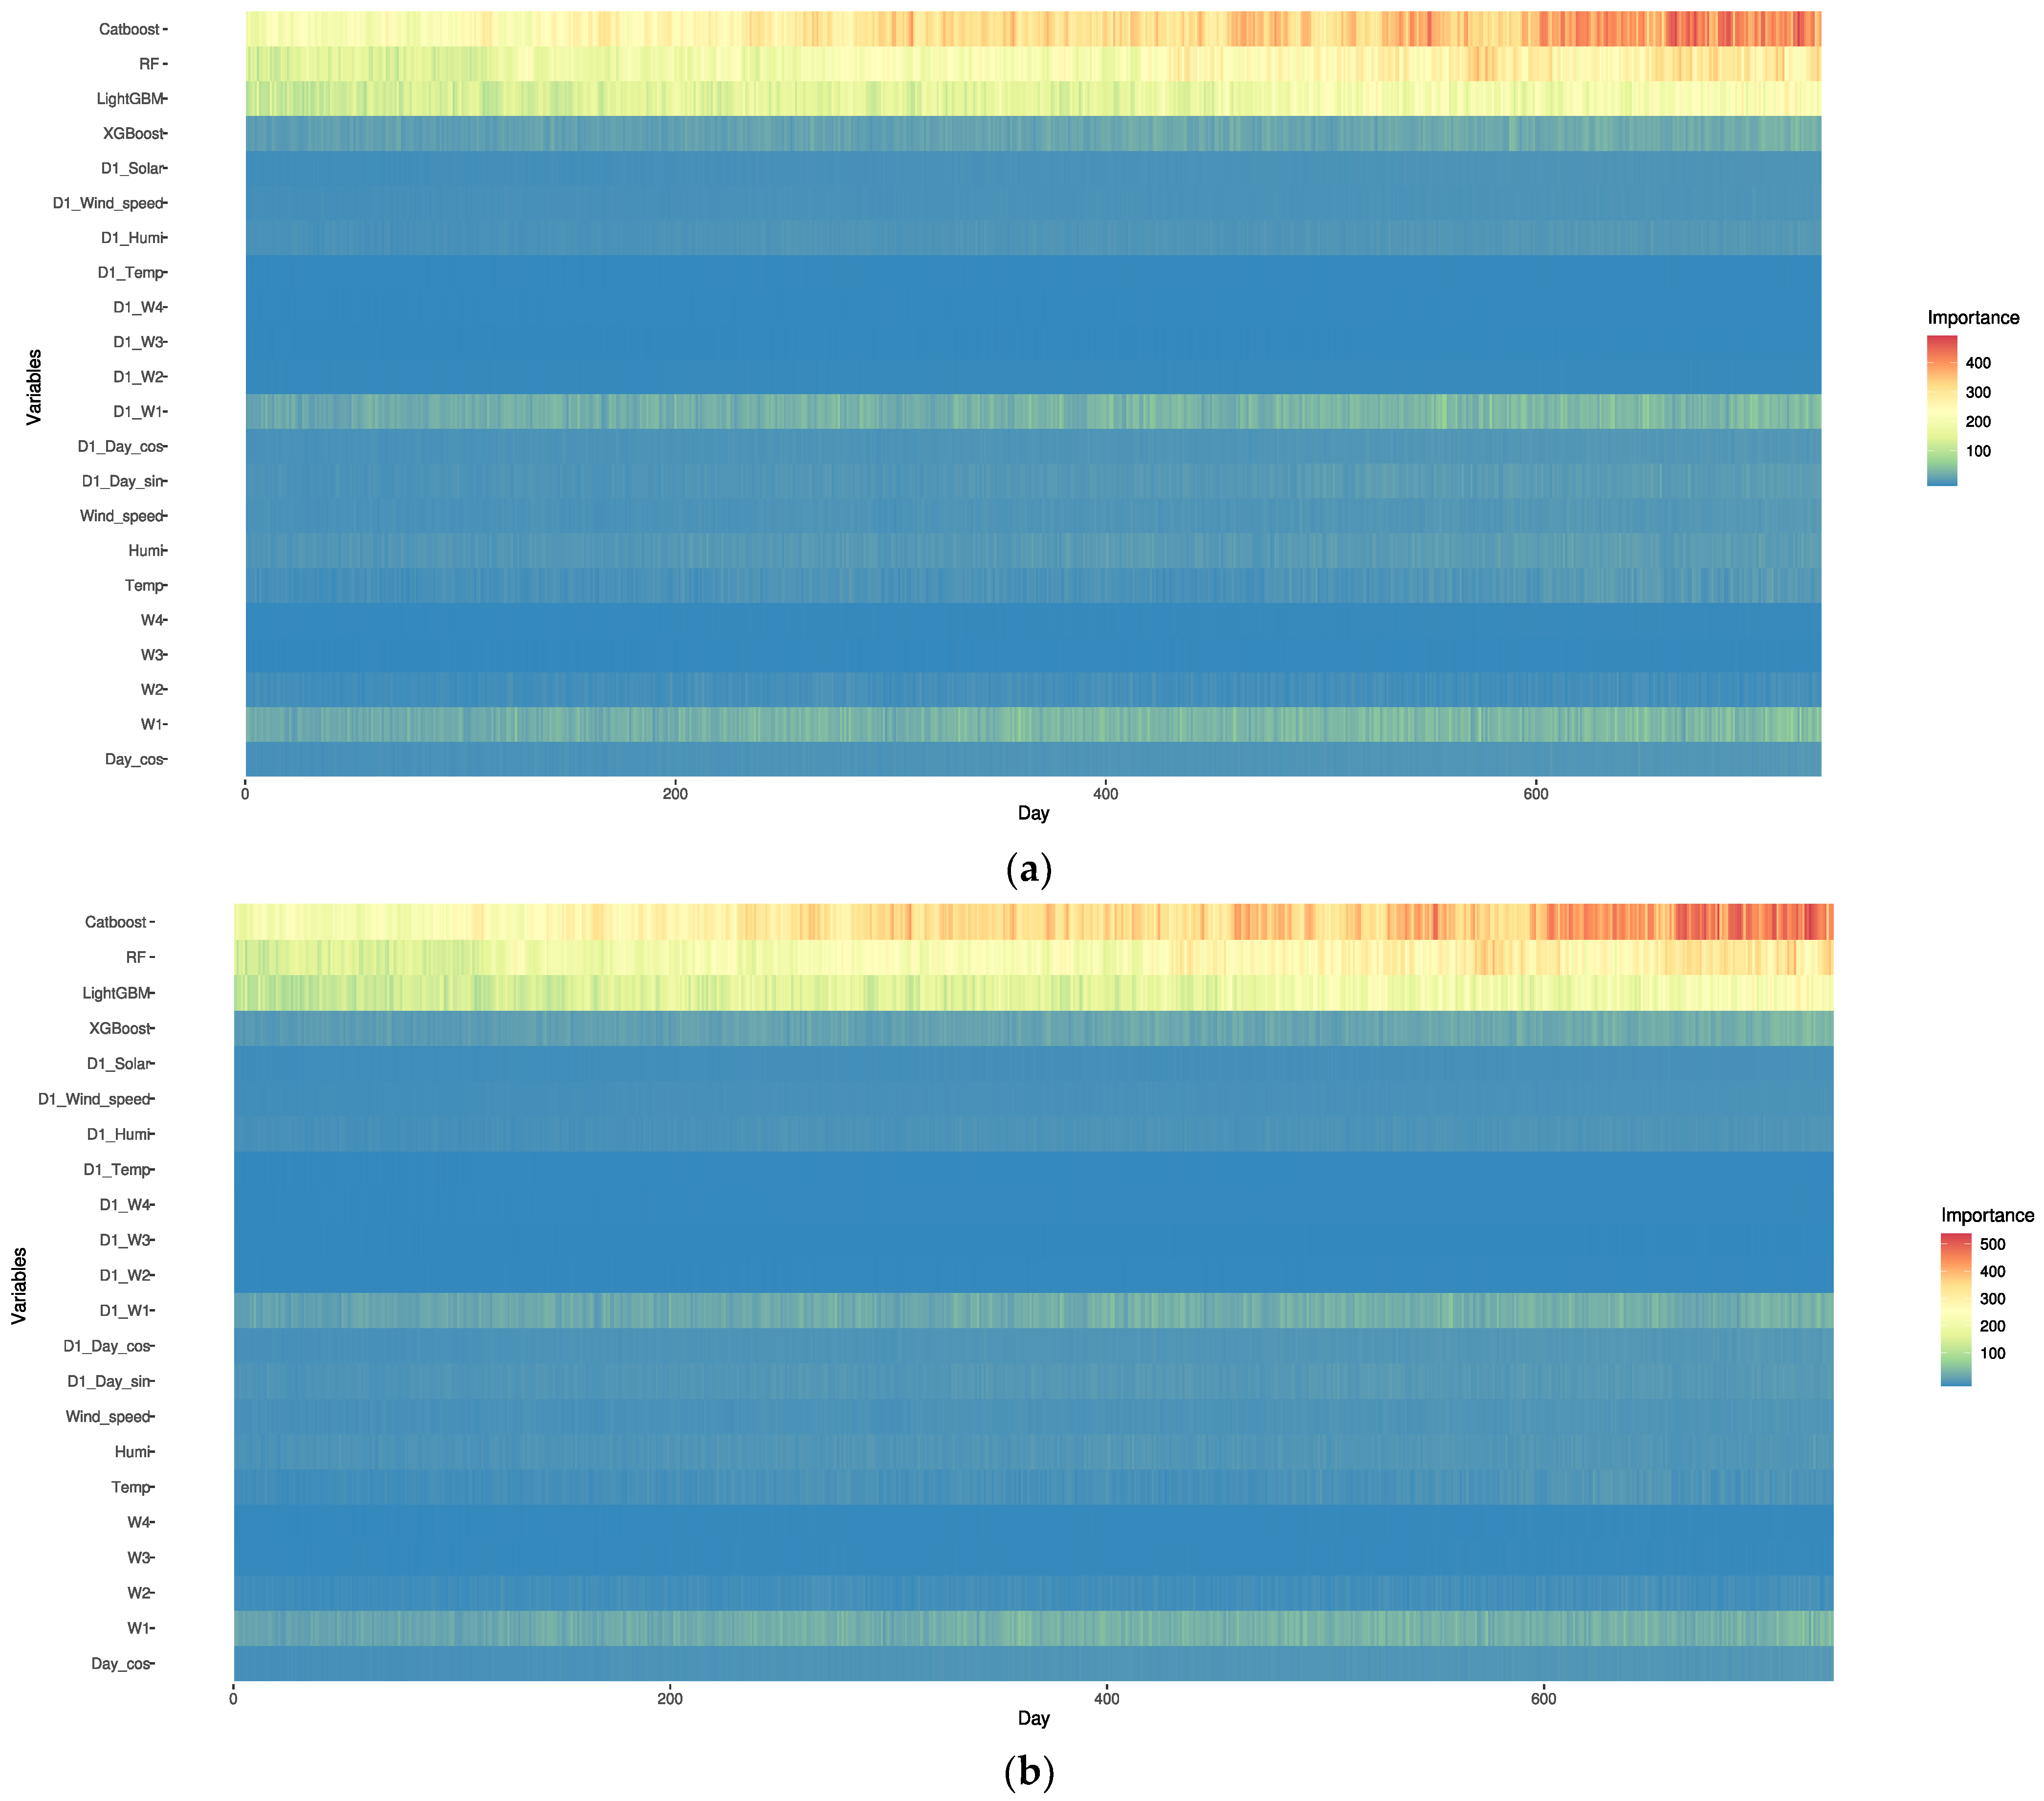
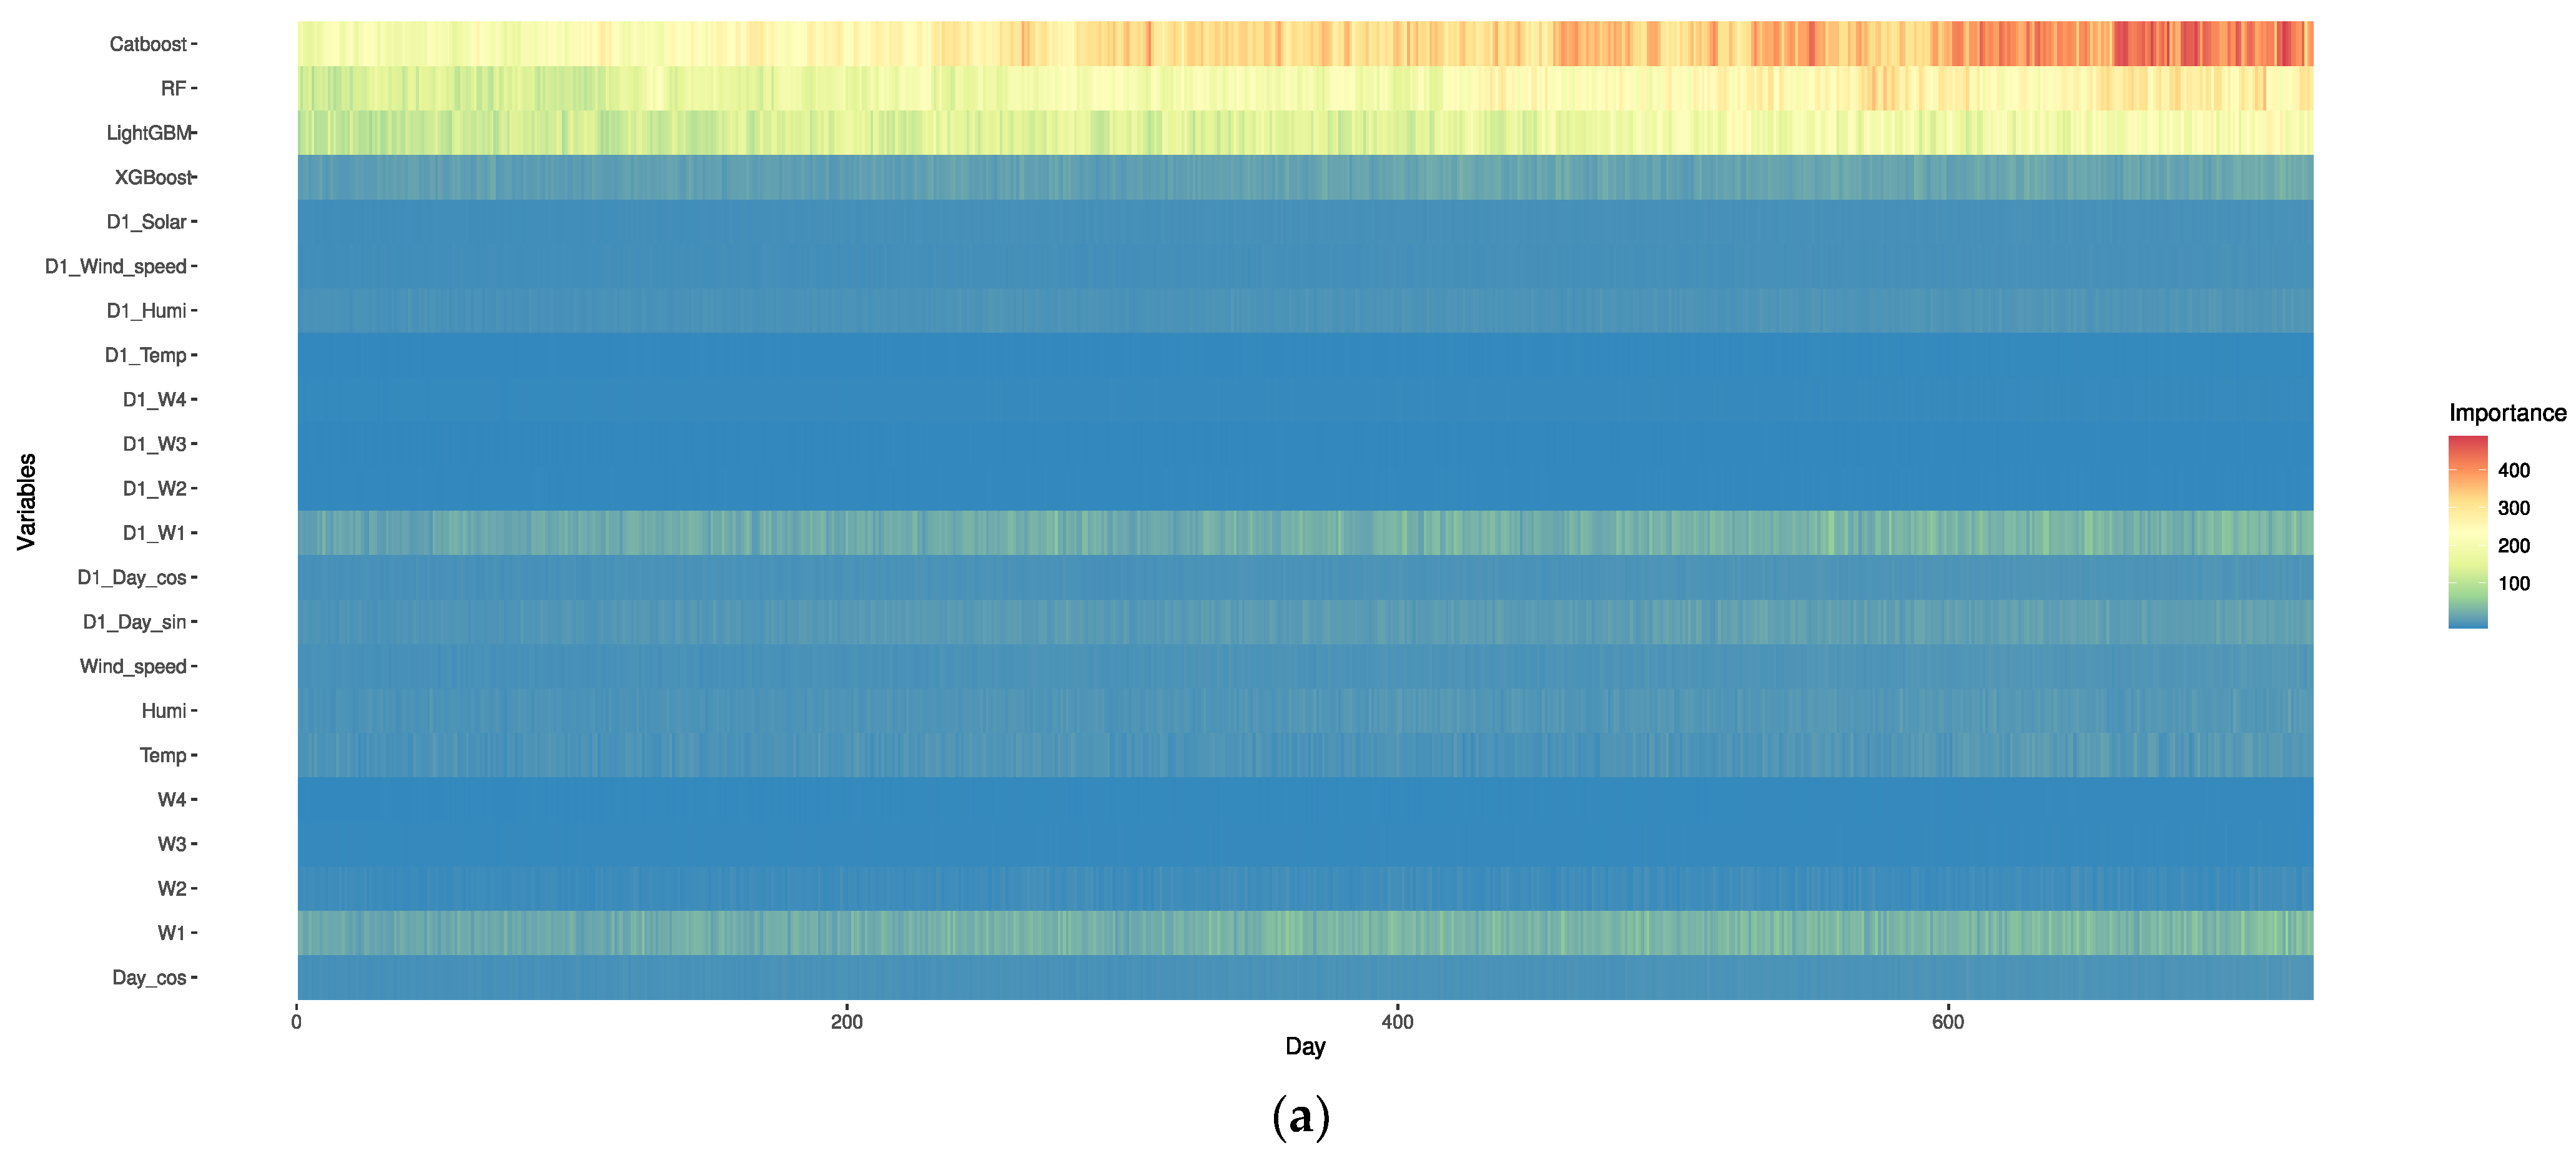
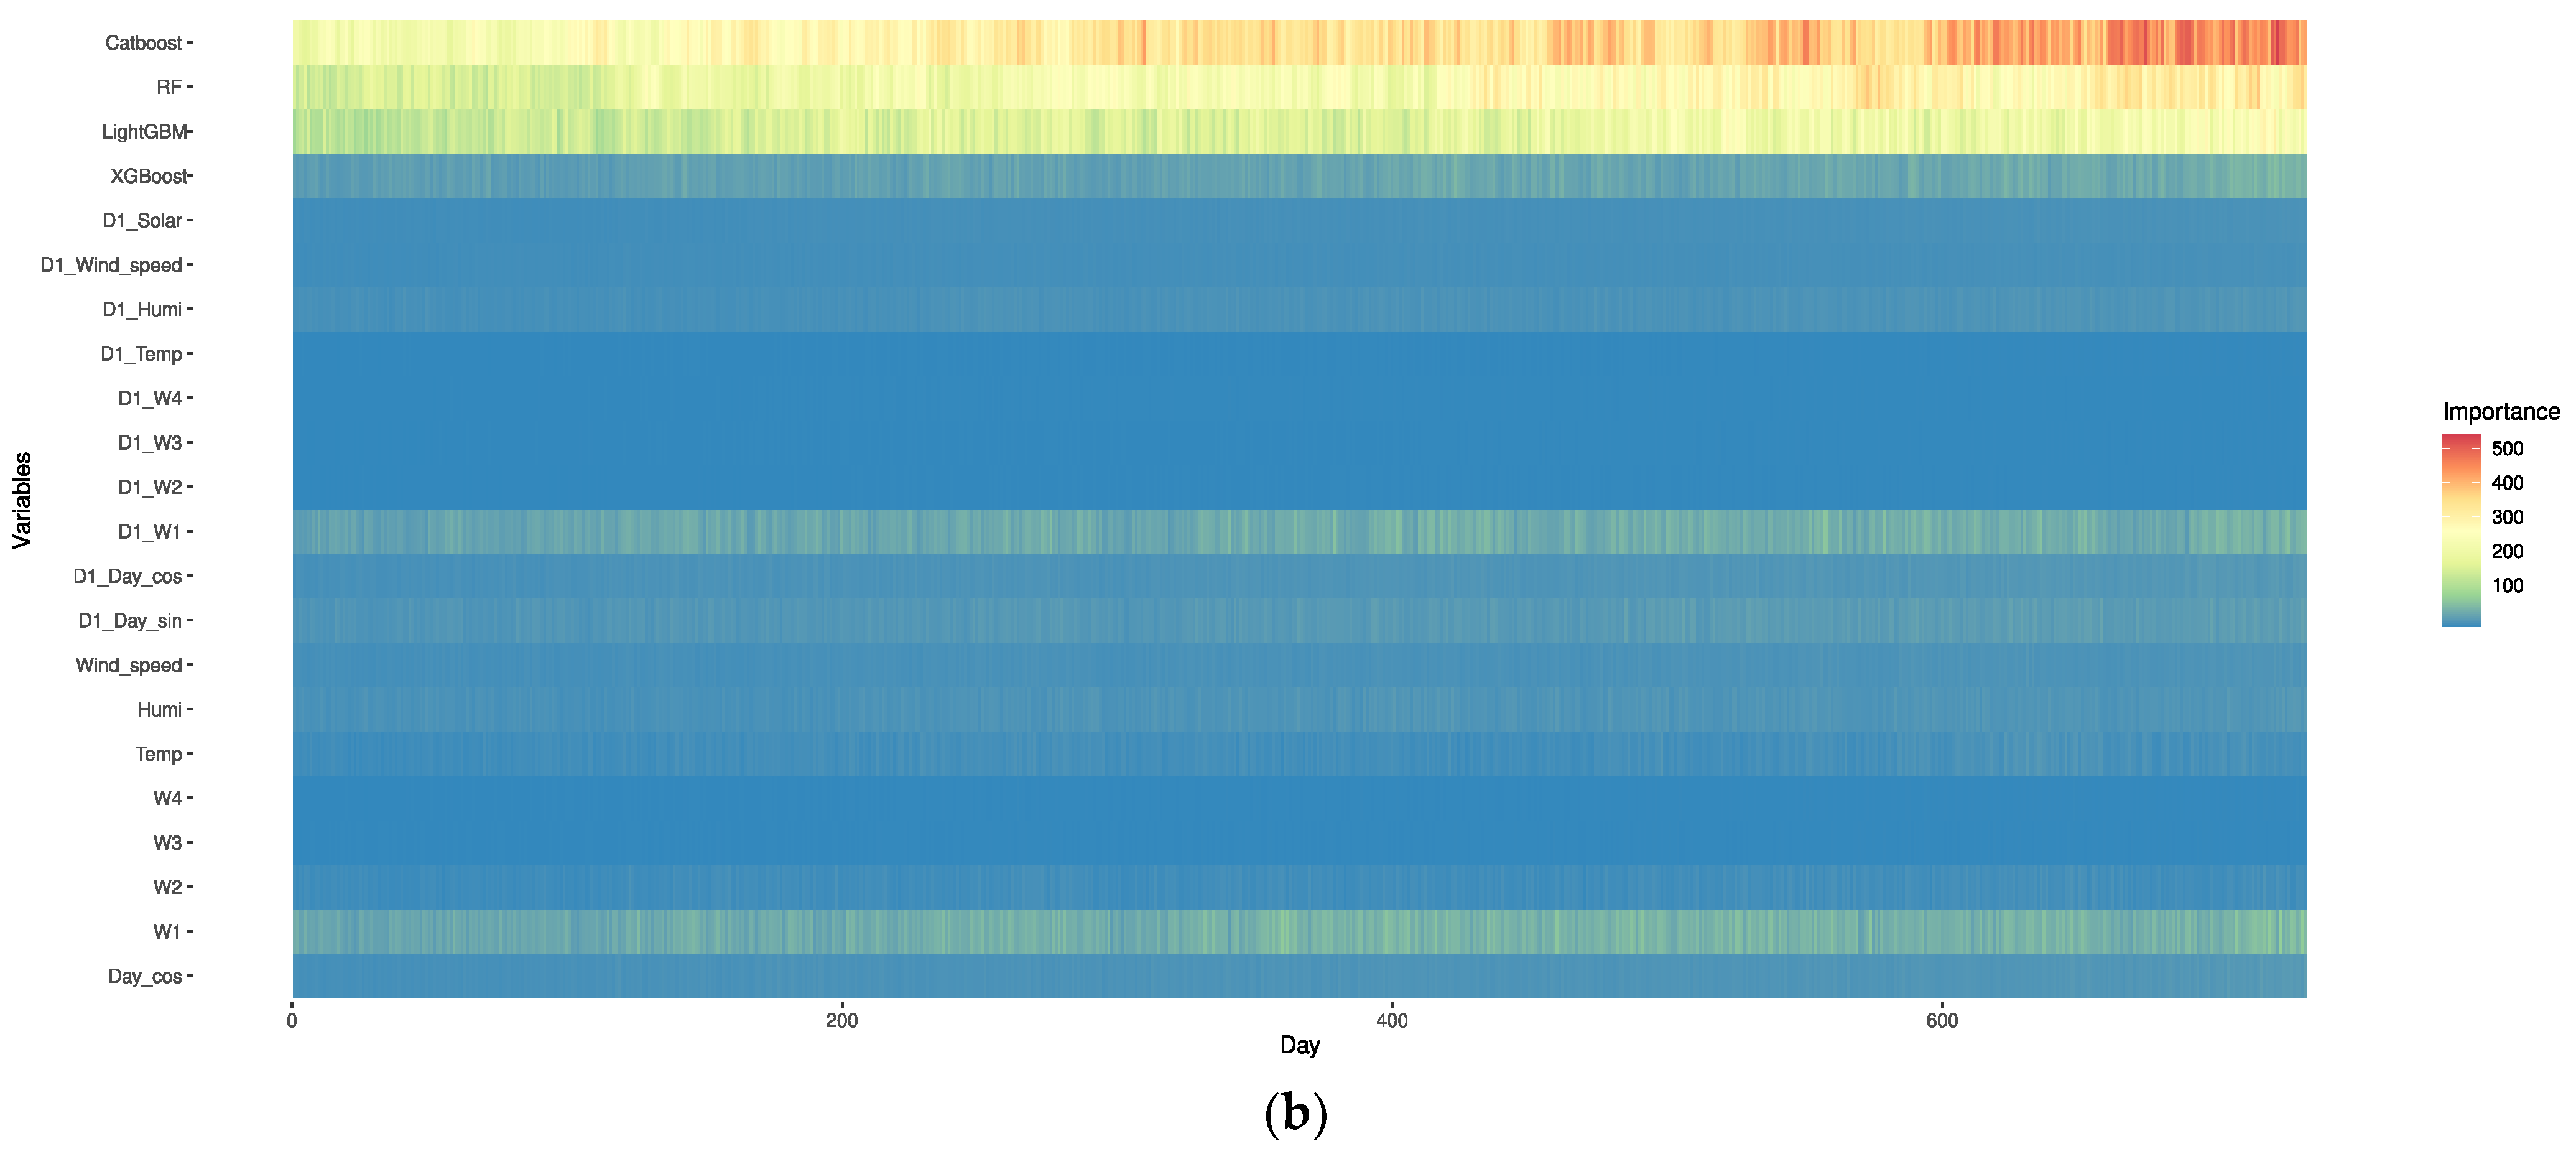
Ensuring the reliability of a model was crucial, and interpretability methods have become increasingly important for achieving this objective. This study focused on identifying significant factors within the hourly HYTREMs. Variable importance is a technique that assigns scores to independent variables based on their relative contribution to accurate predictions [26,37,49]. The ‘vip’ library [54], one of the many visualization libraries in the R programming language, was used to visualize the variable importance. This study specifically concentrated on visualizing the variable importance of the RF model from noon to 2 p.m. This time frame typically corresponded to peak solar irradiance, contributing significantly to actual PV power generation [55,56]. Therefore, understanding the variable importance during this period became crucial for interpreting the behavior of the RF model. For a comprehensive understanding of variable importance during other time intervals, specifically, from 8 a.m. to 11 a.m. and 3 p.m. to 6 p.m., these details are made available in the Supplementary Materials.
Figure 4, Figure 5 and Figure 6 present the variable importance of the HYTREMs for each hour, whereas Table 4 and Table 5 offer a list of the input variables. In these figures, the outcomes of XGBoost, LightGBM, CatBoost, and RF represent the predicted values generated by each respective model. The research in this study highlighted the significant role of predicted values from EL models (XGBoost, LightGBM, CatBoost, and RF) in solar irradiance prediction. CatBoost demonstrated consistent importance, as indicated by the variable importance values (Figure 4, Figure 5 and Figure 6) showing the highest levels and an increasing trend over time. Supporting evidence for CatBoost’s superiority can be found in Table 4 and Table 5, which present the PCCs. In both Ildo 1-dong and Gosan-ri, CatBoost exhibited higher correlation coefficients (0.970 and 0.968, respectively) compared to XGBoost, LightGBM, and RF. Table 9 also revealed that CatBoost achieved the highest R-squared values, further establishing its leading position among the models.
While XGBoost and LightGBM also performed strongly, with R-squared values ranging from 0.819 to 0.880 (Table 9), the consistency and increasing trend in CatBoost’s variable importance values, along with its superior PCCs and R-squared values, underscored its crucial role in predicting solar irradiance. EL models could effectively identify diverse patterns and relationships in the data, which were particularly important when dealing with complex, non-linear, and high-dimensional data, such as solar irradiance prediction. Additionally, these models exhibited robustness and reduced overfitting. By integrating the outputs of different models, EL reduced the risk of over-dependence on a single model, resulting in more reliable and stable predictions.
The significance of CatBoost’s performance, particularly through the lens of its ordered boosting capability, was validated by the R-squared values demonstrated in Table 9. Notably, despite all categorical data in the dataset being one-hot encoded beforehand, CatBoost delivered superior performance across two locations such as Ildo 1-dong and Gosan-ri, during the training and testing phases. Specifically, CatBoost exhibited high R-squared values of 0.935 and 0.940 for Ildo 1-dong in the training and testing phases, respectively, and 0.932 and 0.926 for Gosan-ri. These results reflected the robustness of CatBoost’s ordered boosting algorithm, allowing for more accurate and reliable predictions of solar irradiance levels under various weather conditions [51]. Therefore, the assertion that CatBoost’s values were particularly important was not merely based on its handling of categorical features but more significantly on the strength and effectiveness of its ordered boosting approach, as confirmed by these R-squared results [43,51].

5. Discussion

Further investigation has been conducted to demonstrate the robustness and wide applicability of the proposed HYTREM beyond the context of Jeju Island, extending to diverse geographical regions. A previous study [23] investigated the solar irradiance in Seoul, Busan, and Incheon, three metropolitan cities that actively utilize renewable energy resources, and highlighted the impressive integration of infrastructure resources in these cities, which has propelled the successful implementation of smart city initiatives. From 2011 to 2020, solar irradiance data were consistently gathered every hour from 8 a.m. to 6 p.m. The same 34 input variables in this research were assembled for day-ahead hourly solar irradiance forecasting. The data from 2011 to 2018 and 2019 to 2020 were utilized as this experiment’s training and testing sets, respectively.
As evidenced in Table 10, when the HYTREM’s performance was compared to that of Att-LSTM, Att-Bi-LSTM, and Att-GRU models, it displayed superior outcomes across all cities. More specifically, for Seoul, HYTREM reported an MAE, RMSE, and NRMSE of 0.129, 0.193, and 15.535, respectively. These scores were significantly lower than those of the Att-LSTM, Att-Bi-LSTM, and Att-GRU models, demonstrating HYTREM’s robust predictive power. Similar trends were observed in Busan and Incheon, further reinforcing HYTREM’s superior performance in forecasting solar irradiance. In conclusion, these findings highlighted the broad applicability and versatility of HYTREM, reinforcing its potential to generate accurate solar irradiance predictions in diverse geographical and climatic conditions. Nevertheless, it was advised that the model be fine-tuned and validated with local data for each specific application to ensure optimal performance.
Nevertheless, despite its demonstrated capabilities, transitioning HYTREM from its current digital state to the desired digital twin technology will require addressing certain limitations and outlining areas for improvement.
  • The dialogue between scientific advances and recognizing their limitations naturally guides the evolution of new ideas and avenues for future research. While HYTREM showcases commendable predictive accuracy in forecasting solar irradiance across major South Korean cities such as Jeju Island, Seoul, Busan, and Incheon, it recognizes certain limitations. These include the need for further refinement to accommodate diverse global conditions such as the Sahara desert’s intense heat, the Andes’ high altitudes, or the cool climates of Scandinavia.
  • In its current form, the model represents a digital model rather than the aspirational digital twin technology. Its enhancement, in this regard, would necessitate the integration of key aspects of digital twin technology, including synchronization in terms of time and data and the reciprocal communication between the digital twin and its physical counterpart.
  • Additionally, the architecture encompassing the digital and physical twins must be included. This highlights an area ripe for growth and expansion in the model’s scope.
  • Although HYTREM exhibits significant promise, the accuracy and reliability of its forecasts are largely contingent on the quality and diversity of the available data. Hence, while potentially broad, its applicability to various geographical and climatic conditions requires additional validation against a more extensive dataset.
Considering these identified limitations, various promising avenues have been envisioned for future research and development.
  • Future research should enhance the model by integrating the crucial elements of digital twin technology, including synchronization and communication aspects, and establishing a comprehensive architecture to house both the digital twin and its physical twin.
  • There is a need to expand the dataset used for training the model. This would facilitate a more comprehensive validation of the model’s effectiveness and improve its accuracy across diverse geographical regions and climatic conditions.
  • As a long-term ambition, the evolution of the current digital model into a fully-fledged digital twin technology is proposed. The current study serves as a foundational step towards developing such advanced models, setting the course for digital twin technology as a significant future direction for this line of research.
  • Lastly, considering Jeju Island’s commitment to evolving into a digital twin-based smart island, a promising direction for future research is applying the model to support the island’s sustainable development initiatives. This could involve leveraging the model to optimize renewable energy generation, encourage eco-friendly transportation, and improve intelligent energy management systems on the island, thus potentially contributing to the island’s pioneering efforts in sustainable development and digital innovation.

6. Conclusions

The research presented in this paper developed a hybrid ensemble model, named HYTREM, which aimed at robust solar irradiance forecasting primarily for Jeju Island. The objective was to enhance the efficiency of solar photovoltaic power systems, given the Island’s unique commitment to becoming a digital twin-based smart island. Nevertheless, the model was envisioned as a versatile tool that, albeit currently limited in its digital twin features, demonstrated potential in accurate solar irradiance prediction utilizing diverse weather observation data. The HYTREM used various input variables, including timestamp, weather, historical solar irradiance, and predicted values of tree-based EL models, including RF, XGBoost, LightGBM, and CatBoost, which had a strong relationship with solar irradiance. It was acknowledged that solar irradiance patterns differed for each hour. Separate ranger-based RF models were built, enabling more accurate predictions while catering to energy providers with limited computational resources. An online learning model trained on these input variables through TSCV was constructed to effectively reflect recent solar irradiance trends and patterns by each hour of the day.
As presented in Table 6, the experimental results demonstrated that the proposed HYTREM outperformed the state-of-the-art forecasting models regarding MAE, RMSE, and NRMSE values across both regions. Compared to the baseline models, HYTREM achieved significant improvements in prediction accuracy. Specifically, in the Ildo 1-dong testing set, HYTREM reduced the MAE by approximately 74.3% compared to Att-LSTM w/dropout, 64.8% compared to Att-LSTM w/o dropout, 56.4% compared to Att-Bi-LSTM, 59.2% compared to Att-GRU, 61.6% compared to Cubist, 61.1% compared to LightGBM, and 74.3% compared to the Persistence model. Similarly, in the Gosan-ri testing set, HYTREM achieved reductions of approximately 64.1%, 62.6%, 47.7%, 46.4%, 61.4%, 44.2%, and 80.1% in MAE compared to the respective baseline models mentioned earlier. These results confirmed the superior performance of HYTREM in day-ahead solar irradiance prediction and established it as the most accurate model among the compared state-of-the-art models. The exceptional performance of HYTREM showcased its potential applicability and effectiveness in real-world solar energy forecasting. This comprehensive comparison provided robust evidence supporting the capabilities of the proposed model and its significant enhancements in solar irradiance predictions, ensuring reliable decision-making for renewable energy management.
The research is significant in fostering interdisciplinary innovation and enhancing real-world applicability in renewable energy management. Exploring other ensemble methods to improve the model’s performance further and investigating its robustness under extreme weather conditions can provide insights into its resilience to unexpected changes in weather patterns. In addition, assessing the model’s impact on the overall power system will help evaluate its effectiveness in enhancing the efficiency of solar power generation systems and inform decisions about its wider adoption. This could promote the widespread adoption of solar energy and sustainable development on Jeju Island and other regions.
However, it should be noted that the conclusions drawn from this study have been mainly based on data from Jeju Island. While the model can potentially be applied to other regions, the implications may vary due to differences in geographical and climatic conditions. Future research should validate the model with diverse datasets to ensure its robustness and applicability in different geographical contexts, such as plains, plateaus, hills, or mountains, and include integrating digital twin technology features into the model, enhancing synchronization and interaction between the digital twin and its physical counterpart.

Supplementary Materials

The following supporting information can be downloaded at: https://www.mdpi.com/article/10.3390/electronics12122607/s1, Figure S1. Variable importance heatmap of HYTREM for 8 a.m. Figure S2. Variable importance heatmap of HYTREM for 9 a.m. Figure S3. Variable importance heatmap of HYTREM for 10 a.m. Figure S4. Variable importance heatmap of HYTREM for 11 a.m. Figure S5. Variable importance heatmap of HYTREM for 3 p.m. Figure S6. Variable importance heatmap of HYTREM for 4 p.m. Figure S7. Variable importance heatmap of HYTREM for 5 p.m. Figure S8. Variable importance heatmap of HYTREM for 6 p.m. Table S1. Solar irradiance dataset for Ildo 1-dong in Jeju Island. Table S2. Solar irradiance dataset for Gosan-ri in Jeju Island.

Author Contributions

Conceptualization, D.S., J.O. and H.H.; methodology, D.S.; software, D.S. and J.O.; validation, J.O. and S.L.; formal analysis, J.O. and S.L.; investigation, H.H.; resources, H.H.; data curation, D.S. and J.M.; writing—original draft preparation, D.S. and S.L.; writing—review and editing, J.M.; visualization, J.O.; supervision, J.M.; project administration, J.M.; funding acquisition, J.M. All authors have read and agreed to the published version of the manuscript.

Funding

This study was supported by the Soonchunhyang University Research Fund (No. 20221183) and supported by the Basic Science Research Program (No. 2021R1A6A3A01087277) through the NRF funded by the Ministry of Education.

Institutional Review Board Statement

Not applicable.

Data Availability Statement

The data presented in this study are available in the Supplementary Materials.

Acknowledgments

We would like to express our sincere gratitude to the three reviewers for their insightful and valuable feedback, which has helped us improve our work.

Conflicts of Interest

The authors declare no conflict of interest.

References

  1. Smart City Korea. Jeju Island Realizes Smart Island Using Digital Twin. Available online: https://smartcity.go.kr/en/2021/08/18/ (accessed on 10 April 2023).
  2. Smart City Korea. Jeju City Signs Business Agreement to Build Jeju Smart City Digital Twin. Available online: https://smartcity.go.kr/en/2021/11/18/ (accessed on 10 April 2023).
  3. Jeju—Invest Korea. Carbon-Free Island 2030 Project. Available online: https://www.investkorea.org/jj-en/cntnts/i-1506/web.do (accessed on 10 April 2023).
  4. Alzahrani, A.; Petri, I.; Rezgui, Y.; Ghoroghi, A. Decarbonisation of seaports: A review and directions for future research. Energy Strategy Rev. 2021, 38, 100727. [Google Scholar] [CrossRef]
  5. Saboori, H.; Mohammadi, M.; Taghe, R. Virtual power plant (VPP), definition, concept, components and types. In Proceedings of the 2011 Asia-Pacific Power and Energy Engineering Conference, Wuhan, China, 25–28 March 2011; pp. 1–4. [Google Scholar]
  6. Arraño-Vargas, F.; Konstantinou, G. Modular design and real-time simulators toward power system digital twins implementation. IEEE Trans. Ind. Inform. 2022, 19, 52–61. [Google Scholar] [CrossRef]
  7. Green, R.C.; Wang, L.; Alam, M. Applications and trends of high performance computing for electric power systems: Focusing on smart grid. IEEE Trans. Smart Grid 2013, 4, 922–931. [Google Scholar] [CrossRef]
  8. Palma-Behnke, R.; Benavides, C.; Lanas, F.; Severino, B.; Reyes, L.; Llanos, J.; Sáez, D. A microgrid energy management system based on the rolling horizon strategy. IEEE Trans. Smart Grid 2013, 4, 996–1006. [Google Scholar] [CrossRef] [Green Version]
  9. Teng, S.Y.; Touš, M.; Leong, W.D.; How, B.S.; Lam, H.L.; Máša, V. Recent advances on industrial data-driven energy savings: Digital twins and infrastructures. Renew. Sustain. Energy Rev. 2021, 135, 110208. [Google Scholar] [CrossRef]
  10. Borowski, P.F. Digitization, digital twins, blockchain, and industry 4.0 as elements of management process in enterprises in the energy sector. Energies 2021, 14, 1885. [Google Scholar] [CrossRef]
  11. Dincer, F. The analysis on photovoltaic electricity generation status, potential and policies of the leading countries in solar energy. Renew. Sustain. Energy Rev. 2011, 15, 713–720. [Google Scholar] [CrossRef]
  12. Shahsavari, A.; Akbari, M. Potential of solar energy in developing countries for reducing energy-related emissions. Renew. Sustain. Energy Rev. 2018, 90, 275–291. [Google Scholar] [CrossRef]
  13. Mitrašinović, A.M. Photovoltaics advancements for transition from renewable to clean energy. Energy 2021, 237, 121510. [Google Scholar] [CrossRef]
  14. Moon, J.; Kim, Y.; Son, M.; Hwang, E. Hybrid short-term load forecasting scheme using random forest and multilayer perceptron. Energies 2018, 11, 3283. [Google Scholar] [CrossRef] [Green Version]
  15. Ahmed, R.; Sreeram, V.; Mishra, Y.; Arif, M.D. A review and evaluation of the state-of-the-art in PV solar power forecasting: Techniques and optimization. Renew. Sustain. Energy Rev. 2020, 124, 109792. [Google Scholar] [CrossRef]
  16. Sudharshan, K.; Naveen, C.; Vishnuram, P.; Krishna Rao Kasagani, D.V.S.; Nastasi, B. Systematic Review on Impact of Different Irradiance Forecasting Techniques for Solar Energy Prediction. Energies 2022, 15, 6267. [Google Scholar] [CrossRef]
  17. Li, P.; Zhou, K.; Lu, X.; Yang, S. A hybrid deep learning model for short-term PV power forecasting. Appl. Energy 2020, 259, 114216. [Google Scholar] [CrossRef]
  18. Chaibi, M.; Benghoulam, E.L.; Tarik, L.; Berrada, M.; Hmaidi, A.E. An interpretable machine learning model for daily global solar radiation prediction. Energies 2021, 14, 7367. [Google Scholar] [CrossRef]
  19. Ghimire, S.; Nguyen-Huy, T.; Deo, R.C.; Casillas-Perez, D.; Salcedo-Sanz, S. Efficient daily solar radiation prediction with deep learning 4-phase convolutional neural network, dual stage stacked regression and support vector machine CNN-REGST hybrid model. Sustain. Mater. Technol. 2022, 32, e00429. [Google Scholar] [CrossRef]
  20. Ghimire, S.; Bhandari, B.; Casillas-Perez, D.; Deo, R.C.; Salcedo-Sanz, S. Hybrid deep CNN-SVR algorithm for solar radiation prediction problems in Queensland, Australia. Eng. Appl. Artif. Intell. 2022, 112, 104860. [Google Scholar] [CrossRef]
  21. Santos, D.S.D.O., Jr.; de Mattos Neto, P.S.G.; de Oliveira, J.F.L.; Siqueira, H.V.; Barchi, T.M.; Lima, A.R.; Madeiro, F.; Dantas, D.A.P.; Converti, A.; Pereira, A.C.; et al. Solar Irradiance Forecasting Using Dynamic Ensemble Selection. Appl. Sci. 2022, 12, 3510. [Google Scholar] [CrossRef]
  22. Park, J.; Park, S.; Shim, J.; Hwang, E. Domain Hybrid Day-Ahead Solar Radiation Forecasting Scheme. Remote Sens. 2023, 15, 1622. [Google Scholar] [CrossRef]
  23. Moon, J.; Han, Y.; Chang, H.; Rho, S. Multistep-Ahead Solar Irradiance Forecasting for Smart Cities Based on LSTM, Bi-LSTM, and GRU Neural Networks. J. Soc. E-Bus. Stud. 2022, 27, 27–52. [Google Scholar] [CrossRef]
  24. Jung, S.; Moon, J.; Park, S.; Hwang, E. A Probabilistic Short-Term Solar Radiation Prediction Scheme Based on Attention Mechanism for Smart Island. KIISE Trans. Comput. Pract. 2019, 25, 602–609. [Google Scholar] [CrossRef]
  25. Park, J.; Moon, J.; Jung, S.; Hwang, E. Multistep-ahead solar radiation forecasting scheme based on the light gradient boosting machine: A case study of Jeju Island. Remote Sens. 2020, 12, 2271. [Google Scholar] [CrossRef]
  26. Moon, J.; Shin, Z.; Rho, S.; Hwang, E. A Comparative analysis of tree-based models for day-ahead solar irradiance forecasting. In Proceedings of the 2021 International Conference on Platform Technology and Service (PlatCon), Jeju, Republic of Korea, 23–25 August 2021; pp. 1–6. [Google Scholar]
  27. Wright, M.N.; Ziegler, A. Ranger: A Fast Implementation of Random Forests for High Dimensional Data in C++ and R. J. Stat. Softw. 2017, 77, 1–17. [Google Scholar] [CrossRef] [Green Version]
  28. Moon, J.; Park, S.; Hwang, E.; Rho, S. A Hybrid Tree-Based Ensemble Learning Model for Day-Ahead Peak Load Forecasting. In Proceedings of the 2022 15th International Conference on Human System Interaction (HSI), Melbourne, Australia, 28–31 July 2022; pp. 1–6. [Google Scholar]
  29. KMA, Dong-Nae Forecast (Digital Forecast), Korea Meteorological Administration. Available online: https://www.kma.go.kr/eng/weather/forecast/timeseries.jsp (accessed on 15 May 2023).
  30. Jung, S.; Moon, J.; Park, S.; Rho, S.; Baik, S.W.; Hwang, E. Bagging ensemble of multilayer perceptrons for missing electricity consumption data imputation. Sensors 2020, 20, 1772. [Google Scholar] [CrossRef] [PubMed] [Green Version]
  31. Kim, J.; Moon, J.; Hwang, E.; Kang, P. Recurrent inception convolution neural network for multi short-term load forecasting. Energy Build. 2019, 194, 328–341. [Google Scholar] [CrossRef]
  32. Moon, J.; Park, S.; Rho, S.; Hwang, E. A comparative analysis of artificial neural network architectures for building energy consumption forecasting. Int. J. Distrib. Sens. Netw. 2019, 15, 1550147719877616. [Google Scholar] [CrossRef] [Green Version]
  33. Moon, J.; Jung, S.; Rew, J.; Rho, S.; Hwang, E. Combination of short-term load forecasting models based on a stacking ensemble approach. Energy Build. 2020, 216, 109921. [Google Scholar] [CrossRef]
  34. Jang, J.; Jeong, W.; Kim, S.; Lee, B.; Lee, M.; Moon, J. RAID: Robust and Interpretable Daily Peak Load Forecasting via Multiple Deep Neural Networks and Shapley Values. Sustainability 2023, 15, 6951. [Google Scholar] [CrossRef]
  35. Lee, J.; Jeong, J.; Jung, S.; Moon, J.; Rho, S. Verification of De-Identification Techniques for Personal Information Using Tree-Based Methods with Shapley Values. J. Pers. Med. 2022, 12, 190. [Google Scholar] [CrossRef]
  36. Moon, J.; Rho, S.; Baik, S.W. Toward explainable electrical load forecasting of buildings: A comparative study of tree-based ensemble methods with Shapley values. Sustain. Energy Technol. Assess. 2022, 54, 102888. [Google Scholar] [CrossRef]
  37. Moon, J.; Park, S.; Rho, S.; Hwang, E. Robust building energy consumption forecasting using an online learning approach with R ranger. J. Build. Eng. 2022, 47, 103851. [Google Scholar] [CrossRef]
  38. Moon, J.; Kim, Y.; Rho, S. User Behavior Analytics with Machine Learning for Household Electricity Demand Forecasting. In Proceedings of the 2022 International Conference on Platform Technology and Service (PlatCon), Jeju, Republic of Korea, 22–24 August 2022; pp. 13–18. [Google Scholar]
  39. Bentéjac, C.; Csörgő, A.; Martínez-Muñoz, G. A comparative analysis of gradient boosting algorithms. Artif. Intell. Rev. 2021, 54, 1937–1967. [Google Scholar] [CrossRef]
  40. Chen, T.; Guestrin, C. XGBoost: A Scalable Tree Boosting System. In Proceedings of the 22nd ACM SIGKDD International Conference on Knowledge Discovery and Data Mining, San Francisco, CA, USA, 13–17 August 2016; pp. 785–794. [Google Scholar]
  41. Park, S.; Moon, J.; Jung, S.; Rho, S.; Baik, S.W.; Hwang, E. A two-stage industrial load forecasting scheme for day-ahead combined cooling, heating and power scheduling. Energies 2020, 13, 443. [Google Scholar] [CrossRef] [Green Version]
  42. Ke, G.; Meng, Q.; Finley, T.; Wang, T.; Chen, W.; Ma, W.; Ye, Q.; Liu, T.Y. LightGBM: A Highly Efficient Gradient Boosting Decision Tree. Adv. Neural Inf. Process. Syst. 2017, 30. [Google Scholar]
  43. Prokhorenkova, L.; Gusev, G.; Vorobev, A.; Dorogush, A.V.; Gulin, A. CatBoost: Unbiased boosting with categorical features. Adv. Neural Inf. Process. Syst. 2018, 31. [Google Scholar]
  44. Breiman, L. Random forests. Mach. Learn. 2001, 45, 5–32. [Google Scholar] [CrossRef] [Green Version]
  45. Moon, J.; Kim, K.H.; Kim, Y.; Hwang, E. A short-term electric load forecasting scheme using 2-stage predictive analytics. In Proceedings of the 2018 IEEE International Conference on Big Data and Smart Computing (BigComp), Shanghai, China, 15–17 January 2018; pp. 219–226. [Google Scholar]
  46. Oshiro, T.M.; Perez, P.S.; Baranauskas, J.A. How many trees in a random forest? In Proceedings of the Machine Learning and Data Mining in Pattern Recognition: 8th International Conference, MLDM 2012, Berlin, Germany, 13–20 July 2012; Proceedings 8. Springer: Berlin/Heidelberg, Germany, 2012; pp. 154–168. [Google Scholar]
  47. Son, M.; Moon, J.; Jung, S.; Hwang, E. A short-term load forecasting scheme based on auto-encoder and random forest. In Proceedings of the Applied Physics, System Science and Computers III: Proceedings of the 3rd International Conference on Applied Physics, System Science and Computers (APSAC2018), Dubrovnik, Croatia, 26–28 September 2018; Springer International Publishing: Cham, Switzerland, 2018; pp. 138–144. [Google Scholar]
  48. Moon, J.; Kim, J.; Kang, P.; Hwang, E. Solving the cold-start problem in short-term load forecasting using tree-based methods. Energies 2020, 13, 886. [Google Scholar] [CrossRef] [Green Version]
  49. Moon, J.; Park, S.; Rho, S.; Hwang, E. Interpretable short-term electrical load forecasting scheme using cubist. Comput. Intell. Neurosci. 2022, 2022, 6892995. [Google Scholar] [CrossRef] [PubMed]
  50. Moon, J.; Park, S.; Jung, S.; Hwang, E.; Rho, S. Training-Data Generation and Incremental Testing for Daily Peak Load Forecasting. In Advances in Artificial Intelligence and Applied Cognitive Computing: Proceedings from ICAI’20 and ACC’20; Springer International Publishing: Cham, Switzerland, 2021. [Google Scholar]
  51. Dorogush, A.V.; Ershov, V.; Gulin, A. CatBoost: Gradient boosting with categorical features support. arXiv 2018, arXiv:1810.11363. [Google Scholar]
  52. Kim, H.; Kim, H.; Cho, S.; Hwang, E. An end-to-end face parsing model using channel and spatial attentions. Measurement 2022, 191, 110807. [Google Scholar] [CrossRef]
  53. Kim, H.; Lee, J.H.; Lee, S. A Hybrid Image Segmentation Method for Accurate Measurement of Urban Environments. Electronics 2023, 12, 1845. [Google Scholar] [CrossRef]
  54. Gonzalez, C.A.G.; Wertz, O.; Absil, O.; Christiaens, V.; Defrère, D.; Mawet, D.; Milli, J.; Absil, P.-A.; Van Droogenbroeck, M.; Cantalloube, F.; et al. Vip: Vortex image processing package for high-contrast direct imaging. Astron. J. 2017, 154, 7. [Google Scholar] [CrossRef]
  55. Noi, P.T.; Degener, J.; Kappas, M. Comparison of multiple linear regression, cubist regression, and random forest algorithms to estimate daily air surface temperature from dynamic combinations of MODIS LST data. Remote Sens. 2017, 9, 398. [Google Scholar] [CrossRef] [Green Version]
  56. Caldwell, M.M. Solar UV irradiation and the growth and development of higher plants. Photophysiology 1971, 6, 131–177. [Google Scholar]
Figure 1. Example of Korea Meteorological Administration’s short-term weather forecasts [29].
Electronics 12 02607 g001
Figure 2. Overall architecture of HYTREM procedure.
Electronics 12 02607 g002
Figure 3. Ranger model with time-series cross-validation for solar irradiance prediction by hour.
Electronics 12 02607 g003
Figure 4. Variable importance heatmap of HYTREM for 12 p.m. (a) Ildo 1-dong. (b) Gosan-ri.
Electronics 12 02607 g004
Figure 5. Variable importance heatmap of HYTREM for 1 p.m. (a) Ildo 1-dong. (b) Gosan-ri.
Electronics 12 02607 g005
Figure 6. Variable importance heatmap of HYTREM for 2 p.m. (a) Ildo 1-dong. (b) Gosan-ri.
Electronics 12 02607 g006aElectronics 12 02607 g006b
Table 1. Overview of machine learning-based approaches in solar irradiance forecasting studies.
StudyYearMethodResult
Chaibi et al. [18]2021LightGBMEnhanced performance compared to other ML models
Ghimire et al. [19]2022Hybrid deep learning CNN-REGSTSuperior performance relative to other DL and conventional ML approaches
Ghimire et al. [20]2022Hybrid deep learning CSVR method combining CNN and SVREnhanced predictive performance compared to other DL and ML methods
Santos et al. [21]2022Ensemble-based dynamic selection methods with various base modelsImproved forecasting accuracy through the combination of multiple base model strengths and adaptive selection
Park et al. [22]2023Hybrid model combining LightGBM, wavelet transform, CEEMDAN, and MLPImproved SI forecasting accuracy
Moon et al. [23]2023RNN-based DL models, namely, LSTM, Bi-LSTM, and GRUSuperior multistep-ahead SI forecasting provided by attention mechanism-based Bi-LSTM and GRU models
Jung et al. [24]2019Attention mechanism-based LSTM network modelEffective short-term SI prediction for different regions in Jeju Island
Park et al. [25]2020LightGBMSuperior performance compared to other ensemble and DL models in multistep-ahead SI prediction
Moon et al. [26]2021DT, Bagging, RF, GBM, XGBoost, and CubistIdentified Cubist model as superior for day-ahead hourly SI prediction
This study (HYTREM)2023Hybrid tree-based ensemble learning modelAccurate and adaptable predictions of intermittent SI, suitable for interdisciplinary applications
Bi-LSTM, bidirectional long short-term memory; CEEMDAN, complete ensemble empirical mode decomposition with adaptive noise; CNN, convolutional neural network; CSVR, convolutional support vector regression; DL, deep learning; DT, decision tree; GBM, gradient boosting machine; GRU, gated recurrent unit; LSTM, long short-term memory; LightGBM, light gradient boosting machine; MLP, multilayer perceptron; ML, machine learning; REGST, stacked regression; RF, random forest; RNN, recurrent neural network; SI, solar irradiance; SVR, support vector regression; XGBoost: extreme gradient boosting.
Table 2. Comprehensive list of input variables (IVs) and features.
IV #Description (Variable Type)IV #Description (Variable Type)
DaysinDatex (continuous)W3Mostly cloudy (binary)
DaycosDatey (continuous)W4Cloudy (binary)
T88 a.m. (binary)TempTemperature (continuous)
T99 a.m. (binary)HumiHumidity (continuous)
T1010 a.m. (binary)Wind speedWind speed (continuous)
T1111 a.m. (binary)D1Day_sinDatex,D−1 (continuous)
T1212 p.m. (binary)D1Day_cosDatey,D−1 (continuous)
T131 p.m. (binary)D1W1ClearD−1 (binary)
T142 p.m. (binary)D1W2Partly cloudyD−1 (binary)
T153 p.m. (binary)D1W3Mostly cloudyD−1 (binary)
T164 p.m. (binary)D1W4CloudyD−1 (binary)
T175 p.m. (binary)D1TempTemperatureD−1 (continuous)
T186 p.m. (binary)D1HumiHumidityD−1 (continuous)
W1Clear (binary)D1Wind speedWind speedD−1 (continuous)
W2Partly cloudy (binary)D1SolarSolar irradianceD−1 (continuous)
Table 3. Statistical comparison between variables in one-dimensional (1D) and two-dimensional (2D) spaces.
StatisticsIldo 1-dongGosan-ri
1D Space2D Space1D Space2D Space
Multiple Correlation Coefficient0.0610.4240.0590.379
Coefficient of Determination0.0040.1800.0030.144
Adjusted Coefficient of Determination0.0040.1800.0030.144
Standard Error0.9950.9030.9550.885
Table 4. Pearson’s correlation coefficients (PCCs) and p-values between independent variables and solar irradiance for Ildo 1-ding.
IV #PCC and p-ValueIV #PCC and p-Value
Daysin0.079 ***Temp0.307 ***
Daycos−0.417 ***Humi−0.072 ***
T8−0.286 ***Wind speed−0.262 ***
T9−0.162 ***D1Day_sin0.087 ***
T10−0.023 ***D1Day_cos−0.414 ***
T110.102 ***D1W10.099 ***
T120.191 ***D1W20.021 ***
T130.224 ***D1W3−0.031 ***
T140.201 ***D1W4−0.072 ***
T150.126 ***D1Temp0.259 ***
T160.011 *D1Humi0.036 ***
T17−0.126 ***D1Wind speed−0.163 ***
T18−0.257 ***D1Solar0.628 ***
W10.249 ***XGBoost0.918 ***
W20.088 ***LightGBM0.936 ***
W3−0.022 ***CatBoost0.970 ***
W4−0.253 ***RF0.966 ***
*, p-value < 0.05; ***, p-value < 0.001.
Table 5. Pearson’s correlation coefficients (PCCs) and p-values between independent variables and solar irradiance for Gosan-ri.
IV #PCC and p-ValueIV #PCC and p-Value
Daysin0.068 ***Temp0.266 ***
Daycos−0.373 ***Humi0.049 ***
T8−0.284 ***Wind speed−0.284 ***
T9−0.159 ***D1Day_sin0.074 ***
T10−0.019 ***D1Day_cos−0.371 ***
T110.106 ***D1W10.083 ***
T120.187 ***D1W20.047 ***
T130.213 ***D1W3−0.008
T140.194 ***D1W4−0.099 ***
T150.124 ***D1Temp0.231 ***
T160.013 *D1Humi0.120 ***
T17−0.122 ***D1Wind speed−0.152 ***
T18−0.254 ***D1Solar0.649 ***
W10.223 ***XGBoost0.910 ***
W20.103 ***LightGBM0.930 ***
W3−0.008CatBoost0.968 ***
W4−0.261 ***RF0.965 ***
*, p-value < 0.05; ***, p-value < 0.001.
Table 6. Performance comparison of HYTREM and baseline models.
ModelIldo 1-dongGosan-ri
MAERMSENRMSEMAERMSENRMSE
Persistence0.5690.83266.130.4650.69866.86
Att-LSTM w/dropout [24]0.3810.52841.990.3830.52650.38
Att-LSTM w/o dropout [24]0.4150.56144.610.3800.52450.19
Att-Bi-LSTM [23]0.3590.52041.370.3390.49547.39
Att-GRU [23]0.3480.49239.090.3300.47245.21
Cubist [26]0.3780.53342.350.3800.52450.19
LightGBM [25]0.3800.51440.870.3470.48246.14
HYTREM0.1460.23621.310.1350.21724.15
Table 7. Performance comparison for Ildo 1-dong by case.
HourMAERMSENRMSE
Case OneCase TwoCase ThreeCase OneCase TwoCase ThreeCase OneCase TwoCase Three
10.1250.0510.0510.1820.0850.08958.1328.6528.53
20.2860.1130.1120.3680.1800.18550.7325.9125.50
30.4330.1480.1410.5280.2320.23144.8220.3219.60
40.5660.1820.1730.6710.2900.28741.9218.6117.91
50.6210.1970.1910.7430.3270.32739.3217.7317.29
60.6480.2170.2220.7750.3410.36538.6817.5218.20
70.6270.1980.1960.7520.3190.32739.2817.1717.08
80.5520.1800.1830.6650.2930.30440.0318.3118.29
90.4580.1540.1530.5600.2520.25443.4720.4519.72
100.3030.1080.1070.3880.1680.17145.7221.0220.20
110.1540.0630.0630.2200.1080.10954.0128.7226.69
Avg.0.4340.1460.1450.5320.2360.24145.1021.3120.82
Table 8. Performance comparison for Gosan-ri by case.
HourMAERMSENRMSE
Case OneCase TwoCase ThreeCase OneCase TwoCase ThreeCase OneCase TwoCase Three
10.1290.0500.0460.1880.0870.08076.9635.6034.72
20.2610.1020.0950.3360.1650.15157.1527.9826.95
30.3860.1470.1320.4940.2230.20850.3522.7922.07
40.4940.1740.1600.6190.2710.25246.2320.2319.51
50.5680.2120.2000.7140.3330.31545.1121.0320.78
60.6250.2130.2040.7830.3480.33347.2921.0020.99
70.6280.1890.1760.7860.2960.27749.7818.7718.30
80.5610.1870.1620.6980.2920.25550.6021.1719.42
90.4560.1680.1530.5780.2590.24053.5124.0223.51
100.3050.1170.1080.3990.1900.17756.6326.9226.77
110.1580.0640.0540.2270.1170.10266.6634.3732.65
Avg.0.4150.1480.1350.5290.2350.21754.5724.9024.15
Table 9. R-squared comparison between solar irradiance and the output of tree-based EL models.
ModelIldo 1-dongGosan-ri
TrainingTestingTrainingTesting
XGBoost0.8410.8490.8290.819
LightGBM0.8750.8800.8680.853
CatBoost0.9350.9400.9320.926
RF0.9400.9450.9370.932
Table 10. Performance comparison of HYTREM and baseline models for each metropolitan city.
ModelsSeoulBusanIncheon
MAERMSENRMSEMAERMSENRMSEMAERMSENRMSE
Att-LSTM [24]0.2740.36429.330.3200.56138.910.2560.34026.64
Att-Bi-LSTM [23]0.2700.36429.320.3030.54437.730.2750.36328.49
Att-GRU [23]0.2730.36129.080.3220.56038.890.2620.34326.93
HYTREM0.1290.19315.540.2360.55338.370.1360.20315.88
Disclaimer/Publisher’s Note: The statements, opinions and data contained in all publications are solely those of the individual author(s) and contributor(s) and not of MDPI and/or the editor(s). MDPI and/or the editor(s) disclaim responsibility for any injury to people or property resulting from any ideas, methods, instructions or products referred to in the content.